Embed Size (px)
Citation preview
Gan et al. BMC Neurosci (2015) 16:51 DOI 10.1186/s12868-015-0188-9
RESEARCH ARTICLE
A 72-hour high fat diet increases transcript levels of the neuropeptide galanin in the dorsal hippocampus of the ratLing Gan1,2†, Emily England3*†, Jeong‑Yeh Yang2, Natalie Toulme4, Suresh Ambati2, Diane L Hartzell2, Richard B Meagher5 and Clifton A Baile2^
Abstract
Background: Recent evidence identifies the hippocampus, a brain structure commonly associated with learning and memory, as key to the regulation of food intake and the development and consequences of obesity. Intake of a high fat diet (HFD) results in altered consumptive behavior, hippocampal damage, and cognitive deficits. While many stud‑ies report the effects of HFD after chronic consumption and in the instance of obesity, few examine the events that occur following acute HFD consumption. In this study, male rats were fed either a control diet (10% fat by kcal) or HFD (45% fat by kcal) for 72 h. At the end of the 72‑h period, serum and tissues were collected and weighed. Brains were rapidly frozen or formalin‑fixed in preparation for qRT‑PCR or immunohistochemistry, respectively.
Results: Acute intake of HFD resulted in higher serum levels of leptin and cholesterol, with no significant changes in final body weight or adipose tissue mass. In the dorsal hippocampus, transcription of the neuroprotective peptide galanin was significantly upregulated along with a trend for an increase in brain‑derived neurotrophic factor and histone deacetylase 2 in the rats fed HFD. In the ventral hippocampus, there was a significant increase in histone deacetylase 4 and a decrease in galanin receptor 1 in this group. Results from immunohistochemistry validate strong presence of the galanin peptide in the CA1/CA2 region of the dorsal hippocampus.
Conclusions: These results provide evidence for a distinct response in specific functional regions of the hippocam‑pus following acute HFD intake.
© 2015 Gan et al. This article is distributed under the terms of the Creative Commons Attribution 4.0 International License (http://creativecommons.org/licenses/by/4.0/), which permits unrestricted use, distribution, and reproduction in any medium, provided you give appropriate credit to the original author(s) and the source, provide a link to the Creative Commons license, and indicate if changes were made. The Creative Commons Public Domain Dedication waiver (http://creativecommons.org/publicdomain/zero/1.0/) applies to the data made available in this article, unless otherwise stated.
BackgroundOverweight and obesity are at epidemic levels in the United States and rates are rising in other countries that have adopted a more Western diet [1]. Consumption of diets rich in saturated fatty acids is commonplace in the United States and is pinpointed as a major factor in the development of obesity and resulting metabolic disease states [2]. Excess intake of saturated fat has also been implicated in the development of neurodegenerative dis-eases such as Alzheimer’s [3, 4].
It is well established that the hippocampus is a major brain region involved in memory, particularly episodic and spatial memory [5]. However, the hippocampus is a heterogeneous structure with multiple projections to other areas of the brain involved in emotional motiva-tion and feeding behaviors [6, 7]. A thorough review by Lathe highlighted the role of the hippocampus in moni-toring the physiological environment and modulating an appropriate response, a major component of which is sensing of the endocrine and metabolic state of the blood and cerebral spinal fluid [8]. In fact, the blood–brain bar-rier in the vicinity of the hippocampus is particularly vulnerable to the exterior environment. Two studies have shown a reduction in blood brain barrier integrity in the vicinity of the hippocampus following high fat diet (HFD) consumption [9, 10]. Dietary fat and cholesterol are able to cross the blood–brain barrier and promote
Open Access
*Correspondence: [email protected] †Ling Gan and Emily England contributed equally to this work ^ Deceased3 Neuroscience Division Biomedical and Health Sciences Institute, University of Georgia, Athens, GA, USAFull list of author information is available at the end of the article
Page 2 of 10Gan et al. BMC Neurosci (2015) 16:51
protein infiltration, a process that may contribute to the development of Alzheimer’s [9]. Behavioral effects can be observed rapidly after this HFD-induced insult. Impairments in hippocampal-specific spatial memory are observed after only 3–5 days on a high-energy diet (higher in saturated fat and glucose), with no effects of the diet on memory tasks that were not dependent on the hippocampus [11, 12]. This would suggest that the hip-pocampus responds more rapidly to dietary insult than other areas of the brain.
While many studies show the impact of chronic con-sumption of HFD on the molecular physiology of brain, few examine the acute response [13–16]. We investigated the effects of HFD consumption in a 72-h time window, which for humans might be the amount of time a typi-cally healthy individual spends eating high fat foods over a holiday or while on vacation. Three recent studies from the University of Washington showed that during the first 3 days of high fat feeding, hypothalamic inflamma-tion, reactive gliosis and astrocytosis were present in both rats and mice at this time point, and that similar gliosis occurred in obese human subjects [12, 16, 17]. Other experiments involving 72-h HFD consumption in rodent models have shown increased body weight, increased adi-pose tissue mass, and increases in markers of inflamma-tion and oxidative stress in the brain, liver, and adipose tissue [12, 18, 19]. Little is known about changes in hip-pocampal gene expression following acute HFD intake.
It is now widely accepted that changes in the physi-cal environment may be rapidly recorded in different regions of the brain by epigenetic mechanisms involv-ing changes in chromatin structure [20]. For example, acetylation of nucleosomal histones is sensitive to dietary change and correlates with altered gene expression in a very rapid timeframe [21, 22]. Consequently, we chose to examine the expression levels of several enzymes that alter chromatin structure, as well as trophic factors, hormone receptors, genes associated with obesity and inflammation, and the neuropeptide galanin. Galanin is a small, highly conserved neuropeptide that is expressed throughout the mammalian central and peripheral nerv-ous system [23, 24]. It is known to be involved in feed-ing, the regulation of metabolism, neuronal excitability, neuroprotection, cognition, and stress, to name a few [25, 26]. In feeding studies, galanin is shown to be orexi-genic, particularly stimulating the consumption of fat and intake of fat will alter levels of galanin mRNA in the hypothalamus [27]. Early changes in galanin expression in the hippocampus as well might help explain why ani-mals do not self-regulate when offered a high fat diet, and will continue to consume until reaching a state of obesity.
We hypothesized that the gene expression profile of rats fed a high fat diet for 72 h would be indicative of
hippocampal damage and a propensity towards obesity, meaning that we expected to see a downregulation of neurotrophic and neuroprotective factors, an upregula-tion of certain epigenetic enzymes, and a downregulation of insulin and leptin receptors in rats fed a high fat diet for 72 h. However, our results show a distinct response in specific functional poles of the hippocampus following acute HFD intake, with potential mediators of neuropro-tection at play in the dorsal hippocampus.
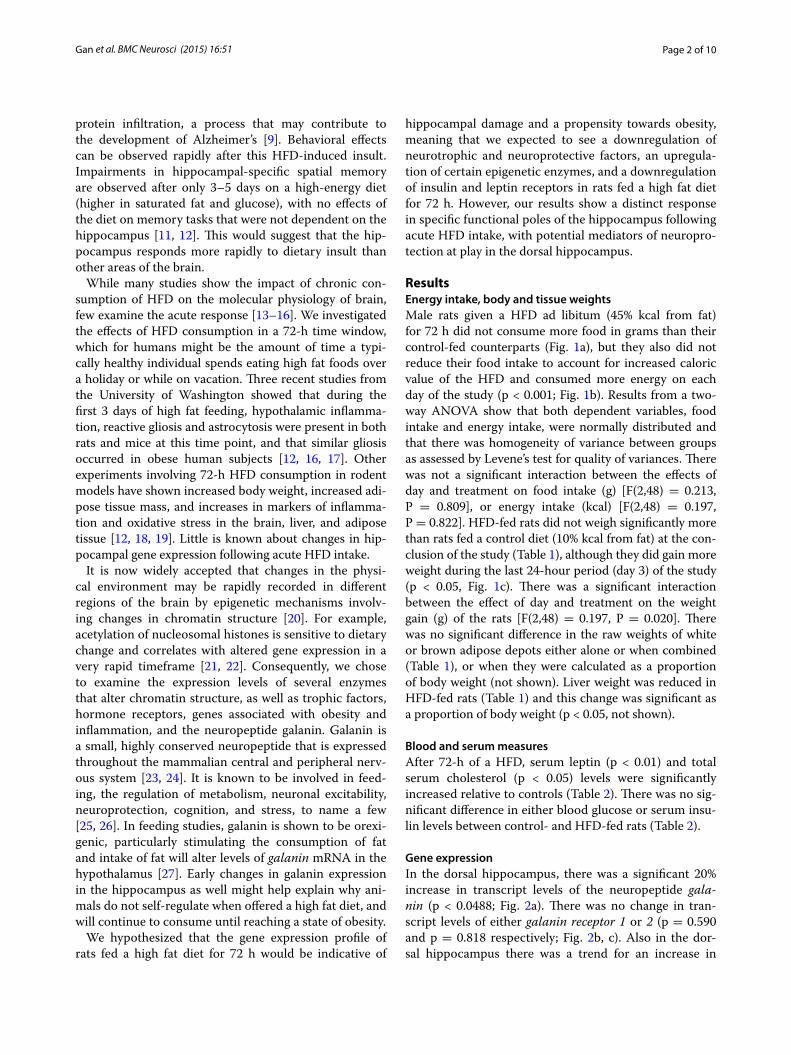
ResultsEnergy intake, body and tissue weightsMale rats given a HFD ad libitum (45% kcal from fat) for 72 h did not consume more food in grams than their control-fed counterparts (Fig. 1a), but they also did not reduce their food intake to account for increased caloric value of the HFD and consumed more energy on each day of the study (p < 0.001; Fig. 1b). Results from a two-way ANOVA show that both dependent variables, food intake and energy intake, were normally distributed and that there was homogeneity of variance between groups as assessed by Levene’s test for quality of variances. There was not a significant interaction between the effects of day and treatment on food intake (g) [F(2,48) = 0.213, P = 0.809], or energy intake (kcal) [F(2,48) = 0.197, P = 0.822]. HFD-fed rats did not weigh significantly more than rats fed a control diet (10% kcal from fat) at the con-clusion of the study (Table 1), although they did gain more weight during the last 24-hour period (day 3) of the study (p < 0.05, Fig. 1c). There was a significant interaction between the effect of day and treatment on the weight gain (g) of the rats [F(2,48) = 0.197, P = 0.020]. There was no significant difference in the raw weights of white or brown adipose depots either alone or when combined (Table 1), or when they were calculated as a proportion of body weight (not shown). Liver weight was reduced in HFD-fed rats (Table 1) and this change was significant as a proportion of body weight (p < 0.05, not shown).
Blood and serum measuresAfter 72-h of a HFD, serum leptin (p < 0.01) and total serum cholesterol (p < 0.05) levels were significantly increased relative to controls (Table 2). There was no sig-nificant difference in either blood glucose or serum insu-lin levels between control- and HFD-fed rats (Table 2).
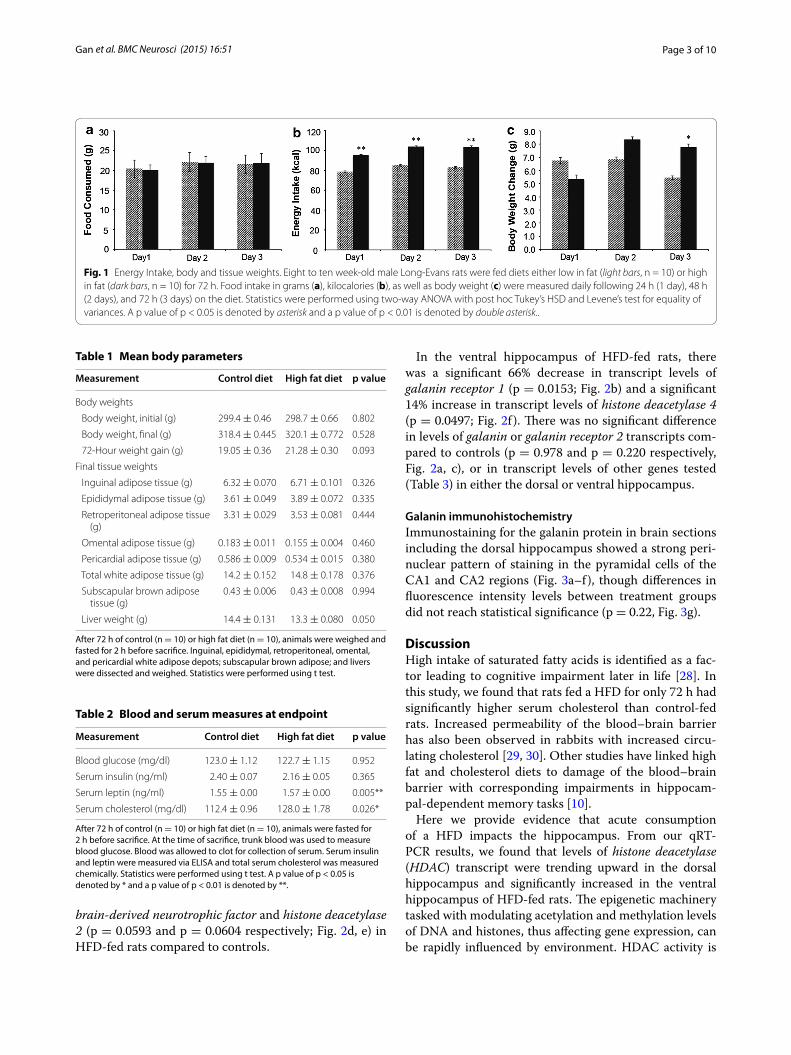
Gene expressionIn the dorsal hippocampus, there was a significant 20% increase in transcript levels of the neuropeptide gala-nin (p < 0.0488; Fig. 2a). There was no change in tran-script levels of either galanin receptor 1 or 2 (p = 0.590 and p = 0.818 respectively; Fig. 2b, c). Also in the dor-sal hippocampus there was a trend for an increase in
Page 3 of 10Gan et al. BMC Neurosci (2015) 16:51
brain-derived neurotrophic factor and histone deacetylase 2 (p = 0.0593 and p = 0.0604 respectively; Fig. 2d, e) in HFD-fed rats compared to controls.
In the ventral hippocampus of HFD-fed rats, there was a significant 66% decrease in transcript levels of galanin receptor 1 (p = 0.0153; Fig. 2b) and a significant 14% increase in transcript levels of histone deacetylase 4 (p = 0.0497; Fig. 2f ). There was no significant difference in levels of galanin or galanin receptor 2 transcripts com-pared to controls (p = 0.978 and p = 0.220 respectively, Fig. 2a, c), or in transcript levels of other genes tested (Table 3) in either the dorsal or ventral hippocampus.
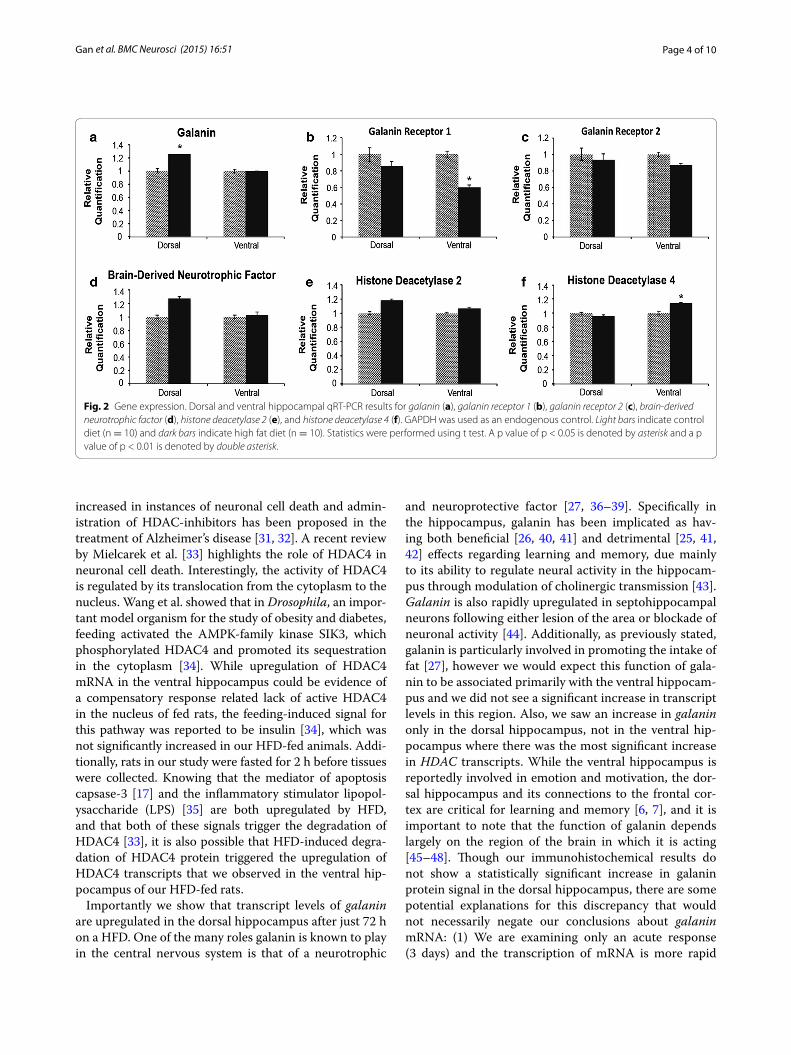
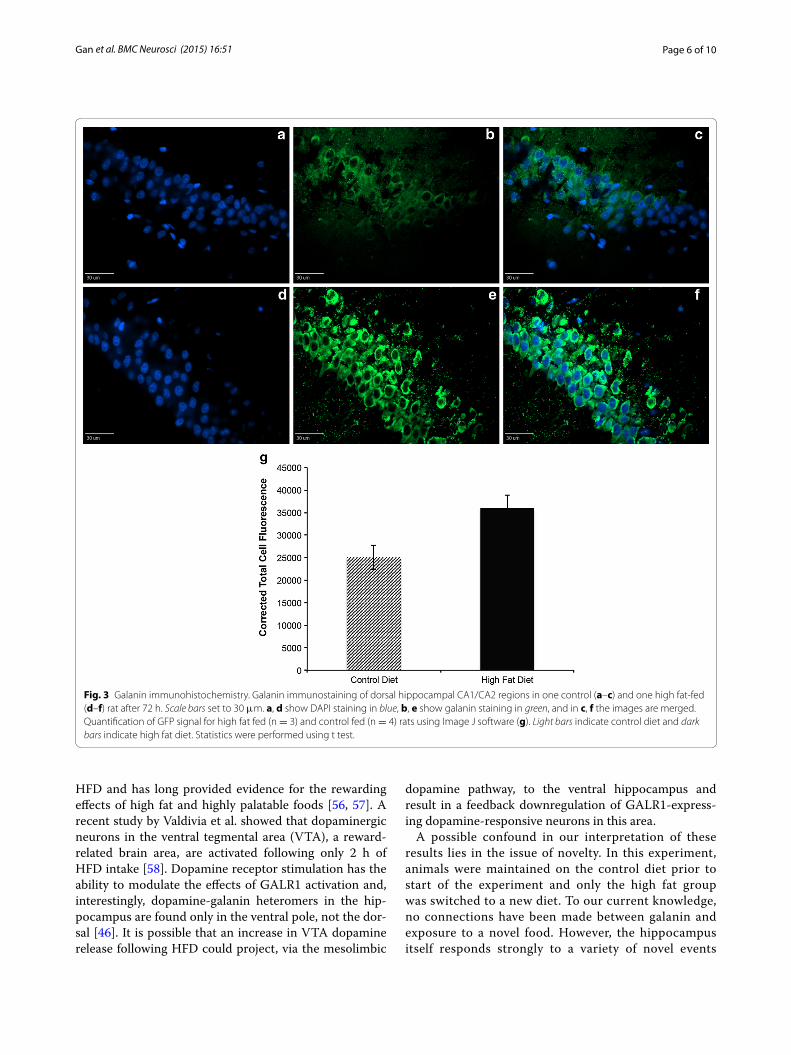
Galanin immunohistochemistryImmunostaining for the galanin protein in brain sections including the dorsal hippocampus showed a strong peri-nuclear pattern of staining in the pyramidal cells of the CA1 and CA2 regions (Fig. 3a–f), though differences in fluorescence intensity levels between treatment groups did not reach statistical significance (p = 0.22, Fig. 3g).
DiscussionHigh intake of saturated fatty acids is identified as a fac-tor leading to cognitive impairment later in life [28]. In this study, we found that rats fed a HFD for only 72 h had significantly higher serum cholesterol than control-fed rats. Increased permeability of the blood–brain barrier has also been observed in rabbits with increased circu-lating cholesterol [29, 30]. Other studies have linked high fat and cholesterol diets to damage of the blood–brain barrier with corresponding impairments in hippocam-pal-dependent memory tasks [10].
Here we provide evidence that acute consumption of a HFD impacts the hippocampus. From our qRT-PCR results, we found that levels of histone deacetylase (HDAC) transcript were trending upward in the dorsal hippocampus and significantly increased in the ventral hippocampus of HFD-fed rats. The epigenetic machinery tasked with modulating acetylation and methylation levels of DNA and histones, thus affecting gene expression, can be rapidly influenced by environment. HDAC activity is
Fig. 1 Energy Intake, body and tissue weights. Eight to ten week‑old male Long‑Evans rats were fed diets either low in fat (light bars, n = 10) or high in fat (dark bars, n = 10) for 72 h. Food intake in grams (a), kilocalories (b), as well as body weight (c) were measured daily following 24 h (1 day), 48 h (2 days), and 72 h (3 days) on the diet. Statistics were performed using two‑way ANOVA with post hoc Tukey’s HSD and Levene’s test for equality of variances. A p value of p < 0.05 is denoted by asterisk and a p value of p < 0.01 is denoted by double asterisk..
Table 1 Mean body parameters
After 72 h of control (n = 10) or high fat diet (n = 10), animals were weighed and fasted for 2 h before sacrifice. Inguinal, epididymal, retroperitoneal, omental, and pericardial white adipose depots; subscapular brown adipose; and livers were dissected and weighed. Statistics were performed using t test.
Measurement Control diet High fat diet p value
Body weights
Body weight, initial (g) 299.4 ± 0.46 298.7 ± 0.66 0.802
Body weight, final (g) 318.4 ± 0.445 320.1 ± 0.772 0.528
72‑Hour weight gain (g) 19.05 ± 0.36 21.28 ± 0.30 0.093
Final tissue weights
Inguinal adipose tissue (g) 6.32 ± 0.070 6.71 ± 0.101 0.326
Epididymal adipose tissue (g) 3.61 ± 0.049 3.89 ± 0.072 0.335
Retroperitoneal adipose tissue (g)
3.31 ± 0.029 3.53 ± 0.081 0.444
Omental adipose tissue (g) 0.183 ± 0.011 0.155 ± 0.004 0.460
Pericardial adipose tissue (g) 0.586 ± 0.009 0.534 ± 0.015 0.380
Total white adipose tissue (g) 14.2 ± 0.152 14.8 ± 0.178 0.376
Subscapular brown adipose tissue (g)
0.43 ± 0.006 0.43 ± 0.008 0.994
Liver weight (g) 14.4 ± 0.131 13.3 ± 0.080 0.050
Table 2 Blood and serum measures at endpoint
After 72 h of control (n = 10) or high fat diet (n = 10), animals were fasted for 2 h before sacrifice. At the time of sacrifice, trunk blood was used to measure blood glucose. Blood was allowed to clot for collection of serum. Serum insulin and leptin were measured via ELISA and total serum cholesterol was measured chemically. Statistics were performed using t test. A p value of p < 0.05 is denoted by * and a p value of p < 0.01 is denoted by **.
Measurement Control diet High fat diet p value
Blood glucose (mg/dl) 123.0 ± 1.12 122.7 ± 1.15 0.952
Serum insulin (ng/ml) 2.40 ± 0.07 2.16 ± 0.05 0.365
Serum leptin (ng/ml) 1.55 ± 0.00 1.57 ± 0.00 0.005**
Serum cholesterol (mg/dl) 112.4 ± 0.96 128.0 ± 1.78 0.026*
Page 4 of 10Gan et al. BMC Neurosci (2015) 16:51
increased in instances of neuronal cell death and admin-istration of HDAC-inhibitors has been proposed in the treatment of Alzheimer’s disease [31, 32]. A recent review by Mielcarek et al. [33] highlights the role of HDAC4 in neuronal cell death. Interestingly, the activity of HDAC4 is regulated by its translocation from the cytoplasm to the nucleus. Wang et al. showed that in Drosophila, an impor-tant model organism for the study of obesity and diabetes, feeding activated the AMPK-family kinase SIK3, which phosphorylated HDAC4 and promoted its sequestration in the cytoplasm [34]. While upregulation of HDAC4 mRNA in the ventral hippocampus could be evidence of a compensatory response related lack of active HDAC4 in the nucleus of fed rats, the feeding-induced signal for this pathway was reported to be insulin [34], which was not significantly increased in our HFD-fed animals. Addi-tionally, rats in our study were fasted for 2 h before tissues were collected. Knowing that the mediator of apoptosis capsase-3 [17] and the inflammatory stimulator lipopol-ysaccharide (LPS) [35] are both upregulated by HFD, and that both of these signals trigger the degradation of HDAC4 [33], it is also possible that HFD-induced degra-dation of HDAC4 protein triggered the upregulation of HDAC4 transcripts that we observed in the ventral hip-pocampus of our HFD-fed rats.
Importantly we show that transcript levels of galanin are upregulated in the dorsal hippocampus after just 72 h on a HFD. One of the many roles galanin is known to play in the central nervous system is that of a neurotrophic
and neuroprotective factor [27, 36–39]. Specifically in the hippocampus, galanin has been implicated as hav-ing both beneficial [26, 40, 41] and detrimental [25, 41, 42] effects regarding learning and memory, due mainly to its ability to regulate neural activity in the hippocam-pus through modulation of cholinergic transmission [43]. Galanin is also rapidly upregulated in septohippocampal neurons following either lesion of the area or blockade of neuronal activity [44]. Additionally, as previously stated, galanin is particularly involved in promoting the intake of fat [27], however we would expect this function of gala-nin to be associated primarily with the ventral hippocam-pus and we did not see a significant increase in transcript levels in this region. Also, we saw an increase in galanin only in the dorsal hippocampus, not in the ventral hip-pocampus where there was the most significant increase in HDAC transcripts. While the ventral hippocampus is reportedly involved in emotion and motivation, the dor-sal hippocampus and its connections to the frontal cor-tex are critical for learning and memory [6, 7], and it is important to note that the function of galanin depends largely on the region of the brain in which it is acting [45–48]. Though our immunohistochemical results do not show a statistically significant increase in galanin protein signal in the dorsal hippocampus, there are some potential explanations for this discrepancy that would not necessarily negate our conclusions about galanin mRNA: (1) We are examining only an acute response (3 days) and the transcription of mRNA is more rapid
Fig. 2 Gene expression. Dorsal and ventral hippocampal qRT‑PCR results for galanin (a), galanin receptor 1 (b), galanin receptor 2 (c), brain‑derived neurotrophic factor (d), histone deacetylase 2 (e), and histone deacetylase 4 (f). GAPDH was used as an endogenous control. Light bars indicate control diet (n = 10) and dark bars indicate high fat diet (n = 10). Statistics were performed using t test. A p value of p < 0.05 is denoted by asterisk and a p value of p < 0.01 is denoted by double asterisk.
Page 5 of 10Gan et al. BMC Neurosci (2015) 16:51
than the translation of protein, (2) Immunohistochem-istry is not as reliable a method for quantifying protein as other methods such as Western blot, therefore these results are most useful to display the location of galanin in the dorsal hippocampus, and (3) The small sample size (n = 5) of our immunohistochemistry experiment was likely not powerful enough to generate significant results. Regional- and cell type-specific studies, along with more extensive protein analysis, will be needed to further elu-cidate galanin’s actions in the brain in response to acute HFD.
In addition to the significant upregulation of galanin in the dorsal hippocampus, this study also demonstrated a trend for an increase in the transcript levels of brain-derived neurotrophic factor (BDNF) in the same region. BDNF is known to enhance hippocampal function by increasing neurogenesis and neurite growth, enhancing long-term potentiation and spatial memory, protecting
the hippocampus against excitotoxic injury, and for its involvement in neurodevelopment [26, 49, 50]. This find-ing is surprising considering the majority of the literature regarding BDNF and HFD points to a decrease in BDNF transcription following HFD, however in these experi-ments the animals consumed the HFD for 5 weeks or longer [50–52]. The upregulation of BDNF and galanin in the dorsal hippocampus suggests that the acute response to HFD is entirely different than the long-term response and requires further study.
Despite the increase in galanin transcript in the dor-sal hippocampus, our qRT-PCR results did not show changes in either galanin receptor 1 (GALR1) or gala-nin receptor 2 (GALR2) transcripts in this region. We did observe a decrease in the transcript levels of GALR1 in the ventral hippocampus. All three galanin recep-tor genes (1, 2, and 3) are expressed in both dorsal and ventral hippocampus [53, 54], with GALR1 having exceptionally high expression in the ventral hippocam-pus when compared to the dorsal hippocampus and the brain as a whole [46, 47]. Pharmacological studies point to GALR1 as playing a larger role in feeding than either GALR2 or GALR3 [54]. GALR3 has a lower affinity for galanin than GALR1 or GALR2 and is postulated to have a greater role in the periphery; therefore it was not chosen for analysis in this study [54, 55]. Evidence that galanin serves different functions in the dorsal versus ventral hippocampal regions is supported by our find-ings and leads us to believe that HFD differentially regu-lates the galanin pathway in these two regions [46, 48]. Galanin administration has completely opposite effects depending on the site of infusion, for example, decreas-ing basal acetylcholine release in the dorsal hippocampus and increasing release in the ventral hippocampus [48]. With GALR1 being reduced in the ventral hippocam-pus, we might expect that release of galanin here would be increased, causing a compensatory downregulation of the receptor. However, since we did not see a significant increase in galanin mRNA in the ventral hippocampus, meaning that this increased galanin is not coming from the ventral hippocampus itself, we hypothesize that there could be an increase in galanin peptide release into the ventral hippocampus coming from other areas of the brain, such as the locus coeruleus. The locus coeruleus is one of the major galanin-producing nuclei in the brain and sends direct galanergic projections to both the dor-sal and ventral the hippocampus. However, we cannot verify this hypothesis with the remaining brain tissue from our study and do not know of studies showing a direct connection between high fat diet and increased galanin release from these neurons. Additionally, dopa-mine, the neurotransmitter most associated with moti-vation and reward, is activated following consumption of
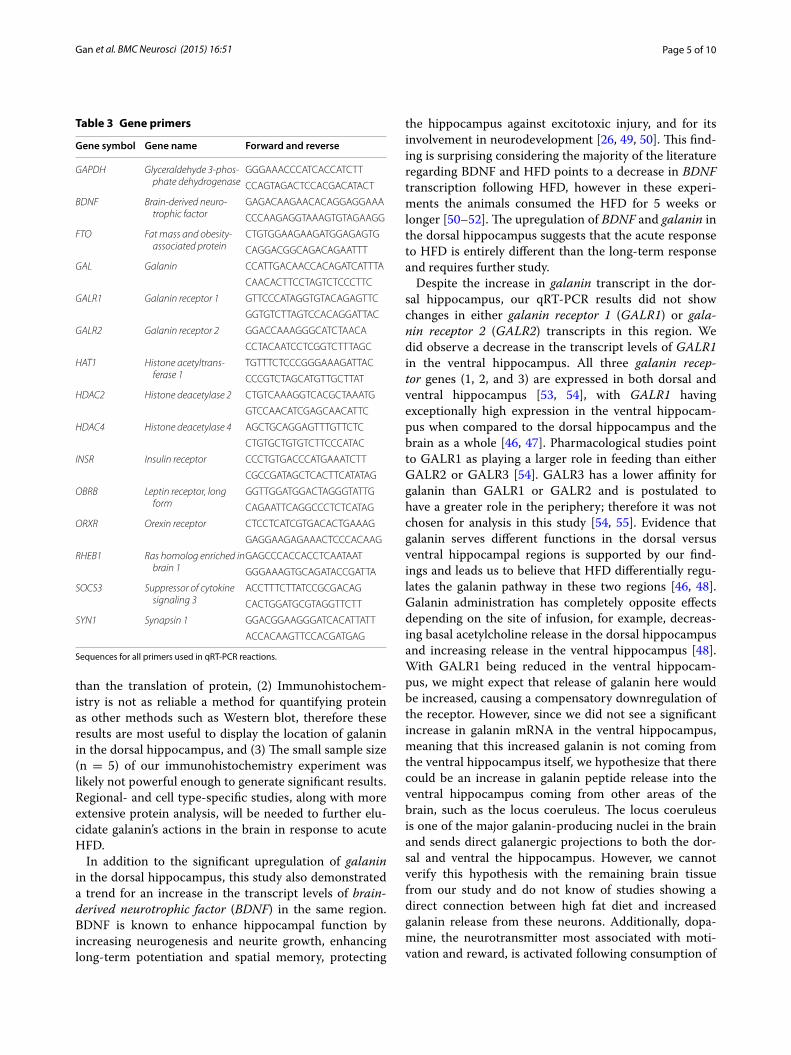
Table 3 Gene primers
Sequences for all primers used in qRT-PCR reactions.
Gene symbol Gene name Forward and reverse
GAPDH Glyceraldehyde 3‑phos-phate dehydrogenase
GGGAAACCCATCACCATCTT
CCAGTAGACTCCACGACATACT
BDNF Brain‑derived neuro-trophic factor
GAGACAAGAACACAGGAGGAAA
CCCAAGAGGTAAAGTGTAGAAGG
FTO Fat mass and obesity‑associated protein
CTGTGGAAGAAGATGGAGAGTG
CAGGACGGCAGACAGAATTT
GAL Galanin CCATTGACAACCACAGATCATTTA
CAACACTTCCTAGTCTCCCTTC
GALR1 Galanin receptor 1 GTTCCCATAGGTGTACAGAGTTC
GGTGTCTTAGTCCACAGGATTAC
GALR2 Galanin receptor 2 GGACCAAAGGGCATCTAACA
CCTACAATCCTCGGTCTTTAGC
HAT1 Histone acetyltrans-ferase 1
TGTTTCTCCCGGGAAAGATTAC
CCCGTCTAGCATGTTGCTTAT
HDAC2 Histone deacetylase 2 CTGTCAAAGGTCACGCTAAATG
GTCCAACATCGAGCAACATTC
HDAC4 Histone deacetylase 4 AGCTGCAGGAGTTTGTTCTC
CTGTGCTGTGTCTTCCCATAC
INSR Insulin receptor CCCTGTGACCCATGAAATCTT
CGCCGATAGCTCACTTCATATAG
OBRB Leptin receptor, long form
GGTTGGATGGACTAGGGTATTG
CAGAATTCAGGCCCTCTCATAG
ORXR Orexin receptor CTCCTCATCGTGACACTGAAAG
GAGGAAGAGAAACTCCCACAAG
RHEB1 Ras homolog enriched in brain 1
GAGCCCACCACCTCAATAAT
GGGAAAGTGCAGATACCGATTA
SOCS3 Suppressor of cytokine signaling 3
ACCTTTCTTATCCGCGACAG
CACTGGATGCGTAGGTTCTT
SYN1 Synapsin 1 GGACGGAAGGGATCACATTATT
ACCACAAGTTCCACGATGAG
Page 6 of 10Gan et al. BMC Neurosci (2015) 16:51
HFD and has long provided evidence for the rewarding effects of high fat and highly palatable foods [56, 57]. A recent study by Valdivia et al. showed that dopaminergic neurons in the ventral tegmental area (VTA), a reward-related brain area, are activated following only 2 h of HFD intake [58]. Dopamine receptor stimulation has the ability to modulate the effects of GALR1 activation and, interestingly, dopamine-galanin heteromers in the hip-pocampus are found only in the ventral pole, not the dor-sal [46]. It is possible that an increase in VTA dopamine release following HFD could project, via the mesolimbic
dopamine pathway, to the ventral hippocampus and result in a feedback downregulation of GALR1-express-ing dopamine-responsive neurons in this area.
A possible confound in our interpretation of these results lies in the issue of novelty. In this experiment, animals were maintained on the control diet prior to start of the experiment and only the high fat group was switched to a new diet. To our current knowledge, no connections have been made between galanin and exposure to a novel food. However, the hippocampus itself responds strongly to a variety of novel events
Fig. 3 Galanin immunohistochemistry. Galanin immunostaining of dorsal hippocampal CA1/CA2 regions in one control (a–c) and one high fat‑fed (d–f) rat after 72 h. Scale bars set to 30 μm. a, d show DAPI staining in blue, b, e show galanin staining in green, and in c, f the images are merged. Quantification of GFP signal for high fat fed (n = 3) and control fed (n = 4) rats using Image J software (g). Light bars indicate control diet and dark bars indicate high fat diet. Statistics were performed using t test.
Page 7 of 10Gan et al. BMC Neurosci (2015) 16:51
[59]. Learning and memory are critical components of feeding: an encounter with a food item prompts an animal to determine if he’s ever encountered it before, and to remember the experience with the food item in case he is to encounter it again in the future [60]. Due to its classical role in learning and memory, the hip-pocampus cannot be separated from these processes. Importantly though, the issue of novelty also cannot be separated from the human experience with exposure to a highly palatable food. In cases of short-term high fat feeding in humans, such as in instances of vacation or holidays, exposure to and consumption of novel foods is likely a major contributor to caloric intake, and likely causes activation of similar brain pathways as does our model.
In this study we showed that rats fed a HFD for 72 h had significantly higher serum leptin than rats fed a con-trol diet. Importantly, this change was independent of a significant increase in fat mass. Many studies highlight a neuroprotective role for leptin in the central nervous system. Leptin reduces neuronal apoptosis, increases cell survival and proliferation, and reduces damage caused by stroke; specifically in the hippocampus, leptin facilitates plasticity [61, 62]. A few studies have shown evidence of leptin receptors on both galanin- and BDNF-expressing neurons in the brain, particularly the hypothalamus, and that leptin indirectly mediates both galanin and BDNF release [63–65]. It is possible that in this 72-hour HFD model, the upregulation of galanin and BDNF are being mediated through the observed increased circulating leptin, but further studies are needed to determine the presence of this molecular interaction in hippocam-pal neurons. Chronic HFD consumption results in cen-tral and peripheral leptin resistance, thereby preventing the neuroprotective role of leptin in obesity and poten-tially contributing to the downregulation of BDNF after chronic HFD consumption, as mentioned earlier.
Our observance of a reduction in liver weight after 72 h of high fat diet is surprising, however previous studies by Miller et al. and Ren et al. shed light on a possible mech-anism. In those experiments, 72 h of high fat feeding in rodents down-regulated hepatic lipogenesis, possibly due to an inhibitory effect of the dietary fat on certain hepatic enzymes [19, 66]. Additionally, compared to the HFD group, the control animals consumed a greater propor-tion of their calories as carbohydrate, which is likely to have caused increased glycogen storage in control livers [67] compared to livers of HFD animals, another pos-sible explanation for the differences in final liver weight between the groups. It is well known that chronic high fat diet promotes lipid accumulation in the liver, leading eventually to hepatic steatosis and non-alcoholic fatty liver disease, but our current findings along with the
previous studies shed light on the important differences between acute and chronic exposure models.
ConclusionIn conclusion, this study demonstrates a unique acute response to HFD consumption in the hippocampus of the rat. Prior to significant increases in fat mass or body weight, gene expression in the hippocampus is altered in a way that reflects a distinct response in specific func-tional poles of the hippocampus following acute HFD intake, with potential mediators of neuroprotection at play in the dorsal hippocampus. Future studies should examine structural changes in the hippocampus at this time point to determine the level of HFD-induced insult after 72 h as well as examine the response of females to acute HFD, as there is evidence for sex differences in this model [19].
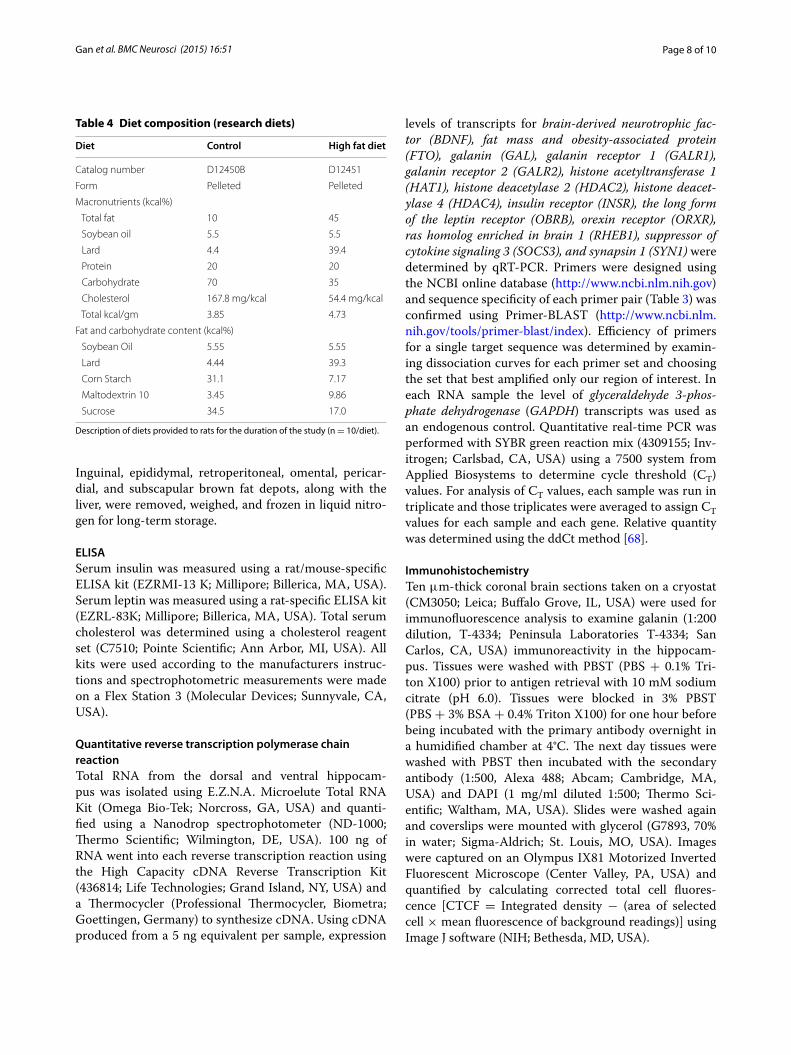
MethodsAnimals and feedingTwenty male, 8–10 week-old Long-Evans rats (200–250 g) were purchased from Harlan (Indianapolis, IN, USA). Upon arrival rats were housed individually and adapted to the rodent facility and to a low-fat control diet (Control, Table 4, D12450B; Research Diets; New Brunswick, NJ, USA) for 11–16 days. Rats were weight-matched and either maintained on the control diet (n = 10) or switched to a high-fat diet (HFD; n = 10; Table 4, D12451; Research Diets; New Brunswick, NJ, USA). Rats had access to the diets and water ad libi-tum throughout the experiment. Food intake and body weight were monitored daily. Rooms were temperature (22 ± 2°C) and humidity controlled and kept on a 12:12-h light/dark cycle. All institutional and national guidelines for the care and use of laboratory animals were followed. All protocols for this experiment were approved by the University of Georgia Institutional Animal Care and Use Committee (AUP #A2013 09-005-Y1-A0) prior to the start of this experiment.
Tissue collectionAfter 72 h of dietary treatment, rats were fasted for 2 h then anesthetized with inhaled isoflurane anesthesia (2.5%) and euthanized by decapitation. Trunk blood was collected immediately for measurement of glucose (Free-Style® Lite Blood Glucose Monitoring System; Abbot Diabetes Care, Abbot Park, IL, USA) and then allowed to clot for 30 min before serum was collected for fur-ther analysis. The brain was removed from the skull and weighed. The left hemisphere was rapidly frozen on dry ice for RNA isolation and the right hemisphere was fixed in 4% formaldehyde (Avantor; Center Valley, PA, USA) for 28 h and flash frozen for immunohistochemistry.
Page 8 of 10Gan et al. BMC Neurosci (2015) 16:51
Inguinal, epididymal, retroperitoneal, omental, pericar-dial, and subscapular brown fat depots, along with the liver, were removed, weighed, and frozen in liquid nitro-gen for long-term storage.
ELISASerum insulin was measured using a rat/mouse-specific ELISA kit (EZRMI-13 K; Millipore; Billerica, MA, USA). Serum leptin was measured using a rat-specific ELISA kit (EZRL-83K; Millipore; Billerica, MA, USA). Total serum cholesterol was determined using a cholesterol reagent set (C7510; Pointe Scientific; Ann Arbor, MI, USA). All kits were used according to the manufacturers instruc-tions and spectrophotometric measurements were made on a Flex Station 3 (Molecular Devices; Sunnyvale, CA, USA).
Quantitative reverse transcription polymerase chain reactionTotal RNA from the dorsal and ventral hippocam-pus was isolated using E.Z.N.A. Microelute Total RNA Kit (Omega Bio-Tek; Norcross, GA, USA) and quanti-fied using a Nanodrop spectrophotometer (ND-1000; Thermo Scientific; Wilmington, DE, USA). 100 ng of RNA went into each reverse transcription reaction using the High Capacity cDNA Reverse Transcription Kit (436814; Life Technologies; Grand Island, NY, USA) and a Thermocycler (Professional Thermocycler, Biometra; Goettingen, Germany) to synthesize cDNA. Using cDNA produced from a 5 ng equivalent per sample, expression
levels of transcripts for brain-derived neurotrophic fac-tor (BDNF), fat mass and obesity-associated protein (FTO), galanin (GAL), galanin receptor 1 (GALR1), galanin receptor 2 (GALR2), histone acetyltransferase 1 (HAT1), histone deacetylase 2 (HDAC2), histone deacet-ylase 4 (HDAC4), insulin receptor (INSR), the long form of the leptin receptor (OBRB), orexin receptor (ORXR), ras homolog enriched in brain 1 (RHEB1), suppressor of cytokine signaling 3 (SOCS3), and synapsin 1 (SYN1) were determined by qRT-PCR. Primers were designed using the NCBI online database (http://www.ncbi.nlm.nih.gov) and sequence specificity of each primer pair (Table 3) was confirmed using Primer-BLAST (http://www.ncbi.nlm.nih.gov/tools/primer-blast/index). Efficiency of primers for a single target sequence was determined by examin-ing dissociation curves for each primer set and choosing the set that best amplified only our region of interest. In each RNA sample the level of glyceraldehyde 3-phos-phate dehydrogenase (GAPDH) transcripts was used as an endogenous control. Quantitative real-time PCR was performed with SYBR green reaction mix (4309155; Inv-itrogen; Carlsbad, CA, USA) using a 7500 system from Applied Biosystems to determine cycle threshold (CT) values. For analysis of CT values, each sample was run in triplicate and those triplicates were averaged to assign CT values for each sample and each gene. Relative quantity was determined using the ddCt method [68].
ImmunohistochemistryTen μm-thick coronal brain sections taken on a cryostat (CM3050; Leica; Buffalo Grove, IL, USA) were used for immunofluorescence analysis to examine galanin (1:200 dilution, T-4334; Peninsula Laboratories T-4334; San Carlos, CA, USA) immunoreactivity in the hippocam-pus. Tissues were washed with PBST (PBS + 0.1% Tri-ton X100) prior to antigen retrieval with 10 mM sodium citrate (pH 6.0). Tissues were blocked in 3% PBST (PBS + 3% BSA + 0.4% Triton X100) for one hour before being incubated with the primary antibody overnight in a humidified chamber at 4°C. The next day tissues were washed with PBST then incubated with the secondary antibody (1:500, Alexa 488; Abcam; Cambridge, MA, USA) and DAPI (1 mg/ml diluted 1:500; Thermo Sci-entific; Waltham, MA, USA). Slides were washed again and coverslips were mounted with glycerol (G7893, 70% in water; Sigma-Aldrich; St. Louis, MO, USA). Images were captured on an Olympus IX81 Motorized Inverted Fluorescent Microscope (Center Valley, PA, USA) and quantified by calculating corrected total cell fluores-cence [CTCF = Integrated density − (area of selected cell × mean fluorescence of background readings)] using Image J software (NIH; Bethesda, MD, USA).
Table 4 Diet composition (research diets)
Description of diets provided to rats for the duration of the study (n = 10/diet).
Diet Control High fat diet
Catalog number D12450B D12451
Form Pelleted Pelleted
Macronutrients (kcal%)
Total fat 10 45
Soybean oil 5.5 5.5
Lard 4.4 39.4
Protein 20 20
Carbohydrate 70 35
Cholesterol 167.8 mg/kcal 54.4 mg/kcal
Total kcal/gm 3.85 4.73
Fat and carbohydrate content (kcal%)
Soybean Oil 5.55 5.55
Lard 4.44 39.3
Corn Starch 31.1 7.17
Maltodextrin 10 3.45 9.86
Sucrose 34.5 17.0
Page 9 of 10Gan et al. BMC Neurosci (2015) 16:51
Statistical analysisThe data are presented as the mean ± standard error of the mean (SEM) for all measurements. A t test (inde-pendent, by groups) was used to compare values between the Control and the HFD groups using Statistica software 7.1 (StatSoft; Tulsa, OK, USA). For food intake, energy intake, and weight gain over 3 days, a two-way ANOVA was used to examine the effects of day and treatment, with variance between groups assessed by Levene’s test for quality of variances and post hoc Tukey’s HSD test using SPSS Statistics 20 (IBM; New York City, NY, USA). A value of p < 0.05 is denoted with * while a value of p < 0.01 is denoted with **.
EndnotePlease note that Dr. Clifton A. Baile died on May 19, 2014, close to the completion of this work.
Authors’ contributionsLG participated in the tissue collection, molecular analysis and aided in the drafting of the manuscript; EE conceived and designed the study, performed the animal care, participated in the tissue collection and molecular analysis, and wrote the manuscript; JYY participated in the tissue collection and molec‑ular analysis; NT participated in the molecular analysis; SA participated in the tissue collection and molecular analysis; DLH participated in the design of the study and tissue collection; RBM helped to design the molecular analysis and helped in the drafting of the manuscript; CAB participated in the conception and design of the study. All authors read and approved the final manuscript.
Author details1 Veterinary Medicine Department, Rongchang Campus, Southwest University, Rongchang, Chongqing, People’s Republic of China. 2 Animal and Dairy Science, University of Georgia, Athens, GA, USA. 3 Neuroscience Division Biomedical and Health Sciences Institute, University of Georgia, Athens, GA, USA. 4 College of Veterinary Medicine, University of Georgia, Athens, GA, USA. 5 Department of Genetics, University of Georgia, Athens, GA, USA.
AcknowledgementsAuthors’ funding sources
LG: The National Natural Science Foundation of China (31201807) and Fundamental Research Funds for the Central Universities of China (No.XDJK2011C036) and Doctoral Fund of Southwest University of China (No. 2013Bsr05) supported LG during her stay at the University of Georgia and involvement in the study.
EE: The Department of Animal and Dairy Science at the University of Geor‑gia supported EE during her involvement in the study.
JYY: The Department of Animal and Dairy Science at the University of Georgia supported JYY during her involvement in the study.
NT: The Georgia Veterinary Scholars Program supported NT during her time involvement in the study.
SA: The Department of Animal and Dairy Science at the University of Geor‑gia supported SA during his involvement in the study.
DLH: The Department of Animal and Dairy Science and the UGA Obesity Initiative at the University of Georgia supported DLH during her involvement in the study.
RBM: Assistance from RBM was provided by The National Institutes of Health NIDDK Grant DK096300.
CAB: The Georgia Research Alliance Eminent Scholar Endowment (CAB) supplied funding for animals, diet, and all other materials used in this study and it’s analysis.
A special thanks to Dr. Gaylen Edwards of the Department of Physiology and Pharmacology at the University of Georgia for his input into the interpre‑tation of the data and the drafting of the manuscript.
Compliance with ethical guidelines
Competing interestsThe authors declare that they have no competing interests.
Received: 26 February 2015 Accepted: 28 July 2015
References 1. Ogden CL, Carroll MD, Kit BK, Flegal KM (2014) Prevalence of childhood
and adult obesity in the United States, 2011–2012. JAMA J Am Med Assoc 311(8):806–814
2. Bray GA, Popkin BM (1998) Dietary fat intake does affect obesity! Am J Clin Nutr 68:1157–1173
3. Pasinetti GM, Eberstein JA (2008) Metabolic syndrome and the role of dietary lifestyles in Alzheimer’s disease. J Neurochem 106(4):1503–1514
4. Grant WB, Campbell A, Itzhaki RF, Savory J (2002) The significance of environmental factors in the etiology of Alzheimer’s disease. J Alzheimer’s Dis JAD 4:179–189
5. Squire LR (2004) Memory systems of the brain: a brief history and current perspective. Neurobiol Learn Mem 82(3):171–177
6. Berthoud H (2002) Multiple neural systems controlling food intake & body weight. Neurosci Biobehav R 26:36
7. Fanselow MS, Dong HW (2010) Are the dorsal and ventral hippocampus functionally distinct structures? Neuron 65(1):7–19
8. Lathe R (2001) Hormones and the hippocampus. J Endocrinol 169:27 9. Freeman LR, Granholm AC (2012) Vascular changes in rat hippocampus
following a high saturated fat and cholesterol diet. J Cereb Blood Flow Metab Off J Int Soc Cerebr Blood Flow Metab 32(4):643–653
10. Kanoski SE, Zhang Y, Zheng W, Davidson TL (2010) The effects of a high‑energy diet on hippocampal function and blood‑brain barrier integrity in the rat. J Alzheimer’s Dis JAD 21(1):207–219
11. Kanoski SE, Davidson TL (2010) Different patterns of memory impair‑ments accompany short‑ and longer‑term maintenance on a high‑energy diet. J Exp Psychol Anim Behav Process 36(2):313–319
12. Beilharz JE, Maniam J, Morris MJ (2014) Short exposure to a diet rich in both fat and sugar or sugar alone impairs place, but not object recogni‑tion memory in rats. Brain Behav Immun 37:134–141
13. Winocur G, Greenwood CE (2005) Studies of the effects of high fat diets on cognitive function in a rat model. Neurobiol Aging 26(Suppl 1):46–49
14. Boitard C, Cavaroc A, Sauvant J, Aubert A, Castanon N, Laye S et al (2014) Impairment of hippocampal‑dependent memory induced by juvenile high‑fat diet intake is associated with enhanced hippocampal inflamma‑tion in rats. Brain Behav Immun 40:9–17
15. Sobesky JL, Barrientos RM, De May HS, Thompson BM, Weber MD, Watkins LR et al (2014) High‑fat diet consumption disrupts memory and primes elevations in hippocampal IL‑1beta, an effect that can be prevented with dietary reversal or IL‑1 receptor antagonism. Brain Behav Immun 42:22–32
16. Thaler JP, Yi CX, Schur EA, Guyenet SJ, Hwang BH, Dietrich MO et al (2012) Obesity is associated with hypothalamic injury in rodents and humans. J Clin Investig 122(1):153–162
17. Guyenet SJ, Nguyen HT, Hwang BH, Schwartz MW, Baskin DG, Thaler JP (2013) High‑fat diet feeding causes rapid, non‑apoptotic cleavage of caspase‑3 in astrocytes. Brain Res 1512:97–105
18. Lee YS, Li P, Huh JY, Hwang IJ, Lu M, Kim JI et al (2011) Inflammation is necessary for long‑term but not short‑term high‑fat diet‑induced insulin resistance. Diabetes 60:2474–2483
19. Miller CN, Morton HP, Cooney PT, Winters TG, Ramseur KR, Rayalam S et al (2014) Acute exposure to high‑fat diets increases hepatic expression of genes related to cell repair and remodeling in female rats. Nutr Res 34(1):85–93
20. Zovkic IB, Guzman‑Karlsson MC, Sweatt JD (2013) Epigenetic regulation of memory formation and maintenance. Learn Mem 20(2):61–74
21. Funato H, Oda S, Yokofujita J, Igarashi H, Kuroda M (2011) Fasting and high‑fat diet alter histone deacetylase expression in the medial hypo‑thalamus. PLoS One 6(4):e18950
22. Elsner VR, Lovatel GA, Bertoldi K, Vanzella C, Santos FM, Spindler C et al (2011) Effect of different exercise protocols on histone acetyltransferases
Page 10 of 10Gan et al. BMC Neurosci (2015) 16:51
and histone deacetylases activities in rat hippocampus. Neuroscience 192:580–587
23. Bedecs K, Berthoud M, Bartfai T (1995) Galanin‑10 years with a neuroen‑docrine peptide. Int J Biochem Cell Biol 27:337–349
24. Mitsukawa K, Lu X, Bartfai T (2008) Galanin, galanin receptors and drug targets. Cell Mol Life Sci CMLS 65(12):1796–1805
25. Kinney JW, Sanchez‑Alavez M, Barr AM, Criado JR, Crawley JN, Behrens MM et al (2009) Impairment of memory consolidation by galanin cor‑relates with in vivo inhibition of both LTP and CREB phosphorylation. Neurobiol Learn Mem 92(3):429–438
26. Murray PS, Holmes PV (2011) An overview of brain‑derived neurotrophic factor and implications for excitotoxic vulnerability in the hippocampus. Int J Pept 2011:654085
27. Beck B, Pourie G (2013) Ghrelin, neuropeptide Y, and other feeding‑regu‑latory peptides active in the hippocampus: role in learning and memory. Nutr Rev 71(8):541–561
28. Eskelinen MH, Ngandu T, Helkala EL, Tuomilehto J, Nissinen A, Soininen H et al (2008) Fat intake at midlife and cognitive impairment later in life: a population‑based CAIDE study. Int J Geriatr Psychiatry 23(7):741–747
29. Sparks DL, Kuo YM, Roher A, Martin T, Lukas RJ (2000) Alterations of Alzheimer’s disease in the cholesterol‑fed rabbit, including vascular inflammation. Ann NY Acad Sci 903:335–344
30. Ghribi O, Golovko MY, Larsen B, Schrag M, Murphy EJ (2006) Deposition of iron and beta‑amyloid plaques is associated with cortical cellular damage in rabbits fed with long‑term cholesterol‑enriched diets. J Neurochem 99(2):438–449
31. Guan JS, Haggarty SJ, Giacometti E, Dannenberg JH, Joseph N, Gao J et al (2009) HDAC2 negatively regulates memory formation and synaptic plasticity. Nature 459(7243):55–60
32. Graff J, Rei D, Guan JS, Wang WY, Seo J, Hennig KM et al (2012) An epige‑netic blockade of cognitive functions in the neurodegenerating brain. Nature 483(7388):222–226
33. Mielcarek M, Zielonka D, Carnemolla A, Marcinkowski JT, Guidez F (2015) HDAC4 as a potential therapeutic target in neurodegenerative diseases‑ a summary of recent achievements. Front Cell Neurosci 9:00042
34. Wang B, Moya N, Niessen S, Hoover H, Mihaylova MM, Shaw RJ et al (2011) A hormone‑dependent module regulating energy balance. Cell 145:596–606
35. Bray GA, Lovejoy JC, Smith SR, DeLany JP, Lefevre M, Hwang D et al (2002) The influence of differents fats and fatty acids on obesity, insulin resist‑ance and inflammation. J Nutr 132:2488–2491
36. Hobson SA, Bacon A, Elliot‑Hunt CR, Holmes FE, Kerr NC, Pope R et al (2008) Galanin acts as a trophic factor to the central and peripheral nerv‑ous systems. Cell Mol Life Sci CMLS 65(12):1806–1812
37. Lang R, Kofler B (2011) The galanin peptide family in inflammation. Neu‑ropeptides 45(1):1–8
38. Sciolino NR, Dishman RK, Holmes PV (2012) Voluntary exercise offers anxiolytic potential and amplifies galanin gene expression in the locus coeruleus of the rat. Behav Brain Res 233(1):191–200
39. Sciolino NR, Holmes PV (2012) Exercise offers anxiolytic potential: a role for stress and brain noradrenergic‑galaninergic mechanisms. Neurosci Biobehav Rev 36(9):1965–1984
40. Ogren SO, Kuteeva E, Elvander‑Tottie E, Hokfelt T (2010) Neuropeptides in learning and memory processes with focus on galanin. Eur J Pharmacol 626(1):9–17
41. Schott PA, Hokfelt T, Ogren SO (2000) Galanin and spatial learning in the rat. Evidence for a differential role for galanin in subregions of the hip‑pocampal formation. Neuropharmacology 39:1387–1403
42. Crawley JN (2008) Galanin impairs cognitive abilities in rodents: relevance to Alzheimer’s disease. Cell Mol Life Sci CMLS 65(12):1836–1841
43. McDonald MP, Crawley JN (1997) Galanin‑acetylcholine interactions in rodent memory tasks and Alzheimer’s disease. J Psychiatry Neurosci 22(5):303–317
44. Agoston DV, Komoly S, Palkovits M (1994) Selective up‑regulation of neu‑ropeptide synthesis by blocking the neuronal activity: galanin expression in septohippocampal neurons. Exp Neurol 126(2):247–255
45. Gustafson EL, Smith KE, Durkin MM, Gerald C, Branchek TA (1996) Distribution of rat galanin receptor mRNA in rat brain. NeuroReport 22(7):953–957
46. Moreno E, Vaz SH, Cai NS, Ferrada C, Quiroz C, Barodia SK et al (2011) Dopamine‑galanin receptor heteromers modulate cholinergic
neurotransmission in the rat ventral hippocampus. J Neurosci Off J Soc Neurosci 31(20):7412–7423
47. O’Donnell D, Ahmad S, Wahlestedt C, Walker P (1999) Expression of the novel galanin receptor subtype GALR2 in the adult rat CNS‑ distinct distri‑bution from GALR1. J Comp Neurol 409:469–481
48. Yoshitake T, Yoshitake S, Savage S, Elvander‑Tottie E, Ogren SO, Kehr J (2011) Galanin differentially regulates acetylcholine release in ventral and dorsal hippocampus: a microdialysis study in awake rat. Neuroscience 197:172–180
49. Huang EJ, Reichardt LF (2001) Neurotrophins: roles in neuronal develop‑ment and function. Annu Rev Neurosci 24:677–736
50. Wu A, Molteni R, Ying Z, Gomez‑Pinilla F (2003) A saturated‑fat diet aggra‑vates the outcome of traumatic brain injury on hippocampal plasticity and cognitive function by reducing brain‑derived neurotrophic factor. Neuroscience 119(2):365–375
51. Kanoski SE, Meisel RL, Mullins AJ, Davidson TL (2007) The effects of energy‑rich diets on discrimination reversal learning and on BDNF in the hippocampus and prefrontal cortex of the rat. Behav Brain Res 182(1):57–66
52. Stranahan AM, Norman ED, Lee K, Cutler RG, Telljohann RS, Egan JM et al (2008) Diet‑induced insulin resistance impairs hippocampal synaptic plasticity and cognition in middle‑aged rats. Hippocampus 18(11):1085–1088
53. Hawes JJ, Picciotto MR (2004) Characterization of GalR1, GalR2, and GalR3 immunoreactivity in catecholaminergic nuclei of the mouse brain. J Comp Neurol 479(4):410–423
54. Waters SM, Krause JE (2000) Distribution of galanin‑1, ‑2, and ‑3 receptor messenger RNAs in central and peripheral rat tissues. Neuroscience 95(1):265–271
55. Wang S, He C, Hashemi T, Bayne M (1997) Cloning and expressional characterization of a novel galanin receptor: identification of different pharmacophores within galanin for the three galanin receptor subtypes. J Biol Chem 272(51):31949–31952
56. Egecioglu E, Skibicka KP, Hansson C, Alvarez‑Crespo M, Friberg PA, Jerlhag E et al (2011) Hedonic and incentive signals for body weight control. Rev Endocr Metab Disord 12(3):141–151
57. Volkow ND, Wang GJ, Baler RD (2011) Reward, dopamine and the control of food intake: implications for obesity. Trends Cognit Sci 15(1):37–46
58. Valdivia S, Patrone A, Reynaldo M, Perello M (2014) Acute high fat diet consumption activates the mesolimbic circuit and requires orexin signal‑ing in a mouse model. PLoS One 9(1):e87478
59. Nyberg L (2005) Any novelty in hippocampal formation and memory? Curr Opin Neurol 18:424–428
60. Davidson TL, Altizer AM, Benoit SC, Walls EK, Powley TL (1997) Encoding and selective activation of “metabolic memories” in the rat. Behav Neuro‑sci 111(1):1014–1030
61. Folch J, Pedros I, Patraca I, Sureda F, Junyent F, Beas‑Zarate C et al (2012) Neuroprotective and anti‑ageing role of leptin. J Mol Endocrinol 49(3):R149–R156
62. Garza JC, Guo M, Zhang W, Lu XY (2008) Leptin increases adult hippocam‑pal neurogenesis in vivo and in vitro. J Biol Chem 283(26):18238–18247
63. Cheung CC, Hohmann JG, Clifton DK, Steiner RA (2001) Distribution of galanin messenger RNA‑expressing cells in murine brain and their regulation by leptin in regions of the hypothalamus. Neuroscience 103(2):423–432
64. Laque A, Zhang Y, Gettys S, Nguyen TA, Bui K, Morrison CD et al (2013) Leptin receptor neurons in the mouse hypothalamus are colocalized with the neuropeptide galanin and mediate anorexigenic leptin action. Am J Physiol Endocrinol Metab 304(9):E999–E1011
65. Liao GY, An JJ, Gharami K, Waterhouse EG, Vanevski F, Jones KR et al (2012) Dendritically targeted Bdnf mRNA is essential for energy balance and response to leptin. Nat Med 18(4):564–571
66. Ren L, Chan SMH, Zeng X, Laybutt DR, Iseli TJ, Sun R et al (2012) Differing endoplasmic reticulul stress response to excess lipogenesis versus lipid oversupply in relation to hepatic steatosis and insulin resistance. PLoS One 7(2):e30816
67. Eaton RP, Kipnis DM (1969) Effects of high‑carbohydrate diets on lipid and carbohydrate metabolism in the rat. Am J Physiol 217(4):1160–1168
68. Livak KJ, Schmittgen TD (2001) Analysis of relative gene expression data using real‑time quantitative PCR and the 2(‑Delta Delta C(T)) Method. Methods 25(4):402–408