Embed Size (px)
Citation preview

Journal of Automaic Chemistry, Volume 6, Number 4 (October-December 1984), pages 210-213
A microcomputer-based automatedcurve tracer for accurate digitizationof paper-recorded spectra
J. C. W. G. Bink and H. A. van ’t Klooster*State University of Utrecht, Laboratory of Analytical Chemistry, Croesestraat 77a, 3522 AD Utrecht, The Netherlands
Introduction Hardware
Although direct connection of analytical instruments to com-puters allows on-line acquisition of computer-readable data,there are still many laboratory situations which require off-linedigitization of compiled analogue data as a separate step in theprocess of automatic data analysis. Such a situation applies toexisting laboratory compilations of spectra recorded on paperdocuments, which, particularly as references, may be of greatvalue to the laboratory. Commercially available digitized spec-tra files can be expensive, often they do not have the desiredaccuracy, and frequently they represent compounds which arenot of interest to the user. On-line recording of new referencespectra may be impossible or impractical: the necessaryreference compounds being either unavailable or expensive. Soin these situations digitizing the available paper-recordedspectra is an attractive option.
A general discussion on the problems involved in compilingcomputer-readable spectra libraries is given by Biichi et al. [1].These authors used a writing tablet linked to a PDP minicomputerfor semi-automatic digitization of analogue spectra. De Hasethet al. [2] designed a computer-interfaced vidicon camera fordirect optical encoding of spectra and chemical structuremodels. Delaney and Uden [3] developed a digitizer, using anX-Y servorecorder and a PDP computer, to encode 500vapour-phase infra-red spectra. This idea was then adopted byRazinger et al. [4] for the digitization of infrared spectra ofpolymers.
Video systems, however, generally require a high investment.Semi-automatic digitizer systems are less expensive, but are onlyeffective if manual measurement of separated data-points ispracticable. It is difficult to maintain a high accuracy whencontinuously digitizing spectra in small intervals, resulting in astream of data points. Also, operating a digitizer in data-streammode is complicated.
In view ofthe fact that microcomputers and plotters are nowavailable in many laboratories, an automatic curve tracer hasbeen developed using these machines; there are few additionalcosts. The general idea is to use a plotter as a reading instead ofaplotting device, by replacing the pen by an optical reflectivesensor, and writing appropriate software to control the sensorand to process the digitized data. This curve tracer finds andfollows a curve, while fully digitizing it, with an accuracy whichmainly depends on the quality of the plotter. Manual work islimited to marking a spectrum, which enables the curve tracer todetermine a starting point and a scale factor.
*Correspondence to Dr van ’t Klooster.
210
A schematic representation of the curve tracer is shown in figure1. The electronics needed for the optical reflective sensor areshown in figure 2.
The sensor (an HP HEDS-1000 was used) is mounted as aregular pen on a Calcomp 81 plotter. The plotter is interfacedwith an Apple II microcomputer using an RS-232 interface at2400 baud. The necessary power for the sensor is supplied by theApple, which needs two additional input bits and one output bit.Hence, the game-I/O of the Apple is sufficient. One input bitdetects the current status (black/white) of the surface under thesensor; the second input bit is used to determine whether a blackline is detected or has been passed since the last start position onthe trajectory of the sensor. This important memory functioncan be reset with the output bit, which is used for generating anegative strobe signal. The serial interface is used to sendcommands to the plotter to move the sensor to a new position onthe plotter bed. Additional interfacing electronics consist of anoperational amplifier to transform the signals to TTL level, aSchmitt trigger to transform the signals to block-shaped pulsesand some logic to hold information about the temporary statusof the scanned surface. The optical reflective sensor, type HPHEDS-1000, consists ofa 0.18 mm diameter 700 nm visible LEDemitter and a matched I.C. photodetector. The active areas ofthe emitter and the detector are imaged to a single spot, 4.27 mmin front of the sensor. The reflected signal is sensed directly fromthe photodiode (Hewlett-Packard documents [5]). Back-ground-lines of colours other than black do not interfere withthe detection of black lines. An adjustable resistance is included,enabling the user to control the sensor’s sensitivity. Theaccuracy of the curve tracer is determined by the diameter of theemitted beam of the sensor and by the repeatability andaccuracy of the plotter. An average accuracy of 0.2mm ispossible when using a plotter like the Calcomp 81. The speed ofthe system is determined partly by the hardware configuration,but mainly by the effeciency of the program that controls thecurve tracer and by the required accuracy of digitization.
Software
The software was developed with COMPAS PASCAL, aPascal compiler designed to run on Z-80-based microcomputerswith CP/M operating system, which allows structured pro-gramming and combines high-speed operation with convenientdirect interfacing capabilities (Poly-Data documents [6]).
The program, ’CURvETRACE’, operates as follows. Afterfinding the markers on the spectral document, the width of the
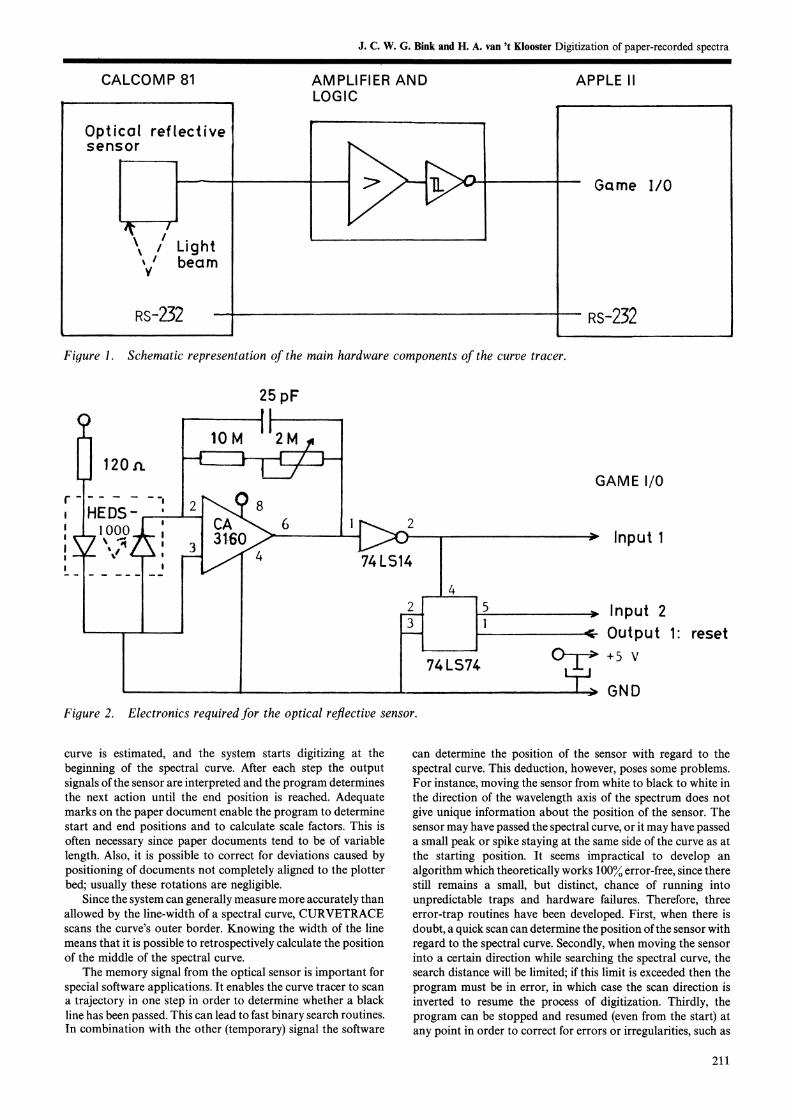
Figure 1.
CALCOMP 81
Optical reflectivesensor
\ // Lightbearn
RS-232
J. C. W. G. Bink and H. A. van ’t Klooster Digitization of paper-recorded spectra
AMPLIFIER AND APPLE IILOGIC
Schematic representation of the main hardware components of the curve tracer.
Game I/0
RS-232
120
HEDS 2 8
25pF
74 LS14
4
74LS74
Figure 2. Electronics required for the optical reflective sensor.
GAM E I/0
Input
Input 2Outpu t 1" reset+5 V
ND
curve is estimated, and the system starts digitizing at thebeginning of the spectral curve. After each step the outputsignals ofthe sensor are interpreted and the program determinesthe next action until the end position is reached. Adequatemarks on the paper document enable the program to determinestart and end positions and to calculate scale factors. This isoften necessary since paper documents tend to be of variablelength. Also, it is possible to correct for deviations caused bypositioning of documents not completely aligned to the plotterbed; usually these rotations are negligible.
Since the system can generally measure more accurately thanallowed by the line-width of a spectral curve, CURVETRACEscans the curve’s outer border. Knowing the width of the linemeans that it is possible to retrospectively calculate the positionof the middle of the spectral curve.
The memory signal from the optical sensor is important forspecial software applications. It enables the curve tracer to scana trajectory in one step in order to determine whether a blackline has been passed. This can lead to fast binary search routines.In combination with the other (temporary) signal the software
can determine the position of the sensor with regard to thespectral curve. This deduction, however, poses some problems.For instance, moving the sensor from white to black to white inthe direction of the wavelength axis of the spectrum does notgive unique information about the position of the sensor. Thesensor may have passed the spectral curve, or it may have passeda small peak or spike staying at the same side of the curve as atthe starting position. It seems impractical to develop analgorithm which theoretically works 100o error-free, since therestill remains a small, but distinct, chance of running intounpredictable traps and hardware failures. Therefore, threeerror-trap routines have been developed. First, when there isdoubt, a quick scan can determine the position ofthe sensor withregard to the spectral curve. Secondly, when moving the sensorinto a certain direction while searching the spectral curve, thesearch distance will be limited; if this limit is exceeded then theprogram must be in error, in which case the scan direction isinverted to resume the process of digitization. Thirdly, theprogram can be stopped and resumed (even from the start) atany point in order to correct for errors or irregularities, such as
211
J. C. W. G. Bink and H. A. van ’t Klooster Digitization of paper-recorded spectraII
missing marks, spots or lines on the document, or interrupts inthe spectral curve. After processing a complete spectrum thedata are stored on a diskette.
Replotting stored results is possible by running a plotprogram after replacing the sensor with a pen. A quick check onthe quality of the results is then provided by visual comparisonof original and reconstructed (replotted) spectra. Further pro-cessing of the stored data may be carried out on the micro, or ona laboratory computer.
Results and discussion
The curve tracer was tested on 150 infra-red spectra of purifiedliquid hydrocarbons, recorded on a double-beam spectrometerwith an accuracy of the frequency of 5cm-1 in the range4000-2000 cm- 1, 2 cm- in the range 2000-600 cm- 1, and of2of the transmittance.
The spectra were marked and digitized from 4000 cm-1 to600cm -1. Since these infra-red spectra are approximately15 x 48 cm and the plotter bed is of A3 format, the spectra weredigitized in two parts. Marking of the spectra was done bydrawing lines of 0"5 mm width and cm length at the followingpoints:
(1) Vertically at 0T and 4000cm -1, at 0oT and2000cm-1 and at 0oT and 600cm-1.
(2) Horizontally at 0T and 4000cm -1, at 0T and2000 cm- 1, at 102T and 4000 cm- and at 102oTand 2000 cm 1.
The curves were digitized with intervals of 0"2 mm along thewavelength axis, if the transmittance value was between 0 and90oT. (To save time the intervals can be expanded to 0.5 mm if
the transmittance value is greater than 90T.) After each stepalong the wavelength axis the corresponding transmittancevalue was first roughly found and then determined withincrements of 0.1 mm. This can result in a maximum of 2400points per spectrum, depending on the position of the base-lineof the spectrum. In this way a spectrum can be digitized, onaverage, in 15 to 20min.
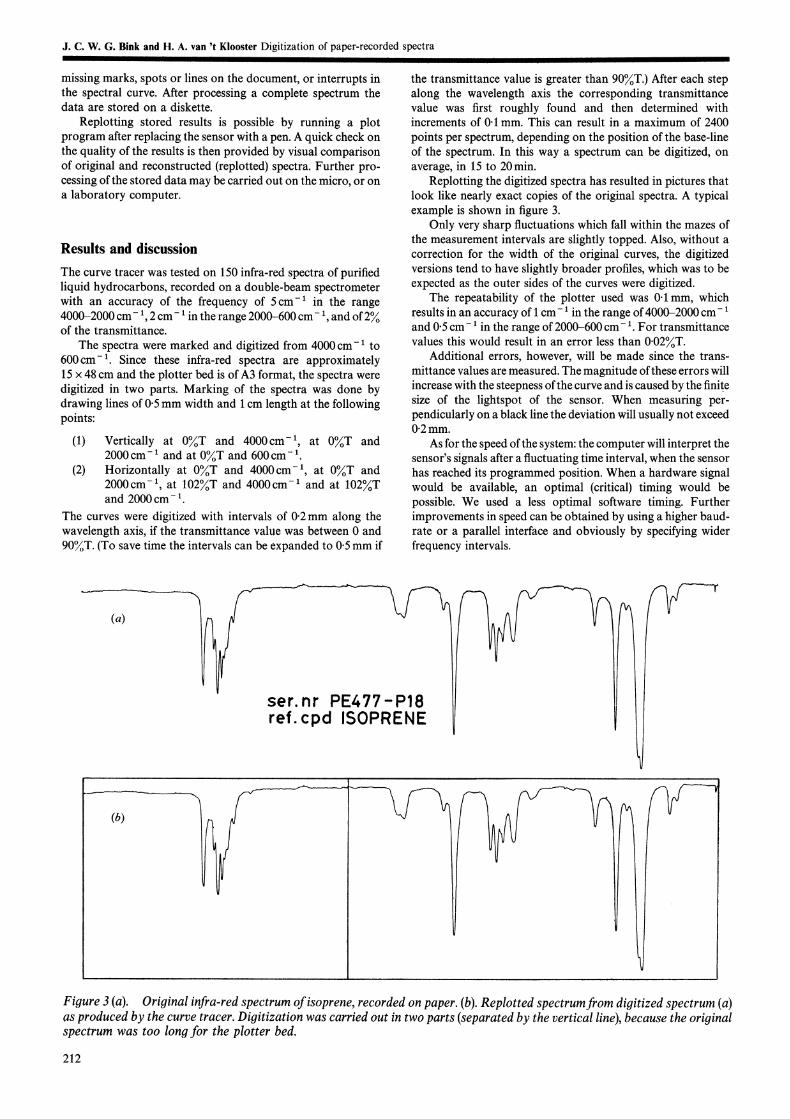
Replotting the digitized spectra has resulted in pictures thatlook like nearly exact copies of the original spectra. A typicalexample is shown in figure 3.
Only very sharp fluctuations which fall within the mazes ofthe measurement intervals are slightly topped. Also, without acorrection for the width of the original curves, the digitizedversions tend to have slightly broader profiles,, which was to beexpected as the outer sides of the curves were digitized.
The repeatability of the plotter used was 0.1 mm, whichresults in an accuracy of cm- in the range of4000-2000 cm-and 0.5 cm- in the range of 2000-600 cm- 1. For transmittancevalues this would result in an error less than 0.02T.
Additional errors, however, will be made since the trans-mittance values are measured. The magnitude ofthese errors willincrease with the steepness ofthe curve and is caused by the finitesize of the. lightspot of the sensor. When measuring per-pendicularly on a black line the deviation will usually not exceed0.2mm.
As for the speed ofthe system: the computer will interpret thesensor’s signals after a fluctuating time interval, when the sensorhas reached its programmed position. When a hardware signalwould be available, an optimal (critical) timing would bepossible. We used a less optimal software timing. Furtherimprovements in speed can be obtained by using a higher baud-rate or a parallel interface and obviously by specifying widerfrequency intervals.
(a)
ser. nr PE477 P18ref. cpd ISOPRENE
(b)
Figure 3 (a). Original infra-red spectrum ofisoprene, recorded on paper. (b). Replotted spectrumfrom digitized spectrum (a)as produced by the curve tracer. Digitization was carried out in two parts (separated by the vertical line), because the originalspectrum was too long for the plotter bed.
212

J. C. W. G. Bink and H. A. van ’t Klooster Digitization of paper-recorded spectra
In conclusion, it has been shown that is is possible to build alow-cost, fully automated curve-tracing digitizer, based on amicrocomputer, a plotter and a high-resolution optical reflectivesensor. The digitizing accuracy of the system mainly depends onthe quality of the plotter, and on the resolution of the opticalreflective sensor. Apart from the efficiency of the software, thespeed of the system is principally controlled by the requiredaccuracy.
AcknowledgementsThe authors wish to thank Mr H. Erkelens and Mr C. van derLee for valuable technical assistance.
ReferencesB/caI, R., CLERC, J. T., JOST, Ca., KOENITZER, H. and WEGMANN,D., Analytica Chimica Acta, 103 (1978), 21.DE HASETH, J. A., WOODWARD, W. S., and ISENHOUR, T. L.,Analytical Chemistry, 48 (1976), 1513.DELANEV, M. F., and UDEN, P. C., Analytical Chemistry, 50 (1978),2156.RAZINGER, M., PENCA, M. and Ztn’An, J., Analytical Chemistry,53 (198i), 107.HEWL.Ta:-PACtARD, Optoelectronics Desioner’s Catalo9 (1983),184-189 and 624-643.Poly-Data Microcenter ApS, Operating Manual--CommonPascal Languaoe System (Copenhagen, 1983).
PITTSBURGHComputingOn 25 February 1985, at the annual PittsburghConference and Exposition, a tutorial workshop is tobe presented on PCs in the laboratory, this will befollowed by a session on the elements of the newinstrumentation science, from microcomputer sub-systems in instruments to expert systems for acqui-sition and interpretation of data. On 26 February theSociety for Analytical Chemists of Pittsburgh AwardSymposium, ’Chemometrics and process analyticalchemistry’ honouring Professor Bruce Kowalski, willbe held. This will cover the impact of computing inindustrial processes and the new opportunities forindustrial analytical chemists. Additionally, a paneldiscussion, held as part of the Monday afternoonsymposium, will give the audience the opportunity todiscuss developments in their own laboratories.
More information from David R. Weill III, Shady SideAcademy, 423 Fox Chapel Road, Pittsburoh, Pennsyl-vania 15238, USA.
ExhibitionThe 1985 Pittsburgh Conference Exposition will againpresent an exhibit of modern laboratory equipmentand instrumentation for analytical chemistry andapplied spectroscopy. In 1984, 610 American andforeign companies exhibited their products in 1607booths and 34 seminar rooms. The Exposition will beopen from Monday morning, 25 February to Thurs-day afternoon, 28 February 1985.
For information regarding the exposition or reservation
of space, please contact: Peter M. Castle, ExpositionChairman, Pittsburgh Conference, 437 Donald Road,Dept. WT, Pittsburgh, Pennsylvania 15235, USA.
’FOOD TOXICOLOGY’A new book from Taylor & Francis; it is edited byG. Gibson and R. Walker and copies (price c. 40.00)will be available in Spring 1985. Articles in thismulti-author volume include:
Food safetyAllocation of priorities--where do the real risks lie?New approaches to toxicity testingEvaluation of major food ingredientsAllergies and idiosyncratic responsesPotential ’loopholes’ in the routine safety evaluation of
infant feeding formulae: possible lessons from thepreparation of sow’s milk substitutes for piglets.
LegislationControl of food additives and contaminants in the
United KingdomControl of food additives and contaminants, the EEC
situationControl of food additives and contaminants, theCanadian and United States position
The form and role of food surveillanceThe role of epidemiology in identifying dietary
hazards.
ProblemsArtificial sweetners: the long running sagaAntioxidants: carcinogenisity and modifying activity
in tumorigenesisThe problem of food additives: food coloursToxicology of caramel colours: current statusPreservativesFlavourings--a question of prioritiesHyperactivity and food additives: facts or myths.
ContaminantsEvaluation of risks from pesticide residues in foodHeavy metal residuesContamination from packaging materialsGrowth promoters: residues in foodSpain: toxic oil syndrome.
Details from Taylor & Francis Ltd.
213

Submit your manuscripts athttp://www.hindawi.com
Hindawi Publishing Corporationhttp://www.hindawi.com Volume 2014
Inorganic ChemistryInternational Journal of
Hindawi Publishing Corporation http://www.hindawi.com Volume 2014
International Journal ofPhotoenergy
Hindawi Publishing Corporationhttp://www.hindawi.com Volume 2014
Carbohydrate Chemistry
International Journal of
Hindawi Publishing Corporationhttp://www.hindawi.com Volume 2014
Journal of
Chemistry
Hindawi Publishing Corporationhttp://www.hindawi.com Volume 2014
Advances in
Physical Chemistry
Hindawi Publishing Corporationhttp://www.hindawi.com
Analytical Methods in Chemistry
Journal of
Volume 2014
Bioinorganic Chemistry and ApplicationsHindawi Publishing Corporationhttp://www.hindawi.com Volume 2014
SpectroscopyInternational Journal of
Hindawi Publishing Corporationhttp://www.hindawi.com Volume 2014
The Scientific World JournalHindawi Publishing Corporation http://www.hindawi.com Volume 2014
Medicinal ChemistryInternational Journal of
Hindawi Publishing Corporationhttp://www.hindawi.com Volume 2014
Chromatography Research International
Hindawi Publishing Corporationhttp://www.hindawi.com Volume 2014
Applied ChemistryJournal of
Hindawi Publishing Corporationhttp://www.hindawi.com Volume 2014
Hindawi Publishing Corporationhttp://www.hindawi.com Volume 2014
Theoretical ChemistryJournal of
Hindawi Publishing Corporationhttp://www.hindawi.com Volume 2014
Journal of
Spectroscopy
Analytical ChemistryInternational Journal of
Hindawi Publishing Corporationhttp://www.hindawi.com Volume 2014
Journal of
Hindawi Publishing Corporationhttp://www.hindawi.com Volume 2014
Quantum Chemistry
Hindawi Publishing Corporationhttp://www.hindawi.com Volume 2014
Organic Chemistry International
ElectrochemistryInternational Journal of
Hindawi Publishing Corporation http://www.hindawi.com Volume 2014
Hindawi Publishing Corporationhttp://www.hindawi.com Volume 2014
CatalystsJournal of