Embed Size (px)
Citation preview

A B C.......Q R S!
Coilín MintoDepartment of Biology, Dalhousie University
Please note
• Applied introductory class on use of the S language
• Procedures for a basic analysis of biological data
• My perspective
Class outline
• Introduction to the software
• Workshop
• Biological example
Questions please!
Historical perspective• S language and environment developed by John
Chambers and colleagues at Bell Laboratories (formerly AT&T, now Lucent Technologies)
• S-Plus, a commercial version of S by Insightful Software since 1987, now at version 7
• R is a GNU project that started in the mid-1990s
• Current production version released on June 20th is 2.2.1
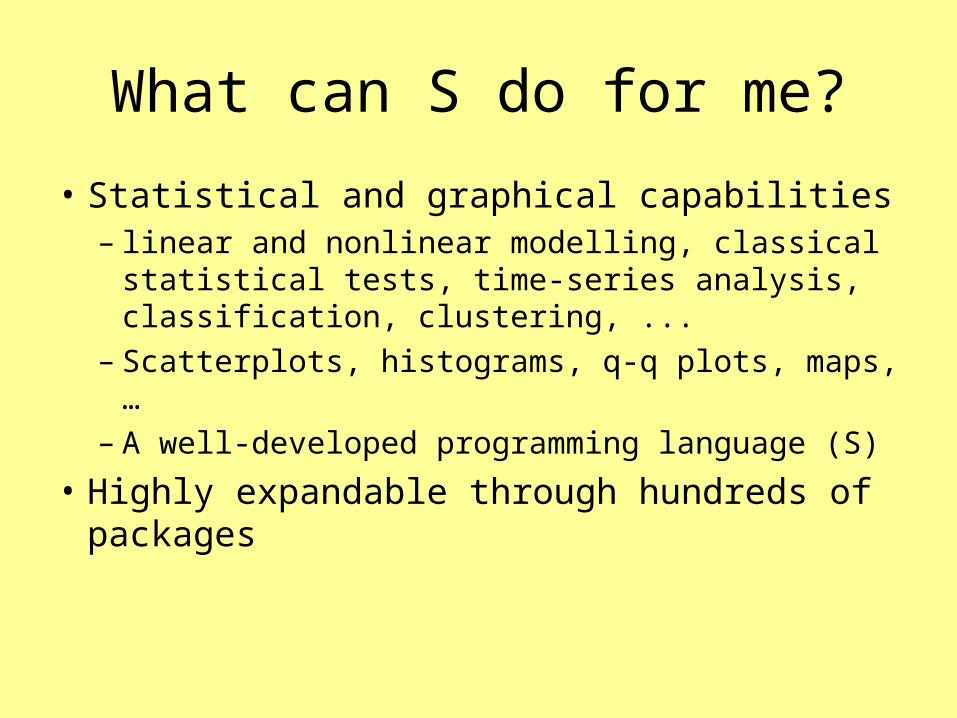
What can S do for me?
• Statistical and graphical capabilities– linear and nonlinear modelling, classical
statistical tests, time-series analysis, classification, clustering, ...
– Scatterplots, histograms, q-q plots, maps, …– A well-developed programming language (S)
• Highly expandable through hundreds of packages
Why use S?
• Incredibly flexible
• Accessible/intuitive language
• Well supported (especially R)
• Powerful language capabilities
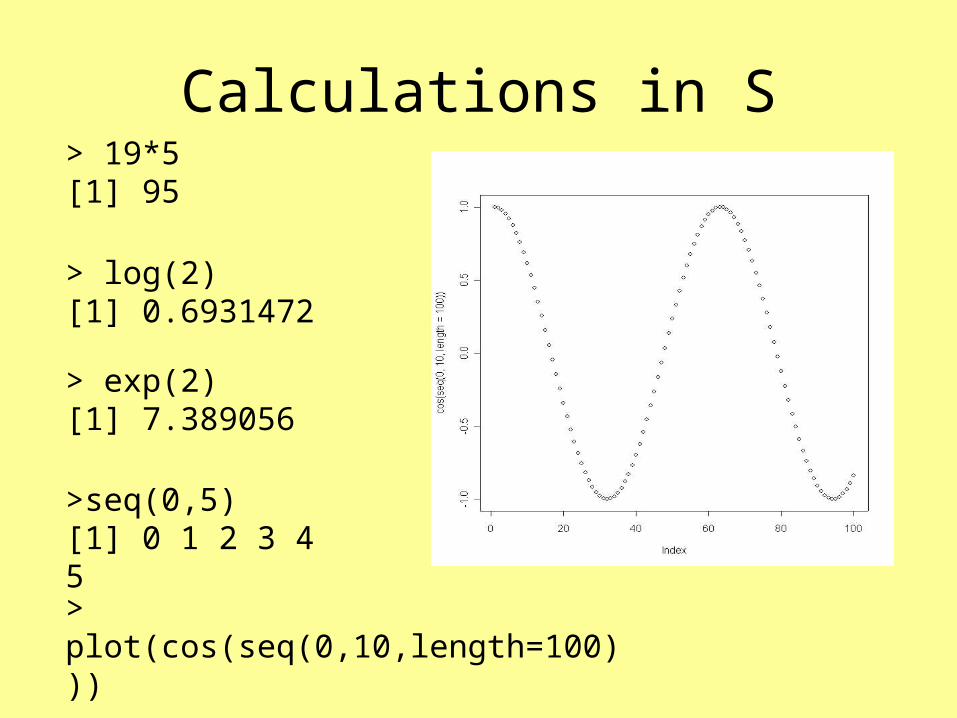
Calculations in S> 19*5[1] 95
> log(2)[1] 0.6931472
>seq(0,5)[1] 0 1 2 3 4 5
> plot(cos(seq(0,10,length=100)))
> exp(2)[1] 7.389056
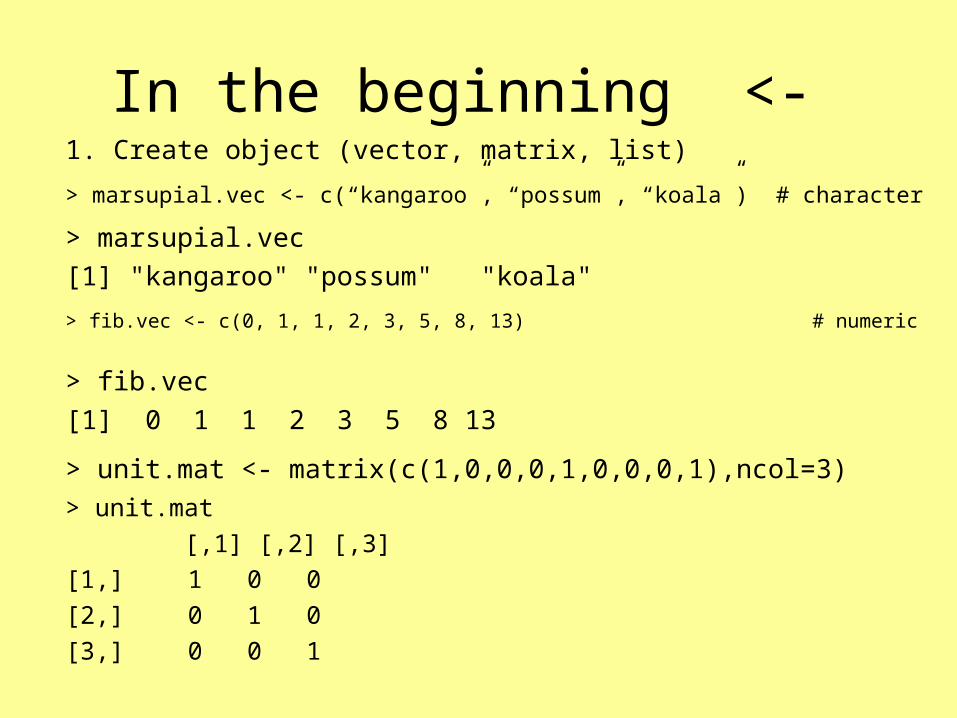
In the beginning <- 1. Create object (vector, matrix, list)
> marsupial.vec <- c(“kangaroo”, “possum”, “koala”) # character
> marsupial.vec [1] "kangaroo" "possum" "koala"
> fib.vec <- c(0, 1, 1, 2, 3, 5, 8, 13) # numeric
> fib.vec [1] 0 1 1 2 3 5 8 13
> unit.mat <- matrix(c(1,0,0,0,1,0,0,0,1),ncol=3)
> unit.mat [,1] [,2] [,3][1,] 1 0 0[2,] 0 1 0[3,] 0 0 1
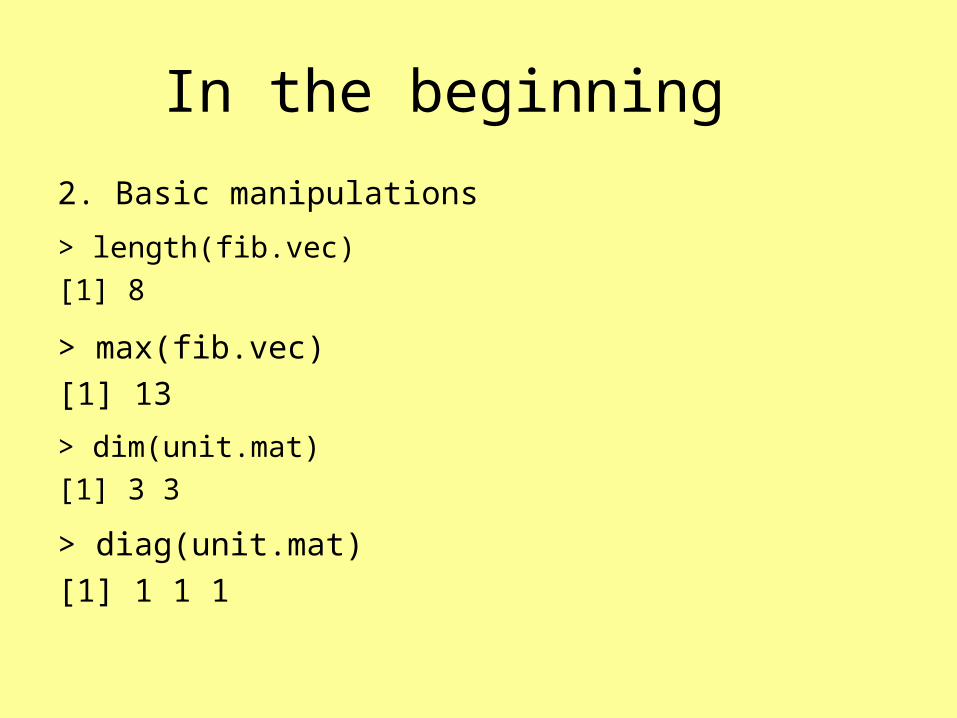
In the beginning
2. Basic manipulations
> length(fib.vec)
[1] 8
> max(fib.vec)[1] 13
> dim(unit.mat)
[1] 3 3
> diag(unit.mat)[1] 1 1 1
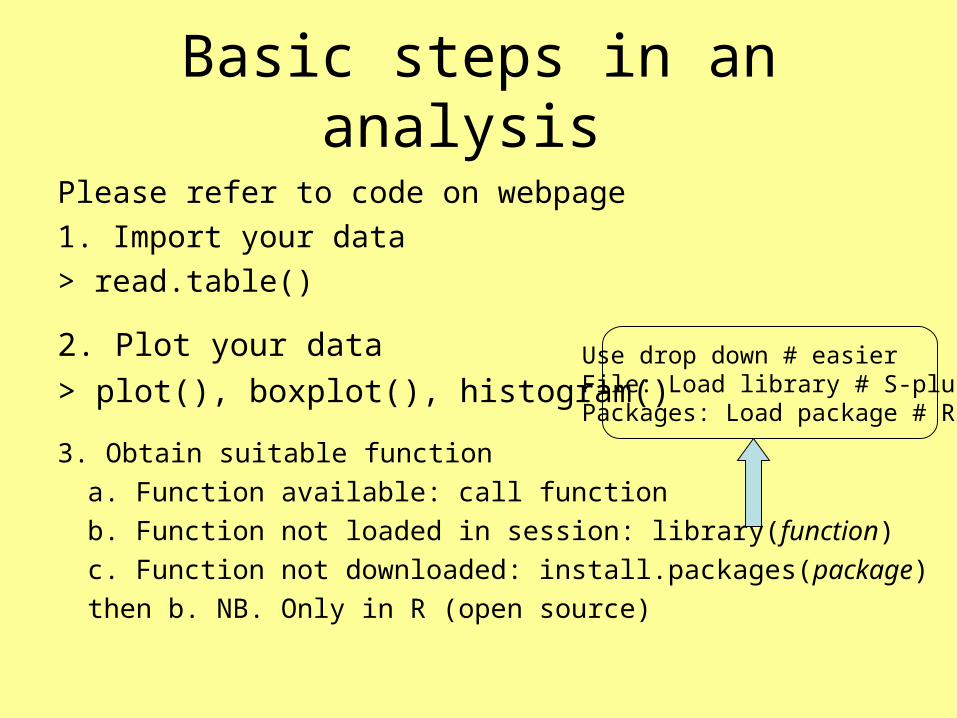
Basic steps in an analysis
2. Plot your data
> plot(), boxplot(), histogram()
3. Obtain suitable function
a. Function available: call function
b. Function not loaded in session: library(function)c. Function not downloaded: install.packages(package) then b. NB. Only in R (open source)
Please refer to code on webpage
1. Import your data
> read.table()
Use drop down # easierFile: Load library # S-plusPackages: Load package # R

Basic steps in an analysis
4. Analyse / fit models
> model1 <- lm(variable.y~variable.x)> summary(model1)
> pca1 <- princomp(x, scores=T, cor = )> summary(pca1)
> dfa1 <- discrim(y~x, data= , family=) # S-plus
> dfa1 <- lda(y~x, data=) # R
> summary(dfa1)
> pca1 <- princomp(x, scores=T, cor = )> summary(pca1)

Mandlebrot set code written by Martin Maechler
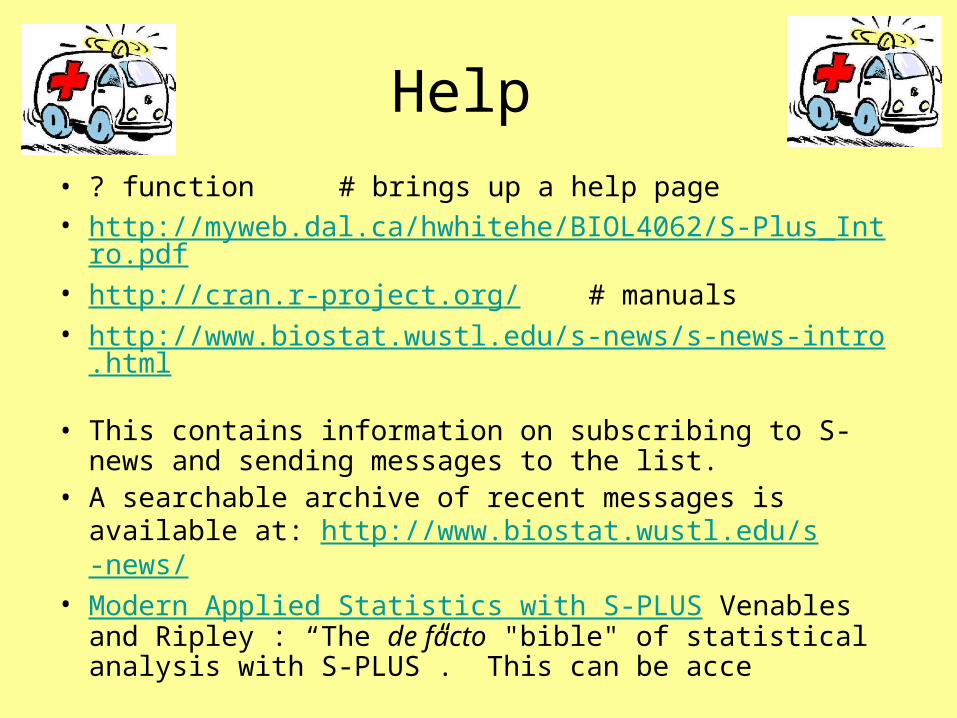
Help
• ? function # brings up a help page• http://myweb.dal.ca/hwhitehe/BIOL4062/S-Plus_Intro.pdf• http://cran.r-project.org/ # manuals• http://www.biostat.wustl.edu/s-news/s-news-intro.html • This contains information on subscribing to S-news and
sending messages to the list. • A searchable archive of recent messages is available at:
http://www.biostat.wustl.edu/s-news/ • Modern Applied Statistics with S-PLUS Venables and
Ripley : “The de facto "bible" of statistical analysis with S-PLUS”. This can be acce
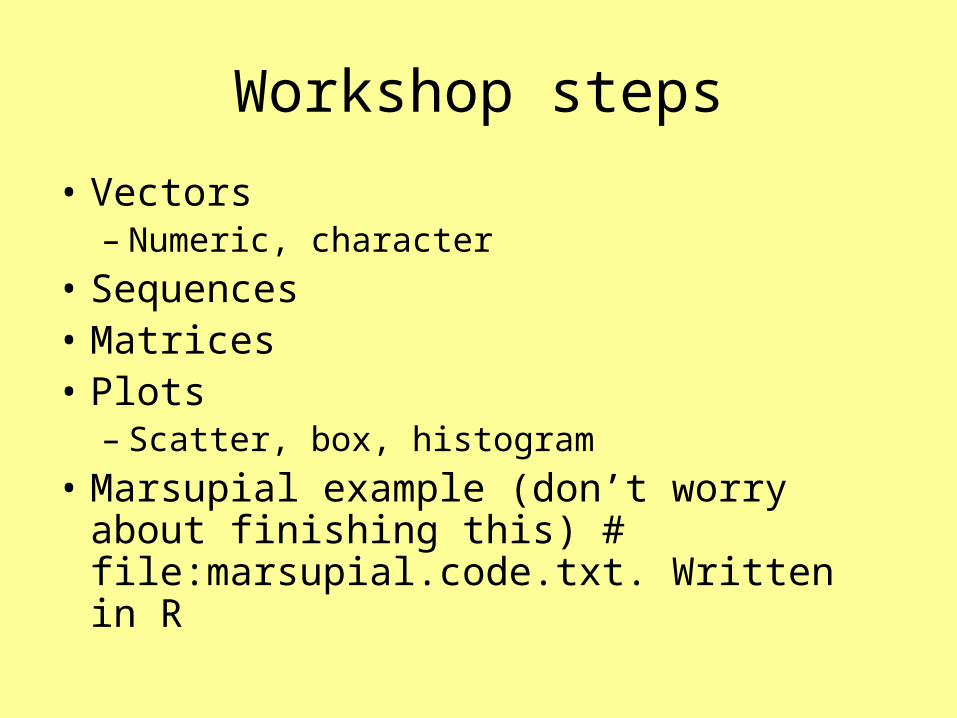
Workshop steps
• Vectors– Numeric, character
• Sequences• Matrices• Plots
– Scatter, box, histogram
• Marsupial example (don’t worry about finishing this) # file:marsupial.code.txt. Written in R