Embed Size (px)
Citation preview

A backgrounder for the seminar onEnergy, Transport, Urban Development and Key Infrastructural Investments
Dr P.V.Unnikrishnan

A Real Maze

% Share of Central Sector Investment in Kerala
Source: Public Enterprises Survey 2013-14
State 2011-12 2012-13 2013-14 Pop-11
MAHARAHASHTRA 16.92 18.10 17.19 9.28
ANDHRA PRADESH 7.26 7.33 7.00 7.05
TAMILNADU 6.84 7.15 7.26 5.96
UTTAR PRADESH 6.25 6.40 6.45 16.49
ORISSA 5.82 5.14 4.84 3.47
WEST BENGAL 4.88 5.14 5.23 7.55
GUJARAT 4.35 4.50 4.52 5.00
KERALA 1.93 2.02 2.06 2.76

Central Sector Investment models-TransportProject Centre State Others Remarks
Vizhinjam International Deep water Multipurpose sea port
817.8 Cr(VGF) 817.20 Cr (VGF)1463.00 Cr (Funded works)
Private vendor 4089 Cr
No participation of Indian Navy and Coast Guard
Kochi Metro Rail Limited
1049.83 1856.64 AFD 2272.21
Kerala Rapid Transit Corporation Limited
1345.60 1345.60 JAICA4026.80
Light Metros in Kozhikode and
Thiruvanthapuram

Asymmetry in the Indian Federal System
Level of Government Revenues (%) Expenditures (%)
Union Government 66.19 47.70
State Government 31.31 45.19
Local Government 2.5 7.11Total public R&E 100 100A unique feature of India’s fiscal decentralisation is the high level of asymmetry of the relative shares of expenditure and revenue assignments between the federal, provincial and local governments.
Source: Chakraborty, Pinaki, National Institute of Public Finance and Policy

Unique Kerala ModelsCochin International Airport Limited (CIAL)
• Greenfield airport built on a Public-Private partnership for the first time in India
• Unique rehabilitation package with 800 out of 822 families having livelihood opportunities
• Excellent public participation and sustainable business model
Consumer oriented Vertical Integrated utility (KSEB) 2001-
2011• Kerala State Electricity Regulatory
Commission effective regulator (best award in 2013)
• Highest accumulated profit without subsidy 2008-2011
• State load despatch centre mordernisation under APDRP/RAPDRP and innovative DSM
• 100% metering, 97% collection efficiency , anti theft management, improved customer service.

Role of Local Government in Transport Sector
Source: Kerala State Planning Board, 2014

Challenges to Infrastructure development in the State
• Resource Crunch•High density of
population•Undulating
topography• Scarcity of land• Tedious co-
ordination across multiple agencies
•High expectations on infrastructure
standards•High demands for
quality of service• Lack of appreciation of
scale of financing requirements

How to finance?
What is possible?
What do the users want?
Innovative Solutions suited to our Socio-political context required!

•A Comprehensive integrated spatial planning framework•Innovative participative solutions•Realistic and sustainable state of the art solutions
Hence!

Comprehensive Integrated Spatial Planning framework
Multitier Planning Methodology
• Centre, State, Local Governments to be involved• DPC’s, ULBs where supposed
to build bottom up District plans which were to be consolidated by DPCs and SPB
Dire Concerns
• River basin plans, • programmes for rejuvenating
backwater systems,• drainage plans,
• water front development, • developing inland water
ways, • multi modal traffic
development• High levels of urbanisation

Participative Methodology
• Even in the context of very high urbanisation rates (47.72%) • ribbon mode of urban
development• Extensive corridors
through out Kerala• open spaces exist even
in urban core areas which could be used for land pooling and systems of transferrable development rights.
• Nano models like Talipparamba Janakeeya Vikasana Samithi, Janavedi Transport Corporation, Meenvallom Small Hydro Development Project show tremendous creativity• Trichur Municipality
electricity and water supply models are limping for want of professional expertise• New models of public-
private-people partnership should emerge.

Promote Electric Traction in big way
Technology Carbon dioxide gpkm/passenger
Motorcycle 2 Stroke 19.5-39
Motor cycle 4 stroke 79.5 -159
Diesel bus 25- 75
Diesel MRT 18-71
Taxi cab 44.9-224.5
Petrol car 45 -133
Gas car 27.90-69.73
Electric car/ cable car 0

Comparison of transit technology options- actual cost per passenger mile
Technology Capital Cost (30 yr)
Operating cost
Bus-Diesel 0.14 0.78Trolley bus-Electric Traction 0.48 1.13
Light Rail 1.46 0.57Heavy Rail 0.24 0.38Sub urban Rail/commuter 0.26 0.39
Demand response 0.25 3.09National Transit Database -2007

Realistic State of the Art Sustainable SMART humane
Solutions• Cheemeni super thermal coal based triple E
project• Promote decentralised solar in customer
premiss with local government participation• Recreate water front through an intense
participative programme for SWM, Sewerage, sullage and storm water management• Promote LNG for industrial thermal use• Access for all and barrier free access for
disabled/aged

Experiences to learn from• Bogoto model • Curitiba, Brazil
• Car Free Sunday• Vehicle traffic reduced to
40% during peak time• Transmilenio traffic service
14% CDM reduced per person• Road related fatalities
reduced by 94%
• Integrated Master Plan prepared by a young architect who later got elected as Mayor 3 times• Meet the interest of the poorest,
people’s interest over corporates• Existing buses re-designed, tubular
platforms to address delays
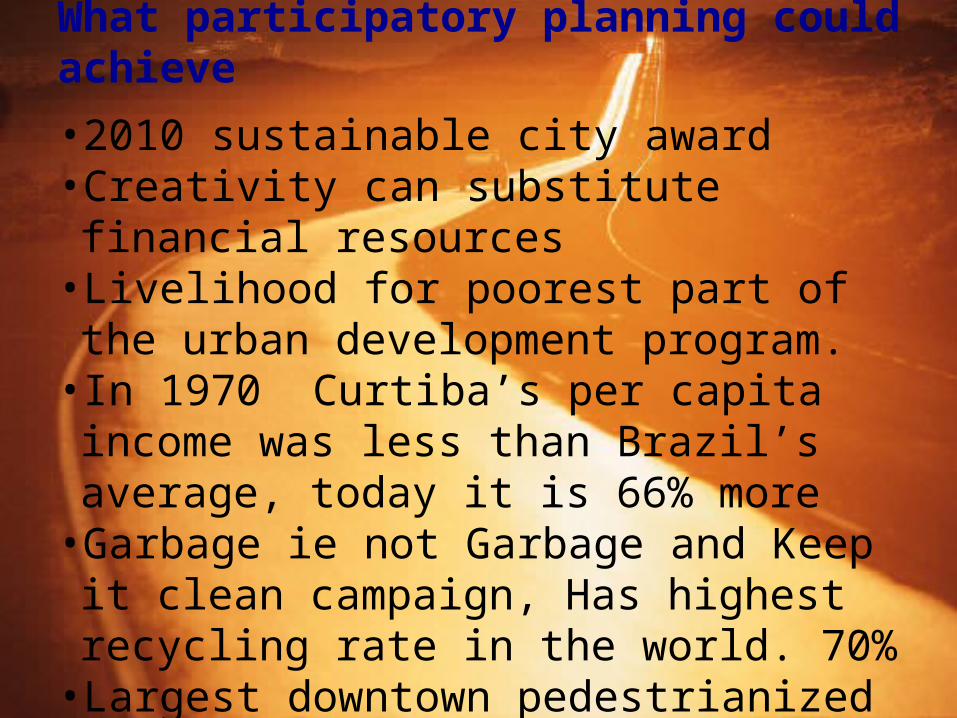
What participatory planning could achieve
• 2010 sustainable city award• Creativity can substitute financial resources• Livelihood for poorest part of the urban
development program.• In 1970 Curtiba’s per capita income was less
than Brazil’s average, today it is 66% more•Garbage ie not Garbage and Keep it clean
campaign, Has highest recycling rate in the world. 70% • Largest downtown pedestrianized shopping
area in the world.• From 0.5 sqm/person to 50/sqm per person
green, avoided floods fully when population tripled in 20 years• 75% commuters take bus.25% lower fuel
consumption. The residents pay 10% on traffic• 99% of Curtiba’s residents wants to live there
70% of Sao Paulo’s residents wants to live in Curtiba.

Thank you