Embed Size (px)
Citation preview
2012 CONVENTION 16 – 17 OCTOBER
Profit Recognition: A Banker’s Dilemma
Christiaan Nel
Antonie Jagga
PwC Actuarial & Insurance Management Solutions
2012 CONVENTION 16 – 17 OCTOBER PwC
Agenda
Introduction
What is profit recognition
Accounting Standards
IAS 39 and incurred loss concepts
IFRS 9 and expected loss concepts
Projection of Profits:
Overview of approach
Comparison of cashflows under IAS39 and IFRS 9
What does this mean for a Bank’s profits
Value prospects to investors
2012 CONVENTION 16 – 17 OCTOBER PwC
Introduction
What is profit recognition
3
2012 CONVENTION 16 – 17 OCTOBER
Introduction What is profit recognition
Profitability is a key indicator of the performance of financial institutions, and drives the behaviour of market participants.
True and accurate reflection of performance, and are not incorrectly reported.
Profit recognition over time can be done in line with some of the following factors:
Time (e.g. recognise profit linearly over time)
Cashflows (e.g. interest portion on contractual payments)
Risk (e.g. recognise profits in line with reducing expected losses)
2012 CONVENTION 16 – 17 OCTOBER PwC
Accounting Standards
IAS39 and Incurred Loss concepts
IFRS9 and Expected Loss concepts
2012 CONVENTION 16 – 17 OCTOBER
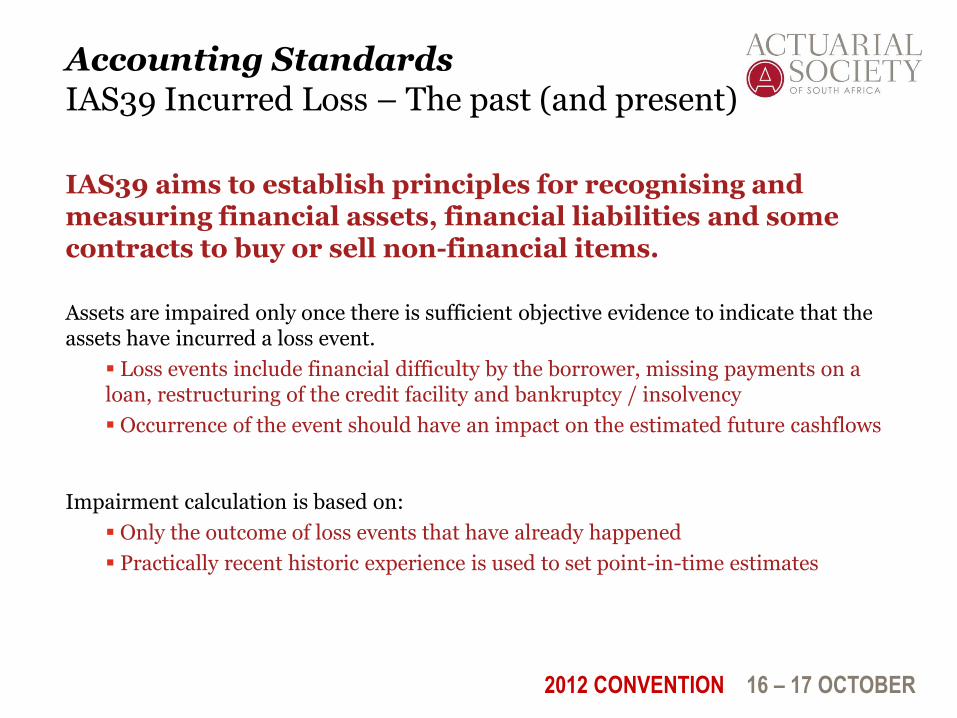
Accounting Standards IAS39 Incurred Loss – The past (and present)
IAS39 aims to establish principles for recognising and measuring financial assets, financial liabilities and some contracts to buy or sell non-financial items.
Assets are impaired only once there is sufficient objective evidence to indicate that the assets have incurred a loss event.
Loss events include financial difficulty by the borrower, missing payments on a loan, restructuring of the credit facility and bankruptcy / insolvency
Occurrence of the event should have an impact on the estimated future cashflows
Impairment calculation is based on:
Only the outcome of loss events that have already happened
Practically recent historic experience is used to set point-in-time estimates
2012 CONVENTION 16 – 17 OCTOBER
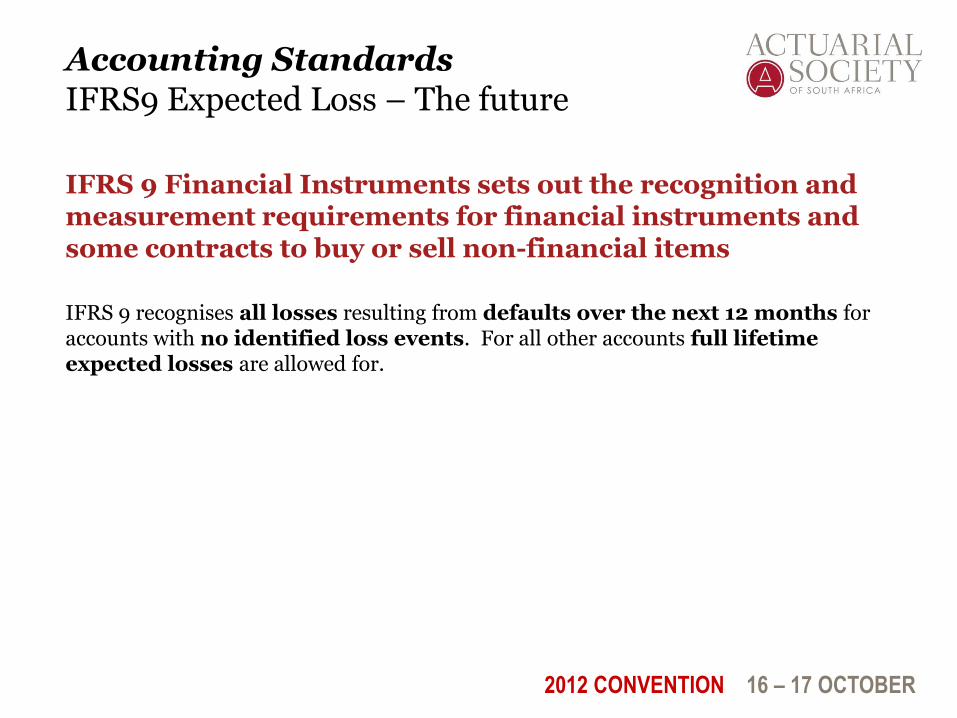
Accounting Standards IFRS9 Expected Loss – The future
IFRS 9 Financial Instruments sets out the recognition and measurement requirements for financial instruments and some contracts to buy or sell non-financial items
IFRS 9 recognises all losses resulting from defaults over the next 12 months for accounts with no identified loss events. For all other accounts full lifetime expected losses are allowed for.
2012 CONVENTION 16 – 17 OCTOBER
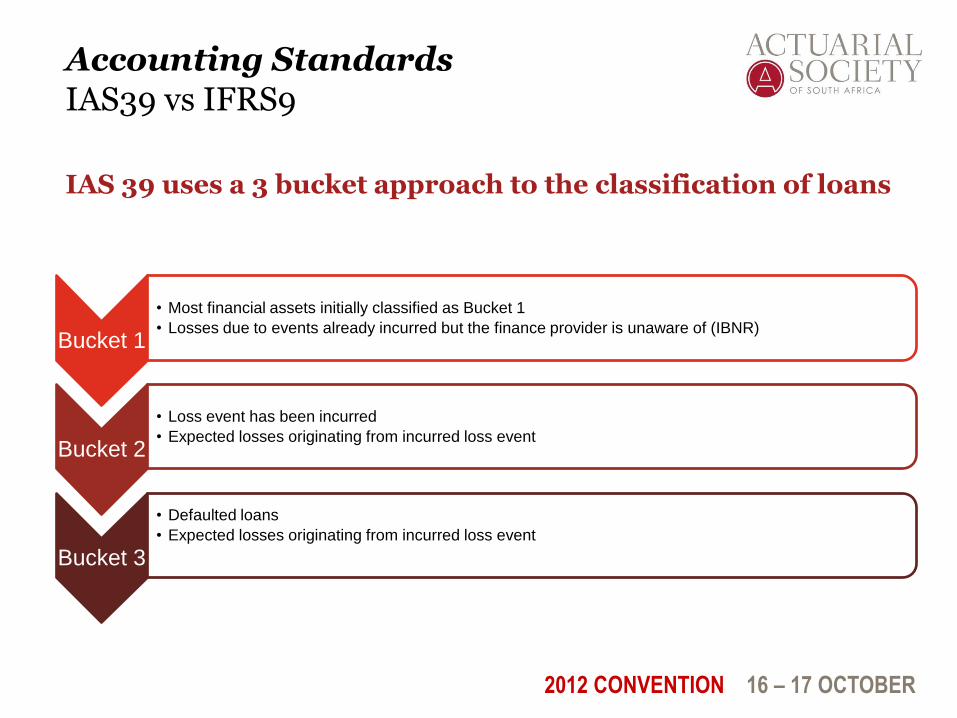
IAS 39 uses a 3 bucket approach to the classification of loans
Bucket 1
• Most financial assets initially classified as Bucket 1
• Losses due to events already incurred but the finance provider is unaware of (IBNR)
Bucket 3
• Defaulted loans
• Expected losses originating from incurred loss event
Accounting Standards IAS39 vs IFRS9
Bucket 2
• Loss event has been incurred
• Expected losses originating from incurred loss event
2012 CONVENTION 16 – 17 OCTOBER
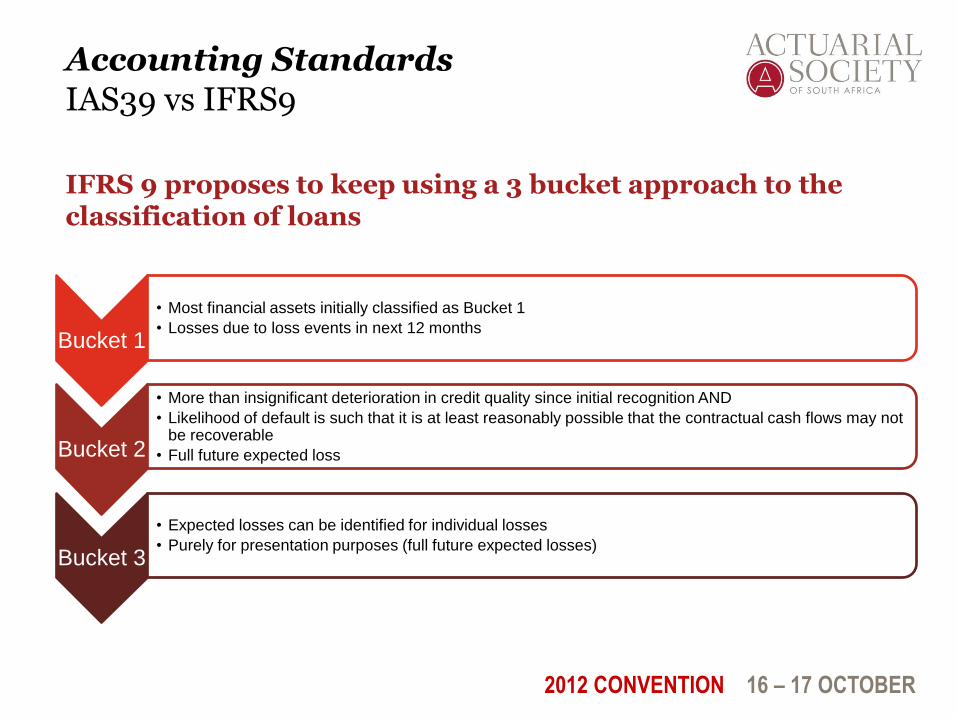
IFRS 9 proposes to keep using a 3 bucket approach to the classification of loans
Bucket 1
• Most financial assets initially classified as Bucket 1
• Losses due to loss events in next 12 months
Bucket 2
• More than insignificant deterioration in credit quality since initial recognition AND
• Likelihood of default is such that it is at least reasonably possible that the contractual cash flows may not be recoverable
• Full future expected loss
Accounting Standards IAS39 vs IFRS9
Bucket 3
• Expected losses can be identified for individual losses
• Purely for presentation purposes (full future expected losses)
2012 CONVENTION 16 – 17 OCTOBER
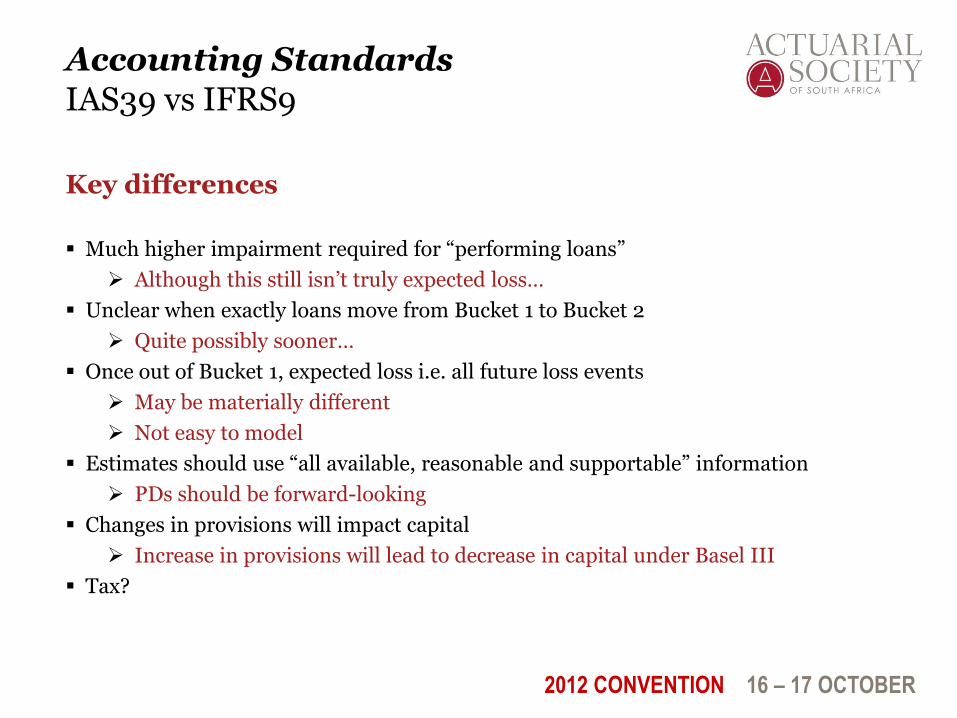
Accounting Standards IAS39 vs IFRS9
Key differences
Much higher impairment required for “performing loans”
Although this still isn’t truly expected loss…
Unclear when exactly loans move from Bucket 1 to Bucket 2
Quite possibly sooner…
Once out of Bucket 1, expected loss i.e. all future loss events
May be materially different
Not easy to model
Estimates should use “all available, reasonable and supportable” information
PDs should be forward-looking
Changes in provisions will impact capital
Increase in provisions will lead to decrease in capital under Basel III
Tax?
2012 CONVENTION 16 – 17 OCTOBER
Accounting Standards IFRS9
Next steps
Another exposure draft?
Final standard?
Implementation?
FASB?
2012 CONVENTION 16 – 17 OCTOBER PwC
Projection of Profits
Overview of Approach
Profit cashflow profiles Defaulted loans which are written-off
Defaulted loans which cure
Comparison of Cashflows under IAS39 and IFRS9 Loan balances and profits
Summary of impacts
What does this mean for a Bank’s profits?
12
2012 CONVENTION 16 – 17 OCTOBER
Projection of Profits Aside
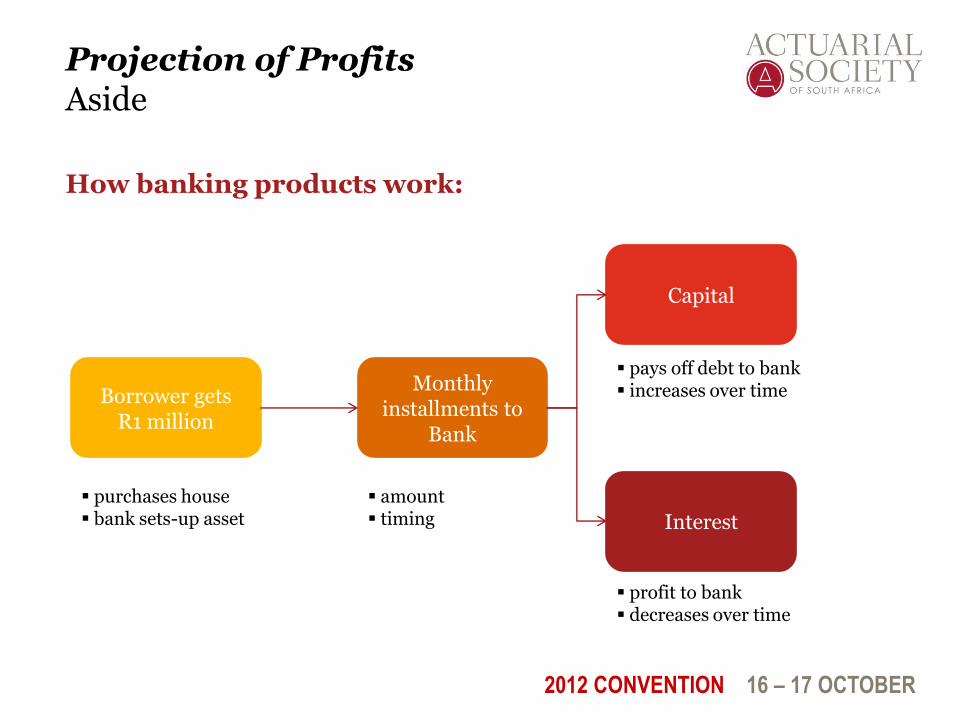
How banking products work:
Borrower gets R1 million
Interest
Capital
Monthly installments to
Bank
purchases house bank sets-up asset
amount timing
pays off debt to bank increases over time
profit to bank decreases over time
2012 CONVENTION 16 – 17 OCTOBER
Projection of Profits Aside
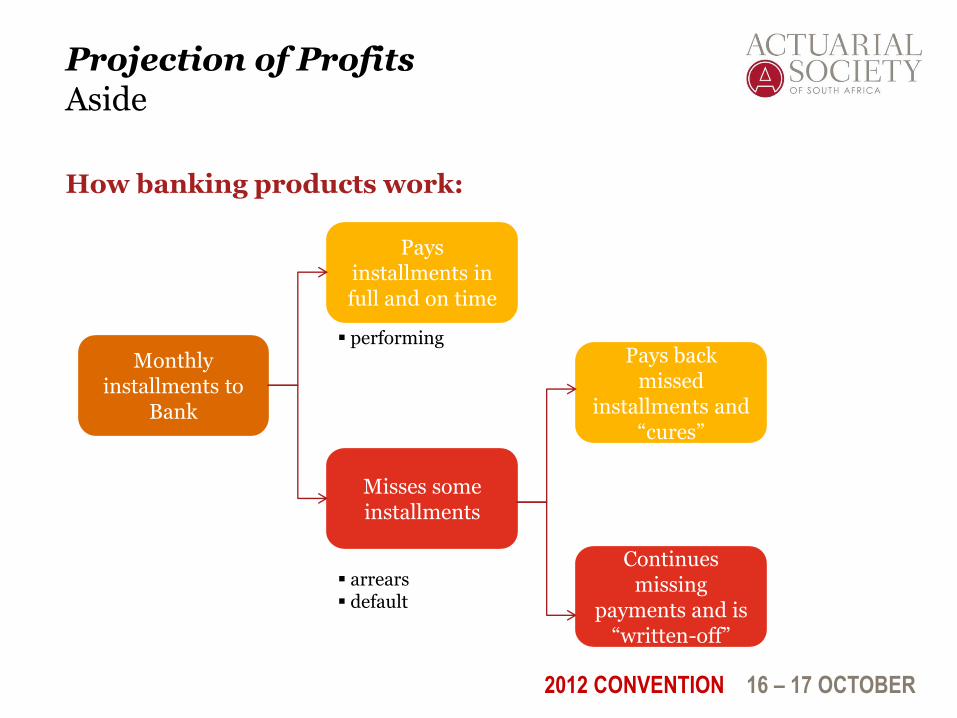
How banking products work:
Misses some installments
Pays installments in full and on time
Monthly installments to
Bank
Continues missing
payments and is “written-off”
Pays back missed
installments and “cures”
arrears default
performing
2012 CONVENTION 16 – 17 OCTOBER
Projection of Profits Overview of Approach
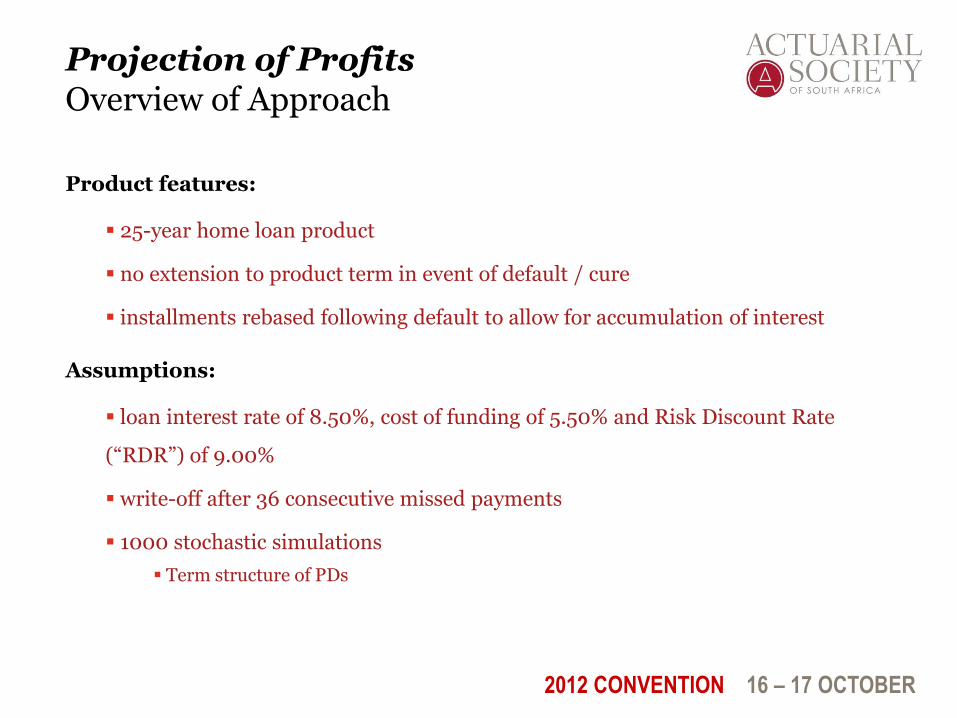
Product features:
25-year home loan product
no extension to product term in event of default / cure
installments rebased following default to allow for accumulation of interest
Assumptions:
loan interest rate of 8.50%, cost of funding of 5.50% and Risk Discount Rate
(“RDR”) of 9.00%
write-off after 36 consecutive missed payments
1000 stochastic simulations
Term structure of PDs
2012 CONVENTION 16 – 17 OCTOBER
Projection of Profits Overview of Approach
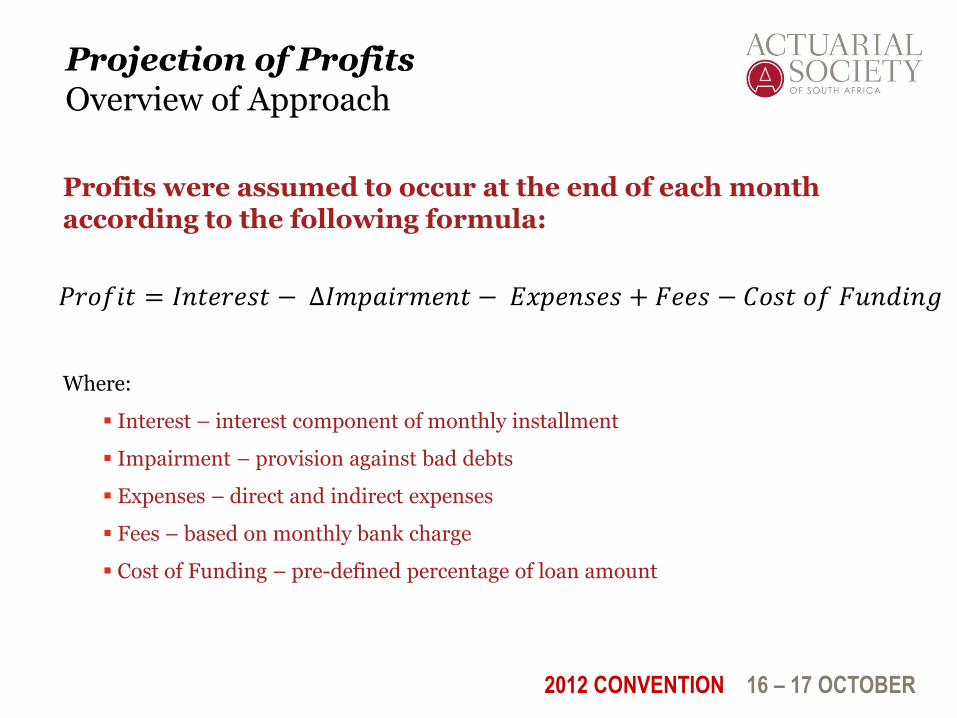
Profits were assumed to occur at the end of each month according to the following formula:
Where:
Interest – interest component of monthly installment
Impairment – provision against bad debts
Expenses – direct and indirect expenses
Fees – based on monthly bank charge
Cost of Funding – pre-defined percentage of loan amount
𝑃𝑟𝑜𝑓𝑖𝑡 = 𝐼𝑛𝑡𝑒𝑟𝑒𝑠𝑡 − ∆𝐼𝑚𝑝𝑎𝑖𝑟𝑚𝑒𝑛𝑡 − 𝐸𝑥𝑝𝑒𝑛𝑠𝑒𝑠 + 𝐹𝑒𝑒𝑠 − 𝐶𝑜𝑠𝑡 𝑜𝑓 𝐹𝑢𝑛𝑑𝑖𝑛𝑔
2012 CONVENTION 16 – 17 OCTOBER
Projection of Profits Profit cashflow profiles
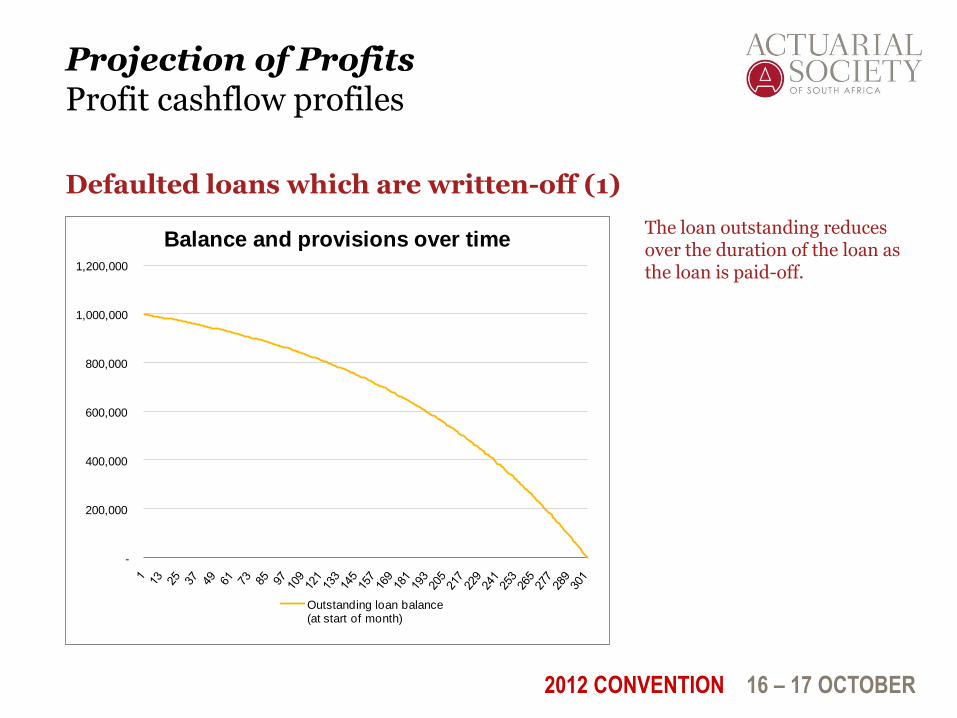
Defaulted loans which are written-off (1)
The loan outstanding reduces over the duration of the loan as the loan is paid-off.
-
200,000
400,000
600,000
800,000
1,000,000
1,200,000
Balance and provisions over time
Outstanding loan balance(at start of month)
2012 CONVENTION 16 – 17 OCTOBER
Projection of Profits Profit cashflow profiles
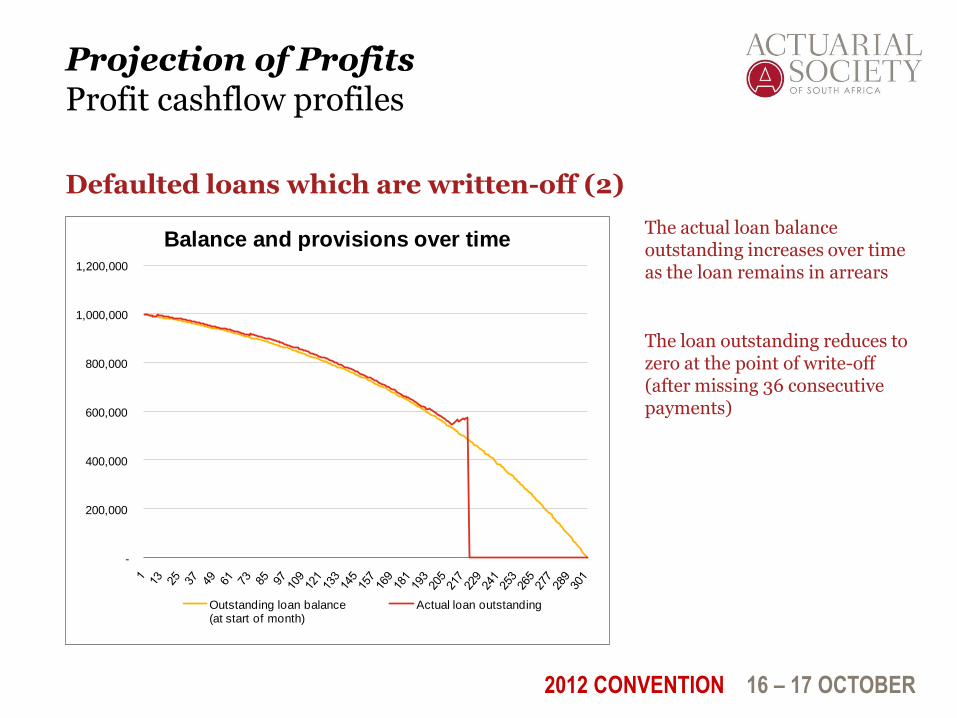
Defaulted loans which are written-off (2)
The actual loan balance outstanding increases over time as the loan remains in arrears
The loan outstanding reduces to zero at the point of write-off (after missing 36 consecutive payments)
-
200,000
400,000
600,000
800,000
1,000,000
1,200,000
Balance and provisions over time
Outstanding loan balance(at start of month)
Actual loan outstanding
2012 CONVENTION 16 – 17 OCTOBER
Projection of Profits Profit cashflow profiles
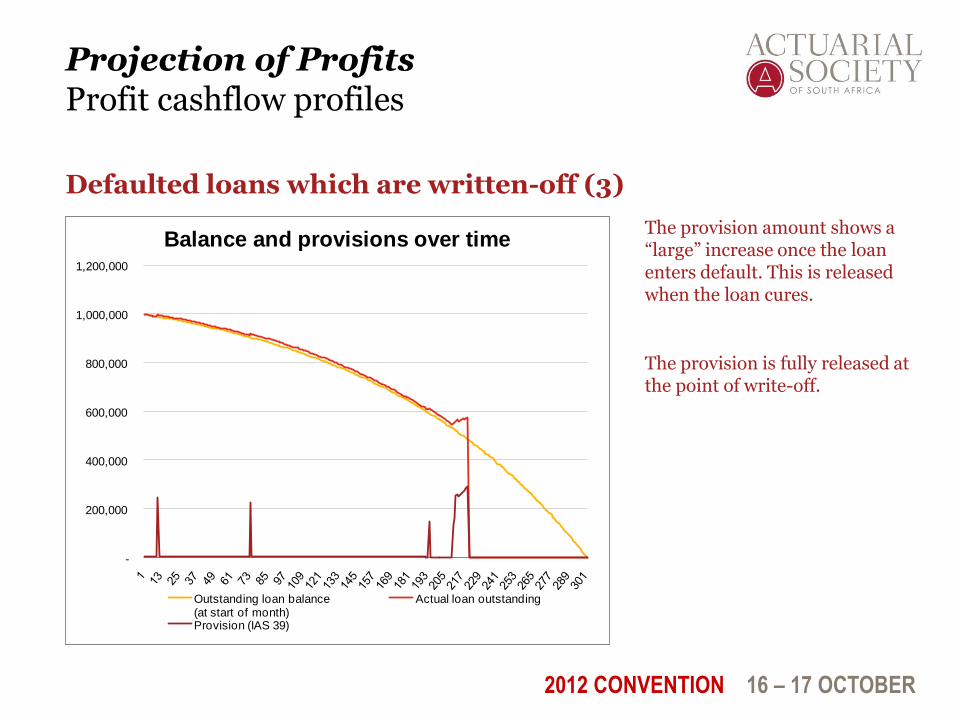
Defaulted loans which are written-off (3)
The provision amount shows a “large” increase once the loan enters default. This is released when the loan cures.
The provision is fully released at the point of write-off.
-
200,000
400,000
600,000
800,000
1,000,000
1,200,000
Balance and provisions over time
Outstanding loan balance(at start of month)
Actual loan outstanding
Provision (IAS 39)
2012 CONVENTION 16 – 17 OCTOBER
Projection of Profits Profit cashflow profiles
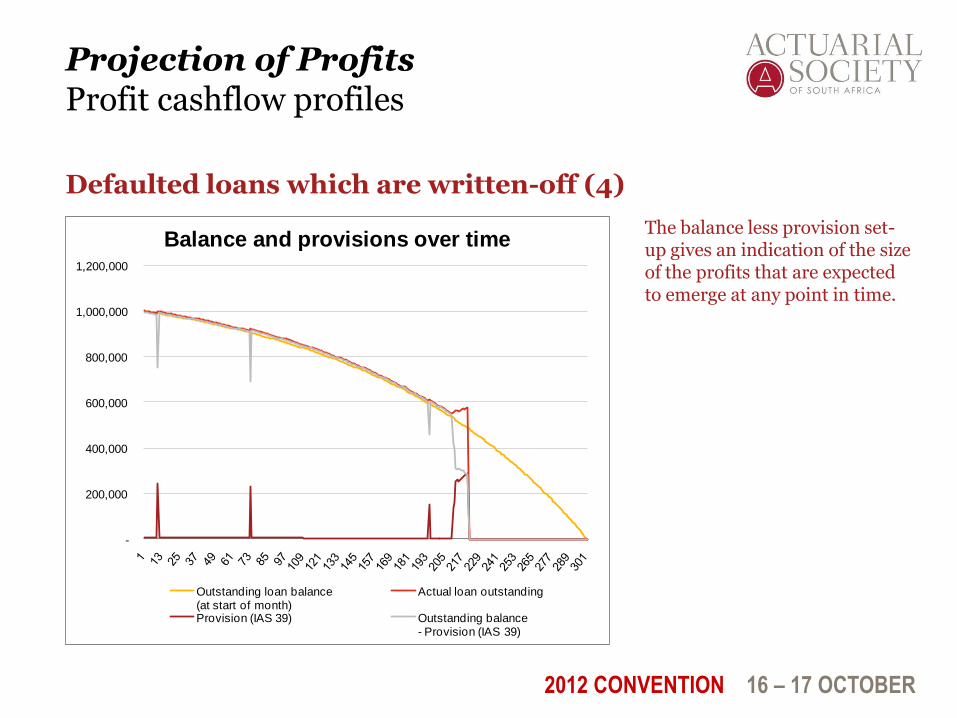
Defaulted loans which are written-off (4)
The balance less provision set-up gives an indication of the size of the profits that are expected to emerge at any point in time.
-
200,000
400,000
600,000
800,000
1,000,000
1,200,000
Balance and provisions over time
Outstanding loan balance(at start of month)
Actual loan outstanding
Provision (IAS 39) Outstanding balance - Provision (IAS 39)
2012 CONVENTION 16 – 17 OCTOBER
Projection of Profits Profit cashflow profiles
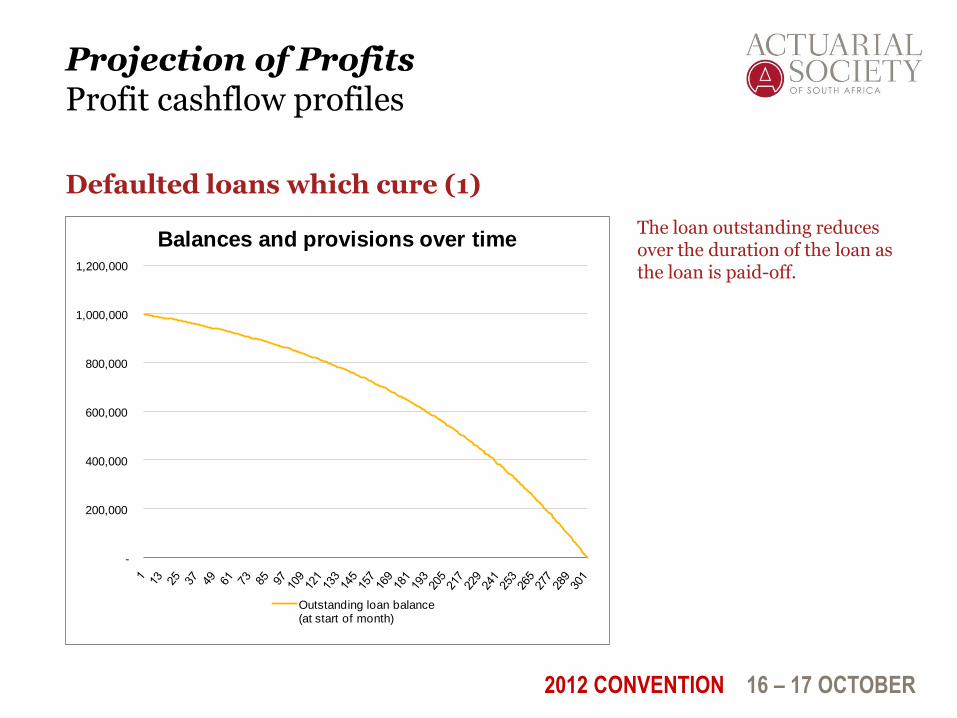
Defaulted loans which cure (1)
The loan outstanding reduces over the duration of the loan as the loan is paid-off.
-
200,000
400,000
600,000
800,000
1,000,000
1,200,000
Balances and provisions over time
Outstanding loan balance(at start of month)
2012 CONVENTION 16 – 17 OCTOBER
Projection of Profits Profit cashflow profiles
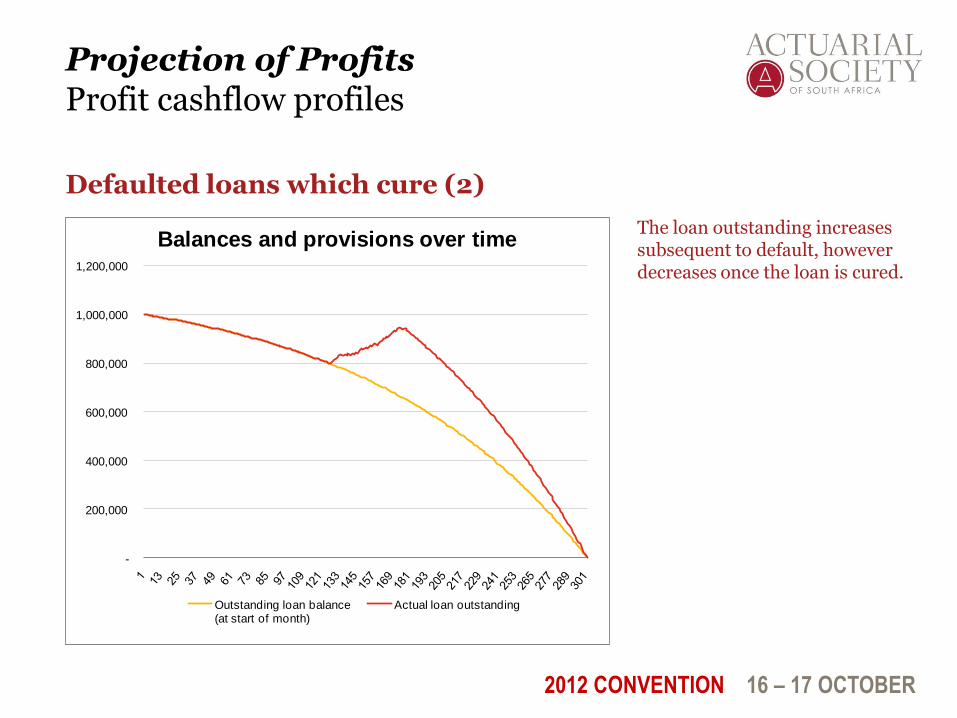
Defaulted loans which cure (2)
The loan outstanding increases subsequent to default, however decreases once the loan is cured.
-
200,000
400,000
600,000
800,000
1,000,000
1,200,000
Balances and provisions over time
Outstanding loan balance(at start of month)
Actual loan outstanding
2012 CONVENTION 16 – 17 OCTOBER
Projection of Profits Profit cashflow profiles
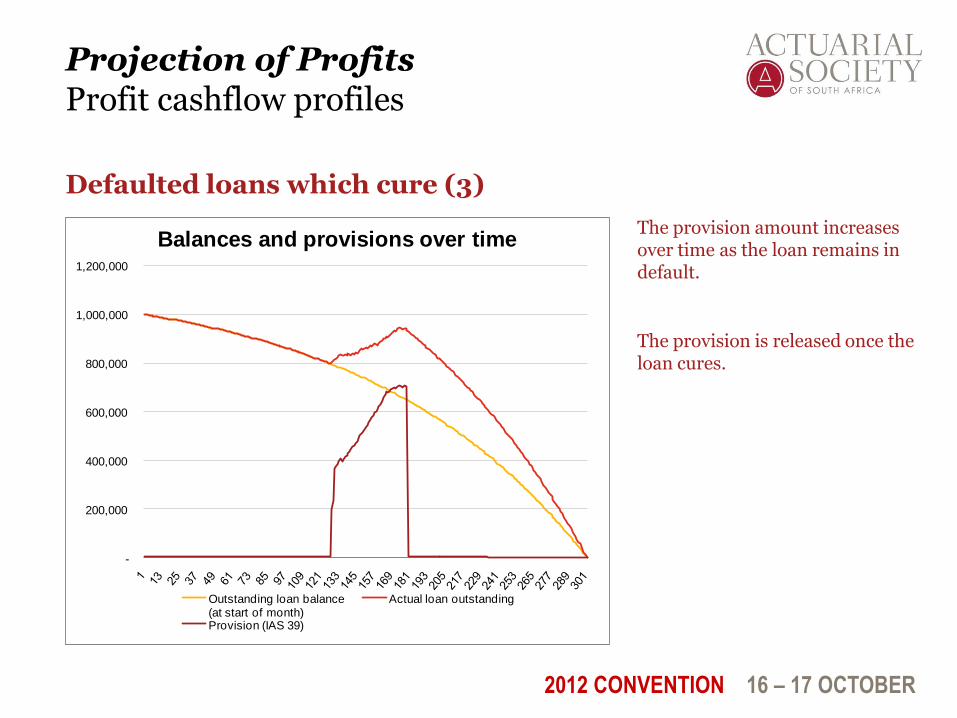
Defaulted loans which cure (3)
The provision amount increases over time as the loan remains in default.
The provision is released once the loan cures.
-
200,000
400,000
600,000
800,000
1,000,000
1,200,000
Balances and provisions over time
Outstanding loan balance(at start of month)
Actual loan outstanding
Provision (IAS 39)
2012 CONVENTION 16 – 17 OCTOBER
Projection of Profits Profit cashflow profiles
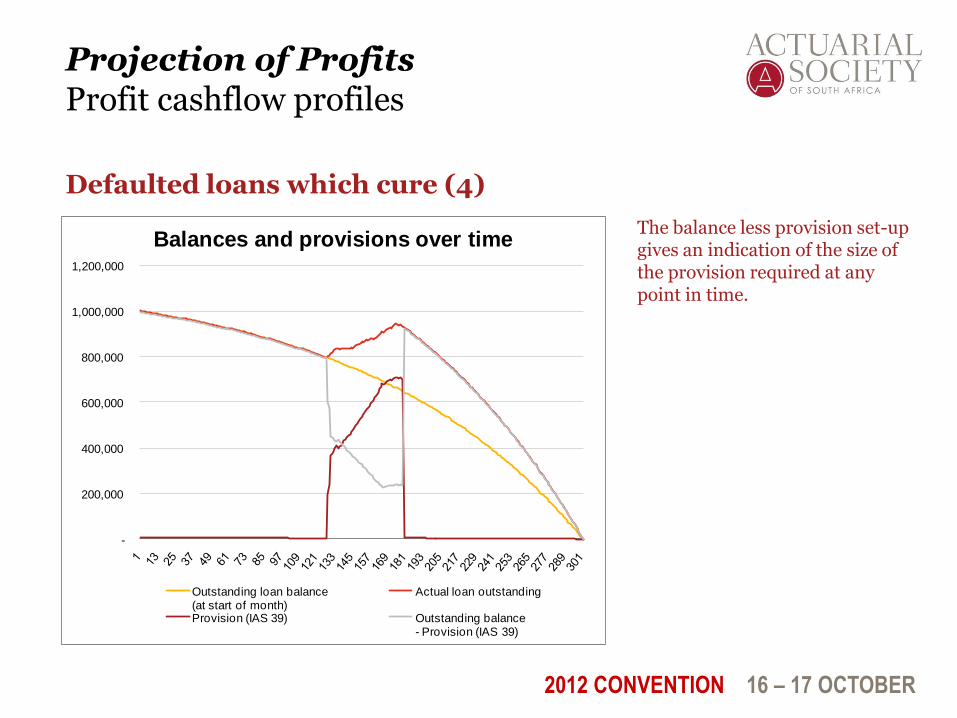
Defaulted loans which cure (4)
The balance less provision set-up gives an indication of the size of the provision required at any point in time.
-
200,000
400,000
600,000
800,000
1,000,000
1,200,000
Balances and provisions over time
Outstanding loan balance(at start of month)
Actual loan outstanding
Provision (IAS 39) Outstanding balance - Provision (IAS 39)
2012 CONVENTION 16 – 17 OCTOBER
Projection of Profits Profit cashflow profiles
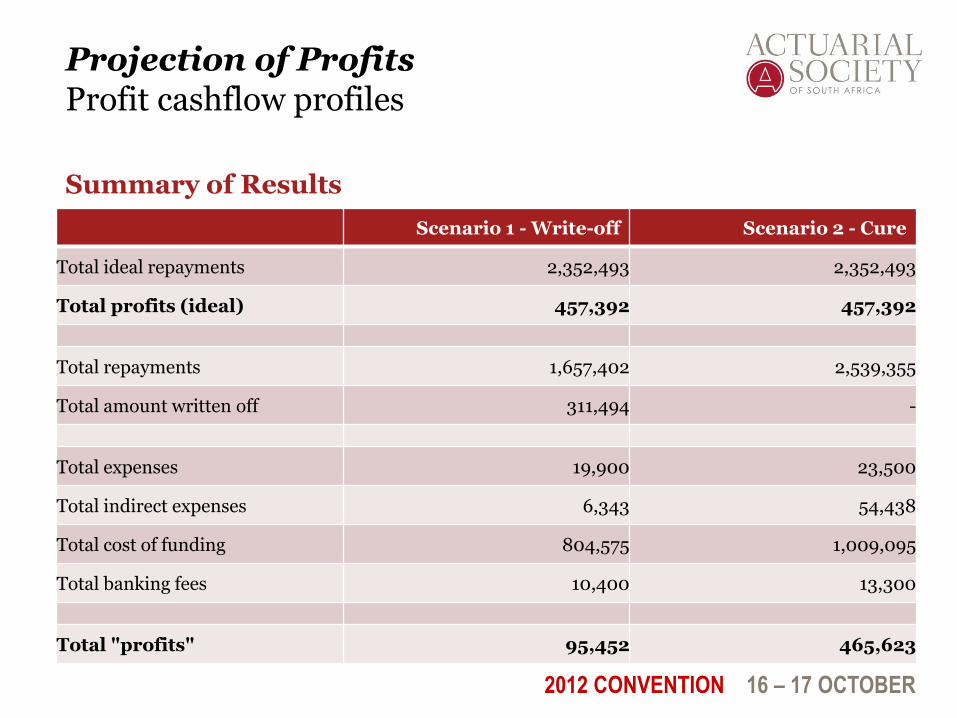
Summary of Results
Scenario 1 - Write-off Scenario 2 - Cure
Total ideal repayments 2,352,493 2,352,493
Total profits (ideal) 457,392 457,392
Total repayments 1,657,402 2,539,355
Total amount written off 311,494 -
Total expenses 19,900 23,500
Total indirect expenses 6,343 54,438
Total cost of funding 804,575 1,009,095
Total banking fees 10,400 13,300
Total "profits" 95,452 465,623
2012 CONVENTION 16 – 17 OCTOBER
Projection of Profits Cashflows under IAS39 and IFRS9
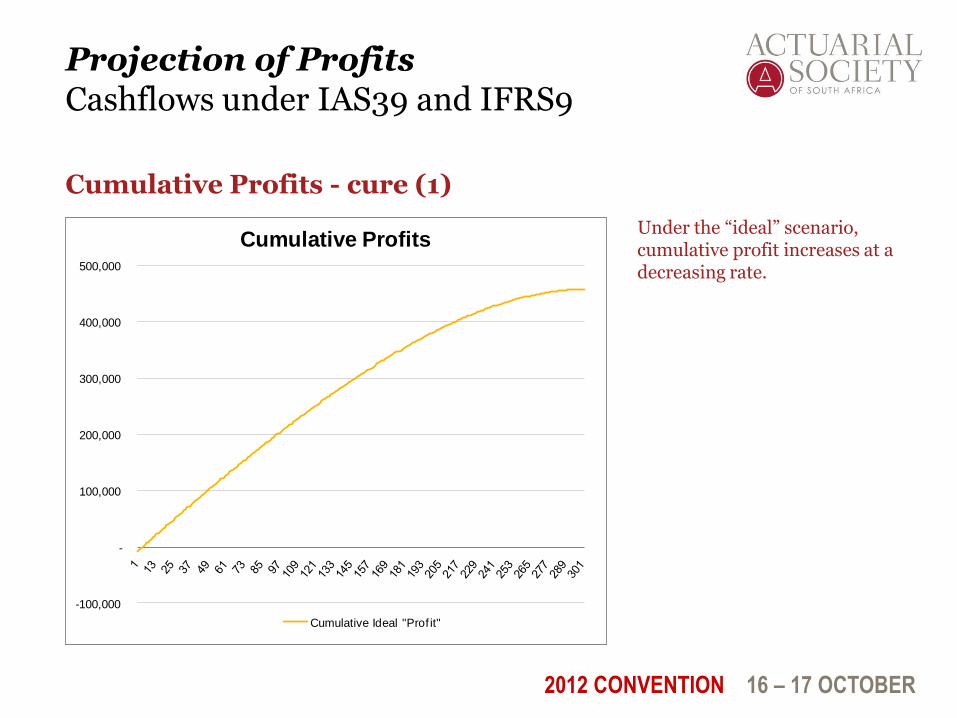
Cumulative Profits - cure (1)
Under the “ideal” scenario, cumulative profit increases at a decreasing rate.
-100,000
-
100,000
200,000
300,000
400,000
500,000
Cumulative Profits
Cumulative Ideal "Prof it"
2012 CONVENTION 16 – 17 OCTOBER
Projection of Profits Cashflows under IAS39 and IFRS9
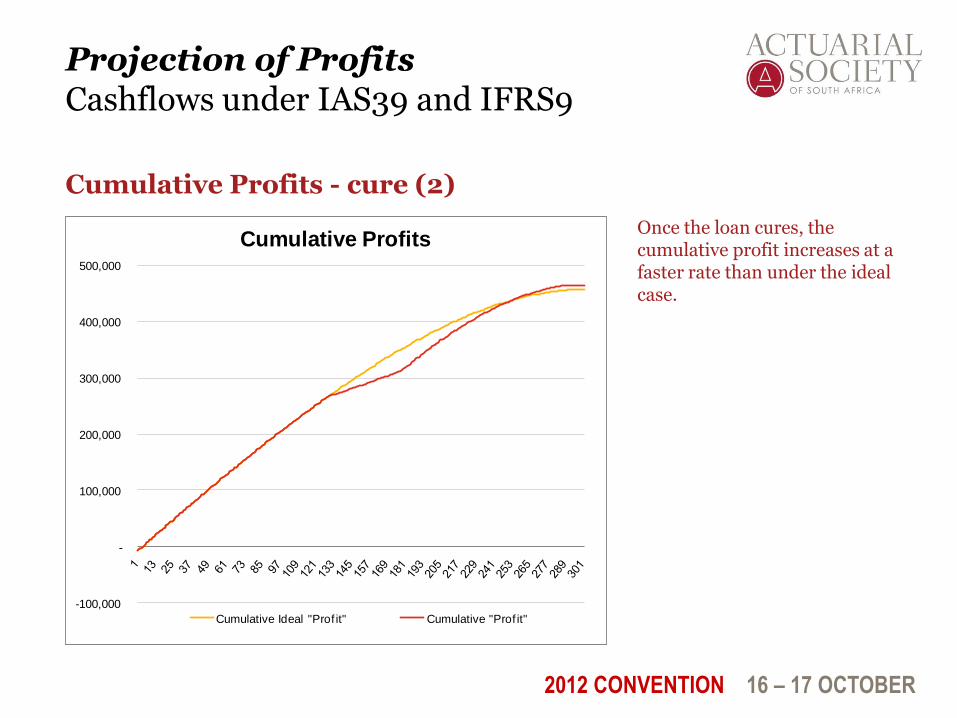
Cumulative Profits - cure (2)
Once the loan cures, the cumulative profit increases at a faster rate than under the ideal case.
-100,000
-
100,000
200,000
300,000
400,000
500,000
Cumulative Profits
Cumulative Ideal "Prof it" Cumulative "Prof it"
2012 CONVENTION 16 – 17 OCTOBER
Projection of Profits Cashflows under IAS39 and IFRS9
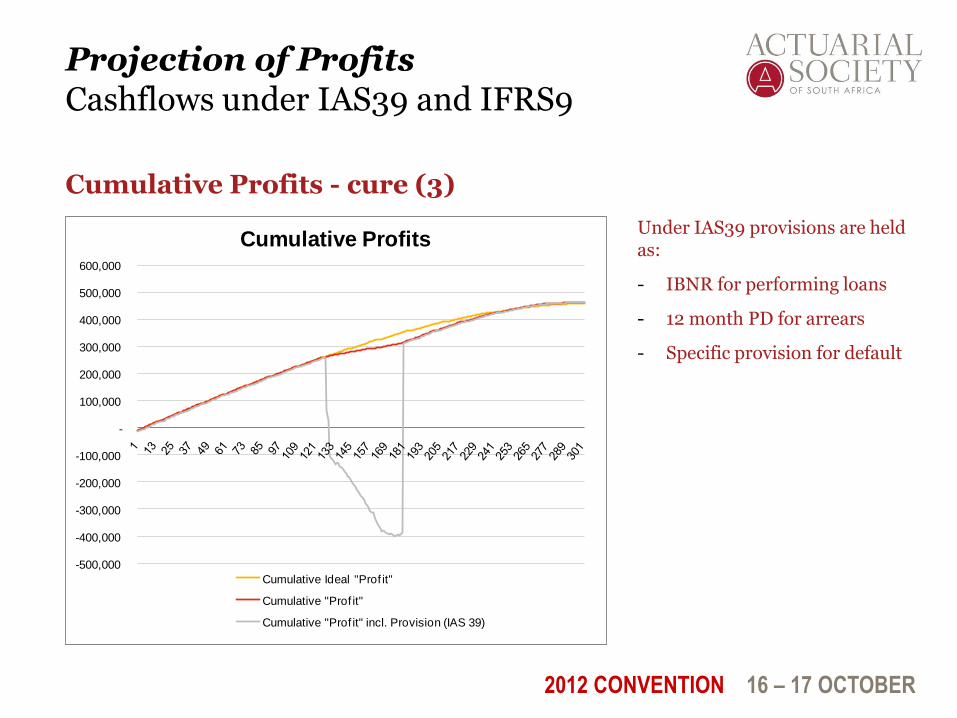
Cumulative Profits - cure (3)
Under IAS39 provisions are held as:
- IBNR for performing loans
- 12 month PD for arrears
- Specific provision for default
-500,000
-400,000
-300,000
-200,000
-100,000
-
100,000
200,000
300,000
400,000
500,000
600,000
Cumulative Profits
Cumulative Ideal "Prof it"
Cumulative "Prof it"
Cumulative "Prof it" incl. Provision (IAS 39)
2012 CONVENTION 16 – 17 OCTOBER
Projection of Profits Cashflows under IAS39 and IFRS9
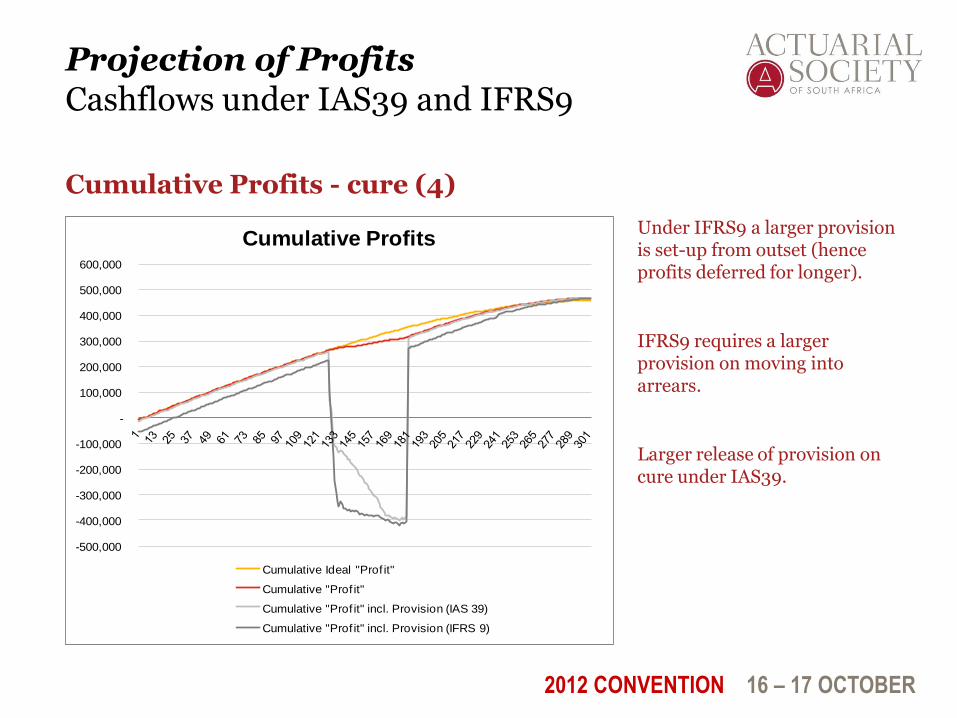
Cumulative Profits - cure (4)
Under IFRS9 a larger provision is set-up from outset (hence profits deferred for longer).
IFRS9 requires a larger provision on moving into arrears.
Larger release of provision on cure under IAS39.
-500,000
-400,000
-300,000
-200,000
-100,000
-
100,000
200,000
300,000
400,000
500,000
600,000
Cumulative Profits
Cumulative Ideal "Prof it"
Cumulative "Prof it"
Cumulative "Prof it" incl. Provision (IAS 39)
Cumulative "Prof it" incl. Provision (IFRS 9)
2012 CONVENTION 16 – 17 OCTOBER
Projection of Profits What does this mean for a Bank’s Profits
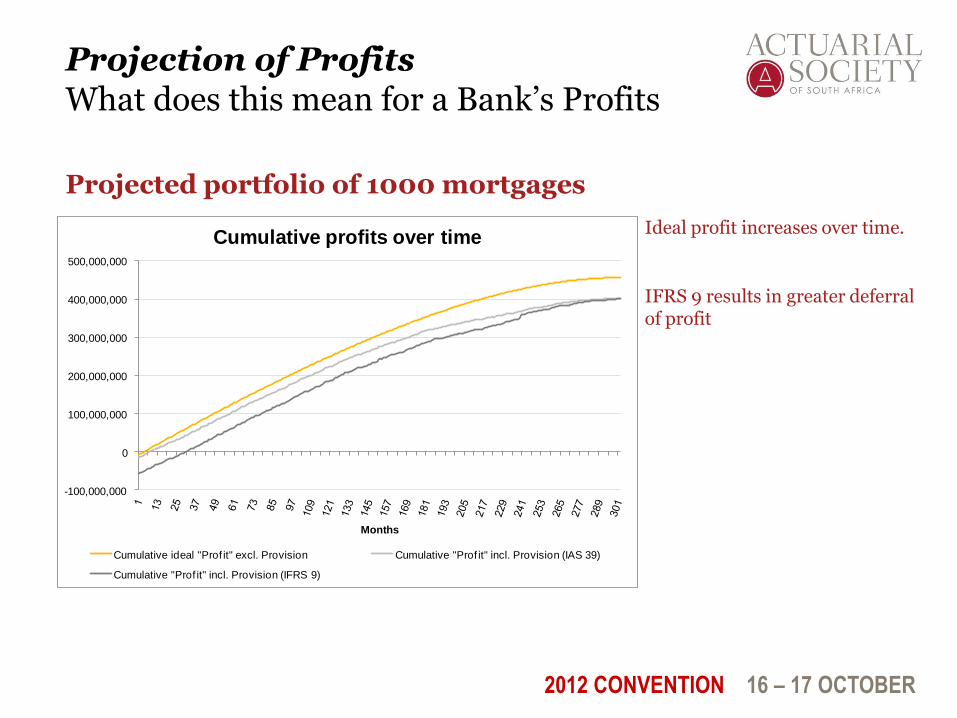
Projected portfolio of 1000 mortgages
Ideal profit increases over time.
IFRS 9 results in greater deferral of profit
-100,000,000
0
100,000,000
200,000,000
300,000,000
400,000,000
500,000,000
Months
Cumulative profits over time
Cumulative ideal "Prof it" excl. Provision Cumulative "Prof it" incl. Provision (IAS 39)
Cumulative "Prof it" incl. Provision (IFRS 9)
2012 CONVENTION 16 – 17 OCTOBER
Projection of Profits What does this mean for a Bank’s Profits
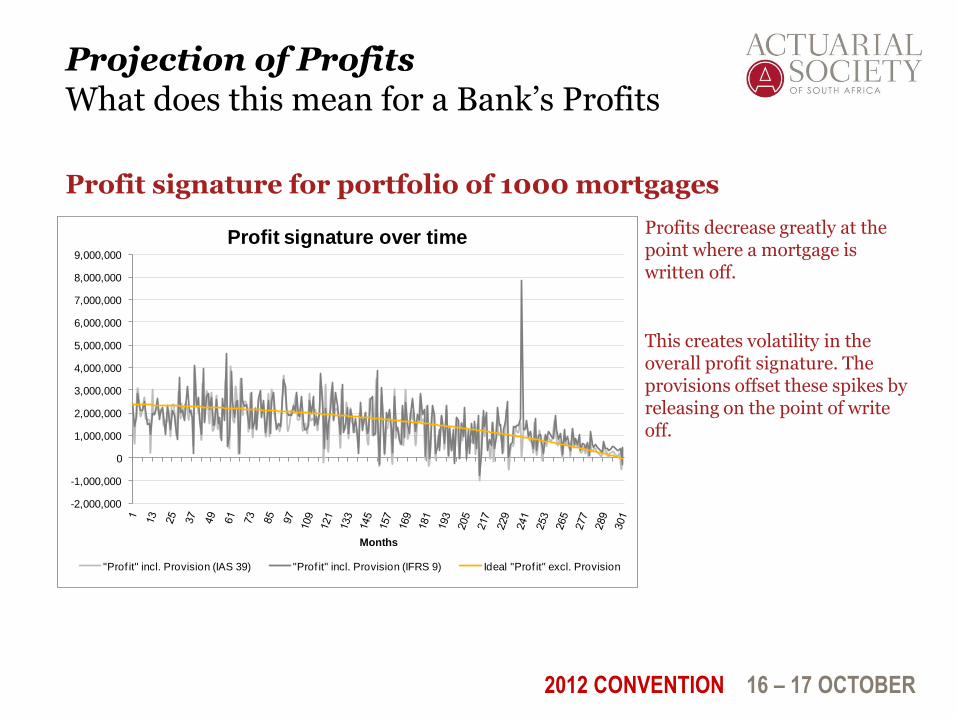
Profit signature for portfolio of 1000 mortgages
Profits decrease greatly at the point where a mortgage is written off.
This creates volatility in the overall profit signature. The provisions offset these spikes by releasing on the point of write off.
-2,000,000
-1,000,000
0
1,000,000
2,000,000
3,000,000
4,000,000
5,000,000
6,000,000
7,000,000
8,000,000
9,000,000
Months
Profit signature over time
"Prof it" incl. Provision (IAS 39) "Prof it" incl. Provision (IFRS 9) Ideal "Prof it" excl. Provision
2012 CONVENTION 16 – 17 OCTOBER
Projection of Profits What does this mean for a Bank’s profits
Conclusions and Limitations
Conclusions:
IFRS9 raises larger provisions from outset of the loan
IFRS9 is expected to delay the recognition of profits for longer than under IAS39
Profit recognition patterns more similar to “ideal” case
Limitations:
Current results based on latest exposure draft
Considered single cohort of similar loans (no new business)
Assumptions made at the start could affect conclusions

2012 CONVENTION 16 – 17 OCTOBER PwC
Value Prospects to Investors
Comparison to conventional insurance Life Insurance Company
2012 CONVENTION 16 – 17 OCTOBER
Value Prospects to Investors Comparison to a conventional insurance
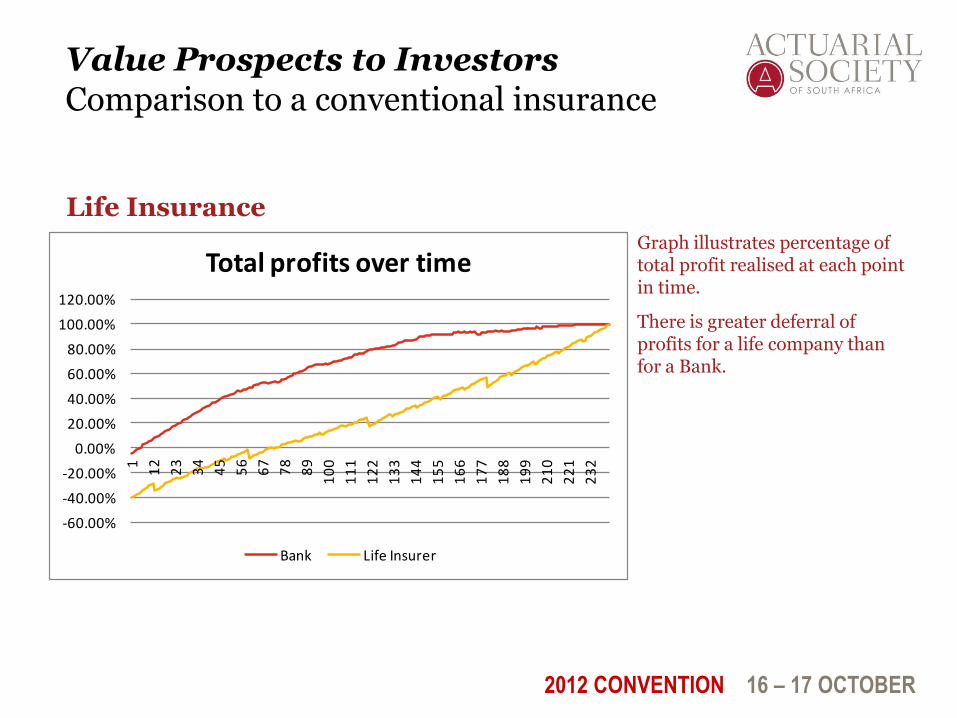
Life Insurance
Graph illustrates percentage of total profit realised at each point in time.
There is greater deferral of profits for a life company than for a Bank.
-60.00%
-40.00%
-20.00%
0.00%
20.00%
40.00%
60.00%
80.00%
100.00%
120.00%
1 12
23
34
45
56
67
78
89
10
0
11
1
12
2
13
3
14
4
15
5
16
6
17
7
18
8
19
9
21
0
22
1
23
2
Total profits over time
Bank Life Insurer
2012 CONVENTION 16 – 17 OCTOBER
Value Prospects to Investors Comparison to a conventional insurance
Comparison to conventional insurers
Conclusions:
IFRS9 more similar to insurance concepts of expected loss
Greater deferral of profits for life insurers than for banks
Products not like-for-like which makes comparison difficult
Short-term companies currently do not calculate embedded values
2012 CONVENTION 16 – 17 OCTOBER PwC
Discussion
Thank you:
Michel Mouton
Jonathan Havemann
Corne Conradie


![The Dilemma [Chapter 1: The Dilemma , Exponential Future]](https://img.pdfslide.net/doc/110x75/58eeb6841a28ab38788b4593/the-dilemma-chapter-1-the-dilemma-exponential-future.jpg)