Embed Size (px)
Citation preview
A Baseline Report on the State of Racial Disparities in Dane County
R a i s i n g V o i c e s t o M a k e E v e r y K i d C o u n t
WISCONSIN COUNCIL ON
children&families
renfamilies
Foreword.............................................................................................................................................................2
Section I: Overview of the “Race to Equity” Project..............................................................................................3Origin of the Project..........................................................................................................................................3Initial Scope of the Project..................................................................................................................................4A Quick Snapshot of Dane County’s African American Population Numbers.................................................................5
Section II: What the Data Tells Us about the State of Dane County Racial Disparities in 2013...............................6 The Exceptional Magnitude of Dane County’s Black/White Disparities........................................................................7Dane County Blacks Generally Fare Less Well than African Americans Living Elsewhere in the State and Nation...............12The Racialization of Poverty and Disadvantage in Dane County...............................................................................15The Costs and Consequences of Racialized Disadvantage........................................................................................15
Section III: The Forces and Factors Contributing to Dane County’s Challenging Racial Disparities Crisis..............16 The Mismatch Between Our Labor Market and Our Low-Income Workforce...............................................................16The Challenge of Small, Under-Resourced, and Disconnected Neighborhoods...........................................................18The Need for Madison and Dane County to Respond More Effectively, Inclusively, and Accountably to Our Growing Racial
Equity Challenge........................................................................................................................................21
Conclusion: Lessons and Next Steps...................................................................................................................24
Postscript: Summary of Data Collection Issues...................................................................................................27Data Sources..................................................................................................................................................27Types and Categories of Data Being Collected.......................................................................................................27The Strengths and Limitations of Our Current Data Base........................................................................................28
Appendix 1: Data Tables on Baseline Disparity Measures Appendix 2: Maps (Prepared by Capital Area Regional Planning Commission)
Contents of Report
2
The following Baseline Report, authored by the Race to Equity Project team, summarizes our first year of data collection, analysis and community feedback -- all aimed at promoting greater public awareness and understanding of the depth and breadth of the racial disparities that differentiate the white and black experience in Dane County, Wisconsin. Our goal for this report is to lay the data groundwork for a sustained community-wide effort to address the dis-parities we found. This is our first report, not a final report. Going forward, we hope to update our numbers and track our progress on an annual basis. We also hope to expand the scope of our data to include well-being measures for the Hispanic, Asian, and Native American populations, as thor-oughly as available data permits. Our observations about causes and solutions in this report are likewise very preliminary. Many of them came from audience comments offered in response to the data presentations we have made to scores of groups over the last ten months. Others of our observations have been shaped by the views of local and national thought leaders in the race disparity arena who were kind enough to review our data and share their reactions.
The preliminary findings and suggestions included in this report are not offered to settle discourse, but to deepen it. We look forward to the YWCA Annual Racial Justice Summit, which will use our baseline data as a launching pad for an inclusive and sustained community conver-sation aimed at moving our county and city away from disparity and toward a more authentic equality of opportunity. We are indebted to more people than we can name for helping us with this work. The Annie E. Casey Foundation has been our principal funder as well as a valued advisor. The Wiscon-sin Council on Children and Families has been our supportive and committed host. The YWCA, Forward Community Investments, the Urban League, Dane County Human Services, the Office of the Mayor of Madison, and the Office of the County Executive have all been early and much ap-preciated allies. Most of all, we want to thank the hundreds of Dane County residents who took the time to listen to our numbers, to evaluate our ideas, and to ask challenging questions. We especially appreciate the many folks from all backgrounds who have gone out of their way to encourage us to pursue our goal of helping make a difference. Erica Nelson Project Director Race to Equity
FoRewoRd
3A project of the Wisconsin Council on Children and Families
Origin of the ProjectA little over 18 months ago, the Wisconsin Council on Children and Families, with support from the Annie E. Casey Foundation, launched a multi-year initia-tive known as Race to Equity. The central goal of the project is to explore, measure, and analyze the extent and pattern of racial disparities on key well-being and outcome measures between African Americans1 and whites living in Dane County, Wisconsin. Our long-term aspiration is to use this data and analysis as a foundation for advancing collective action towards solutions.
The Project was initially inspired by a handful of recent local and national studies that suggested that Dane County was home to some stunningly wide black/white disparities on several significant outcome mea-sures, especially those relating to the criminal justice system and to educational achievement. In fact, in several national comparison studies looking at juvenile and adult justice system data, Wisconsin and Dane County were frequently ranked among the jurisdic-tions having the widest arrest and incarceration dis-parities in the country. Similarly, the growing local concern over the educational achievement gap here in Dane County has brought to light some distressingly
1 In this report, we use the racial descriptors “black” and “African American” interchangeably, following the practice of our prin-cipal source materials, including US Census Reports and Sur-veys. While there are many opinions about the most appropriate terminology, there is no settled convention on the subject. Our decision was to use the language that we thought best contrib-uted to clarity and readability. We ask our readers not to draw any conclusions based on our use of any particular term at any particular time.
wide racial disparity numbers in county test scores, graduation rates, and college attendance.
The problematic patterns found in these justice and school system-focused reports were also reinforced by a handful of “snapshot” studies aimed at describing the overall condition and progress of minority communi-ties in Dane County. In 2009, for example, the local Urban League published a report entitled “The State of Black Madison,” which showed surprisingly high unemployment and poverty levels alongside discour-agingly low business ownership, home ownership, and wealth accumulation rates for Madison’s African American community.
To those of us who launched this initiative, these various but scattered statistical portraits of significant minority disadvantage appeared at odds with a com-mon perception of Dane County as a place of positive opportunity and well-being for children and families. This is a region with a comparatively high level of eco-nomic vitality and stability -- with a labor market that has enjoyed comparatively low aggregate unemploy-ment rates, even through the current severe national recession. Compared to most places in the U.S., Dane County has a well-educated workforce, a fairly high median household income, a statistically strong middle class, and healthy levels of homeownership and net per capita wealth.
Madison and Dane County are also home to high quality public school systems, with well qualified and dedicated faculty, that broadly produce solid academic achievement, graduation, and post-secondary enroll-ment results for the majority of their students. The
SeCtion i: oveRview oF the “RaCe to equity” PRojeCt
4 A publication of Race to Equity
region hosts a number of public and private post-secondary institutions which offer a wide range of advanced academic, technical, and vocational train-ing. In addition, Dane County has an established and earned reputation for well-resourced human service systems, including quality social, family, mental health, employment, youth development, child welfare, juve-nile justice, public safety, and health services. Finally, Madison and Dane County have long been known for their support of “progressive” social, economic, and political values. Although a predominantly white com-munity throughout most of its history, many in Dane County have taken pride in being welcoming, support-ive of inclusion and diversity, and firmly opposed to racial, ethnic, sexual orientation, and gender prejudice and discrimination in all their forms.
The desire to understand the seeming paradox between reputation and reality was an important motive be-hind the creation of the Race to Equity Project. Could a place as prosperous, resourceful, and progressive as Dane County also be home to some of the most pro-found, pervasive, and persistent racial disparities in the country? And if that is actually the case, how do we begin to understand the causes and contributors behind the troubling data in ways that will allow us to fashion short- and long-term community strategies and actions that can result in greater equality of opportunity and outcomes for all groups within our city and county? Initial Scope of the ProjectAt the outset of our planning for this project, we envi-sioned putting together an initial report that encom-passed all the major racial and ethnic groups in the county. An initial evaluation of the quality and com-pleteness of available statistics, however, persuaded us
that we should begin our data collection and analysis with a primary focus on African Americans, and on how that group’s numbers contrasted with those of the county’s white majority. We recognized, of course, that significant disparities (with whites) also exist for other communities of color: Hispanics, Asians, and Native Americans. And we fully realize the equal impor-tance of addressing the equity challenges that each of these other groups face. Nonetheless, several practical considerations argued for beginning with the county’s African American population. First, there is simply clearer and more complete demographic, economic, and programmatic data on the black population than on the county’s other racial and ethnic minorities. (This is, in part, because of the non-uniformity in the way different data sets define “Hispanic”; the diversity of language, cultural, historical and national origin fac-tors encompassed in the “Asian” category; and the rela-tively small size of the Native American population.) Second, early exploration of the data revealed that pat-terns of disparities for blacks were even more severe on many key indicators than they were for Hispanics and Asians. Third, the Project’s core staff brought greater academic, personal, and cultural expertise and famil-iarity with the African American experience than with that of other communities of color within the county. All that said, it remains our hope and intention that if we use our core competencies to demonstrate effective ways of collecting, presenting, analyzing, and acting on the disparity data as it affects the black community, we will have a strong foundation for securing the addi-tional resources, partnerships, and increased capacity needed to extend this kind of equity advocacy to all communities of color in the next phase of the work.
For now, we believe that we have a sufficient array of
5A project of the Wisconsin Council on Children and Families
accurate and trackable numbers to assemble an objec-tive, comprehensive, and powerful description of the wide gaps in opportunity, resources, outcomes and well-being which currently differentiate Dane County’s black minority from its white majority. The available data, in other words, is more than adequate to convey the breadth, depth, and pervasiveness of the racial equity challenge Dane County confronts.
The range of indicators for which we have solid data is also diverse and complete enough to foster informed discussion and debate about the causes, forces, factors, and interconnections underlying what are indisputably severe and persisting inequalities. The evidence base
for the problem analysis, in turn, is complete enough to support community-wide conversations about the short- and long-term investments, initiatives, and ac-tions that could help move us toward greater equity. Finally, the data we are collecting are sufficiently up-datable to allow us to produce periodic public reports on the extent to which the county is making progress over time. In short, it is our belief that the tracking of these core disparity statistics will foster a far higher degree of public accountability for assuring a more level playing field in the years ahead for all who live in Dane County. (For a more thorough discussion of all the data issues, including their limitations, See “Post-scripts: Summary of Data Collection”).
A Quick Snapshot of Dane County’s African American Population Numbers The total population of Dane County, as reported in the 2010 Census, was just over 488,000. Of that to-tal, African Americans numbered 31,300, or about 6.5%. The African American population, as calculated from the 2010 Census, is made up of 25,347 individu-als identifying themselves as “black-only” and 5,953 as “black with another race.” The African American child population (under 18) in 2010 was 8,804 or almost 8.5% of county’s total child population. In that same year, African American students accounted for about 20% of the total enrollment in Madison’s public schools, and about 17% of all students enrolled in pub-lic schools countywide. African American adults (over 18) made up just over 5% of the county’s total number of adults.
Between 2000 and 2010, the county’s total African American population increased by almost 50%, from 20,241 to 31,300. Over the past 40 years, the number of African Americans living in the county grew almost ten-fold. In 2010, African Americans constituted the most populous community of color in the county, followed closely by even faster growing populations of Hispanics (28,925 in 2010) and Asians (26,698 in 2010). More than half of Dane County’s black popula-tion lives within the City of Madison, while the rest reside elsewhere in the county.
6A publication of Race to Equity
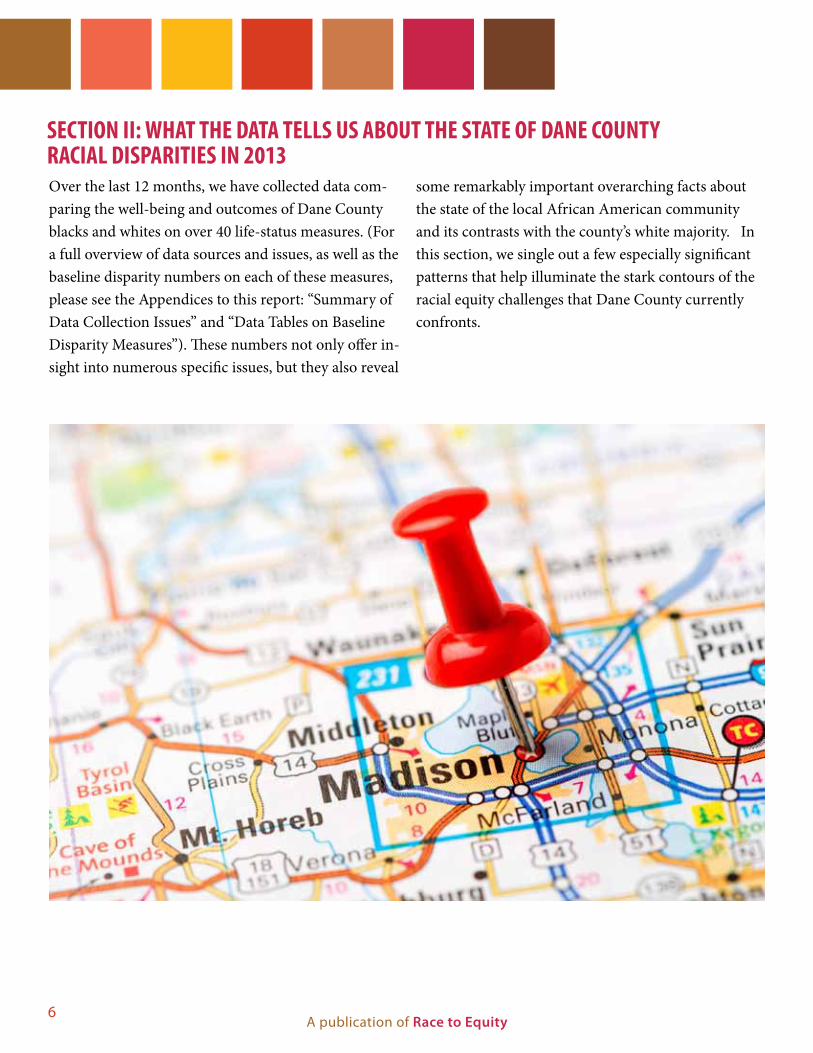
Over the last 12 months, we have collected data com-paring the well-being and outcomes of Dane County blacks and whites on over 40 life-status measures. (For a full overview of data sources and issues, as well as the baseline disparity numbers on each of these measures, please see the Appendices to this report: “Summary of Data Collection Issues” and “Data Tables on Baseline Disparity Measures”). These numbers not only offer in-sight into numerous specific issues, but they also reveal
some remarkably important overarching facts about the state of the local African American community and its contrasts with the county’s white majority. In this section, we single out a few especially significant patterns that help illuminate the stark contours of the racial equity challenges that Dane County currently confronts.
SeCtion ii: what the data teLLS uS aBout the State oF dane County RaCiaL diSPaRitieS in 2013
7A project of the Wisconsin Council on Children and Families
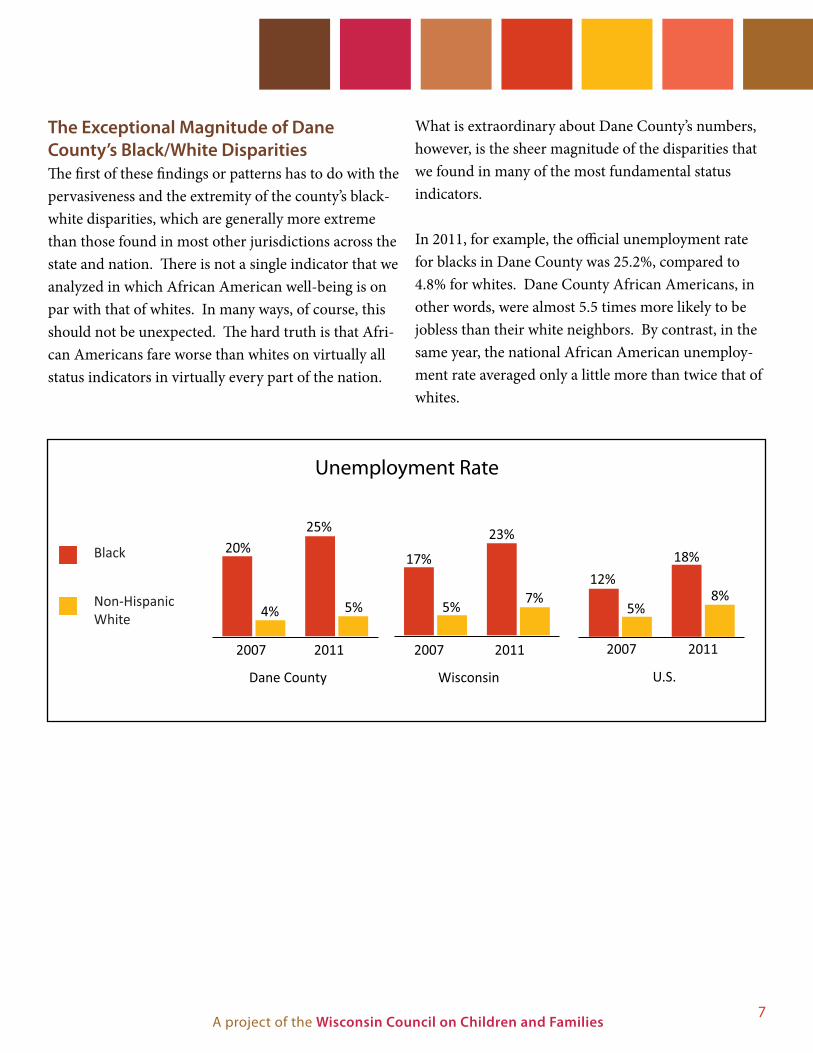
The Exceptional Magnitude of Dane County’s Black/White DisparitiesThe first of these findings or patterns has to do with the pervasiveness and the extremity of the county’s black-white disparities, which are generally more extreme than those found in most other jurisdictions across the state and nation. There is not a single indicator that we analyzed in which African American well-being is on par with that of whites. In many ways, of course, this should not be unexpected. The hard truth is that Afri-can Americans fare worse than whites on virtually all status indicators in virtually every part of the nation.
What is extraordinary about Dane County’s numbers, however, is the sheer magnitude of the disparities that we found in many of the most fundamental status indicators. In 2011, for example, the official unemployment rate for blacks in Dane County was 25.2%, compared to 4.8% for whites. Dane County African Americans, in other words, were almost 5.5 times more likely to be jobless than their white neighbors. By contrast, in the same year, the national African American unemploy-ment rate averaged only a little more than twice that of whites.
Dane County Wisconsin U.S.
Black
Non-HispanicWhite
2007 2011
4%
20%
5%
25%
17%
5%
23%18%
5%
12%8%7%
2007 2011 20112007
Unemployment Rate
8A publication of Race to Equity
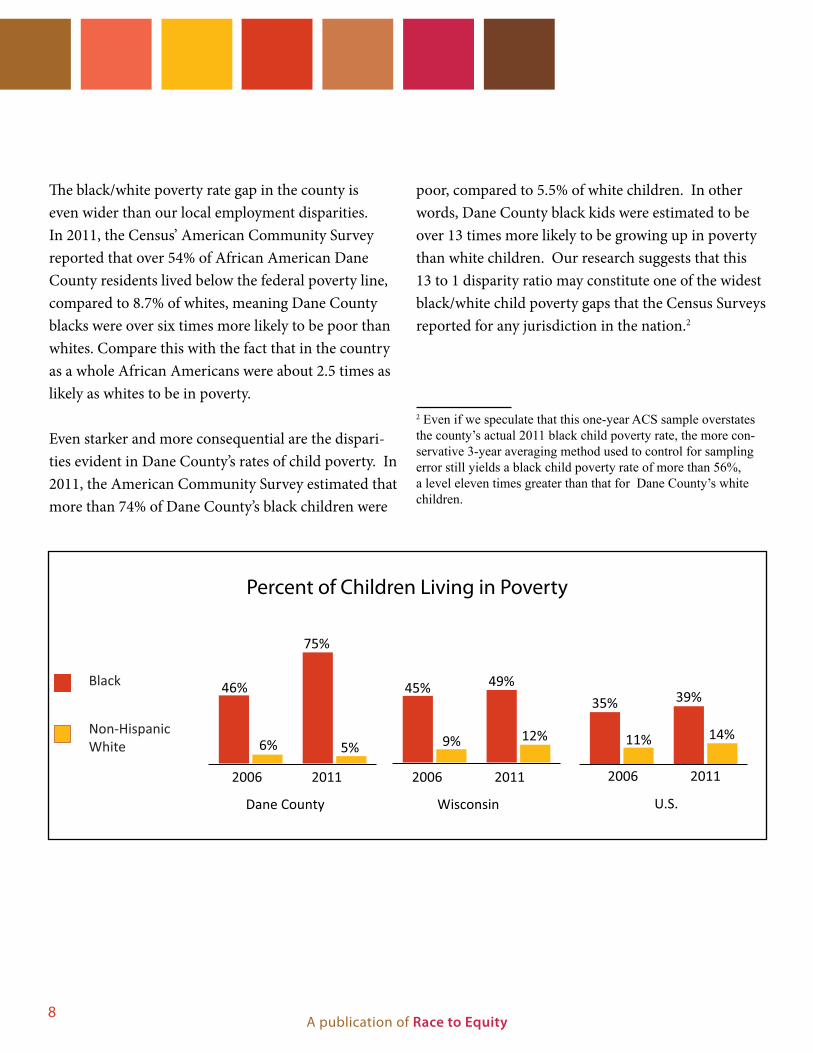
The black/white poverty rate gap in the county is even wider than our local employment disparities. In 2011, the Census’ American Community Survey reported that over 54% of African American Dane County residents lived below the federal poverty line, compared to 8.7% of whites, meaning Dane County blacks were over six times more likely to be poor than whites. Compare this with the fact that in the country as a whole African Americans were about 2.5 times as likely as whites to be in poverty. Even starker and more consequential are the dispari-ties evident in Dane County’s rates of child poverty. In 2011, the American Community Survey estimated that more than 74% of Dane County’s black children were
poor, compared to 5.5% of white children. In other words, Dane County black kids were estimated to be over 13 times more likely to be growing up in poverty than white children. Our research suggests that this 13 to 1 disparity ratio may constitute one of the widest black/white child poverty gaps that the Census Surveys reported for any jurisdiction in the nation.2
2 Even if we speculate that this one-year ACS sample overstates the county’s actual 2011 black child poverty rate, the more con-servative 3-year averaging method used to control for sampling error still yields a black child poverty rate of more than 56%, a level eleven times greater than that for Dane County’s white children.
Black
Non-HispanicWhite
Dane County
2006 2011
6%
46%
5%
75%
45%
9%
49%39%
11%
35%
14%12%
2006 2011 20112006
Wisconsin U.S.
Percent of Children Living in Poverty
9A project of the Wisconsin Council on Children and Families
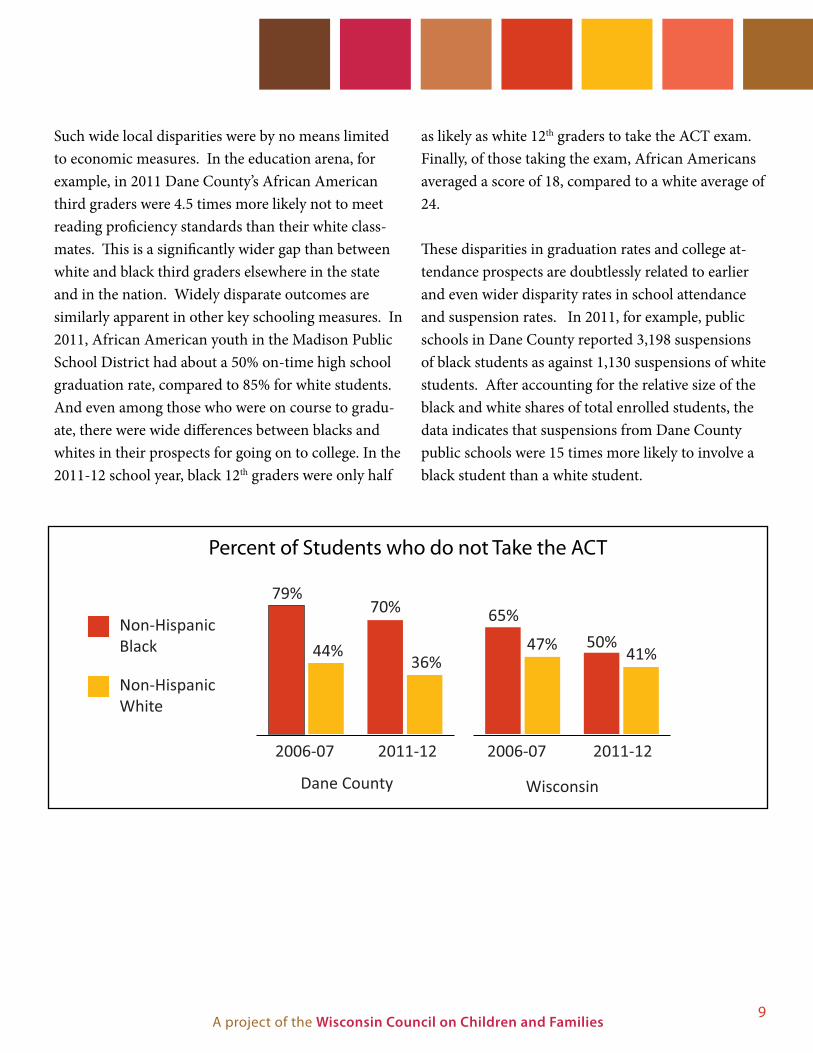
Such wide local disparities were by no means limited to economic measures. In the education arena, for example, in 2011 Dane County’s African American third graders were 4.5 times more likely not to meet reading proficiency standards than their white class-mates. This is a significantly wider gap than between white and black third graders elsewhere in the state and in the nation. Widely disparate outcomes are similarly apparent in other key schooling measures. In 2011, African American youth in the Madison Public School District had about a 50% on-time high school graduation rate, compared to 85% for white students. And even among those who were on course to gradu-ate, there were wide differences between blacks and whites in their prospects for going on to college. In the 2011-12 school year, black 12th graders were only half
as likely as white 12th graders to take the ACT exam. Finally, of those taking the exam, African Americans averaged a score of 18, compared to a white average of 24.
These disparities in graduation rates and college at-tendance prospects are doubtlessly related to earlier and even wider disparity rates in school attendance and suspension rates. In 2011, for example, public schools in Dane County reported 3,198 suspensions of black students as against 1,130 suspensions of white students. After accounting for the relative size of the black and white shares of total enrolled students, the data indicates that suspensions from Dane County public schools were 15 times more likely to involve a black student than a white student.
Dane County
2006-07 2011-12
79%
44%
70%
36%
65%
47% 50%41%
2006-07 2011-12
Wisconsin
Non-HispanicBlack
Non-HispanicWhite
Percent of Students who do not Take the ACT
10A publication of Race to Equity
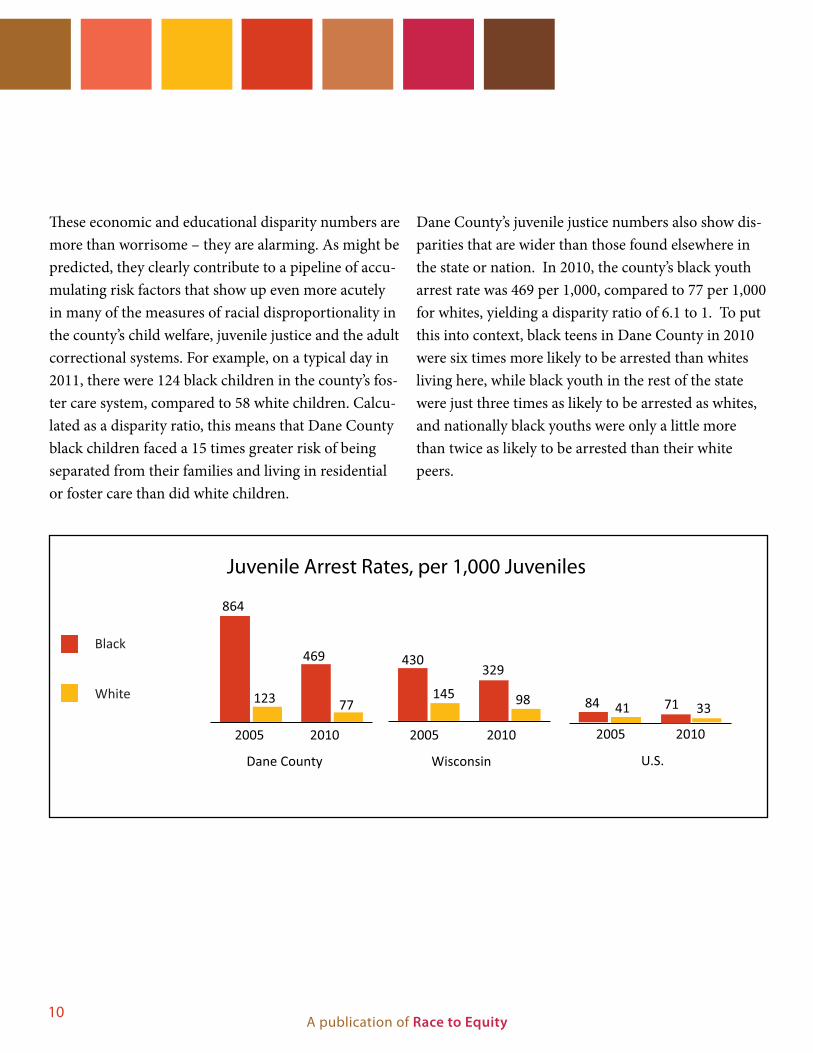
These economic and educational disparity numbers are more than worrisome – they are alarming. As might be predicted, they clearly contribute to a pipeline of accu-mulating risk factors that show up even more acutely in many of the measures of racial disproportionality in the county’s child welfare, juvenile justice and the adult correctional systems. For example, on a typical day in 2011, there were 124 black children in the county’s fos-ter care system, compared to 58 white children. Calcu-lated as a disparity ratio, this means that Dane County black children faced a 15 times greater risk of being separated from their families and living in residential or foster care than did white children.
Dane County’s juvenile justice numbers also show dis-parities that are wider than those found elsewhere in the state or nation. In 2010, the county’s black youth arrest rate was 469 per 1,000, compared to 77 per 1,000 for whites, yielding a disparity ratio of 6.1 to 1. To put this into context, black teens in Dane County in 2010 were six times more likely to be arrested than whites living here, while black youth in the rest of the state were just three times as likely to be arrested as whites, and nationally black youths were only a little more than twice as likely to be arrested than their white peers.
Black
White
Dane County
2005 2010
123
864
77
469 430
145
329
714184 3398
2005 2010 20102005
Wisconsin U.S.
Juvenile Arrest Rates, per 1,000 Juveniles
11A project of the Wisconsin Council on Children and Families
The racial disparities in juvenile justice sanctions and dispositions are large as well. In 2011, a Dane County African American youth was 15 times more likely to spend time in the county’s secure detention program than a white youth. Statistics from the same year suggest that Dane County black youths were 25 times more likely to be sent to the state’s secure facil-ity at Lincoln Hills than whites. The striking result of these disparities is that African American adolescents, while constituting less than 9% of the county’s youth population, made up almost 80% of all the local kids sentenced to the state’s juvenile correctional facility in 2011.
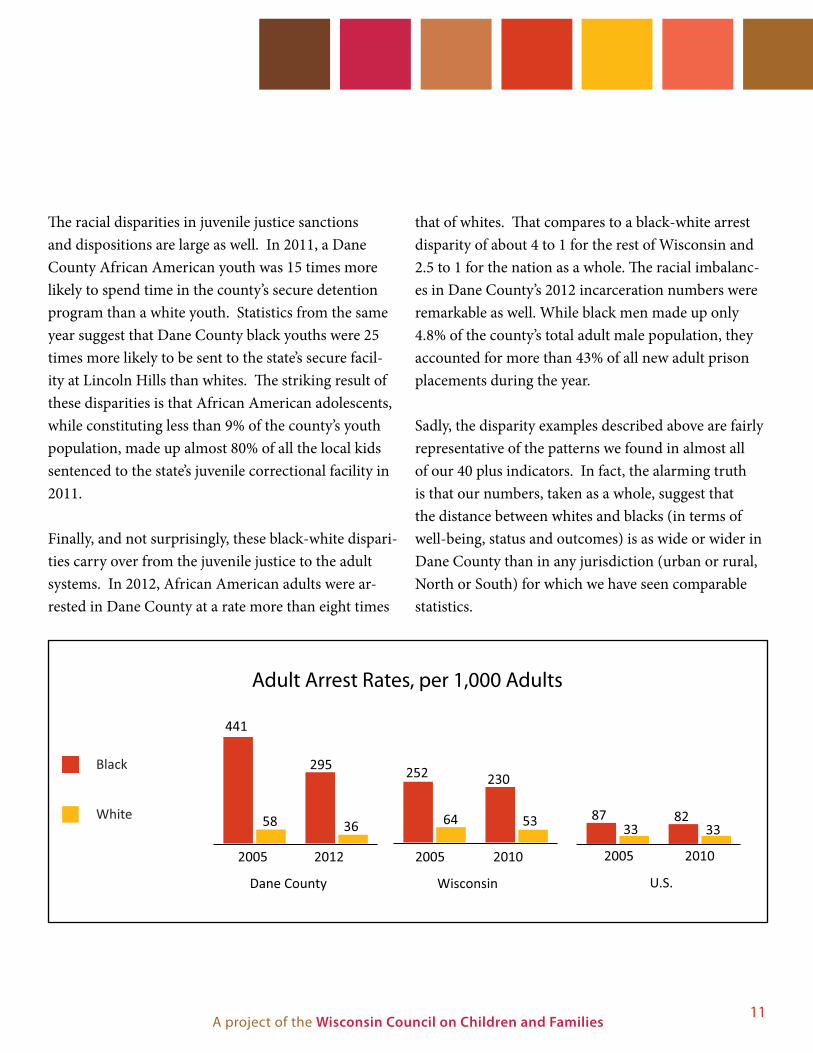
Finally, and not surprisingly, these black-white dispari-ties carry over from the juvenile justice to the adult systems. In 2012, African American adults were ar-rested in Dane County at a rate more than eight times
that of whites. That compares to a black-white arrest disparity of about 4 to 1 for the rest of Wisconsin and 2.5 to 1 for the nation as a whole. The racial imbalanc-es in Dane County’s 2012 incarceration numbers were remarkable as well. While black men made up only 4.8% of the county’s total adult male population, they accounted for more than 43% of all new adult prison placements during the year.
Sadly, the disparity examples described above are fairly representative of the patterns we found in almost all of our 40 plus indicators. In fact, the alarming truth is that our numbers, taken as a whole, suggest that the distance between whites and blacks (in terms of well-being, status and outcomes) is as wide or wider in Dane County than in any jurisdiction (urban or rural, North or South) for which we have seen comparable statistics.
Black
White
Dane County
2005 2012
58
441
36
295 252
64
230
8233
873353
2005 2010 20102005
Wisconsin U.S.
Adult Arrest Rates, per 1,000 Adults
12A publication of Race to Equity
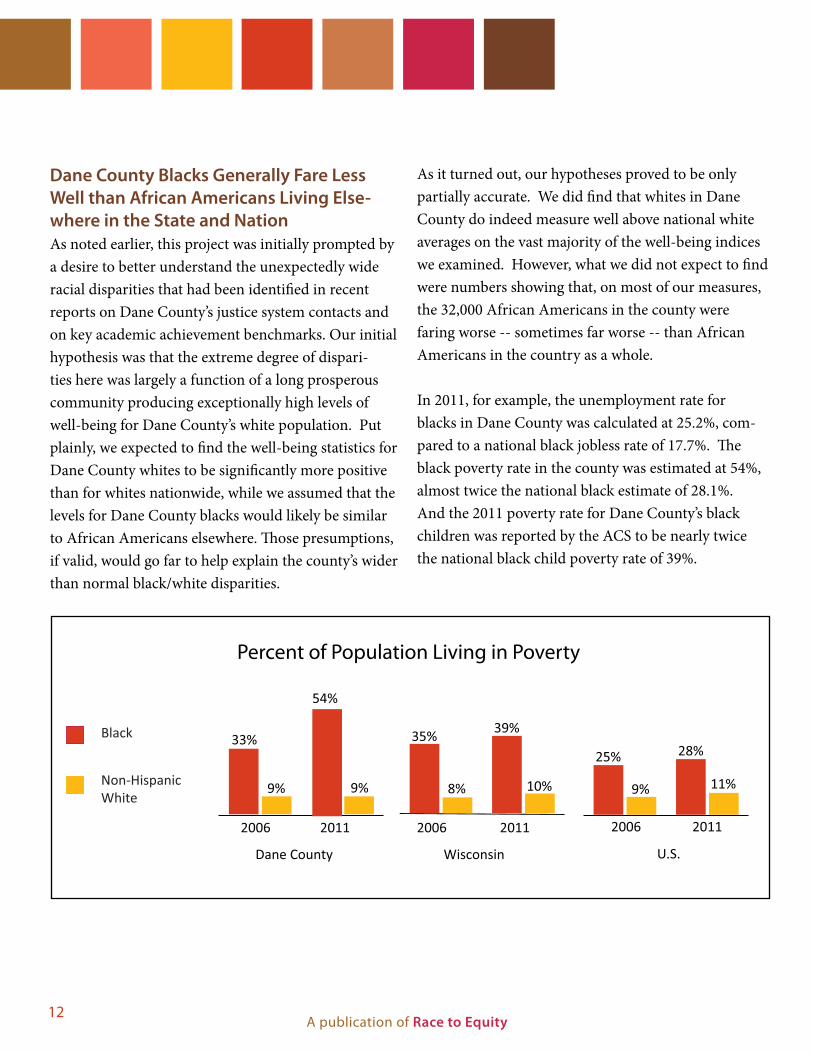
Dane County Blacks Generally Fare Less Well than African Americans Living Else-where in the State and NationAs noted earlier, this project was initially prompted by a desire to better understand the unexpectedly wide racial disparities that had been identified in recent reports on Dane County’s justice system contacts and on key academic achievement benchmarks. Our initial hypothesis was that the extreme degree of dispari-ties here was largely a function of a long prosperous community producing exceptionally high levels of well-being for Dane County’s white population. Put plainly, we expected to find the well-being statistics for Dane County whites to be significantly more positive than for whites nationwide, while we assumed that the levels for Dane County blacks would likely be similar to African Americans elsewhere. Those presumptions, if valid, would go far to help explain the county’s wider than normal black/white disparities.
As it turned out, our hypotheses proved to be only partially accurate. We did find that whites in Dane County do indeed measure well above national white averages on the vast majority of the well-being indices we examined. However, what we did not expect to find were numbers showing that, on most of our measures, the 32,000 African Americans in the county were faring worse -- sometimes far worse -- than African Americans in the country as a whole.
In 2011, for example, the unemployment rate for blacks in Dane County was calculated at 25.2%, com-pared to a national black jobless rate of 17.7%. The black poverty rate in the county was estimated at 54%, almost twice the national black estimate of 28.1%. And the 2011 poverty rate for Dane County’s black children was reported by the ACS to be nearly twice the national black child poverty rate of 39%.
Black
Non-HispanicWhite
Dane County
2006 2011
9%
33%
9%
54%
35%
8%
39%28%
9%
25%
11%10%
2006 2011 20112006
Wisconsin U.S.
Percent of Population Living in Poverty
13A project of the Wisconsin Council on Children and Families
Dane County
2005 2011
45%
10%
48%
11%
42%
14%
42%
14%
2005 2011
Wisconsin
Non-HispanicBlack
Non-HispanicWhite
Percent of 3rd Graders Not Proficient at Reading
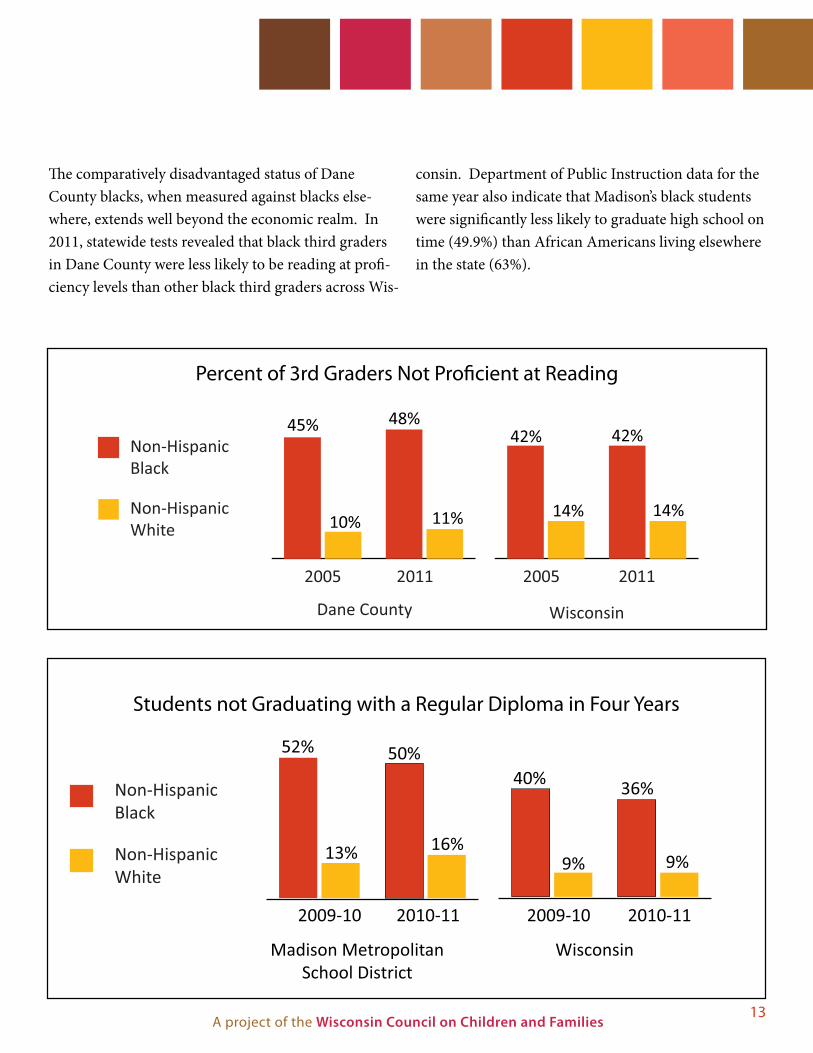
The comparatively disadvantaged status of Dane County blacks, when measured against blacks else-where, extends well beyond the economic realm. In 2011, statewide tests revealed that black third graders in Dane County were less likely to be reading at profi-ciency levels than other black third graders across Wis-
consin. Department of Public Instruction data for the same year also indicate that Madison’s black students were significantly less likely to graduate high school on time (49.9%) than African Americans living elsewhere in the state (63%).
Non-Hispanic Black
Non-Hispanic White
Madison Metropolitan School District
2009-10 2010-11
13%
52%
16%
50%40%
9%
36%
9%
2009-10 2010-11
Wisconsin
Students not Graduating with a Regular Diploma in Four Years
14A publication of Race to Equity
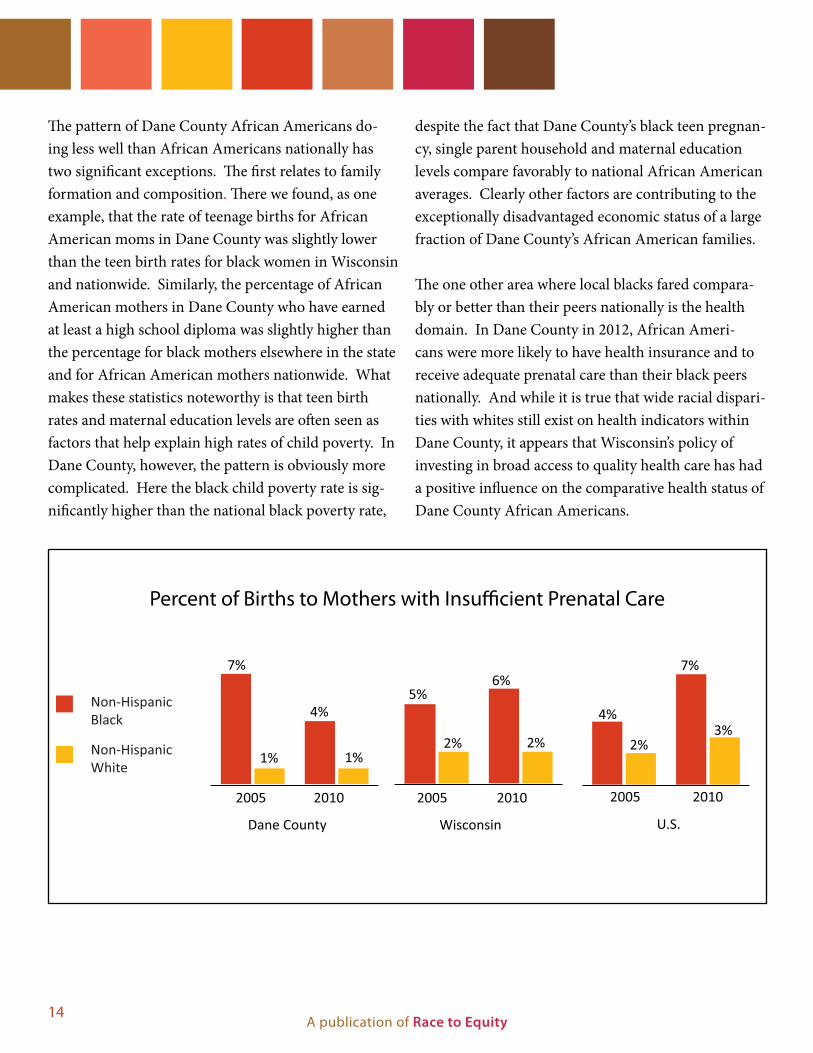
The pattern of Dane County African Americans do-ing less well than African Americans nationally has two significant exceptions. The first relates to family formation and composition. There we found, as one example, that the rate of teenage births for African American moms in Dane County was slightly lower than the teen birth rates for black women in Wisconsin and nationwide. Similarly, the percentage of African American mothers in Dane County who have earned at least a high school diploma was slightly higher than the percentage for black mothers elsewhere in the state and for African American mothers nationwide. What makes these statistics noteworthy is that teen birth rates and maternal education levels are often seen as factors that help explain high rates of child poverty. In Dane County, however, the pattern is obviously more complicated. Here the black child poverty rate is sig-nificantly higher than the national black poverty rate,
despite the fact that Dane County’s black teen pregnan-cy, single parent household and maternal education levels compare favorably to national African American averages. Clearly other factors are contributing to the exceptionally disadvantaged economic status of a large fraction of Dane County’s African American families.
The one other area where local blacks fared compara-bly or better than their peers nationally is the health domain. In Dane County in 2012, African Ameri-cans were more likely to have health insurance and to receive adequate prenatal care than their black peers nationally. And while it is true that wide racial dispari-ties with whites still exist on health indicators within Dane County, it appears that Wisconsin’s policy of investing in broad access to quality health care has had a positive influence on the comparative health status of Dane County African Americans.
Non-Hispanic Black
Non-HispanicWhite
Dane County
2005 2010
1%
7%
1%
4%5%
2%
6%7%
2%
4%3%
2%
2005 2010 20102005
Wisconsin U.S.
Percent of Births to Mothers with Insufficient Prenatal Care
15A project of the Wisconsin Council on Children and Families
The Racialization of Poverty and Disadvantage in Dane CountyThe one inescapable and pivotal finding that arises from all the numbers we have collected is the extraor-dinary degree to which poverty and “disadvantage” in Dane County have become correlated with color -- or, to put it in even more stark terms, the extent to which economic deprivation has become profoundly racial-ized. For Dane County’s African American children, growing up poor is the norm; while for local white kids, being poor is an exceptional and often short-lived circumstance. This same kind of color-based dispro-portionality and imbalance is evident in a host of other outcome arenas. The county’s black children, while constituting about 9% of all our kids, make up 60% of our foster care population on any given day. African American students account for the largest fraction of those who are suspended or expelled from our schools. Black youth also constitute the majority of those who spend time in the county’s juvenile detention cells, and they account for almost all of those sent to the state’s secure juvenile jail. Similarly, black adult males, while numbering only about five percent of the county’s adult male population, make up nearly half of all those arrested and incarcerated.
The Costs and Consequences of Racialized DisadvantageConscious racism and color prejudice may not have been the primary cause of this extreme racialization of disadvantage, but allowing such a close link be-tween color and disadvantage to persist can only serve to nurture stereotypes, foster profiling, and produce differential expectations for achievement within the community at large, while at the same time undermin-ing motivation, aspiration, self-esteem, confidence, and hope among African American children and their families. We should add here that the impact and con-
sequences of this racialization of disadvantage have not been confined to just those African Americans who are low-income or at greatest risk. In fact, during our community presentations over the past year, scores of professionally successful and financially secure African Africans noted that the Dane County’s unusually close link between color and disadvantage had real impli-cations for their lives and their families’ lives. They recounted personal experiences with being stereotyped, profiled, or patronized. Even more commonly, a sur-prisingly large number of middle class African Ameri-can parents shared their deeply felt concerns about the impact that the county’s severe racial disparities might have on the expectations, opportunities, self-image, aspirations, and identity formation of their children. A significant share of these parents went so far as to acknowledge that they have considered relocating their families to environments where the risks of disadvan-tage and underachievement are not so disproportion-ately connected to color.
Sooner rather than later, this nexus between risk fac-tors and race has to be severed. The status quo is toxic for the future of the African American population and, by extension, for other communities of color in Dane County. But it is also poisonous for the county as a whole. Failure to alter the current imbalances in opportunity, well-being, and outcomes will ultimately corrode Madison and Dane County’s reputation for an enlightened and progressive commitment to social justice. It will discourage some families of color from coming or remaining here. And, perhaps most impor-tantly, the continued marginalization of communities of color will undermine the region’s cultural vitality, economic competitiveness, and overall quality of life in a world that increasingly values and demands racial and ethnic diversity and inclusion.
16A publication of Race to Equity
Over this past year, Race to Equity project staff have been reviewing the disparity research and literature, consulting with local and national race equity experts, and most importantly, talking face to face with over 1,500 local residents, from our highest elected officials and civic leaders to community members and activists in the county’s most under-resourced neighborhoods. Through all these learning activities and conversations, we have been listening for ideas, insights, and observa-tions that would help explain our exceptionally wide local racial disparity numbers.
Of course, every honest discussion of the forces and factors that lie behind racial inequalities in America has to begin with the legacy of slavery. Two-and-a-half centuries of bondage, 100 years of segregation, dis-crimination, and exclusion, and 50 years of persisting racism embedded in our attitudes, economy, politics, institutional practices, and social structures -- all of this history is still very much at work disadvantaging African Americans and privileging white Americans.
Indeed, the legacies of slavery and racism clearly underlie many of the significant white-black opportu-nity, status, and outcome gaps that exist in every city, county and state across this country. And surely they explain much of the gap we are finding in black-white well-being measures today in Dane County.
But there is also much in what we are finding about our county’s particular disparity challenges that re-quire a more local and present day analysis. Why, for example, is such a comparatively prosperous environ-ment failing to create anything close to a rising tide that lifts all boats? Why are Dane County’s African
Americans actually faring so much worse, on average, than blacks in poorer and less resourceful cities and counties? Why, in a place so sincerely committed to social equality, is the distance between black and white achievement and outcomes on most key measures so exceptionally wide?
We don’t pretend to have any conclusive answers to these questions, but a year’s worth of conversations with over a thousand community leaders, other local stakeholders and scores of national “experts” have at least pointed us toward some local facts and factors that might – upon further and deeper analysis -- help us better understand how we got to these alarming levels of inequity… and how we might more effectively attack them.
The Mismatch Between Our Labor Market and Our Low-Income Workforce One line of analysis centers on what may be an excep-tionally severe misalignment between Dane County’s labor market demands and expectations, on the one hand, and the work experience, education, and skill sets of a growing segment of our low-income workforce on the other. The hypothesis here is that a significant share of the family supporting jobs in Dane County’s labor market are oriented to advance-degreed, heavily credentialed, and well-networked job seekers, with correspondingly fewer pathways to qual-ity jobs for lower skilled, less-networked, entry-level workers.
This comparative bias toward highly credentialed workers is likely a natural outgrowth of the larger than typical share of Dane County’s local economy that is
SeCtion iii: the FoRCeS and FaCtoRS ContRiButinG to dane County’S ChaLLenGinG RaCiaL diSPaRitieS CRiSiS
17A project of the Wisconsin Council on Children and Families
devoted to sophisticated technical, research, informa-tion management, higher education, teaching, health care, and public sector enterprises. Furthermore, it is a bias doubtlessly reinforced by having the luxury of an abundant stream of highly educated, local college graduates who opt to stay and look for career paths within the Madison/Dane County economy.
The very presence of some 40,000 college students also means that there is a vast supply of young people com-peting for retail, hospitality, personal service, construc-tion, manufacturing, and transportation jobs -- not necessarily as a career, but as a short-term source of supplementary income for meeting the costs of their schooling.
Taken together, these local labor force/labor market realities clearly create increased obstacles and steeper competition for less credentialed and often less-net-worked job seekers who are looking to find a perma-nent and productive role in the Dane County economy. Moreover, these basic labor market hurdles are very likely exacerbated by hiring and human resource practices that set credential, reference, training, or background thresholds at levels that operate, perhaps unintentionally, to discourage or exclude highly mo-tivated and capable applicants who possess less devel-oped resumes or less formal education.
While these job market issues are by no means the only important factors behind high local rates of Afri-can American poverty, they are almost certainly part of the challenge. In order to address these disparities, we will need to bolster community-wide resolve to work harder on at least two fronts. First, we need to do whatever it takes to see that a much higher fraction of our students of color come out of our public schools ready to succeed -- with the skills and credentials they
need to compete effectively for the best jobs in Dane County’s high tech and high literacy economy. Sec-ond, and perhaps even more immediately important, we must build pathways that allow many more lower-income, less networked and less educated jobseekers to enter, remain, and advance in the county’s workforce.
We do not want to understate the challenge we are posing. It will not be easy. To begin with, employ-ers, labor, and community leaders will need to build a practical consensus around a set of strategies that balance employers’ legitimate need to have qualified, and effective employees with our economy’s and com-munity’s longer term need to enhance the opportunity, security, and success of those currently unemployed or underemployed households who are struggling to raise their children with below poverty-level incomes. To achieve this will no doubt entail new initiatives and approaches. It will likely require some greater targeting of our outreach and training to potentially harder to reach populations, with a particular focus on parents of at-risk school-age children. Similarly, custom-ized work readiness and skills training will need to be expanded and strengthened. But, in the end, what will make the most difference is a high priority commit-ment on the part of all the region’s public and private employers-- with real support from job-training and family service agencies-- to significantly expand the opportunities for lower skilled, less credentialed fa-thers and mothers who want and need to get jobs, keep jobs, and achieve financial security.
To meet these goals civic leaders and employers may have to re-examine and reform some of their human resources policies and on-the-job training and super-visory practices. At the same time, nonprofit, city, and county agencies will need to work more respon-sively with public and private sector employers to help
18A publication of Race to Equity
assure that essential and sufficient family supports -- like transportation and flexible child care—are more practically available to more low-income work-ing parents. In short, success in this challenge will demand real change, but unless we make some signifi-cant and strategic employment-related reforms, there is little likelihood we are going to make real progress in narrowing our significant income disparities or in reducing the intergenerational disadvantages that poor parents too often, despite their best efforts, pass down to their children.
This kind of labor market reform is unquestionably complex and difficult, but the challenges are not in-surmountable, and the scale of change required is not overwhelming. If, for example, we could find ways, over the next five years, to bring 1500 currently un-employed or underemployed parents of at-risk public school students into sustainable, family-supporting jobs, we would make a meaningful and positive differ-ence in the county’s existing income and employment disparities, as well as have a measurably beneficial im-pact on the academic achievement gap that presently compromises the future of too many of the county’s low-income children of color. Committing to a goal of this kind and then achieving it would necessarily involve the coming together of our most important government, non-profit and private sector employers in a concerted effort, supported by community leaders, funders, job trainers, volunteers, and service providers. It may take years of creative investment, but the re-wards of such an initiative—for kids, families, and the county—would surely outstrip the costs.
The Challenge of Small, Under-Resourced, and Disconnected NeighborhoodsIn addition to singling out local labor market issues, many of those who shared their ideas about why Afri-can Americans in Dane County were measurably more disadvantaged than their peers elsewhere pointed to the consequences of the different and distinguishing character of the neighborhoods where a considerable share of the county’s African American population resides.
It appears that about half of the area’s low-income black households live in approximately 15 small, com-pact residential concentrations scattered within the city and around its perimeter. (See Appendix 2: Maps
ning Commission) These largely rental developments are each home to anywhere from 100 to 400 families of color, and they are typically surrounded by larger, predominantly white homeownership neighborhoods. Along with this dispersion of the African American population into numerous small enclaves, the city and county actually have few, if any, large-scale and promi-nent black neighborhoods, such as those that culturally and politically anchor the African American commu-nity in most major American cities. In fact, despite a total black population of almost 32,000 county-wide, there is not a single aldermanic district, supervisory district, planning unit, or even a census tract where Af-rican Americans constitute the a majority of residents.
Not surprisingly, most of the small African Ameri-can residential communities trace their history back to rental or affordable housing developments dating
Provided to us by the Capital Area Regional Plan-

19A project of the Wisconsin Council on Children and Families
from the 1960s, 70s or 80s. Even to this day, a major-ity of families in these small neighborhoods qualify for housing assistance, and live near or below the poverty line. Typically, these enclaves do not include a church, a full service grocery, a public school, social or civic clubs, developed open spaces, a bar, restaurant, or a significant employer.
Work by staff from city and county agencies as well as the Race to Equity Project is currently underway to draw more complete demographic, social, and eco-nomic portraits of these small, predominantly African American communities. Mapping completed so far suggests that these residential concentrations are thinly or unevenly served by the city and county’s public transit systems -- a situation made more consequential by the lower than average rates of car ownership and drivers’ licensure in these places. Early geo-mapping also suggests that these areas are disproportionately distant from key city and county offices, from major cultural and civic institutions, from public job place-ment agencies, senior services, recreation resources, quality food and retail outlets, and places of worship. Even more negatively, public agency reports show that most of these communities are the site of dispropor-tionally high rates of emergency calls, child welfare placements, arrests and convictions, as well as housing code infractions.
Our early work on neighborhood characteristics also suggests that many of these African American commu-nities are highly dynamic, with distinct histories and uneven levels of social cohesion. Statistical and anec-dotal evidence suggests there is a high degree of house-hold mobility both within these enclaves and from one community to another. Furthermore, in many of these areas the population includes a significant fraction of relatively recent arrivals, families who have migrated
to Dane County over the last ten to forty years from a variety of other cities and localities across Wisconsin and the Midwest region. Taken together, all of these geo-demographic and place characteristics have obvious and often profound impacts on the comparative security, strength, sta-bility and opportunities experienced by the African American families raising children in these chal-lenged neighborhoods, as well as on the overall social cohesion, cultural influence and political voice of the county’s black community as a whole. For example, the dispersion of the African American population into widely scattered and small enclaves creates obstacles to political visibility and to the emergence of powerful county wide black leadership on issues of importance to families and children of color. In 2013, for example, while blacks make up almost 9% of the county’s total population, and 20% of Madison’s public school enroll-ment, African Americans held only a handful of the several hundred elected offices in the county. Similarly, the isolation and distance from jobs, from affordable goods and services, and from employment training, family support, and adult education institutions have doubtlessly contributed to the comparative economic exclusion and family hardship that is so evident in the county’s racial disparity statistics.
Finally, the small size, high mobility, recent arrival, and diverse origins of a good share of the populations that make up many of the county’s black neighbor-hoods all help create real challenges to building strong social networks and responsive community-based family support systems. Kin networks, for example, appear less wide, less deep, and less multi-generational in Dane County’s black areas than in the larger, more rooted African American neighborhoods found in most American cities. Likewise, the lack of in-neigh-
20A publication of Race to Equity
borhood infrastructure institutions (churches, clubs, civic organizations, entertainment venues) inhibits growth of informal support systems, diminishes lead-ership development opportunities, and makes positive community organizing far more challenging.
Here again, there is no easy, quick fix for addressing the challenges created by these distinctive patterns of black residential geography in Dane County, but there are some general directions that could be, and should be, pursued to mitigate the unfavorable consequences for families and children of these marginalized and under-resourced community environments.
At a minimum, we need to redouble support for cur-rent and recent efforts to link these neighborhoods to critical county resources… and to each other. For many years, city, county, and non-profit organizations have worked to bring more public and private resourc-es to the communities that need them most. Some county services, such as Joining Forces for Families and the Early Childhood Initiative, are neighborhood-based. The Boys and Girls Club thoughtfully sited its wonderful new facility in Allied Drive. The Center for Resilient Cities located its innovative multi-purpose re-source and school in the Rimrock Road area. The City of Madison has reinvigorated the deployment of its multi-agency Neighborhood Resource Teams to eight target neighborhoods. Public health and other health providers are working to build greater accessibility and stronger community connections through a variety of strategies. And an increasing number of churches and non-profit organizations, along with some businesses, are looking at creative ways to build up closer and more reciprocal relationships with under-resourced neighborhoods.
Despite these promising efforts, much more has to be
done to break down the isolation and marginalization of these vulnerable communities if they are to prog-ress and thrive. One big piece of the unmet challenge is adequate public transportation. The recent initia-tion of regular bus service to the Owl Creek commu-nity, thanks in part to advocacy from LaFollette High School students, is an encouraging example of where we need to be headed, but it is just a start.
Perhaps even more critical, we need to expand the opportunities available to residents of each of these small communities to engage, interact, and organize with residents of like neighborhoods across the county. Significantly narrowing our racial disparities will demand the kind of sustained and robust advocacy that will only come through a more coordinated and broad-based demand for change from all parts and levels of Dane County’s African American and other communities of color, along with strong support from white allies.
Finally, more energy, time, and effort has to be invested in basic community building activities. Expanded leadership training and leadership development op-portunities have to be fostered at both the grassroots and organizational levels. Neighborhood-level social, cultural, planning, and recreational activities should be initiated or expanded to strengthen the kind of com-munity networks that support parents, protect kids, reduce crime, and advance neighborhood interests. The Neighborhood Intervention Program and the more recent South Madison Promise Zone are good faith responses to this challenge, but they are only a fraction of what must be done even more intensely… and in more places.
It is a common social policy mantra these days to say that kids do well when their families do well, and
21A project of the Wisconsin Council on Children and Families
families do well when they live in safe and supportive communities. But the truth is, for too many of Dane County’s low-income African American families, the places where they are trying to raise their children are not nearly as healthy, safe, supportive, connected, or opportunity-rich as they need to be.
The Need for Madison and Dane County to Respond More Effectively, Inclusively, and Accountably to Our Growing Racial Equity ChallengeThe legacy of slavery and racism, the mismatch be-tween our labor markets and key parts of our work-force, and the fragmentation and underdevelopment of too many of our neighborhoods of color -- these are all large and powerful drivers of the vast inequalities that separate white and black Dane County. But they are not the whole story.
The whole story has to include a broader and more forthright evaluation of the composition, priorities, policies, training, and practices of many of the county’s majority-dominated institutions, especially those that directly influence the future education, employment, opportunity, status, achievement, security, health, and empowerment of Dane County’s growing populations of color.
Among the first changes we need to pursue is to in-crease the diversity of the professionals and staff who work in our schools and our major counseling, rec-reational, job training, and social service institutions. African Americans are almost % of the county’s total population and almost 20% of Madison’s pub-lic school enrollment. Moreover, as our data clearly shows, African Americans make up a disproportionate share of those who are at greatest risk of poor educa-tional, behavioral, economic, and family outcomes.
Yet, despite these realities, African Americans are under-represented, sometimes vastly, in the ranks of our teachers, counselors, job trainers, mental health practitioners, and court personnel. A commitment to greater diversity in all of these vocations would make a real difference: it would provide more positive and in-fluential role models for children and youth of color; it would increase the quality of communication and trust in the complex challenges of doing effective social and behavioral health work; it would enhance the cultural competence of institutional and agency practice and policy; and it would expand the still too few career paths and leadership opportunities for aspiring African American professionals in our community.
Similarly, we need to make the changes necessary to recruit, retain, and promote more persons of color into the management-level ranks of our county’s ma-jor non-profit, public, and private sector employers. Research has clearly shown that presence of senior managers of color substantially increases the capacity of their companies, agencies, departments, or orga-nizations to identify, place, and retain a more racially diverse workforce throughout their employment ranks. Given the crisis levels of unemployment and under-employment in the county’s black community (and the consequences that flow from that), it would seem that placing a priority on enhancing executive level diver-sity could prove an essential strategy for enhancing the county’s overall level of economic inclusion.
We also need to strengthen the effectiveness, skills, and knowledge of our existing majority workforce of white professionals who are in positions to help at-risk children and their parents achieve better outcomes. Dane County’s teachers, youth workers, social workers, child welfare professionals, job trainers, counselors, police, and corrections professionals are characteristi-
8
22A publication of Race to Equity
cally hardworking, dedicated, highly professional, and talented. And the overwhelmingly majority are com-mitted, often passionately, to the values of fairness, equal opportunity, inclusion, and social justice.
But that said, it is also true that many of the people who are being asked to help meet the challenges of the county’s growing populations of at risk children and families have uneven personal and professional experi-ence (and limited training) for identifying and effec-tively responding to the complex needs and strengths presented by at-risk children and adults from diverse cultural, ethnic, and racial backgrounds—children and adults who are often coping with the manifold chal-lenges of poverty, insecurity, and family stress.
To underestimate the experience, skills, and tools required to do this work is an unhelpful form of denial or naivete. It will do nothing to move the status quo. Instead, what we need to do is make a commitment to meaningful, sustained, and creative staff development and professional growth initiatives -- initiatives that equip people of all backgrounds with the ideas, tech-niques, resources, coaching, feedback, and supports they need to be more effective and accountable.
In recent weeks, the Madison Metropolitan School District released a new “strategic framework” for supporting student achievement that puts a heavy focus on staff development, team building, and profes-sional growth to better meet the district’s continuous improvement goals. It is an appropriate and timely emphasis, and hopefully it will serve as an exemplary approach for other systems dedicated to enhancing their capacity to better serve the county’s most vulner-able children and families.
Finally, our whole community faces a major challenge in pulling together a more comprehensive and collab-orative strategy that is powerful enough to attack the root drivers of the disparity crisis we face. The strategy has to be a “two-generation” approach that focuses on increasing the health, developmental readiness, motivation, academic achievement, graduation, and post-secondary training of all our at risk children and youth, while at same time addressing the income, employment, housing security, child care, health, and parenting information needs of their families.
Well-intended and helpful efforts in any one sector are less likely to make much of an impact unless they occur in a broader context or setting where individu-als and families get all the basic support and tools they need to make progress. So, for example, even the best effort by public schools to educate children will founder if parents don’t have the financial and practical wherewithal to support their families.
We have no illusions about the difficulty of putting together the kind of meaningful and sustainable col-laboration across the community—from private and public employers, from city and county government, from non-profit providers and funders, from parents and teachers. And yet, without a broad and deep com-mitment to a genuinely shared and comprehensive strategy, we are never going to get beyond small, frag-mented, often narrow programs and services that are insufficient in scale, intensity, continuity, and scope to make a lasting impact on the life trajectories of at-risk children and their families.
To move meaningful numbers of historically disad-vantaged and under-resourced men and women into productive, family-supporting roles in the workforce will require a long-term joint effort by employers, job
23A project of the Wisconsin Council on Children and Families
placement and training providers, child care resources, family support workers, along with a lot of informal help from volunteers, neighbors, and kin. In a grow-ing number of places across the country, communities are creating place-based resources called “centers for working families” that bring together, in an accessible location, all the diverse resources and supports needed to move the most disadvantaged families from the eco-nomic margins to the economic mainstream. It is an
approach that warrants exploration of its applicability to the challenges we face here in Dane County.
In the end, the willingness of the city, county, school districts, business, non-profit providers, and funders to come together to build and sustain this kind of tar-geted two-generation strategy may determine whether we in Dane County undo our deep racial disparities, or whether they undo us.
24A publication of Race to Equity
The members of the Race to Equity team have learned many lessons over the last year-and-a-half, but two deserve special note. First, we have come to fully ap-preciate that we are hardly the pathfinders or pioneers in this local social justice work. Long before we came along, mission-driven institutions and a host of com-mitted Dane County activists had been compiling an impressive record of struggle against racism, discrimi-nation, and unequal opportunity. They have fought for equality and fairness for people of color from their positions as public officials, in the classroom, from the pulpit, at neighborhood centers, and in the day-to-day work of improving the future for at-risk children and families
Race to Equity aspires to reinforce and advance the goals and values of these remarkable organizations and leaders, many of whom remain at the forefront of making positive change today. Organizations like: the NAACP; the Equal Opportunity Commission; the Ur-ban League of Greater Madison; One Hundred Black Men; Women in Focus; the YWCA of Dane County; Centro Hispano: American Friends Society; the for-mer Harambee Center; the Boys and Girls Club of Dane County; the South Madison, Wilmar, Goodman, and Lussier Neighborhood Centers; Freedom Inc.; The Capital City HUES; UMOJA; The Madison Times; Simpson Street Press; The Center for Resilient Cities; Access Health; the Disproportional Minority Contact Task Force; the Superintendent’s Human Relations Advisory Council; Schools of Hope; the United Way; the AVID-TOPS program; the Restorative Justice Ini-tiative; Operation Fresh Start; the Southside Raiders; Dane Dances; Drum Power; the First Wave Scholars Program; African American Ethnic Academy; Latino Workforce Development Academy; LUCES, Club
TNT; Madison Metropolitan Chapter of the Links, Inc.; La Comunidad newspaper; UW Odyssey Project; Delta Sigma Theta and Alpha Kappa Alpha sororities; La Mujer Latina; Omega School; Nehemiah Center for Urban Leadership Development; La Movida radio sta-tion; UW People Program; Mann Scholars; the Rain-bow Project; Madison area Urban Ministry (MUM), Literacy Network; Mt Zion, S.S. Morris Church and many others.
We also hope to add our voice to the chorus of the individual advocates, champions, thinkers, and lead-ers whose example has inspired us in the work we have taken up. Path-breaking leaders like: Eugene Parks, Reverend James Wright, Richard Davis, Dr. Perry and Dr. Virginia Henderson, Ray Allen, Kwame Salter, Anne Arnesen, David Couper, Ken Haynes, Betty Banks, Milele Chikasa Anana, Stan and Yolanda Woodard, Alfonso and Janet Studesville, Barbara McKinney, Donna Mackey, Brenda Brown, Dr. How-ard Fuller, Dr. Richard Harris, Dr. Floyd Rose, Jona-than Gramling, Dr. John Odom, Cora White, Stephen Blue, Wayne Strong, Oscar Mireles, Betty Franklin-Hammonds, Dr. Gloria Ladson-Billings, Dr. Pamela Oliver, Darrell Bazzell, Jackie Boggess, Salli Martin-iak, Andreal Davis, and many more. More recently, the legacy of these changemakers is being advanced by an emerging new generation of advocates—men and women like Annette Miller, Denise DeMarb, Shiva Bidar-Sielaff, Kaleem Caire, Michael Johnson, Rachel Krinsky, Everett Mitchell, Shahanna Balden, Wesley Sparkman, Peng Her, Ananda Mirilli, Col-leen Butler, Yorel Lashley, Dr. Maisha Winn, Justice Castaneda, Michelle Robinson, Joshua Wright, Will Green, Mahlon Mitchell, Dave Dahmer, Jessica Strong, Langston Evans, Brenda Gonzalez, Karen Menedez
ConCLuSion: LeSSonS and neXt StePS
25A project of the Wisconsin Council on Children and Families
Coller, Henry Sanders, Baltazar de Anda, Gloria Reyes, and countless more. In short, we know that we are not launching a movement, we are joining one.
We are also painfully aware of the risk involved in creating a list like the one above. Despite our best efforts to learn the history of justice work here, we have doubtlessly left out individuals and groups whose contributions we are not yet aware of. Nevertheless, we concluded that our inability to acknowledge everyone who deserves recognition is not a good reason to be silent about the work and leadership of those we have been privileged to learn from. And to those whom we have regrettably overlooked: our sincere apologies.
Ironically, the second lesson we have learned was that while it is imperative to give credit where it’s due, it is equally important to avoid assigning blame when it serves no purpose. The racial equity problem that Dane County faces in 2013 is not the fault of any one group, or interest or sector. We accomplish little by trying to single out any one entity, organization, or institution as a scapegoat.
Put plainly, we have come to see that the task ahead is not about assigning blame; it is about accepting shared responsibility. As an entire community we need to own greater accountability for the situation we are in. We need, for example, to acknowledge that we have devoted far too little attention, visibility or discussion to the indefensible degree of disadvantage that burdens far too many of our county’s families and children. We need to admit we have paid too little heed to the calls for action that have been coming from our communi-ties of color for decades. And we all need to accept the fact that we have simply placed too low a priority on making the difficult changes required to narrow the exceptionally wide gaps between whites and blacks.
Finally and importantly, all of us who care about this issue need to be willing to replace our fragmented, piecemeal, undersized, and often competitive pro-grams and initiatives with a more evidence-based, comprehensive, coordinated, and scalable set of mutu-ally reinforcing investments, interventions, reforms, and supports—that is, a sequenced set of collective actions that are strong enough, broad enough, effective enough, and durable enough to make a meaningful difference in the troubling numbers recorded in this Baseline Report.
The Race to Equity Project is determined to find at least some ways to contribute to this kind of crucial mobilization. Our current plan includes four “next steps” that are designed to build on the ideas, consen-sus, and momentum generated by the October, 2013 Summit Conference. First, we will publish regular updates on our key disparity measures. It is our hope that these periodic reports will help us do several things, including: to track positive or negative changes from our baseline; to foster a more informed under-standing of the inter-relationships among risk factors; to sharpen our recognition of the pivotal contribu-tors to underachievement and poor outcomes; and to keep a public spotlight on urgent issues of racial and economic equity in the county. Second, we hope to use the Project’s professional relationships to recruit local, regional, and national experts willing to con-tribute their experience, expertise, research, and time to help the county identify and implement promising approaches, practices, and policies for reducing racial disparities and disproportionalities. These resources will include many of the experts and organizations invited to the October Summit, as well as other con-sultants and technical assistance providers who have indicated a readiness to support Dane County’s racial
26A publication of Race to Equity
disparity reduction work in the year ahead. Race to Equity will also use its national contacts to advocate for the increased involvement of major national foun-dations and appropriate federal programs as poten-tial investors in expanding important and nationally relevant Dane County initiatives to reduce local racial disparities. Lastly, the Project hopes to play a construc-tive role as a communication hub or connector to help the many entities, agencies, and sectors who have to work more closely together around agreed upon goals, if we are to make any real progress in leveling the play-ing field for all families and kids in the county. More
specifically, Race to Equity, with the help of the An-nie E. Casey Foundation, will explore the potential of Casey’s “Leadership in Action” model as an example of a mechanism that could help bring together a cross-section of county and community leaders into a func-tioning coalition capable of achieving real results and real change in 2014 and beyond.
It is our aspiration that all these next steps will prove useful to our allies and partners…and to all others who are committed to creating a more inclusive, equitable, and thriving Dane County in the decade ahead.
27A project of the Wisconsin Council on Children and Families
Data SourcesOver the past 12 months the Project has scoured available data bases to find reliable statistics that can accurately measure and track local white/black dispari-ties on a wide range of status and outcome indicators. Not surprisingly, the most important sources have been U.S. Census-related reports, including: the 2010 Decennial Census, U.S. Census Bureau; the American Community Survey, U.S. Census Bureau; “County Quick Facts,” as well as other Special Census Reports. Also critical have been: Bureau of Labor Statistics Data on Employment; Wisconsin Interactive Health Statistics, Wisconsin Department of Health Services; The National Vital Statistics Report, Centers for Dis-ease Control; the Healthy Dane.org Website, and State and Local Vital Statistics and Public Health Data. For education-related measures, we have relied on the Wis-consin Information Network for Successful Schools (WINSS), Wisconsin Department of Public Instruc-tion, as well as program data and special reports from the Madison Metropolitan School District. Informa-tion on child welfare measures has been accessed from Dane County Department of Human Services Agency program data and special reports. Juvenile justice and criminal justice data have been drawn from a variety of sources, including the Wisconsin Data Justice Portal, the Office of Juvenile Justice and Delinquency Pre-vention’s Easy Access to Juvenile Populations website, the Federal Bureau of Investigation’s Unified Crime Reports, Dr. Pamela Oliver’s statistical studies and articles, and program information requested from the Department of Corrections. Finally, we have found helpful additional information on local disparities in a host of special studies, task force reports, research papers and program data, including publications and reports from the Urban League of Greater Madison, the Wisconsin Council and Children and Families, The Annie E. Casey Foundation, The Center for the Study
of Social Policy, PolicyLink, the United Way of Dane County, Healthy Dane.Org, the Dane County Task Force on Racial Disparities in the Criminal Justice Sys-tem, the City of Madison Planning Division, and the Capital Area Regional Planning Commission.
Types and Categories of Data Being CollectedTo date, these sources have allowed the Project to calculate black/white disparity and disproportion-ality ratios on over 40 different status, outcome or achievement measures. For presentation and analysis purposes, we have clustered these 40 plus measures into seven larger categories or domains. They are: (1) Economic Well-being (e.g., unemployment, poverty rate, child poverty rate, median income, etc.); (2) Family Structure (e.g., rate of births to teens, percent of single parent families, births to mothers without a high school diploma, etc.); (3) Educational Achieve-ment (e.g., third grade reading proficiency, eighth grade math proficiency, attendance measures, rates of suspension and expulsion, graduation rates, rates of participation in college entrance exams, entrance exam test scores, etc.); (4) Health Status (e.g., rate of health insurance coverage, percent of births to mothers without adequate prenatal care, percent of low-weight births, infant mortality rates, comparative death rates from major diseases, etc.); (5)Involvement in the Juvenile Justice System (e.g., juvenile arrest rate, rate of placement in county juvenile detention , rate of place-ment in state secure facilities, etc.); (6) Child Welfare Involvement (e.g., rate of referrals to child protective services, average daily population in foster care, length of stay in foster care, etc.) (7) Involvement in the Adult Justice System (e.g., rates of arrests, rates of incarcera-tion, etc.);
PoStSCRiPt: SuMMaRy oF data CoLLeCtion iSSueS
28A publication of Race to Equity
In addition to calculating these baseline numbers, the Project is also mining a variety of data and map-ping sources to create a geographic and demographic portrait of the black population in Madison, including information on their numbers, age composition, the relatively recent growth in the black population’s share of the county’s total population, and the geographic distribution of African American households across the city and county. From this latter data on residen-tial geography, we are hoping to build a description of the “community characteristics” of the approximately fifteen neighborhood areas or residential enclaves where a significant fraction of the county’s lower income African American population resides. We strongly believe that these “community characteris-tics” (e.g., assets, degree of isolation, safety, distance to resources, poverty concentration, residential mobility, housing quality, etc.) are important to understanding some of the negative African-American well-being and status levels captured in our disparity data.
The Strengths and Limitations of Our Current Data BaseThe on-going data collection effort described above has not been free of problems and complexity. To begin with, we have been unable to find solid information on a handful of measures we think would be helpful in understanding and addressing the disadvantaged state of the county’s black population. For example, we do not yet have useful data that would allow us to accu-rately compare the school readiness levels of black and white children entering kindergarten. Similarly, we lack the kind of data that would permit us to usefully compare housing status (quality, stability, affordabil-ity) or mobility (frequency of residential changes) by race. We also lack the data we need to make reliable comparisons of black/white status on such important indicators as hunger, nutrition, homelessness, obesity, and mental health (incidence of depressions, chemi-cal dependency). Finally, there are other areas where
our data collection is moving forward, but the results remain incomplete; these include some important “sys-tem” indicators such as rates of placement in special education, rates of placement in congregate settings within child welfare, and potential disparities within rates of incarceration for similar offenses. We hope to capture several of these missing measures in the com-ing year.
On other indicators, where we do have reported data, there are sample size challenges. For example, we have accurate race-specific annual data on infant mortal-ity for the county, but the limited size of the total black population (32,000) and, hence, the relatively small number of black births each year, means that an increase or decrease of two or three black infant deaths can cause large, but not statistically meaningful, swings in the annual African American infant mortality rate.
Sampling issues also potentially affect the precision of other measurements. Several of our indicators rely on findings from the American Community Sur-vey, which, unlike the Census, are based on samples rather than a full count. Any such sampling technique involves some margin of error. Our estimates of child poverty, for instance, are based on the ACS survey, and consequently these may overstate or understate the true poverty rate by significant margins. One remedy for this imprecision is to adopt a three-year averag-ing approach, and we are considering employing that methodology in the 2014 update of our report.
While these data limitations are real, the good news is that we have a sufficient array of accurate and trackable numbers to assemble an objective, comprehensive and powerful description of the wide gaps in opportunity, resources, outcomes and well-being which currently differentiate Dane County’s black minority from its white majority. We believe that the available data is more than adequate to convey the breadth, depth,
29A project of the Wisconsin Council on Children and Families
and pervasiveness of the racial equity challenge Dane County confronts.
The range of indicators for which we have solid data is also diverse and complete enough to foster informed discussion and debate about the causes, forces, factors and interconnections underlying what are indisputably severe and persisting inequalities. The evidence base for the problem analysis, in turn, is complete enough to support community-wide conversations about the
short and long term investments, initiatives, and ac-tions that could help move us toward greater equity. Finally, the data we are collecting are sufficiently up-datable to allow us to produce periodic public reports on the extent of progress the county is making over time. In short, it is our belief that the tracking of these core disparity statistics will foster a far higher degree of public accountability for assuring a more level play-ing field in the years ahead for all who live in Dane County.
APPENDIX I
DATA TABLES ON BASELINE DISPARITY MEASURES
1
APPENDIX I
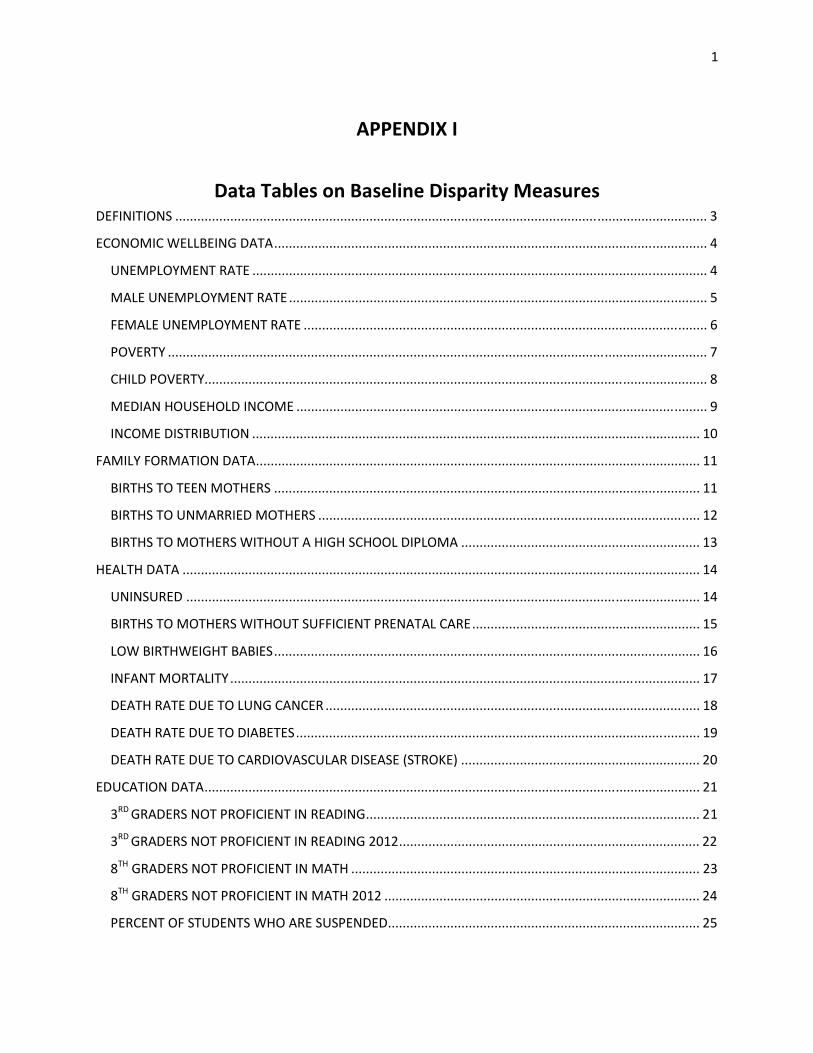
Data Tables on Baseline Disparity Measures DEFINITIONS ................................................................................................................................................. 3
ECONOMIC WELLBEING DATA ...................................................................................................................... 4
UNEMPLOYMENT RATE ............................................................................................................................ 4
MALE UNEMPLOYMENT RATE .................................................................................................................. 5
FEMALE UNEMPLOYMENT RATE .............................................................................................................. 6
POVERTY ................................................................................................................................................... 7
CHILD POVERTY......................................................................................................................................... 8
MEDIAN HOUSEHOLD INCOME ................................................................................................................ 9
INCOME DISTRIBUTION .......................................................................................................................... 10
FAMILY FORMATION DATA ......................................................................................................................... 11
BIRTHS TO TEEN MOTHERS .................................................................................................................... 11
BIRTHS TO UNMARRIED MOTHERS ........................................................................................................ 12
BIRTHS TO MOTHERS WITHOUT A HIGH SCHOOL DIPLOMA ................................................................. 13
HEALTH DATA ............................................................................................................................................. 14
UNINSURED ............................................................................................................................................ 14
BIRTHS TO MOTHERS WITHOUT SUFFICIENT PRENATAL CARE .............................................................. 15
LOW BIRTHWEIGHT BABIES .................................................................................................................... 16
INFANT MORTALITY ................................................................................................................................ 17
DEATH RATE DUE TO LUNG CANCER ...................................................................................................... 18
DEATH RATE DUE TO DIABETES .............................................................................................................. 19
DEATH RATE DUE TO CARDIOVASCULAR DISEASE (STROKE) ................................................................. 20
EDUCATION DATA ....................................................................................................................................... 21
3RD GRADERS NOT PROFICIENT IN READING ........................................................................................... 21
3RD GRADERS NOT PROFICIENT IN READING 2012 .................................................................................. 22
8TH GRADERS NOT PROFICIENT IN MATH ............................................................................................... 23
8TH GRADERS NOT PROFICIENT IN MATH 2012 ...................................................................................... 24
PERCENT OF STUDENTS WHO ARE SUSPENDED ..................................................................................... 25
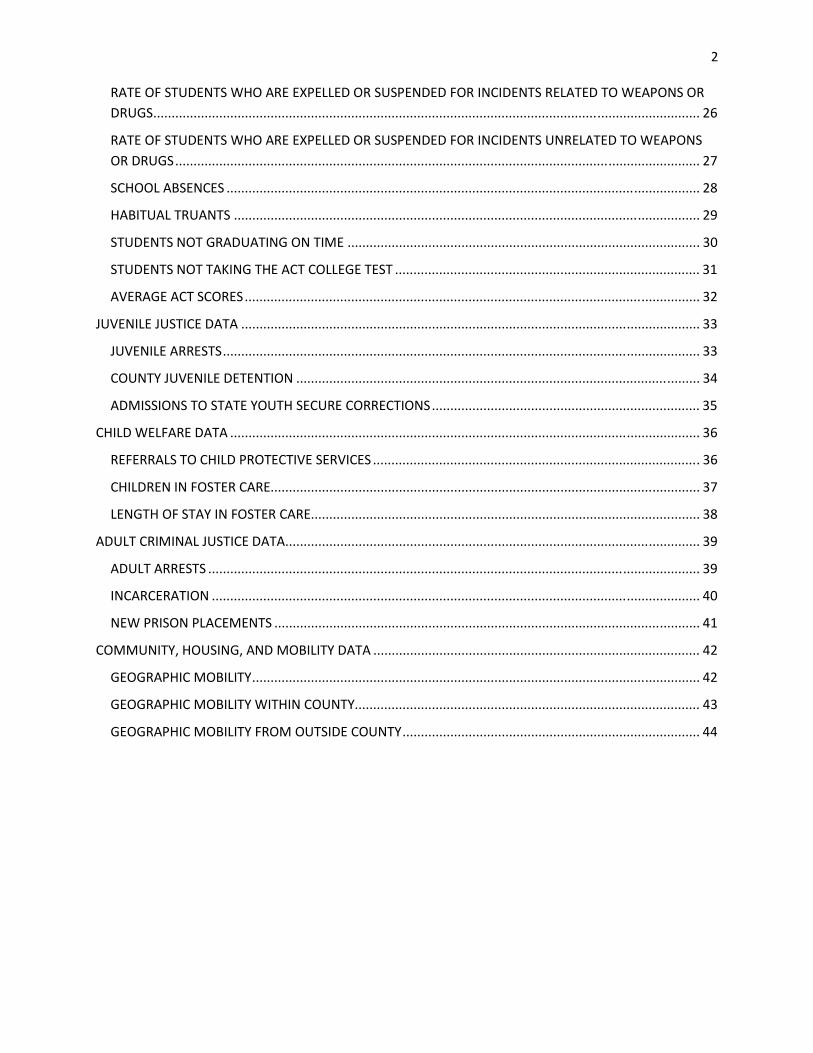
2
RATE OF STUDENTS WHO ARE EXPELLED OR SUSPENDED FOR INCIDENTS RELATED TO WEAPONS OR DRUGS ..................................................................................................................................................... 26
RATE OF STUDENTS WHO ARE EXPELLED OR SUSPENDED FOR INCIDENTS UNRELATED TO WEAPONS OR DRUGS ............................................................................................................................................... 27
SCHOOL ABSENCES ................................................................................................................................. 28
HABITUAL TRUANTS ............................................................................................................................... 29
STUDENTS NOT GRADUATING ON TIME ................................................................................................ 30
STUDENTS NOT TAKING THE ACT COLLEGE TEST ................................................................................... 31
AVERAGE ACT SCORES ............................................................................................................................ 32
JUVENILE JUSTICE DATA ............................................................................................................................. 33
JUVENILE ARRESTS .................................................................................................................................. 33
COUNTY JUVENILE DETENTION .............................................................................................................. 34
ADMISSIONS TO STATE YOUTH SECURE CORRECTIONS ......................................................................... 35
CHILD WELFARE DATA ................................................................................................................................ 36
REFERRALS TO CHILD PROTECTIVE SERVICES ......................................................................................... 36
CHILDREN IN FOSTER CARE..................................................................................................................... 37
LENGTH OF STAY IN FOSTER CARE.......................................................................................................... 38
ADULT CRIMINAL JUSTICE DATA ................................................................................................................. 39
ADULT ARRESTS ...................................................................................................................................... 39
INCARCERATION ..................................................................................................................................... 40
NEW PRISON PLACEMENTS .................................................................................................................... 41
COMMUNITY, HOUSING, AND MOBILITY DATA ......................................................................................... 42
GEOGRAPHIC MOBILITY .......................................................................................................................... 42
GEOGRAPHIC MOBILITY WITHIN COUNTY.............................................................................................. 43
GEOGRAPHIC MOBILITY FROM OUTSIDE COUNTY ................................................................................. 44
3
DEFINITIONS
Disparity and Disproportionality Definitions The words used to describe differences among children and families of different races in this report are disparity and disproportionality. Listed below are the definitions of disparity and disproportionality we will be using:
• Disparity refers to the likelihood of someone in a group experiencing a positive or negative outcome as compared to someone else in another group. In our case this is a comparison between a racial or ethnic minority and a non-minority (i.e. comparing African Americans to whites). Using the example of unemployment, in 2011 25.2% of Dane County Blacks were unemployed, compared to 4.8% of Whites. This results in a disparity rate of 5.3/1 (25.2% African American unemployment / 4.8% White unemployment = 5.3).
• Disproportionality compares the proportion of a particular group that experiences a specific outcome, status, or condition compared to that group’s proportion of the total population. Using the same example of unemployment, in 2011, Dane County Blacks made up 17.7% of the unemployed but are only 4.1% of the total labor force population. This results in a disproportionality ratio of 4.3 (17.7% Blacks unemployed/ 4.1% Blacks in the labor force = 4.3).
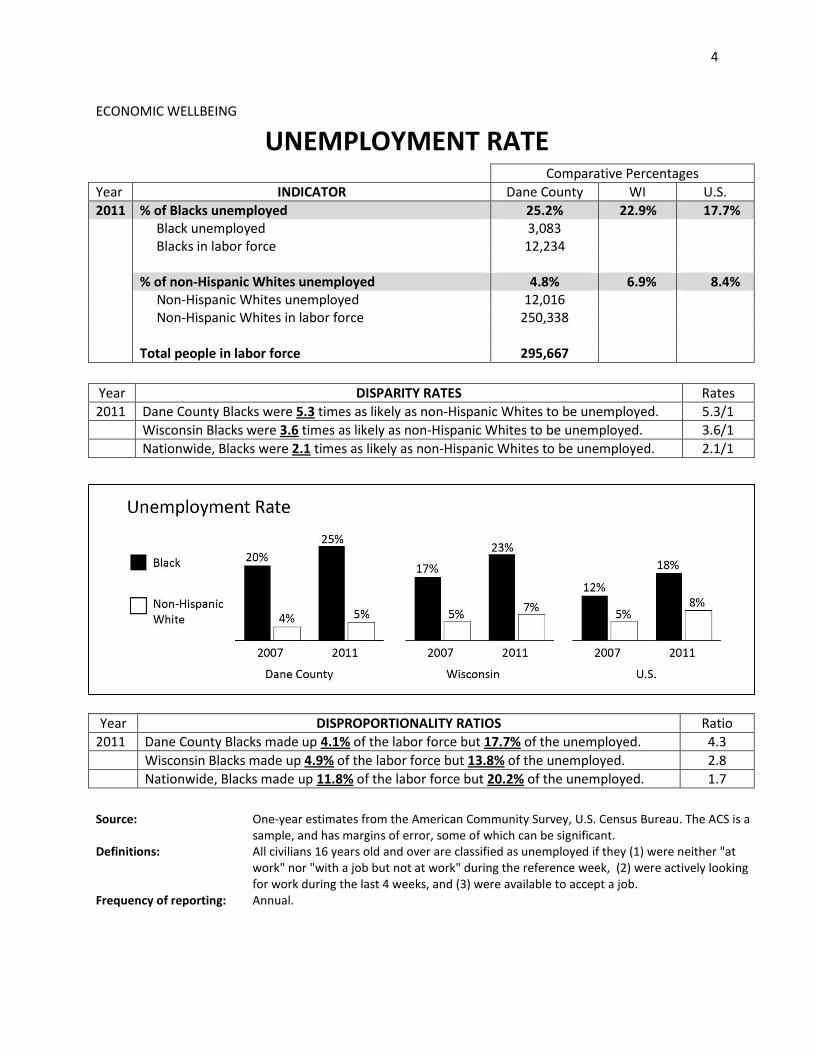
4
ECONOMIC WELLBEING
UNEMPLOYMENT RATE Comparative PercentagesYear INDICATOR Dane County WI U.S.2011 % of Blacks unemployed 25.2% 22.9% 17.7% Black unemployed 3,083 Blacks in labor force 12,234 % of non-Hispanic Whites unemployed 4.8% 6.9% 8.4% Non-Hispanic Whites unemployed 12,016 Non-Hispanic Whites in labor force 250,338 Total people in labor force 295,667 Year DISPARITY RATES Rates2011 Dane County Blacks were 5.3 times as likely as non-Hispanic Whites to be unemployed. 5.3/1 Wisconsin Blacks were 3.6 times as likely as non-Hispanic Whites to be unemployed. 3.6/1 Nationwide, Blacks were 2.1 times as likely as non-Hispanic Whites to be unemployed. 2.1/1
Year DISPROPORTIONALITY RATIOS Ratio2011 Dane County Blacks made up 4.1% of the labor force but 17.7% of the unemployed. 4.3 Wisconsin Blacks made up 4.9% of the labor force but 13.8% of the unemployed. 2.8 Nationwide, Blacks made up 11.8% of the labor force but 20.2% of the unemployed. 1.7
Source: One-year estimates from the American Community Survey, U.S. Census Bureau. The ACS is a
sample, and has margins of error, some of which can be significant. Definitions: All civilians 16 years old and over are classified as unemployed if they (1) were neither "at
work" nor "with a job but not at work" during the reference week, (2) were actively looking for work during the last 4 weeks, and (3) were available to accept a job.
Frequency of reporting: Annual.
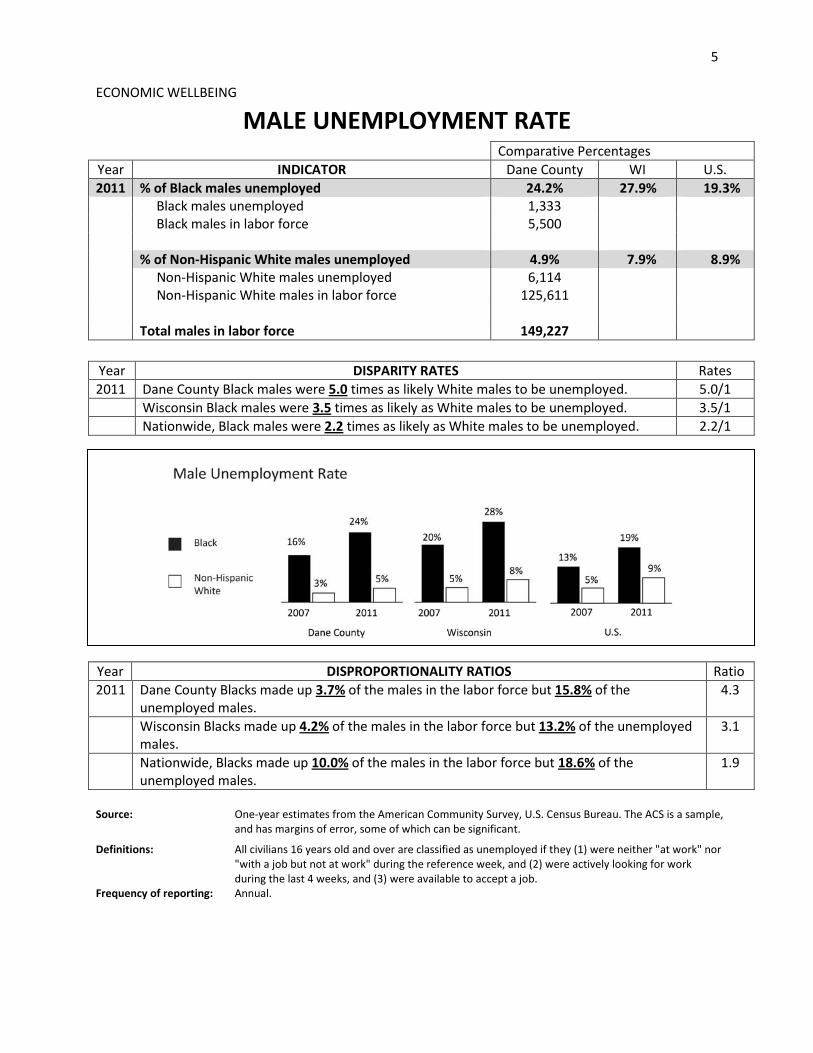
5
ECONOMIC WELLBEING
MALE UNEMPLOYMENT RATE Comparative Percentages Year INDICATOR Dane County WI U.S.2011 % of Black males unemployed 24.2% 27.9% 19.3% Black males unemployed 1,333 Black males in labor force 5,500 % of Non-Hispanic White males unemployed 4.9% 7.9% 8.9% Non-Hispanic White males unemployed 6,114 Non-Hispanic White males in labor force 125,611 Total males in labor force 149,227 Year DISPARITY RATES Rates2011 Dane County Black males were 5.0 times as likely White males to be unemployed. 5.0/1 Wisconsin Black males were 3.5 times as likely as White males to be unemployed. 3.5/1 Nationwide, Black males were 2.2 times as likely as White males to be unemployed. 2.2/1 Year DISPROPORTIONALITY RATIOS Ratio2011 Dane County Blacks made up 3.7% of the males in the labor force but 15.8% of the
unemployed males. 4.3
Wisconsin Blacks made up 4.2% of the males in the labor force but 13.2% of the unemployed males.
3.1
Nationwide, Blacks made up 10.0% of the males in the labor force but 18.6% of the unemployed males.
1.9
Source: One-year estimates from the American Community Survey, U.S. Census Bureau. The ACS is a sample,
and has margins of error, some of which can be significant.
Definitions: All civilians 16 years old and over are classified as unemployed if they (1) were neither "at work" nor "with a job but not at work" during the reference week, and (2) were actively looking for work during the last 4 weeks, and (3) were available to accept a job.
Frequency of reporting: Annual.
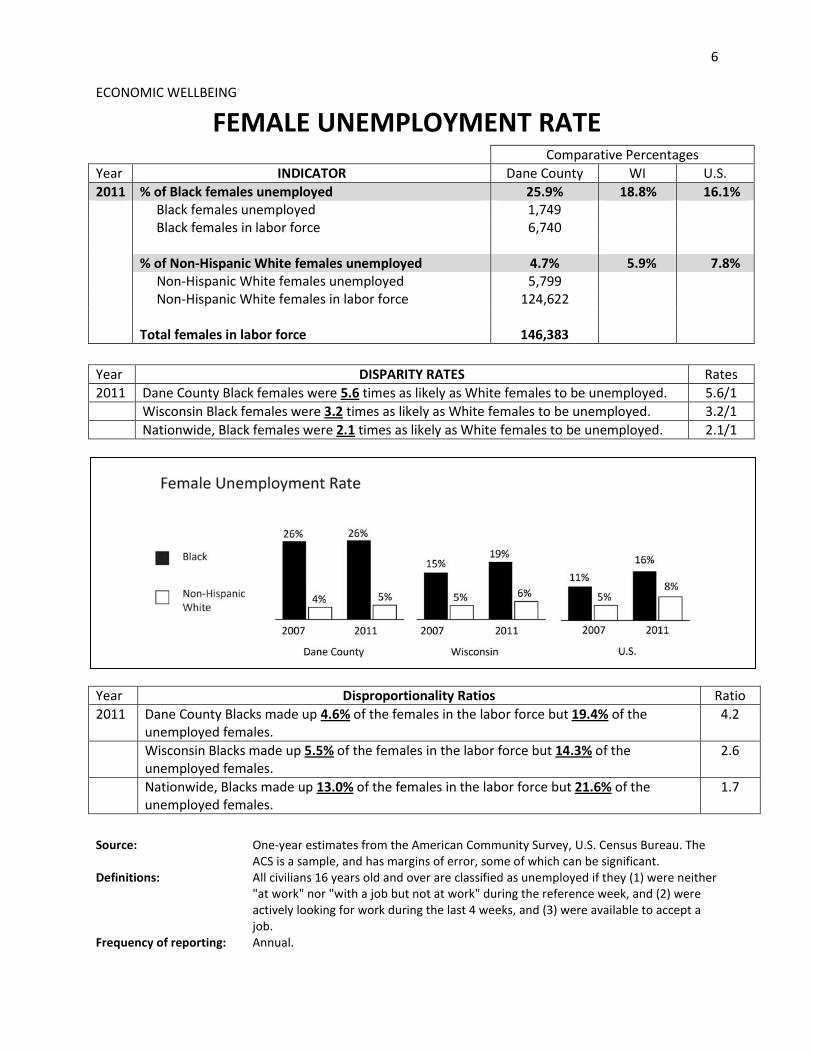
6
ECONOMIC WELLBEING
FEMALE UNEMPLOYMENT RATE Comparative PercentagesYear INDICATOR Dane County WI U.S.2011 % of Black females unemployed 25.9% 18.8% 16.1% Black females unemployed 1,749 Black females in labor force 6,740 % of Non-Hispanic White females unemployed 4.7% 5.9% 7.8% Non-Hispanic White females unemployed 5,799 Non-Hispanic White females in labor force 124,622 Total females in labor force 146,383 Year DISPARITY RATES Rates2011 Dane County Black females were 5.6 times as likely as White females to be unemployed. 5.6/1 Wisconsin Black females were 3.2 times as likely as White females to be unemployed. 3.2/1 Nationwide, Black females were 2.1 times as likely as White females to be unemployed. 2.1/1 Year Disproportionality Ratios Ratio2011 Dane County Blacks made up 4.6% of the females in the labor force but 19.4% of the
unemployed females. 4.2
Wisconsin Blacks made up 5.5% of the females in the labor force but 14.3% of the unemployed females.
2.6
Nationwide, Blacks made up 13.0% of the females in the labor force but 21.6% of the unemployed females.
1.7
Source: One-year estimates from the American Community Survey, U.S. Census Bureau. The
ACS is a sample, and has margins of error, some of which can be significant. Definitions: All civilians 16 years old and over are classified as unemployed if they (1) were neither
"at work" nor "with a job but not at work" during the reference week, and (2) were actively looking for work during the last 4 weeks, and (3) were available to accept a job.
Frequency of reporting: Annual.
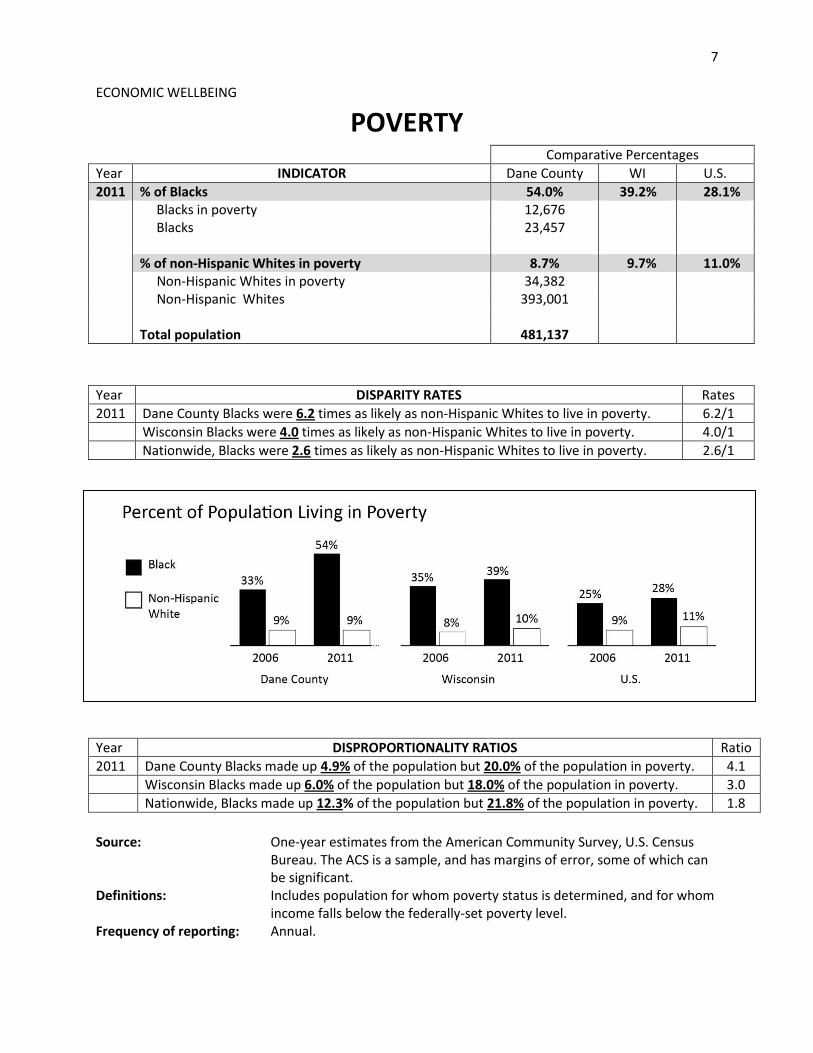
7
ECONOMIC WELLBEING
POVERTY Comparative PercentagesYear INDICATOR Dane County WI U.S.2011 % of Blacks 54.0% 39.2% 28.1% Blacks in poverty 12,676 Blacks 23,457 % of non-Hispanic Whites in poverty 8.7% 9.7% 11.0% Non-Hispanic Whites in poverty 34,382 Non-Hispanic Whites 393,001 Total population 481,137 Year DISPARITY RATES Rates2011 Dane County Blacks were 6.2 times as likely as non-Hispanic Whites to live in poverty. 6.2/1 Wisconsin Blacks were 4.0 times as likely as non-Hispanic Whites to live in poverty. 4.0/1 Nationwide, Blacks were 2.6 times as likely as non-Hispanic Whites to live in poverty. 2.6/1
Year DISPROPORTIONALITY RATIOS Ratio2011 Dane County Blacks made up 4.9% of the population but 20.0% of the population in poverty. 4.1 Wisconsin Blacks made up 6.0% of the population but 18.0% of the population in poverty. 3.0 Nationwide, Blacks made up 12.3% of the population but 21.8% of the population in poverty. 1.8
Source: One-year estimates from the American Community Survey, U.S. Census Bureau. The ACS is a sample, and has margins of error, some of which can be significant.
Definitions: Includes population for whom poverty status is determined, and for whom income falls below the federally-set poverty level.
Frequency of reporting: Annual.
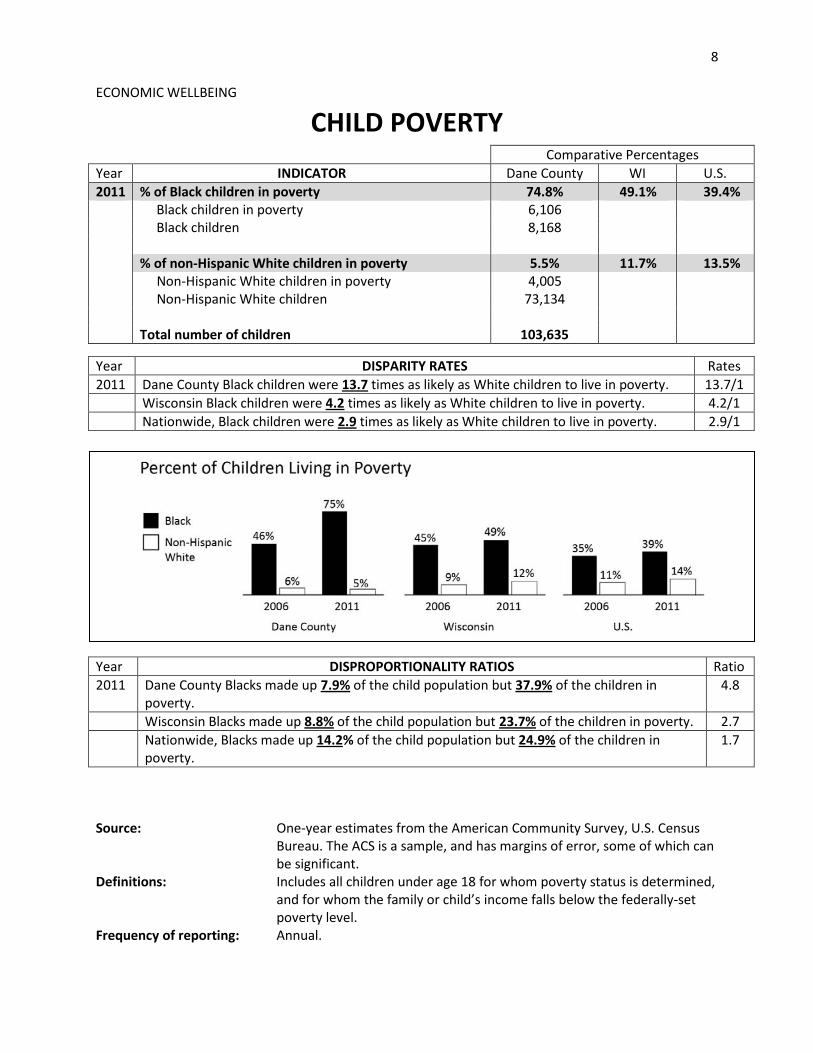
8
ECONOMIC WELLBEING
CHILD POVERTY Comparative PercentagesYear INDICATOR Dane County WI U.S.2011 % of Black children in poverty 74.8% 49.1% 39.4% Black children in poverty 6,106 Black children 8,168 % of non-Hispanic White children in poverty 5.5% 11.7% 13.5% Non-Hispanic White children in poverty 4,005 Non-Hispanic White children 73,134 Total number of children 103,635
Year DISPARITY RATES Rates2011 Dane County Black children were 13.7 times as likely as White children to live in poverty. 13.7/1 Wisconsin Black children were 4.2 times as likely as White children to live in poverty. 4.2/1 Nationwide, Black children were 2.9 times as likely as White children to live in poverty. 2.9/1
Year DISPROPORTIONALITY RATIOS Ratio2011 Dane County Blacks made up 7.9% of the child population but 37.9% of the children in
poverty. 4.8
Wisconsin Blacks made up 8.8% of the child population but 23.7% of the children in poverty. 2.7 Nationwide, Blacks made up 14.2% of the child population but 24.9% of the children in
poverty. 1.7
Source: One-year estimates from the American Community Survey, U.S. Census Bureau. The ACS is a sample, and has margins of error, some of which can be significant.
Definitions: Includes all children under age 18 for whom poverty status is determined, and for whom the family or child’s income falls below the federally-set poverty level.
Frequency of reporting: Annual.
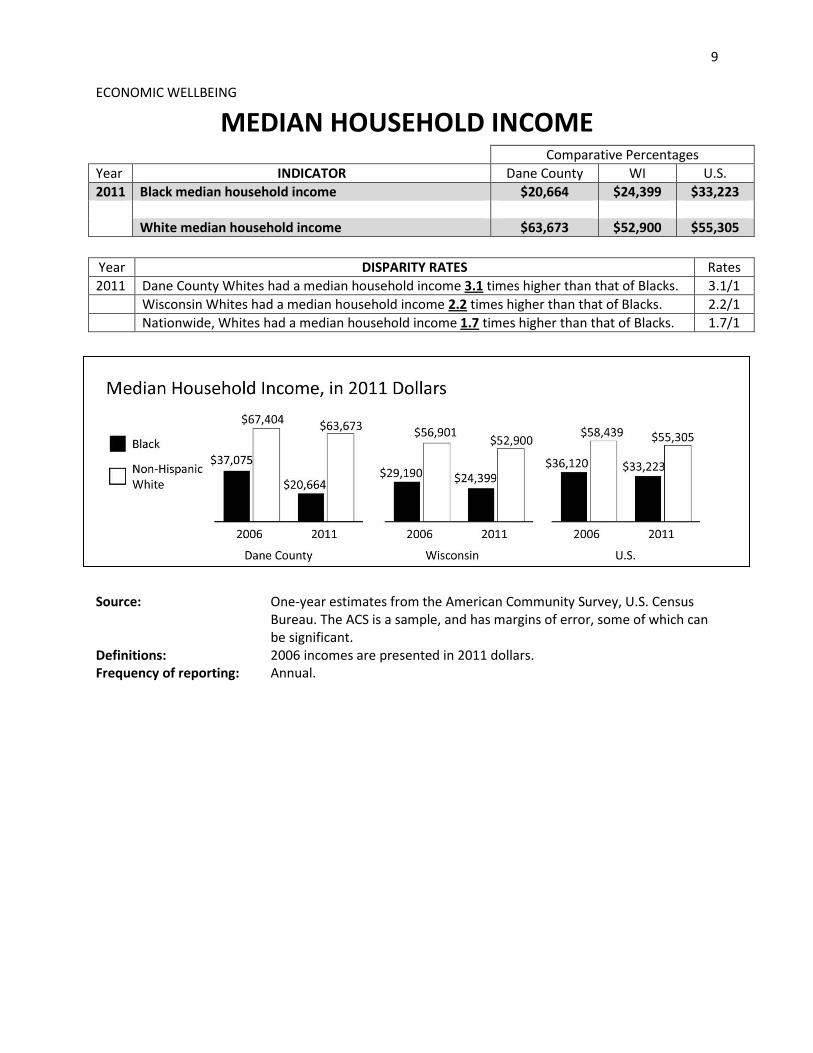
9
ECONOMIC WELLBEING
MEDIAN HOUSEHOLD INCOME Comparative PercentagesYear INDICATOR Dane County WI U.S.2011 Black median household income $20,664 $24,399 $33,223 White median household income $63,673 $52,900 $55,305 Year DISPARITY RATES Rates2011 Dane County Whites had a median household income 3.1 times higher than that of Blacks. 3.1/1 Wisconsin Whites had a median household income 2.2 times higher than that of Blacks. 2.2/1 Nationwide, Whites had a median household income 1.7 times higher than that of Blacks. 1.7/1
Source: One-year estimates from the American Community Survey, U.S. Census
Bureau. The ACS is a sample, and has margins of error, some of which can be significant.
Definitions: 2006 incomes are presented in 2011 dollars.Frequency of reporting: Annual.
�
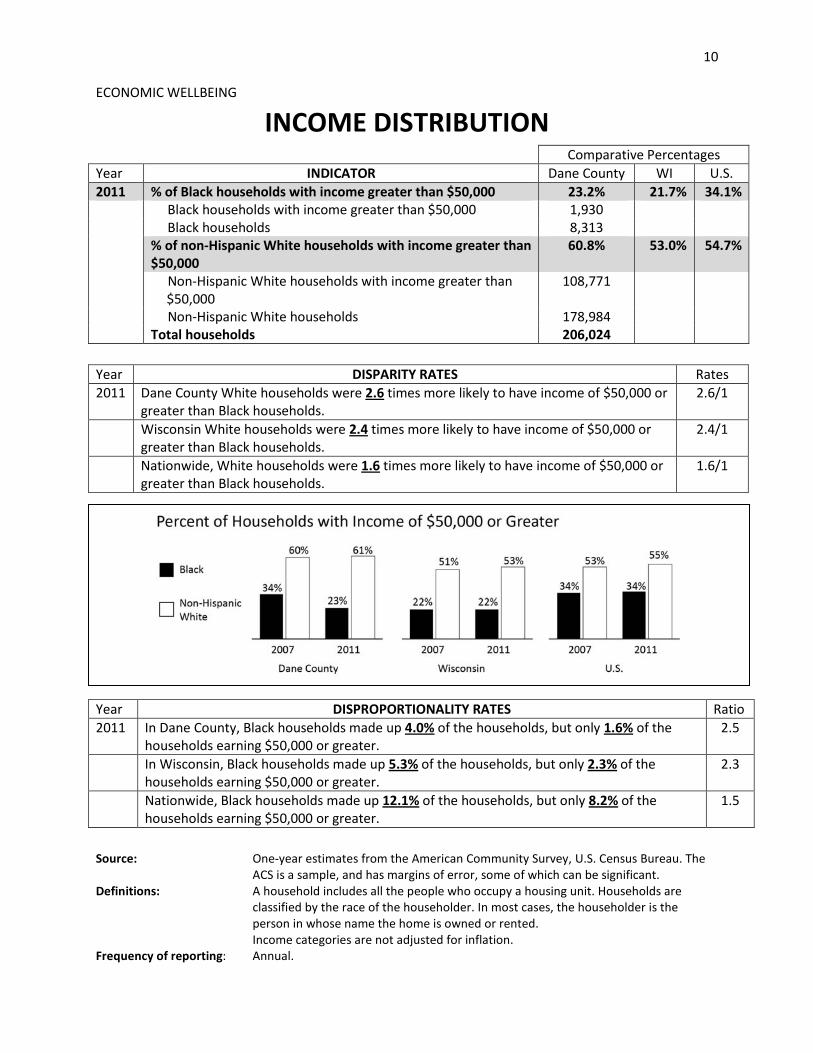
10
ECONOMIC WELLBEING
INCOME DISTRIBUTION Comparative PercentagesYear INDICATOR Dane County WI U.S.2011 % of Black households with income greater than $50,000 23.2% 21.7% 34.1% Black households with income greater than $50,000 1,930 Black households 8,313 % of non-Hispanic White households with income greater than
$50,000 60.8% 53.0% 54.7%
Non-Hispanic White households with income greater than $50,000
108,771
Non-Hispanic White households 178,984 Total households 206,024 Year DISPARITY RATES Rates2011 Dane County White households were 2.6 times more likely to have income of $50,000 or
greater than Black households. 2.6/1
Wisconsin White households were 2.4 times more likely to have income of $50,000 or greater than Black households.
2.4/1
Nationwide, White households were 1.6 times more likely to have income of $50,000 or greater than Black households.
1.6/1
Source: One-year estimates from the American Community Survey, U.S. Census Bureau. The
ACS is a sample, and has margins of error, some of which can be significant. Definitions: A household includes all the people who occupy a housing unit. Households are
classified by the race of the householder. In most cases, the householder is the person in whose name the home is owned or rented. Income categories are not adjusted for inflation.
Frequency of reporting: Annual.
Year DISPROPORTIONALITY RATES Ratio2011 In Dane County, Black households made up 4.0% of the households, but only 1.6% of the
households earning $50,000 or greater. 2.5
In Wisconsin, Black households made up 5.3% of the households, but only 2.3% of the households earning $50,000 or greater.
2.3
Nationwide, Black households made up 12.1% of the households, but only 8.2% of the households earning $50,000 or greater.
1.5
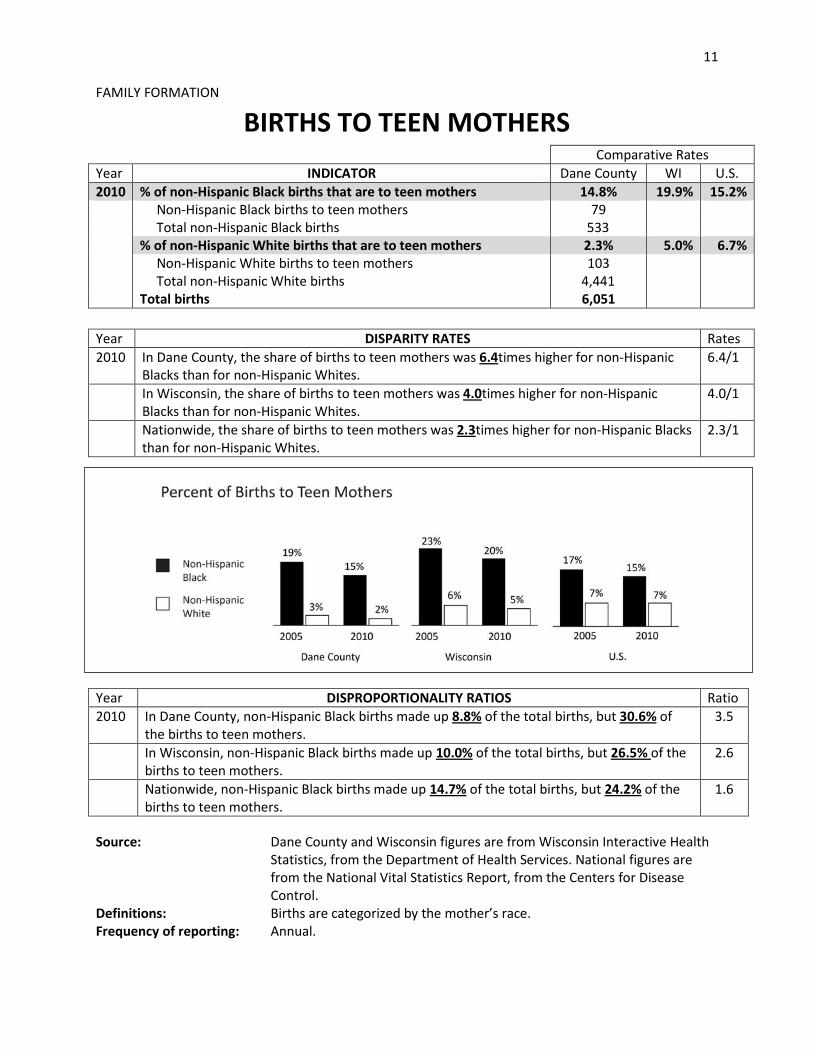
11
FAMILY FORMATION
BIRTHS TO TEEN MOTHERS Comparative RatesYear INDICATOR Dane County WI U.S.2010 % of non-Hispanic Black births that are to teen mothers 14.8% 19.9% 15.2% Non-Hispanic Black births to teen mothers 79 Total non-Hispanic Black births 533 % of non-Hispanic White births that are to teen mothers 2.3% 5.0% 6.7% Non-Hispanic White births to teen mothers 103 Total non-Hispanic White births 4,441 Total births 6,051 Year DISPARITY RATES Rates2010 In Dane County, the share of births to teen mothers was 6.4times higher for non-Hispanic
Blacks than for non-Hispanic Whites. 6.4/1
In Wisconsin, the share of births to teen mothers was 4.0times higher for non-Hispanic Blacks than for non-Hispanic Whites.
4.0/1
Nationwide, the share of births to teen mothers was 2.3times higher for non-Hispanic Blacks than for non-Hispanic Whites.
2.3/1
Year DISPROPORTIONALITY RATIOS Ratio2010 In Dane County, non-Hispanic Black births made up 8.8% of the total births, but 30.6% of
the births to teen mothers. 3.5
In Wisconsin, non-Hispanic Black births made up 10.0% of the total births, but 26.5% of the births to teen mothers.
2.6
Nationwide, non-Hispanic Black births made up 14.7% of the total births, but 24.2% of the births to teen mothers.
1.6
Source: Dane County and Wisconsin figures are from Wisconsin Interactive Health Statistics, from the Department of Health Services. National figures are from the National Vital Statistics Report, from the Centers for Disease Control.
Definitions: Births are categorized by the mother’s race. Frequency of reporting: Annual.
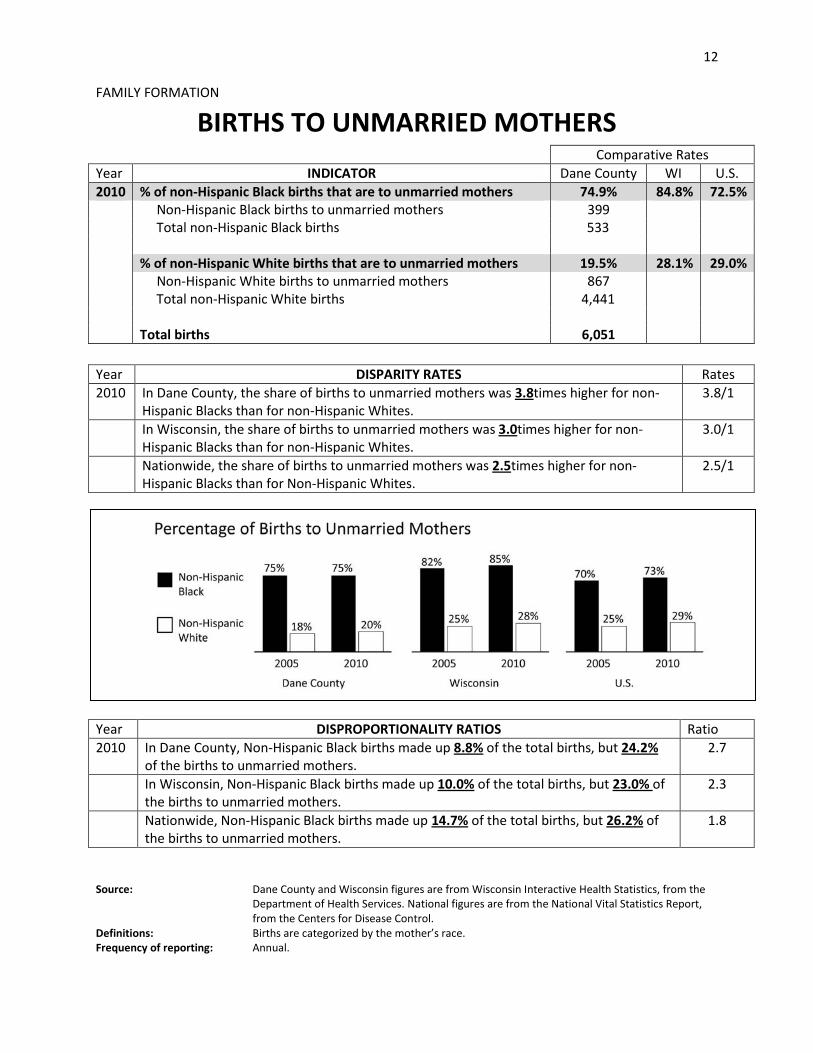
12
FAMILY FORMATION
BIRTHS TO UNMARRIED MOTHERS Comparative RatesYear INDICATOR Dane County WI U.S.2010 % of non-Hispanic Black births that are to unmarried mothers 74.9% 84.8% 72.5% Non-Hispanic Black births to unmarried mothers 399 Total non-Hispanic Black births 533 % of non-Hispanic White births that are to unmarried mothers 19.5% 28.1% 29.0% Non-Hispanic White births to unmarried mothers 867 Total non-Hispanic White births 4,441 Total births 6,051 Year DISPARITY RATES Rates2010 In Dane County, the share of births to unmarried mothers was 3.8times higher for non-
Hispanic Blacks than for non-Hispanic Whites. 3.8/1
In Wisconsin, the share of births to unmarried mothers was 3.0times higher for non-Hispanic Blacks than for non-Hispanic Whites.
3.0/1
Nationwide, the share of births to unmarried mothers was 2.5times higher for non-Hispanic Blacks than for Non-Hispanic Whites.
2.5/1
Year DISPROPORTIONALITY RATIOS Ratio2010 In Dane County, Non-Hispanic Black births made up 8.8% of the total births, but 24.2%
of the births to unmarried mothers. 2.7
In Wisconsin, Non-Hispanic Black births made up 10.0% of the total births, but 23.0% of the births to unmarried mothers.
2.3
Nationwide, Non-Hispanic Black births made up 14.7% of the total births, but 26.2% of the births to unmarried mothers.
1.8
Source: Dane County and Wisconsin figures are from Wisconsin Interactive Health Statistics, from the Department of Health Services. National figures are from the National Vital Statistics Report, from the Centers for Disease Control.
Definitions: Births are categorized by the mother’s race. Frequency of reporting: Annual.
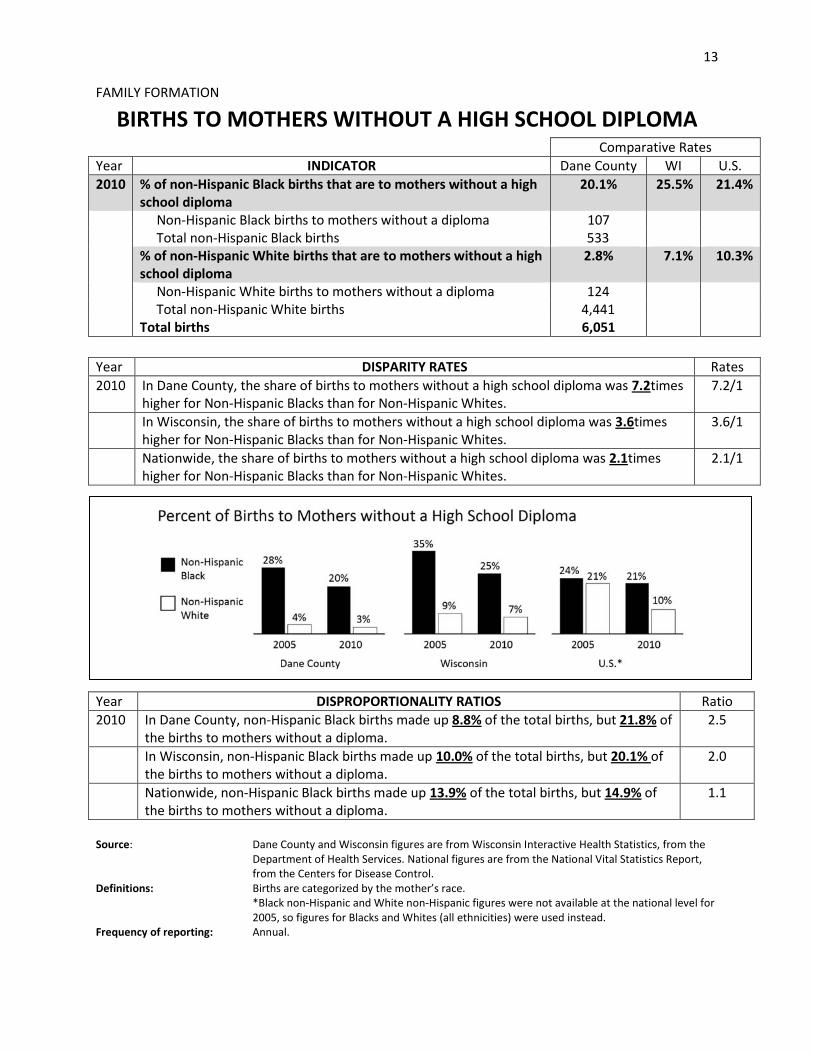
13
FAMILY FORMATION
BIRTHS TO MOTHERS WITHOUT A HIGH SCHOOL DIPLOMA Comparative RatesYear INDICATOR Dane County WI U.S.2010 % of non-Hispanic Black births that are to mothers without a high
school diploma 20.1% 25.5% 21.4%
Non-Hispanic Black births to mothers without a diploma 107 Total non-Hispanic Black births 533 % of non-Hispanic White births that are to mothers without a high
school diploma 2.8% 7.1% 10.3%
Non-Hispanic White births to mothers without a diploma 124 Total non-Hispanic White births 4,441 Total births 6,051 Year DISPARITY RATES Rates2010 In Dane County, the share of births to mothers without a high school diploma was 7.2times
higher for Non-Hispanic Blacks than for Non-Hispanic Whites. 7.2/1
In Wisconsin, the share of births to mothers without a high school diploma was 3.6times higher for Non-Hispanic Blacks than for Non-Hispanic Whites.
3.6/1
Nationwide, the share of births to mothers without a high school diploma was 2.1times higher for Non-Hispanic Blacks than for Non-Hispanic Whites.
2.1/1
Source: Dane County and Wisconsin figures are from Wisconsin Interactive Health Statistics, from the Department of Health Services. National figures are from the National Vital Statistics Report, from the Centers for Disease Control.
Definitions: Births are categorized by the mother’s race. *Black non-Hispanic and White non-Hispanic figures were not available at the national level for 2005, so figures for Blacks and Whites (all ethnicities) were used instead.
Frequency of reporting: Annual.
Year DISPROPORTIONALITY RATIOS Ratio2010 In Dane County, non-Hispanic Black births made up 8.8% of the total births, but 21.8% of
the births to mothers without a diploma. 2.5
In Wisconsin, non-Hispanic Black births made up 10.0% of the total births, but 20.1% of the births to mothers without a diploma.
2.0
Nationwide, non-Hispanic Black births made up 13.9% of the total births, but 14.9% of the births to mothers without a diploma.
1.1
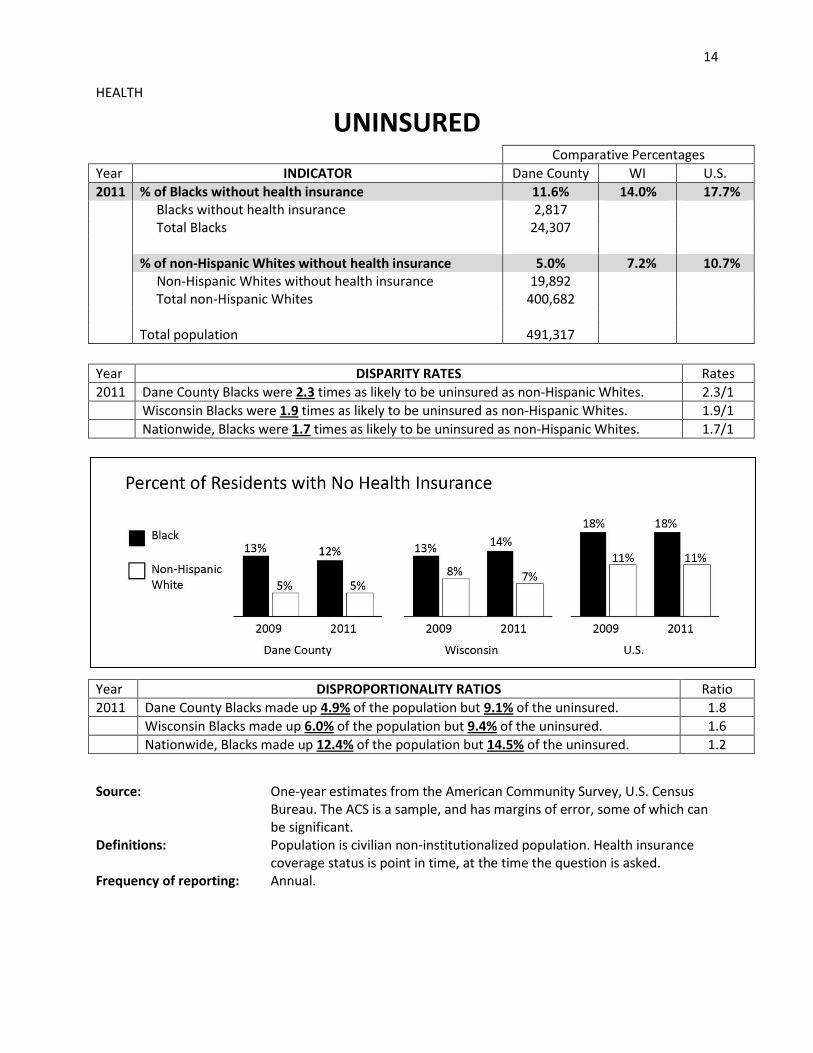
14
HEALTH
UNINSURED Comparative PercentagesYear INDICATOR Dane County WI U.S.2011 % of Blacks without health insurance 11.6% 14.0% 17.7% Blacks without health insurance 2,817 Total Blacks 24,307 % of non-Hispanic Whites without health insurance 5.0% 7.2% 10.7% Non-Hispanic Whites without health insurance 19,892 Total non-Hispanic Whites 400,682 Total population 491,317
Year DISPARITY RATES Rates2011 Dane County Blacks were 2.3 times as likely to be uninsured as non-Hispanic Whites. 2.3/1 Wisconsin Blacks were 1.9 times as likely to be uninsured as non-Hispanic Whites. 1.9/1 Nationwide, Blacks were 1.7 times as likely to be uninsured as non-Hispanic Whites. 1.7/1
Year DISPROPORTIONALITY RATIOS Ratio2011 Dane County Blacks made up 4.9% of the population but 9.1% of the uninsured. 1.8 Wisconsin Blacks made up 6.0% of the population but 9.4% of the uninsured. 1.6 Nationwide, Blacks made up 12.4% of the population but 14.5% of the uninsured. 1.2
Source: One-year estimates from the American Community Survey, U.S. Census Bureau. The ACS is a sample, and has margins of error, some of which can be significant.
Definitions: Population is civilian non-institutionalized population. Health insurance coverage status is point in time, at the time the question is asked.
Frequency of reporting: Annual.
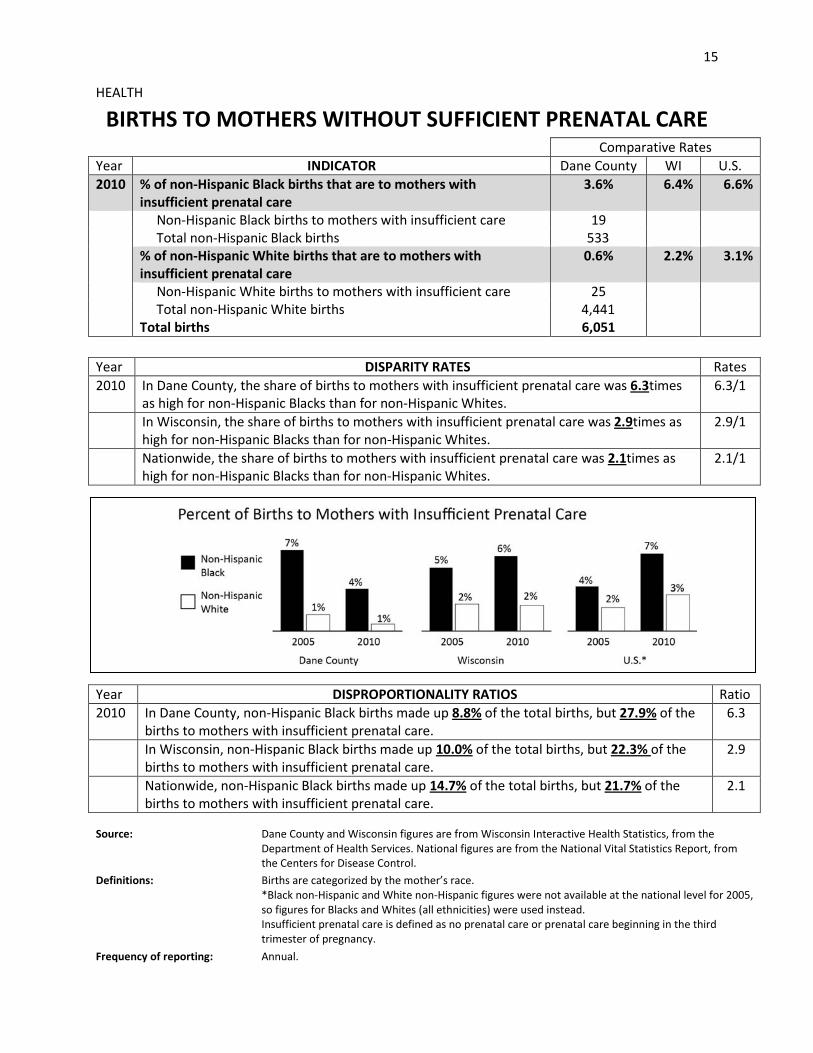
15
HEALTH
BIRTHS TO MOTHERS WITHOUT SUFFICIENT PRENATAL CARE Comparative RatesYear INDICATOR Dane County WI U.S.2010 % of non-Hispanic Black births that are to mothers with
insufficient prenatal care 3.6% 6.4% 6.6%
Non-Hispanic Black births to mothers with insufficient care 19 Total non-Hispanic Black births 533 % of non-Hispanic White births that are to mothers with
insufficient prenatal care 0.6% 2.2% 3.1%
Non-Hispanic White births to mothers with insufficient care 25 Total non-Hispanic White births 4,441 Total births 6,051 Year DISPARITY RATES Rates2010 In Dane County, the share of births to mothers with insufficient prenatal care was 6.3times
as high for non-Hispanic Blacks than for non-Hispanic Whites. 6.3/1
In Wisconsin, the share of births to mothers with insufficient prenatal care was 2.9times as high for non-Hispanic Blacks than for non-Hispanic Whites.
2.9/1
Nationwide, the share of births to mothers with insufficient prenatal care was 2.1times as high for non-Hispanic Blacks than for non-Hispanic Whites.
2.1/1
Year DISPROPORTIONALITY RATIOS Ratio2010 In Dane County, non-Hispanic Black births made up 8.8% of the total births, but 27.9% of the
births to mothers with insufficient prenatal care. 6.3
In Wisconsin, non-Hispanic Black births made up 10.0% of the total births, but 22.3% of the births to mothers with insufficient prenatal care.
2.9
Nationwide, non-Hispanic Black births made up 14.7% of the total births, but 21.7% of the births to mothers with insufficient prenatal care.
2.1
Source: Dane County and Wisconsin figures are from Wisconsin Interactive Health Statistics, from the Department of Health Services. National figures are from the National Vital Statistics Report, from the Centers for Disease Control.
Definitions: Births are categorized by the mother’s race. *Black non-Hispanic and White non-Hispanic figures were not available at the national level for 2005, so figures for Blacks and Whites (all ethnicities) were used instead. Insufficient prenatal care is defined as no prenatal care or prenatal care beginning in the third trimester of pregnancy.
Frequency of reporting: Annual.
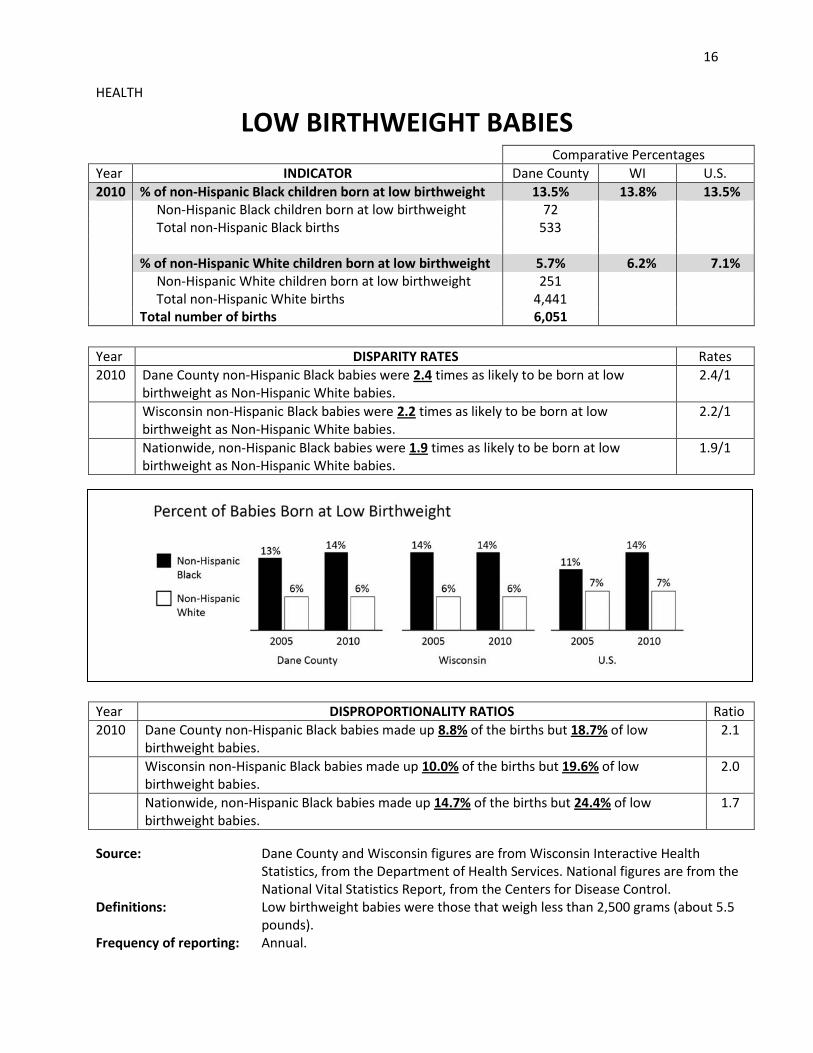
16
HEALTH
LOW BIRTHWEIGHT BABIES Comparative PercentagesYear INDICATOR Dane County WI U.S.2010 % of non-Hispanic Black children born at low birthweight 13.5% 13.8% 13.5% Non-Hispanic Black children born at low birthweight 72 Total non-Hispanic Black births 533 % of non-Hispanic White children born at low birthweight 5.7% 6.2% 7.1% Non-Hispanic White children born at low birthweight 251 Total non-Hispanic White births 4,441 Total number of births 6,051 Year DISPARITY RATES Rates2010 Dane County non-Hispanic Black babies were 2.4 times as likely to be born at low
birthweight as Non-Hispanic White babies. 2.4/1
Wisconsin non-Hispanic Black babies were 2.2 times as likely to be born at low birthweight as Non-Hispanic White babies.
2.2/1
Nationwide, non-Hispanic Black babies were 1.9 times as likely to be born at low birthweight as Non-Hispanic White babies.
1.9/1
Year DISPROPORTIONALITY RATIOS Ratio2010 Dane County non-Hispanic Black babies made up 8.8% of the births but 18.7% of low
birthweight babies. 2.1
Wisconsin non-Hispanic Black babies made up 10.0% of the births but 19.6% of low birthweight babies.
2.0
Nationwide, non-Hispanic Black babies made up 14.7% of the births but 24.4% of low birthweight babies.
1.7
Source: Dane County and Wisconsin figures are from Wisconsin Interactive Health Statistics, from the Department of Health Services. National figures are from the National Vital Statistics Report, from the Centers for Disease Control.
Definitions: Low birthweight babies were those that weigh less than 2,500 grams (about 5.5 pounds).
Frequency of reporting: Annual.
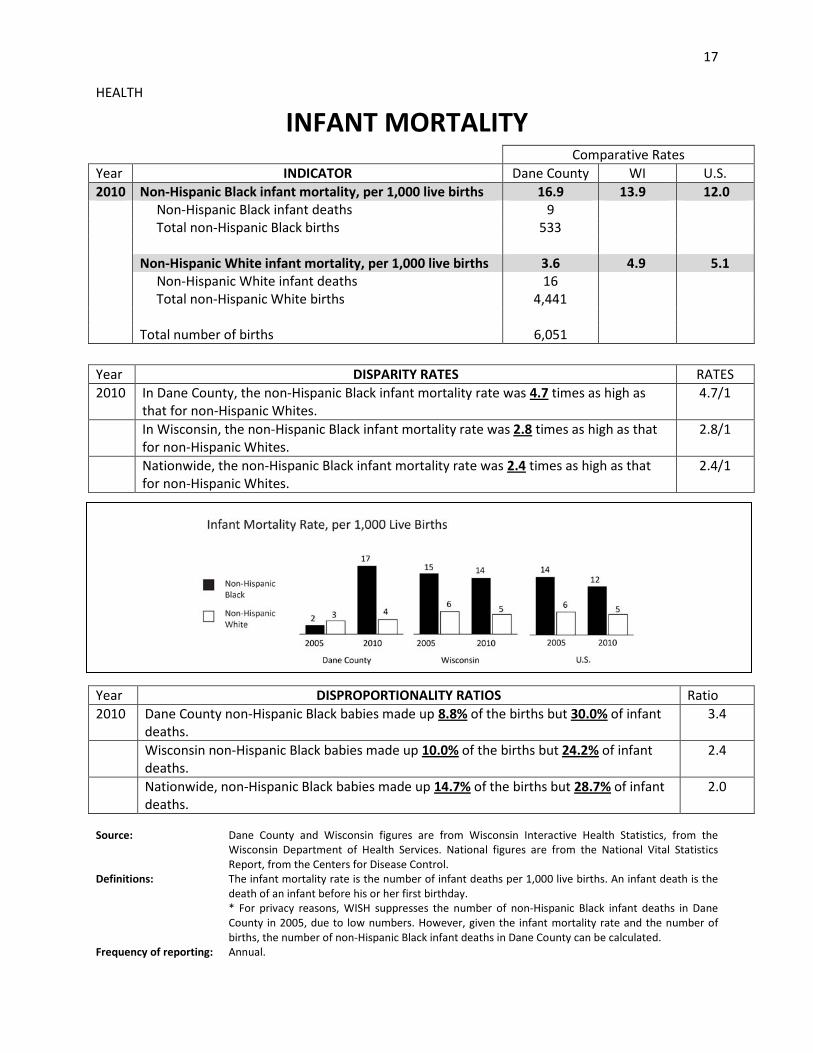
17
HEALTH
INFANT MORTALITY Comparative RatesYear INDICATOR Dane County WI U.S.2010 Non-Hispanic Black infant mortality, per 1,000 live births 16.9 13.9 12.0 Non-Hispanic Black infant deaths 9 Total non-Hispanic Black births 533 Non-Hispanic White infant mortality, per 1,000 live births 3.6 4.9 5.1 Non-Hispanic White infant deaths 16 Total non-Hispanic White births 4,441 Total number of births 6,051 Year DISPARITY RATES RATES2010 In Dane County, the non-Hispanic Black infant mortality rate was 4.7 times as high as
that for non-Hispanic Whites. 4.7/1
In Wisconsin, the non-Hispanic Black infant mortality rate was 2.8 times as high as that for non-Hispanic Whites.
2.8/1
Nationwide, the non-Hispanic Black infant mortality rate was 2.4 times as high as that for non-Hispanic Whites.
2.4/1
Year DISPROPORTIONALITY RATIOS Ratio2010 Dane County non-Hispanic Black babies made up 8.8% of the births but 30.0% of infant
deaths. 3.4
Wisconsin non-Hispanic Black babies made up 10.0% of the births but 24.2% of infant deaths.
2.4
Nationwide, non-Hispanic Black babies made up 14.7% of the births but 28.7% of infant deaths.
2.0
Source: Dane County and Wisconsin figures are from Wisconsin Interactive Health Statistics, from the Wisconsin Department of Health Services. National figures are from the National Vital Statistics Report, from the Centers for Disease Control.
Definitions: The infant mortality rate is the number of infant deaths per 1,000 live births. An infant death is the death of an infant before his or her first birthday. * For privacy reasons, WISH suppresses the number of non-Hispanic Black infant deaths in Dane County in 2005, due to low numbers. However, given the infant mortality rate and the number of births, the number of non-Hispanic Black infant deaths in Dane County can be calculated.
Frequency of reporting: Annual.
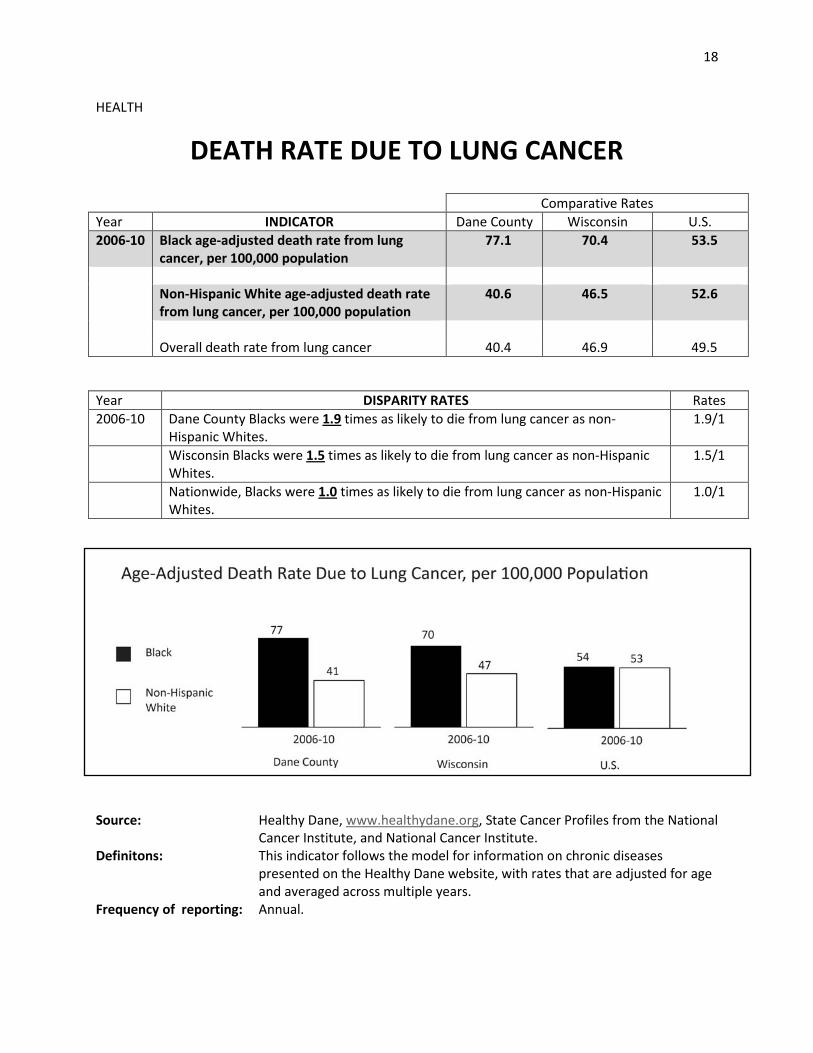
18
HEALTH
DEATH RATE DUE TO LUNG CANCER Comparative Rates Year INDICATOR Dane County Wisconsin U.S.2006-10 Black age-adjusted death rate from lung
cancer, per 100,000 population 77.1 70.4 53.5
Non-Hispanic White age-adjusted death rate
from lung cancer, per 100,000 population 40.6 46.5 52.6
Overall death rate from lung cancer 40.4 46.9 49.5
Year DISPARITY RATES Rates2006-10 Dane County Blacks were 1.9 times as likely to die from lung cancer as non-
Hispanic Whites. 1.9/1
Wisconsin Blacks were 1.5 times as likely to die from lung cancer as non-Hispanic Whites.
1.5/1
Nationwide, Blacks were 1.0 times as likely to die from lung cancer as non-Hispanic Whites.
1.0/1
Source: Healthy Dane, www.healthydane.org, State Cancer Profiles from the National Cancer Institute, and National Cancer Institute.
Definitons: This indicator follows the model for information on chronic diseases presented on the Healthy Dane website, with rates that are adjusted for age and averaged across multiple years.
Frequency of reporting: Annual.
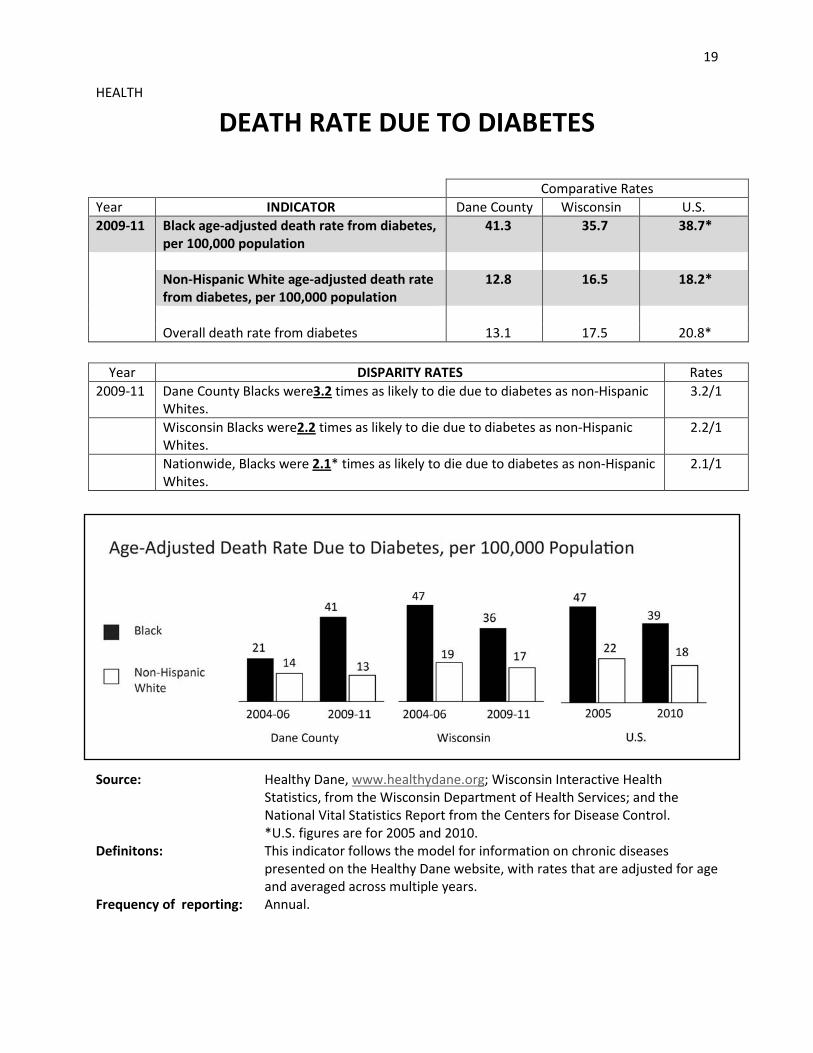
19
HEALTH
DEATH RATE DUE TO DIABETES
Comparative Rates Year INDICATOR Dane County Wisconsin U.S.2009-11 Black age-adjusted death rate from diabetes,
per 100,000 population 41.3 35.7 38.7*
Non-Hispanic White age-adjusted death rate
from diabetes, per 100,000 population 12.8 16.5 18.2*
Overall death rate from diabetes 13.1 17.5 20.8*
Year DISPARITY RATES Rates2009-11 Dane County Blacks were3.2 times as likely to die due to diabetes as non-Hispanic
Whites. 3.2/1
Wisconsin Blacks were2.2 times as likely to die due to diabetes as non-Hispanic Whites.
2.2/1
Nationwide, Blacks were 2.1* times as likely to die due to diabetes as non-Hispanic Whites.
2.1/1
Source: Healthy Dane, www.healthydane.org; Wisconsin Interactive Health Statistics, from the Wisconsin Department of Health Services; and the National Vital Statistics Report from the Centers for Disease Control. *U.S. figures are for 2005 and 2010.
Definitons: This indicator follows the model for information on chronic diseases presented on the Healthy Dane website, with rates that are adjusted for age and averaged across multiple years.
Frequency of reporting: Annual.
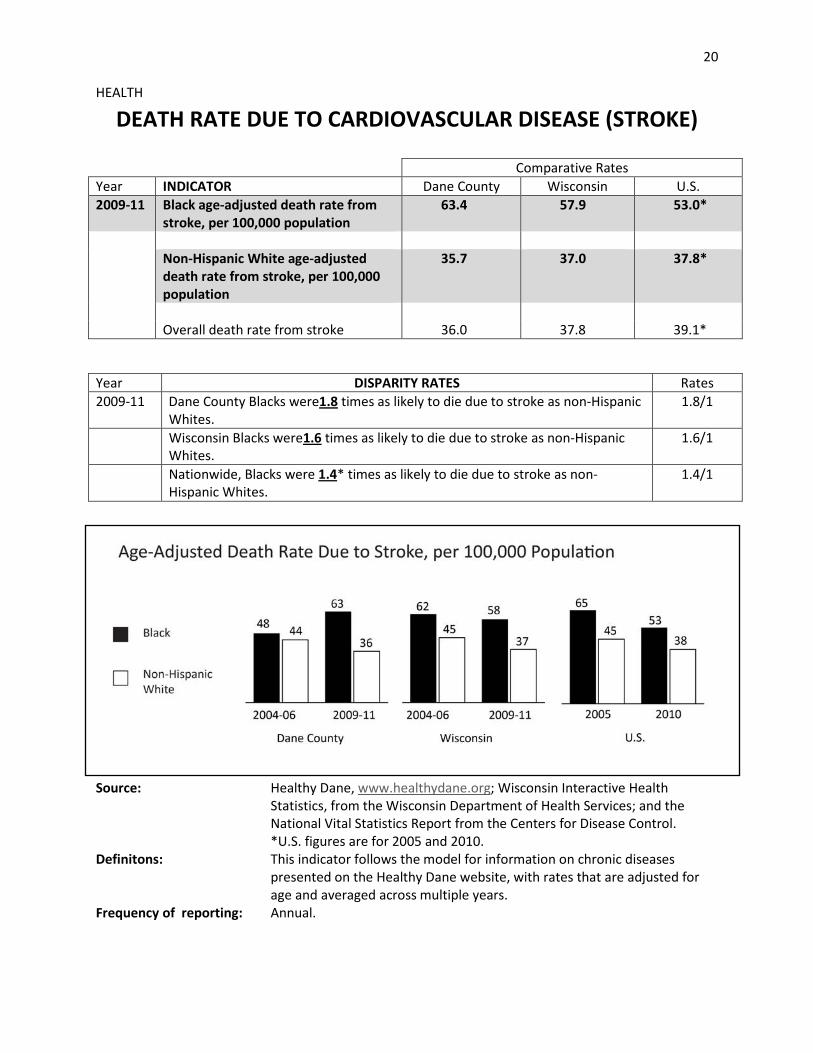
20
HEALTH
DEATH RATE DUE TO CARDIOVASCULAR DISEASE (STROKE) Comparative Rates Year INDICATOR Dane County Wisconsin U.S.2009-11 Black age-adjusted death rate from
stroke, per 100,000 population 63.4 57.9 53.0*
Non-Hispanic White age-adjusted
death rate from stroke, per 100,000 population
35.7 37.0 37.8*
Overall death rate from stroke 36.0 37.8 39.1*
Year DISPARITY RATES Rates2009-11 Dane County Blacks were1.8 times as likely to die due to stroke as non-Hispanic
Whites. 1.8/1
Wisconsin Blacks were1.6 times as likely to die due to stroke as non-Hispanic Whites.
1.6/1
Nationwide, Blacks were 1.4* times as likely to die due to stroke as non-Hispanic Whites.
1.4/1
Source: Healthy Dane, www.healthydane.org; Wisconsin Interactive Health Statistics, from the Wisconsin Department of Health Services; and the National Vital Statistics Report from the Centers for Disease Control. *U.S. figures are for 2005 and 2010.
Definitons: This indicator follows the model for information on chronic diseases presented on the Healthy Dane website, with rates that are adjusted for age and averaged across multiple years.
Frequency of reporting: Annual.
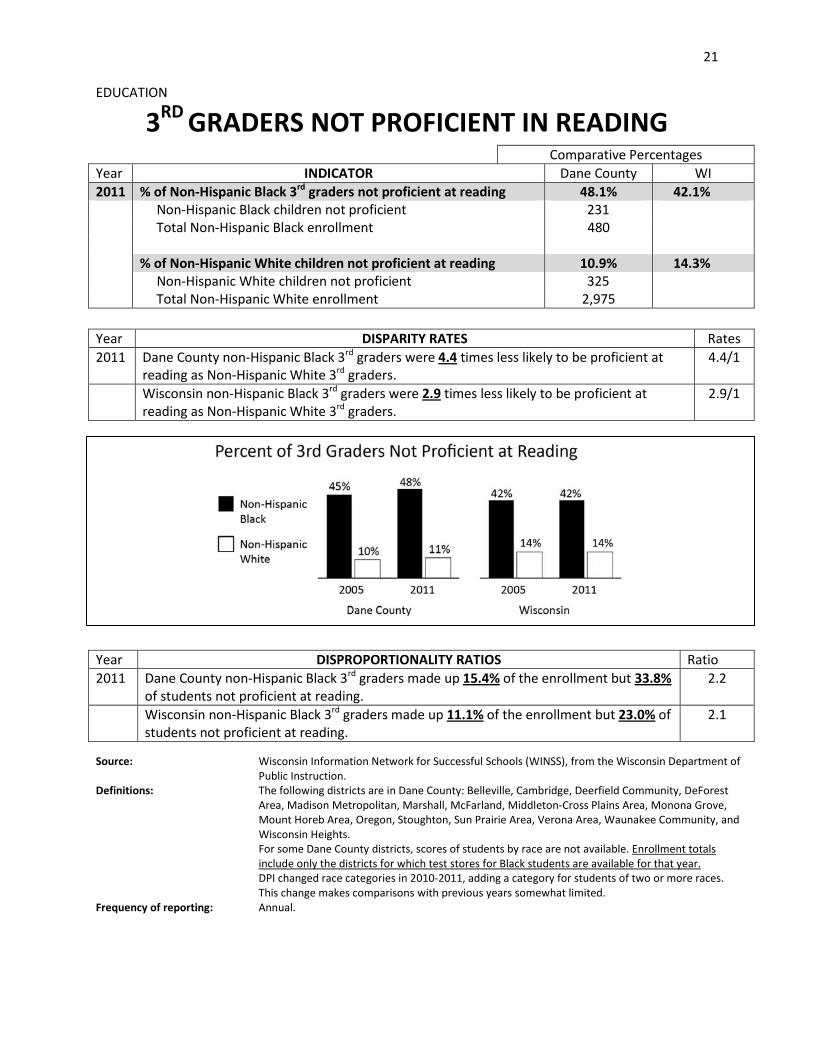
21
EDUCATION
3RD GRADERS NOT PROFICIENT IN READING Comparative PercentagesYear INDICATOR Dane County WI2011 % of Non-Hispanic Black 3rd graders not proficient at reading 48.1% 42.1% Non-Hispanic Black children not proficient 231 Total Non-Hispanic Black enrollment 480 % of Non-Hispanic White children not proficient at reading 10.9% 14.3% Non-Hispanic White children not proficient 325 Total Non-Hispanic White enrollment 2,975 Year DISPARITY RATES Rates2011 Dane County non-Hispanic Black 3rd graders were 4.4 times less likely to be proficient at
reading as Non-Hispanic White 3rd graders. 4.4/1
Wisconsin non-Hispanic Black 3rd graders were 2.9 times less likely to be proficient at reading as Non-Hispanic White 3rd graders.
2.9/1
Year DISPROPORTIONALITY RATIOS Ratio2011 Dane County non-Hispanic Black 3rd graders made up 15.4% of the enrollment but 33.8%
of students not proficient at reading. 2.2
Wisconsin non-Hispanic Black 3rd graders made up 11.1% of the enrollment but 23.0% of students not proficient at reading.
2.1
Source: Wisconsin Information Network for Successful Schools (WINSS), from the Wisconsin Department of Public Instruction.
Definitions: The following districts are in Dane County: Belleville, Cambridge, Deerfield Community, DeForest Area, Madison Metropolitan, Marshall, McFarland, Middleton-Cross Plains Area, Monona Grove, Mount Horeb Area, Oregon, Stoughton, Sun Prairie Area, Verona Area, Waunakee Community, and Wisconsin Heights. For some Dane County districts, scores of students by race are not available. Enrollment totals include only the districts for which test stores for Black students are available for that year. DPI changed race categories in 2010-2011, adding a category for students of two or more races. This change makes comparisons with previous years somewhat limited.
Frequency of reporting: Annual.
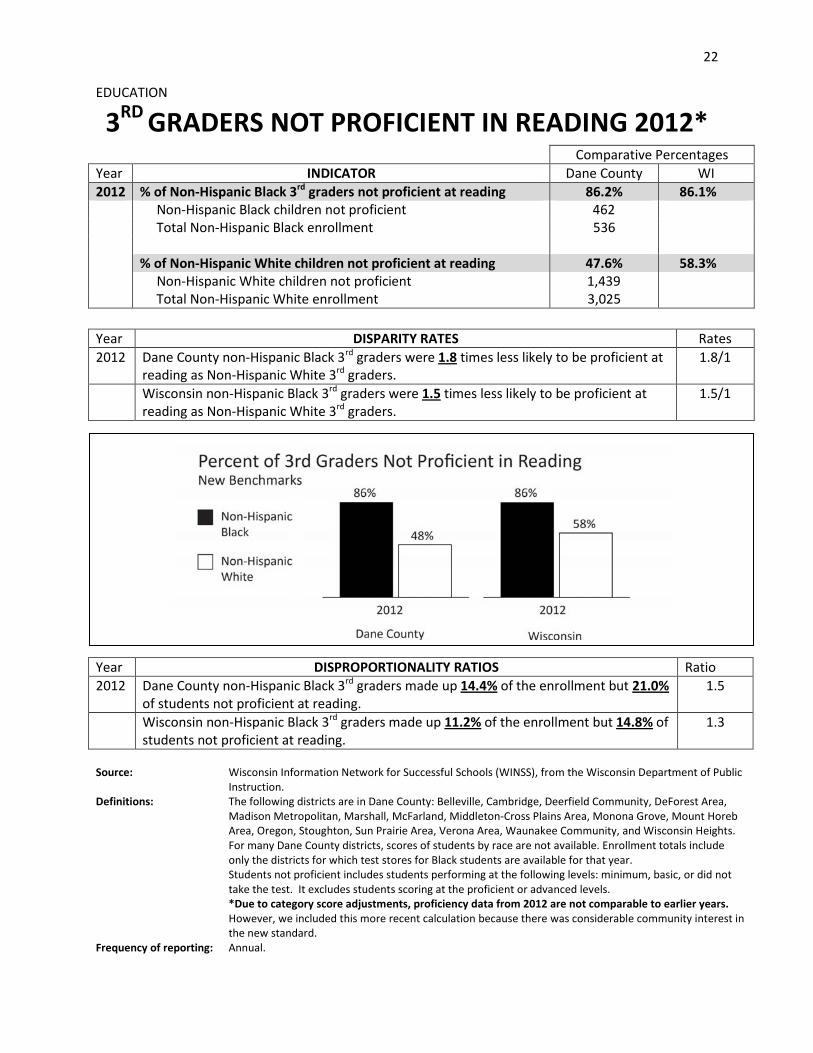
22
EDUCATION
3RD GRADERS NOT PROFICIENT IN READING 2012* Comparative PercentagesYear INDICATOR Dane County WI2012 % of Non-Hispanic Black 3rd graders not proficient at reading 86.2% 86.1% Non-Hispanic Black children not proficient 462 Total Non-Hispanic Black enrollment 536 % of Non-Hispanic White children not proficient at reading 47.6% 58.3% Non-Hispanic White children not proficient 1,439 Total Non-Hispanic White enrollment 3,025 Year DISPARITY RATES Rates2012 Dane County non-Hispanic Black 3rd graders were 1.8 times less likely to be proficient at
reading as Non-Hispanic White 3rd graders. 1.8/1
Wisconsin non-Hispanic Black 3rd graders were 1.5 times less likely to be proficient at reading as Non-Hispanic White 3rd graders.
1.5/1
Source: Wisconsin Information Network for Successful Schools (WINSS), from the Wisconsin Department of Public Instruction.
Definitions: The following districts are in Dane County: Belleville, Cambridge, Deerfield Community, DeForest Area, Madison Metropolitan, Marshall, McFarland, Middleton-Cross Plains Area, Monona Grove, Mount Horeb Area, Oregon, Stoughton, Sun Prairie Area, Verona Area, Waunakee Community, and Wisconsin Heights. For many Dane County districts, scores of students by race are not available. Enrollment totals include only the districts for which test stores for Black students are available for that year. Students not proficient includes students performing at the following levels: minimum, basic, or did not take the test. It excludes students scoring at the proficient or advanced levels. *Due to category score adjustments, proficiency data from 2012 are not comparable to earlier years. However, we included this more recent calculation because there was considerable community interest in the new standard.
Frequency of reporting: Annual.
Year DISPROPORTIONALITY RATIOS Ratio2012 Dane County non-Hispanic Black 3rd graders made up 14.4% of the enrollment but 21.0%
of students not proficient at reading. 1.5
Wisconsin non-Hispanic Black 3rd graders made up 11.2% of the enrollment but 14.8% of students not proficient at reading.
1.3
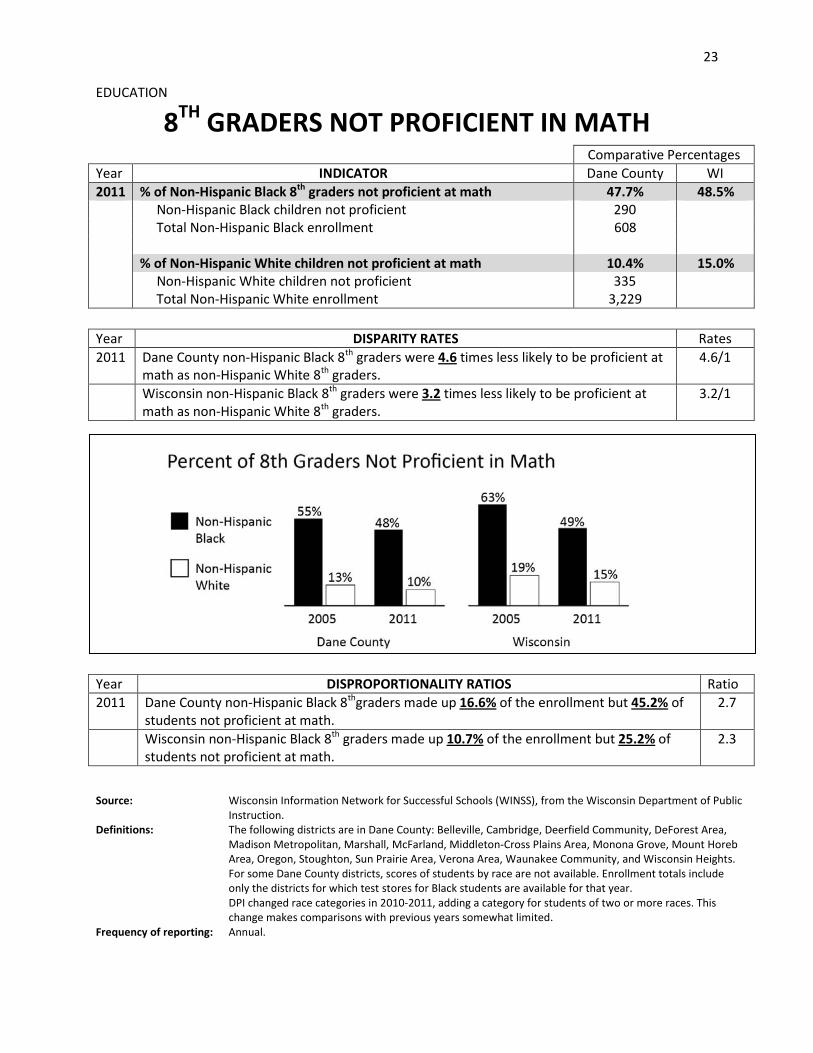
23
EDUCATION
8TH GRADERS NOT PROFICIENT IN MATH Comparative PercentagesYear INDICATOR Dane County WI2011 % of Non-Hispanic Black 8th graders not proficient at math 47.7% 48.5% Non-Hispanic Black children not proficient 290 Total Non-Hispanic Black enrollment 608 % of Non-Hispanic White children not proficient at math 10.4% 15.0% Non-Hispanic White children not proficient 335 Total Non-Hispanic White enrollment 3,229 Year DISPARITY RATES Rates2011 Dane County non-Hispanic Black 8th graders were 4.6 times less likely to be proficient at
math as non-Hispanic White 8th graders. 4.6/1
Wisconsin non-Hispanic Black 8th graders were 3.2 times less likely to be proficient at math as non-Hispanic White 8th graders.
3.2/1
Year DISPROPORTIONALITY RATIOS Ratio2011 Dane County non-Hispanic Black 8thgraders made up 16.6% of the enrollment but 45.2% of
students not proficient at math. 2.7
Wisconsin non-Hispanic Black 8th graders made up 10.7% of the enrollment but 25.2% of students not proficient at math.
2.3
Source: Wisconsin Information Network for Successful Schools (WINSS), from the Wisconsin Department of Public Instruction.
Definitions: The following districts are in Dane County: Belleville, Cambridge, Deerfield Community, DeForest Area, Madison Metropolitan, Marshall, McFarland, Middleton-Cross Plains Area, Monona Grove, Mount Horeb Area, Oregon, Stoughton, Sun Prairie Area, Verona Area, Waunakee Community, and Wisconsin Heights. For some Dane County districts, scores of students by race are not available. Enrollment totals include only the districts for which test stores for Black students are available for that year. DPI changed race categories in 2010-2011, adding a category for students of two or more races. This change makes comparisons with previous years somewhat limited.
Frequency of reporting: Annual.
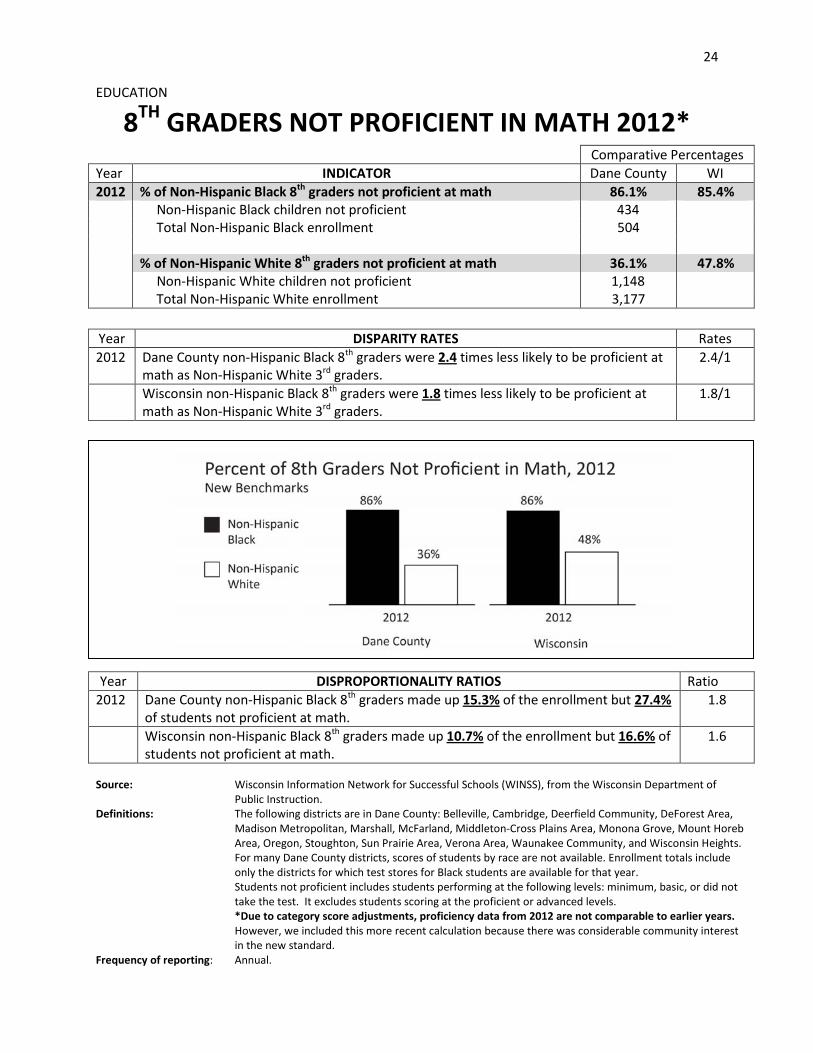
24
EDUCATION
8TH GRADERS NOT PROFICIENT IN MATH 2012* Comparative PercentagesYear INDICATOR Dane County WI2012 % of Non-Hispanic Black 8th graders not proficient at math 86.1% 85.4% Non-Hispanic Black children not proficient 434 Total Non-Hispanic Black enrollment 504 % of Non-Hispanic White 8th graders not proficient at math 36.1% 47.8% Non-Hispanic White children not proficient 1,148 Total Non-Hispanic White enrollment 3,177 Year DISPARITY RATES Rates2012 Dane County non-Hispanic Black 8th graders were 2.4 times less likely to be proficient at
math as Non-Hispanic White 3rd graders. 2.4/1
Wisconsin non-Hispanic Black 8th graders were 1.8 times less likely to be proficient at math as Non-Hispanic White 3rd graders.
1.8/1
Year DISPROPORTIONALITY RATIOS Ratio2012 Dane County non-Hispanic Black 8th graders made up 15.3% of the enrollment but 27.4%
of students not proficient at math. 1.8
Wisconsin non-Hispanic Black 8th graders made up 10.7% of the enrollment but 16.6% of students not proficient at math.
1.6
Source: Wisconsin Information Network for Successful Schools (WINSS), from the Wisconsin Department of Public Instruction.
Definitions: The following districts are in Dane County: Belleville, Cambridge, Deerfield Community, DeForest Area, Madison Metropolitan, Marshall, McFarland, Middleton-Cross Plains Area, Monona Grove, Mount Horeb Area, Oregon, Stoughton, Sun Prairie Area, Verona Area, Waunakee Community, and Wisconsin Heights. For many Dane County districts, scores of students by race are not available. Enrollment totals include only the districts for which test stores for Black students are available for that year. Students not proficient includes students performing at the following levels: minimum, basic, or did not take the test. It excludes students scoring at the proficient or advanced levels. *Due to category score adjustments, proficiency data from 2012 are not comparable to earlier years. However, we included this more recent calculation because there was considerable community interest in the new standard.
Frequency of reporting: Annual.
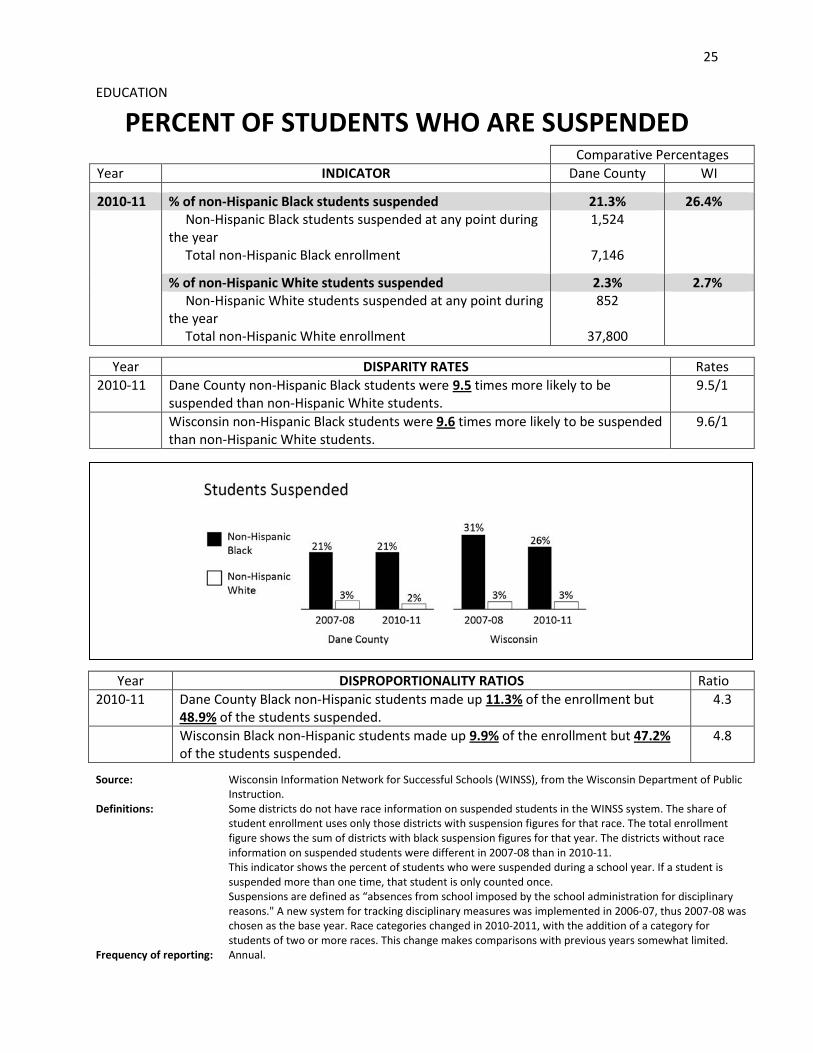
25
EDUCATION
PERCENT OF STUDENTS WHO ARE SUSPENDED Comparative PercentagesYear INDICATOR Dane County WI
2010-11 % of non-Hispanic Black students suspended 21.3% 26.4% Non-Hispanic Black students suspended at any point during
the year 1,524
Total non-Hispanic Black enrollment 7,146
% of non-Hispanic White students suspended 2.3% 2.7% Non-Hispanic White students suspended at any point during
the year 852
Total non-Hispanic White enrollment 37,800
Year DISPARITY RATES Rates2010-11 Dane County non-Hispanic Black students were 9.5 times more likely to be
suspended than non-Hispanic White students. 9.5/1
Wisconsin non-Hispanic Black students were 9.6 times more likely to be suspended than non-Hispanic White students.
9.6/1
Year DISPROPORTIONALITY RATIOS Ratio2010-11 Dane County Black non-Hispanic students made up 11.3% of the enrollment but
48.9% of the students suspended. 4.3
Wisconsin Black non-Hispanic students made up 9.9% of the enrollment but 47.2% of the students suspended.
4.8
Source: Wisconsin Information Network for Successful Schools (WINSS), from the Wisconsin Department of Public Instruction.
Definitions: Some districts do not have race information on suspended students in the WINSS system. The share of student enrollment uses only those districts with suspension figures for that race. The total enrollment figure shows the sum of districts with black suspension figures for that year. The districts without race information on suspended students were different in 2007-08 than in 2010-11. This indicator shows the percent of students who were suspended during a school year. If a student is suspended more than one time, that student is only counted once. Suspensions are defined as “absences from school imposed by the school administration for disciplinary reasons." A new system for tracking disciplinary measures was implemented in 2006-07, thus 2007-08 was chosen as the base year. Race categories changed in 2010-2011, with the addition of a category for students of two or more races. This change makes comparisons with previous years somewhat limited.
Frequency of reporting: Annual.
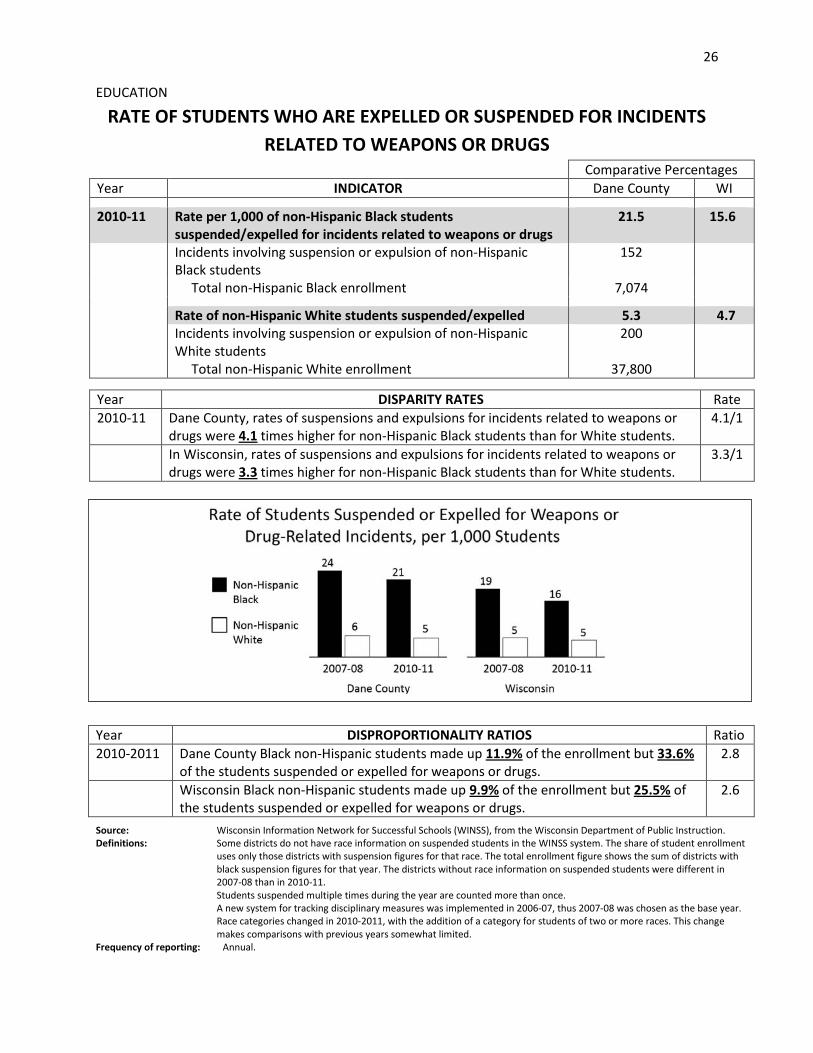
26
EDUCATION
RATE OF STUDENTS WHO ARE EXPELLED OR SUSPENDED FOR INCIDENTS RELATED TO WEAPONS OR DRUGS
Comparative PercentagesYear INDICATOR Dane County WI
2010-11 Rate per 1,000 of non-Hispanic Black students suspended/expelled for incidents related to weapons or drugs
21.5 15.6
Incidents involving suspension or expulsion of non-Hispanic Black students
152
Total non-Hispanic Black enrollment 7,074
Rate of non-Hispanic White students suspended/expelled 5.3 4.7 Incidents involving suspension or expulsion of non-Hispanic
White students 200
Total non-Hispanic White enrollment 37,800
Year DISPARITY RATES Rate2010-11 Dane County, rates of suspensions and expulsions for incidents related to weapons or
drugs were 4.1 times higher for non-Hispanic Black students than for White students. 4.1/1
In Wisconsin, rates of suspensions and expulsions for incidents related to weapons or drugs were 3.3 times higher for non-Hispanic Black students than for White students.
3.3/1
Year DISPROPORTIONALITY RATIOS Ratio2010-2011 Dane County Black non-Hispanic students made up 11.9% of the enrollment but 33.6%
of the students suspended or expelled for weapons or drugs. 2.8
Wisconsin Black non-Hispanic students made up 9.9% of the enrollment but 25.5% of the students suspended or expelled for weapons or drugs.
2.6
Source: Wisconsin Information Network for Successful Schools (WINSS), from the Wisconsin Department of Public Instruction. Definitions: Some districts do not have race information on suspended students in the WINSS system. The share of student enrollment
uses only those districts with suspension figures for that race. The total enrollment figure shows the sum of districts with black suspension figures for that year. The districts without race information on suspended students were different in 2007-08 than in 2010-11. Students suspended multiple times during the year are counted more than once. A new system for tracking disciplinary measures was implemented in 2006-07, thus 2007-08 was chosen as the base year. Race categories changed in 2010-2011, with the addition of a category for students of two or more races. This change makes comparisons with previous years somewhat limited.
Frequency of reporting: Annual.
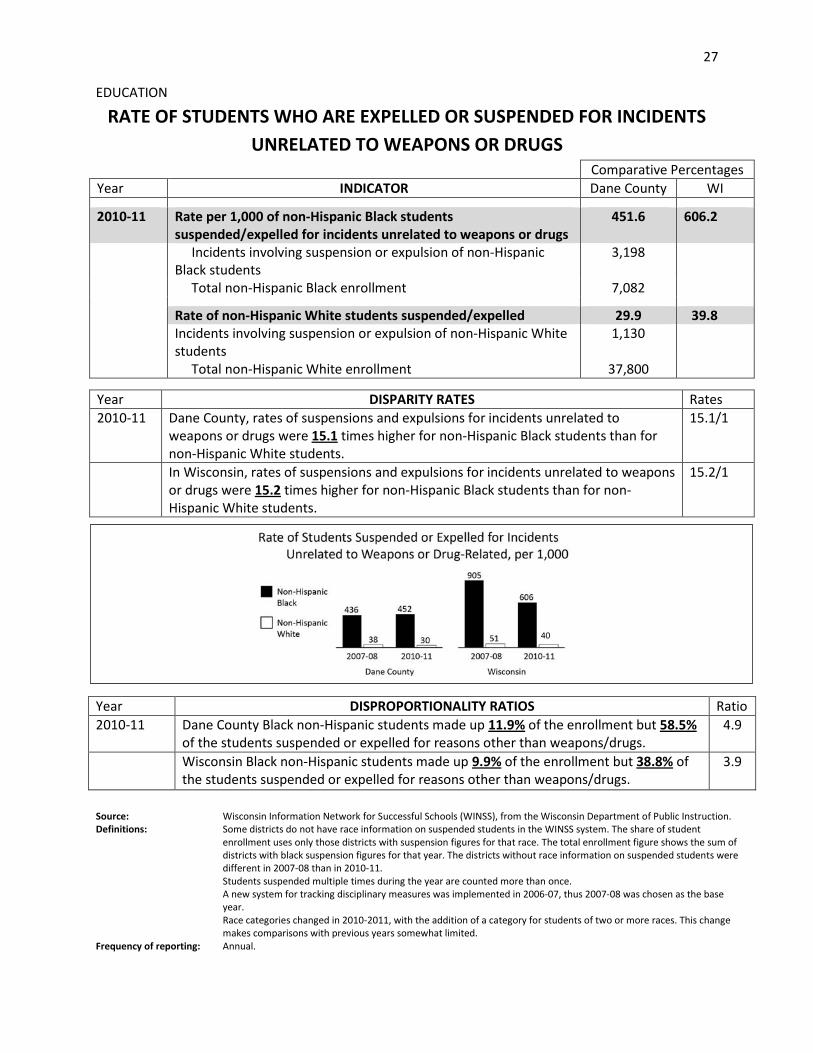
27
EDUCATION
RATE OF STUDENTS WHO ARE EXPELLED OR SUSPENDED FOR INCIDENTS UNRELATED TO WEAPONS OR DRUGS
Comparative PercentagesYear INDICATOR Dane County WI
2010-11 Rate per 1,000 of non-Hispanic Black students suspended/expelled for incidents unrelated to weapons or drugs
451.6 606.2
Incidents involving suspension or expulsion of non-Hispanic Black students
3,198
Total non-Hispanic Black enrollment 7,082
Rate of non-Hispanic White students suspended/expelled 29.9 39.8 Incidents involving suspension or expulsion of non-Hispanic White
students 1,130
Total non-Hispanic White enrollment 37,800
Year DISPARITY RATES Rates2010-11 Dane County, rates of suspensions and expulsions for incidents unrelated to
weapons or drugs were 15.1 times higher for non-Hispanic Black students than for non-Hispanic White students.
15.1/1
In Wisconsin, rates of suspensions and expulsions for incidents unrelated to weapons or drugs were 15.2 times higher for non-Hispanic Black students than for non-Hispanic White students.
15.2/1
Year DISPROPORTIONALITY RATIOS Ratio2010-11 Dane County Black non-Hispanic students made up 11.9% of the enrollment but 58.5%
of the students suspended or expelled for reasons other than weapons/drugs. 4.9
Wisconsin Black non-Hispanic students made up 9.9% of the enrollment but 38.8% of the students suspended or expelled for reasons other than weapons/drugs.
3.9
Source: Wisconsin Information Network for Successful Schools (WINSS), from the Wisconsin Department of Public Instruction. Definitions: Some districts do not have race information on suspended students in the WINSS system. The share of student
enrollment uses only those districts with suspension figures for that race. The total enrollment figure shows the sum of districts with black suspension figures for that year. The districts without race information on suspended students were different in 2007-08 than in 2010-11. Students suspended multiple times during the year are counted more than once. A new system for tracking disciplinary measures was implemented in 2006-07, thus 2007-08 was chosen as the base year. Race categories changed in 2010-2011, with the addition of a category for students of two or more races. This change makes comparisons with previous years somewhat limited.
Frequency of reporting: Annual.
40
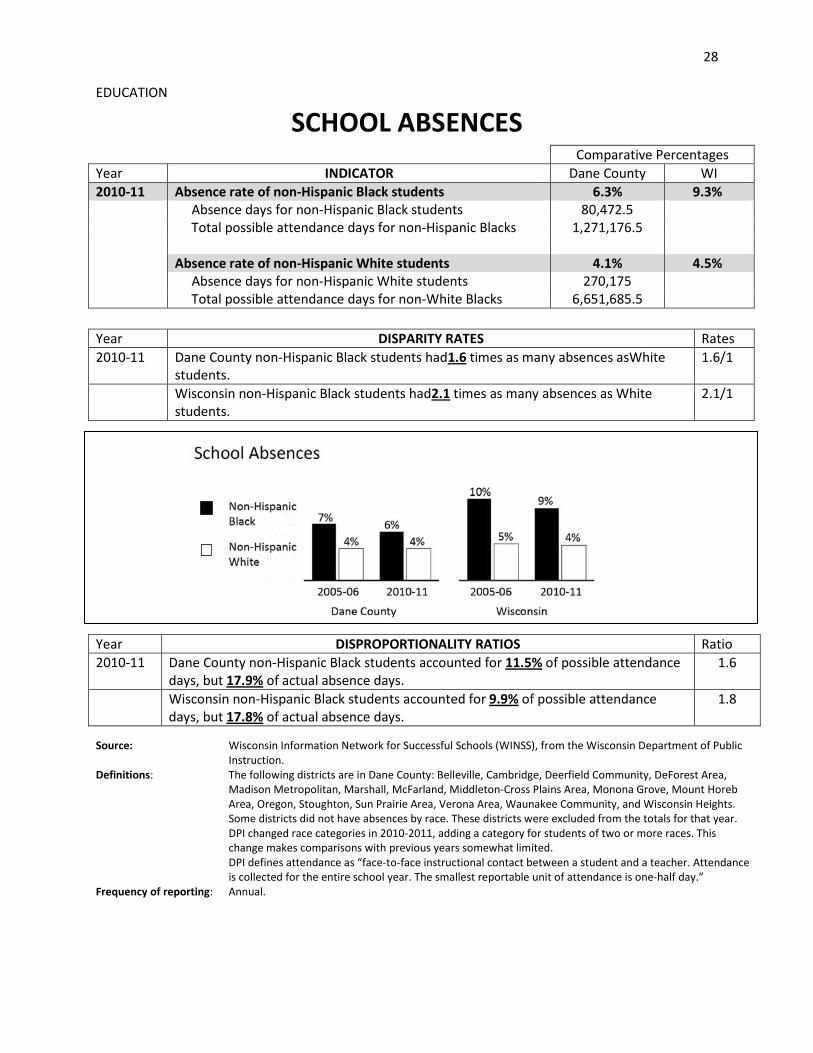
28
EDUCATION
SCHOOL ABSENCES Comparative PercentagesYear INDICATOR Dane County WI2010-11 Absence rate of non-Hispanic Black students 6.3% 9.3% Absence days for non-Hispanic Black students 80,472.5 Total possible attendance days for non-Hispanic Blacks 1,271,176.5 Absence rate of non-Hispanic White students 4.1% 4.5% Absence days for non-Hispanic White students 270,175 Total possible attendance days for non-White Blacks 6,651,685.5 Year DISPARITY RATES Rates2010-11 Dane County non-Hispanic Black students had1.6 times as many absences asWhite
students. 1.6/1
Wisconsin non-Hispanic Black students had2.1 times as many absences as White students.
2.1/1
Source: Wisconsin Information Network for Successful Schools (WINSS), from the Wisconsin Department of Public Instruction.
Definitions: The following districts are in Dane County: Belleville, Cambridge, Deerfield Community, DeForest Area, Madison Metropolitan, Marshall, McFarland, Middleton-Cross Plains Area, Monona Grove, Mount Horeb Area, Oregon, Stoughton, Sun Prairie Area, Verona Area, Waunakee Community, and Wisconsin Heights. Some districts did not have absences by race. These districts were excluded from the totals for that year. DPI changed race categories in 2010-2011, adding a category for students of two or more races. This change makes comparisons with previous years somewhat limited. DPI defines attendance as “face-to-face instructional contact between a student and a teacher. Attendance is collected for the entire school year. The smallest reportable unit of attendance is one-half day.”
Frequency of reporting: Annual.
Year DISPROPORTIONALITY RATIOS Ratio2010-11 Dane County non-Hispanic Black students accounted for 11.5% of possible attendance
days, but 17.9% of actual absence days. 1.6
Wisconsin non-Hispanic Black students accounted for 9.9% of possible attendance days, but 17.8% of actual absence days.
1.8
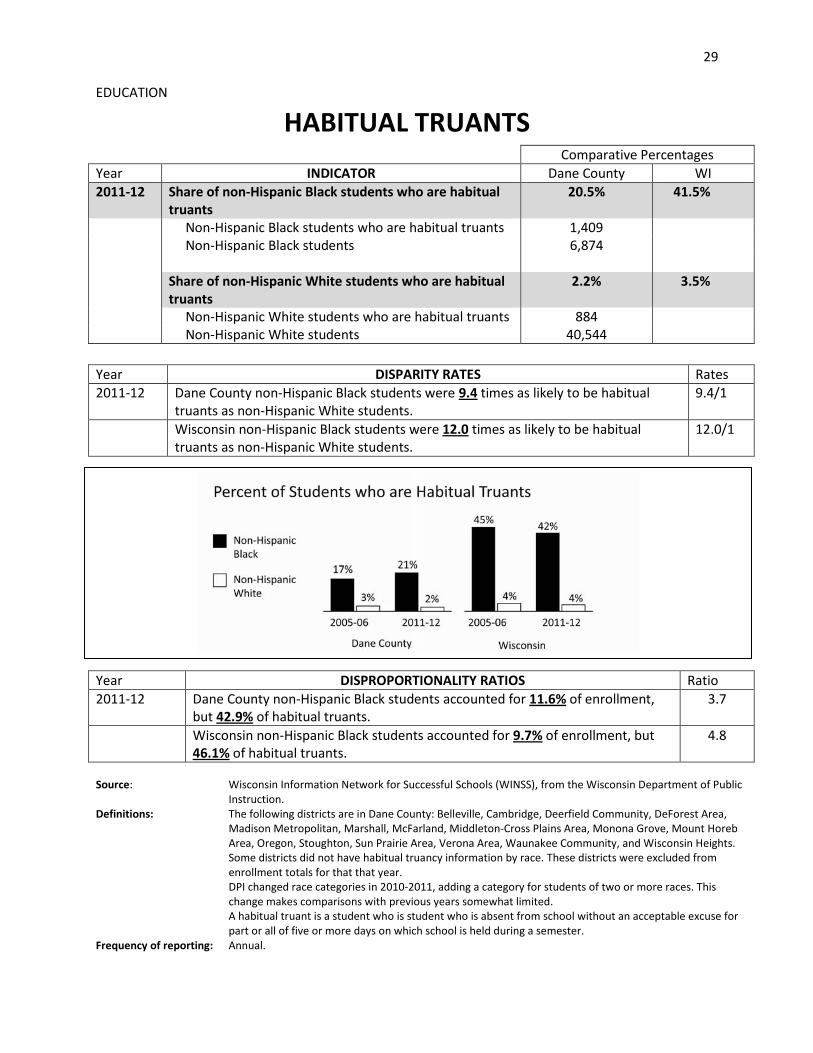
29
EDUCATION
HABITUAL TRUANTS Comparative PercentagesYear INDICATOR Dane County WI2011-12 Share of non-Hispanic Black students who are habitual
truants 20.5% 41.5%
Non-Hispanic Black students who are habitual truants 1,409 Non-Hispanic Black students 6,874 Share of non-Hispanic White students who are habitual
truants 2.2% 3.5%
Non-Hispanic White students who are habitual truants 884 Non-Hispanic White students 40,544 Year DISPARITY RATES Rates2011-12 Dane County non-Hispanic Black students were 9.4 times as likely to be habitual
truants as non-Hispanic White students. 9.4/1
Wisconsin non-Hispanic Black students were 12.0 times as likely to be habitual truants as non-Hispanic White students.
12.0/1
Year DISPROPORTIONALITY RATIOS Ratio2011-12 Dane County non-Hispanic Black students accounted for 11.6% of enrollment,
but 42.9% of habitual truants. 3.7
Wisconsin non-Hispanic Black students accounted for 9.7% of enrollment, but 46.1% of habitual truants.
4.8
Source: Wisconsin Information Network for Successful Schools (WINSS), from the Wisconsin Department of Public Instruction.
Definitions: The following districts are in Dane County: Belleville, Cambridge, Deerfield Community, DeForest Area, Madison Metropolitan, Marshall, McFarland, Middleton-Cross Plains Area, Monona Grove, Mount Horeb Area, Oregon, Stoughton, Sun Prairie Area, Verona Area, Waunakee Community, and Wisconsin Heights. Some districts did not have habitual truancy information by race. These districts were excluded from enrollment totals for that that year. DPI changed race categories in 2010-2011, adding a category for students of two or more races. This change makes comparisons with previous years somewhat limited. A habitual truant is a student who is student who is absent from school without an acceptable excuse for part or all of five or more days on which school is held during a semester.
Frequency of reporting: Annual.
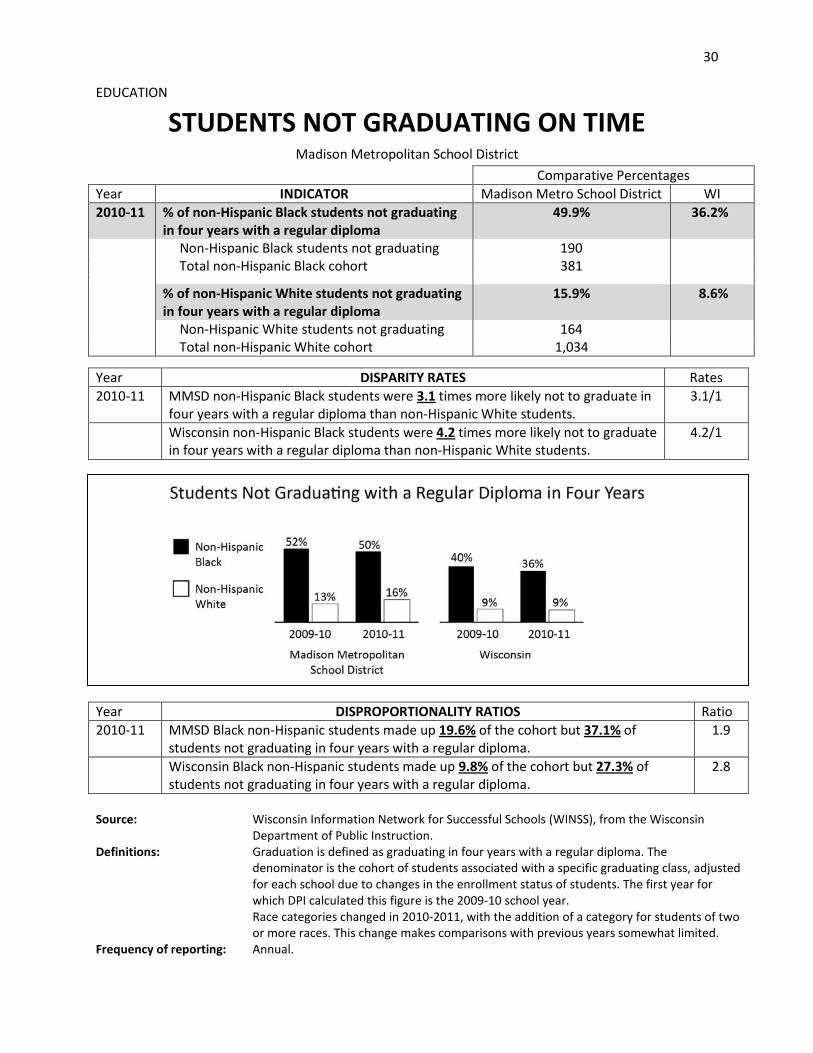
30
EDUCATION
STUDENTS NOT GRADUATING ON TIME Madison Metropolitan School District
Comparative PercentagesYear INDICATOR Madison Metro School District WI2010-11 % of non-Hispanic Black students not graduating
in four years with a regular diploma 49.9% 36.2%
Non-Hispanic Black students not graduating 190 Total non-Hispanic Black cohort 381
% of non-Hispanic White students not graduating in four years with a regular diploma
15.9% 8.6%
Non-Hispanic White students not graduating 164 Total non-Hispanic White cohort 1,034
Year DISPARITY RATES Rates2010-11 MMSD non-Hispanic Black students were 3.1 times more likely not to graduate in
four years with a regular diploma than non-Hispanic White students. 3.1/1
Wisconsin non-Hispanic Black students were 4.2 times more likely not to graduate in four years with a regular diploma than non-Hispanic White students.
4.2/1
Year DISPROPORTIONALITY RATIOS Ratio2010-11 MMSD Black non-Hispanic students made up 19.6% of the cohort but 37.1% of
students not graduating in four years with a regular diploma. 1.9
Wisconsin Black non-Hispanic students made up 9.8% of the cohort but 27.3% of students not graduating in four years with a regular diploma.
2.8
Source: Wisconsin Information Network for Successful Schools (WINSS), from the Wisconsin Department of Public Instruction.
Definitions: Graduation is defined as graduating in four years with a regular diploma. The denominator is the cohort of students associated with a specific graduating class, adjusted for each school due to changes in the enrollment status of students. The first year for which DPI calculated this figure is the 2009-10 school year. Race categories changed in 2010-2011, with the addition of a category for students of two or more races. This change makes comparisons with previous years somewhat limited.
Frequency of reporting: Annual.
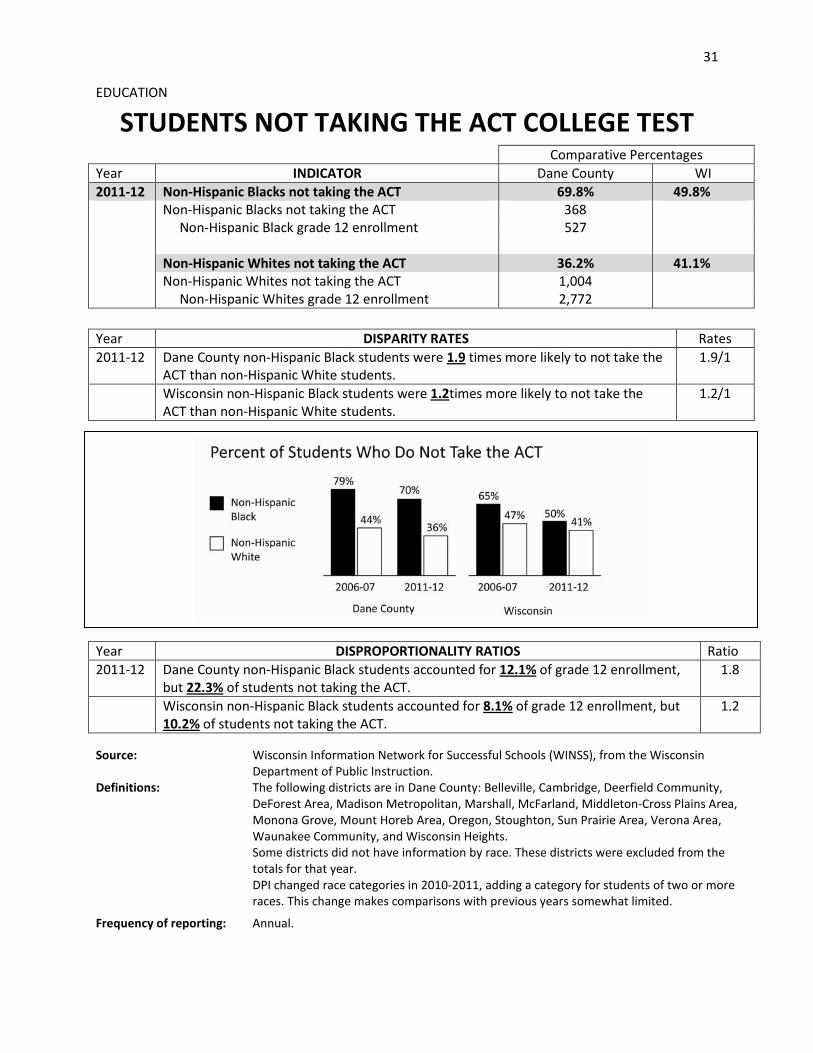
31
EDUCATION
STUDENTS NOT TAKING THE ACT COLLEGE TEST Comparative PercentagesYear INDICATOR Dane County WI2011-12 Non-Hispanic Blacks not taking the ACT 69.8% 49.8% Non-Hispanic Blacks not taking the ACT 368 Non-Hispanic Black grade 12 enrollment 527 Non-Hispanic Whites not taking the ACT 36.2% 41.1% Non-Hispanic Whites not taking the ACT 1,004 Non-Hispanic Whites grade 12 enrollment 2,772 Year DISPARITY RATES Rates2011-12 Dane County non-Hispanic Black students were 1.9 times more likely to not take the
ACT than non-Hispanic White students. 1.9/1
Wisconsin non-Hispanic Black students were 1.2times more likely to not take the ACT than non-Hispanic White students.
1.2/1
Year DISPROPORTIONALITY RATIOS Ratio2011-12 Dane County non-Hispanic Black students accounted for 12.1% of grade 12 enrollment,
but 22.3% of students not taking the ACT. 1.8
Wisconsin non-Hispanic Black students accounted for 8.1% of grade 12 enrollment, but 10.2% of students not taking the ACT.
1.2
Source: Wisconsin Information Network for Successful Schools (WINSS), from the Wisconsin Department of Public Instruction.
Definitions: The following districts are in Dane County: Belleville, Cambridge, Deerfield Community, DeForest Area, Madison Metropolitan, Marshall, McFarland, Middleton-Cross Plains Area, Monona Grove, Mount Horeb Area, Oregon, Stoughton, Sun Prairie Area, Verona Area, Waunakee Community, and Wisconsin Heights. Some districts did not have information by race. These districts were excluded from the totals for that year. DPI changed race categories in 2010-2011, adding a category for students of two or more races. This change makes comparisons with previous years somewhat limited.
Frequency of reporting: Annual.
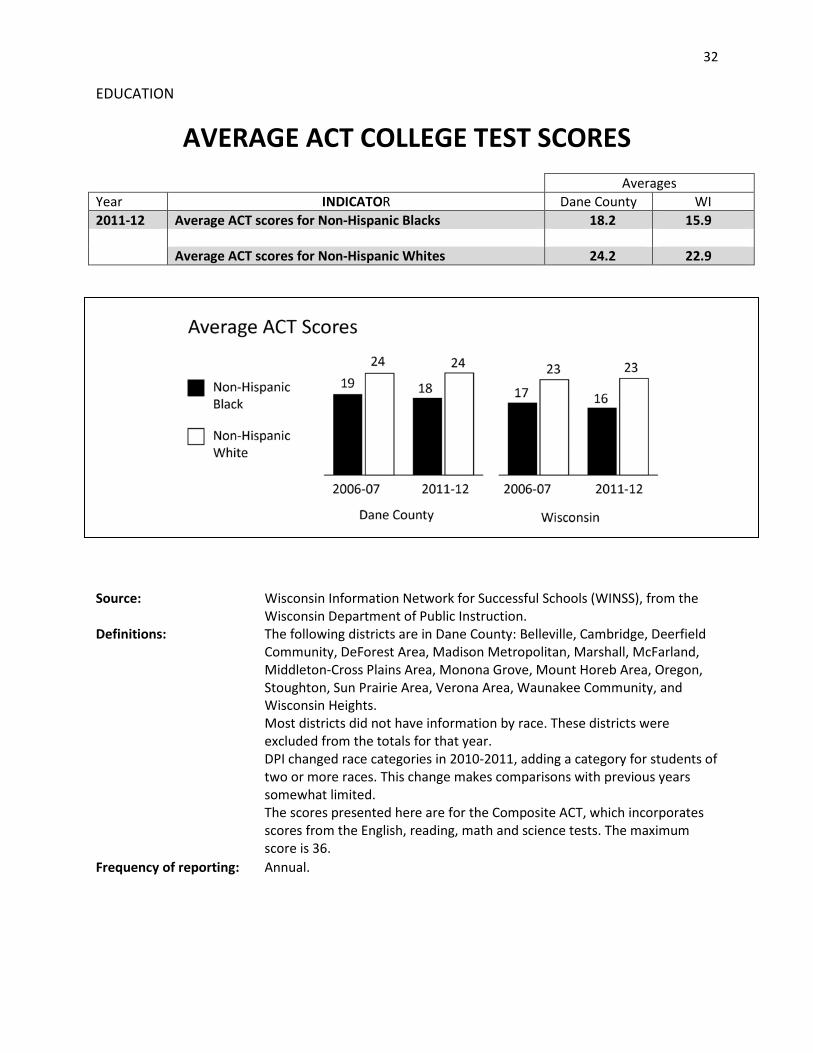
32
EDUCATION
AVERAGE ACT COLLEGE TEST SCORES
AveragesYear INDICATOR Dane County WI2011-12 Average ACT scores for Non-Hispanic Blacks 18.2 15.9 Average ACT scores for Non-Hispanic Whites 24.2 22.9
Source: Wisconsin Information Network for Successful Schools (WINSS), from the Wisconsin Department of Public Instruction.
Definitions: The following districts are in Dane County: Belleville, Cambridge, Deerfield Community, DeForest Area, Madison Metropolitan, Marshall, McFarland, Middleton-Cross Plains Area, Monona Grove, Mount Horeb Area, Oregon, Stoughton, Sun Prairie Area, Verona Area, Waunakee Community, and Wisconsin Heights. Most districts did not have information by race. These districts were excluded from the totals for that year. DPI changed race categories in 2010-2011, adding a category for students of two or more races. This change makes comparisons with previous years somewhat limited. The scores presented here are for the Composite ACT, which incorporates scores from the English, reading, math and science tests. The maximum score is 36.
Frequency of reporting: Annual.
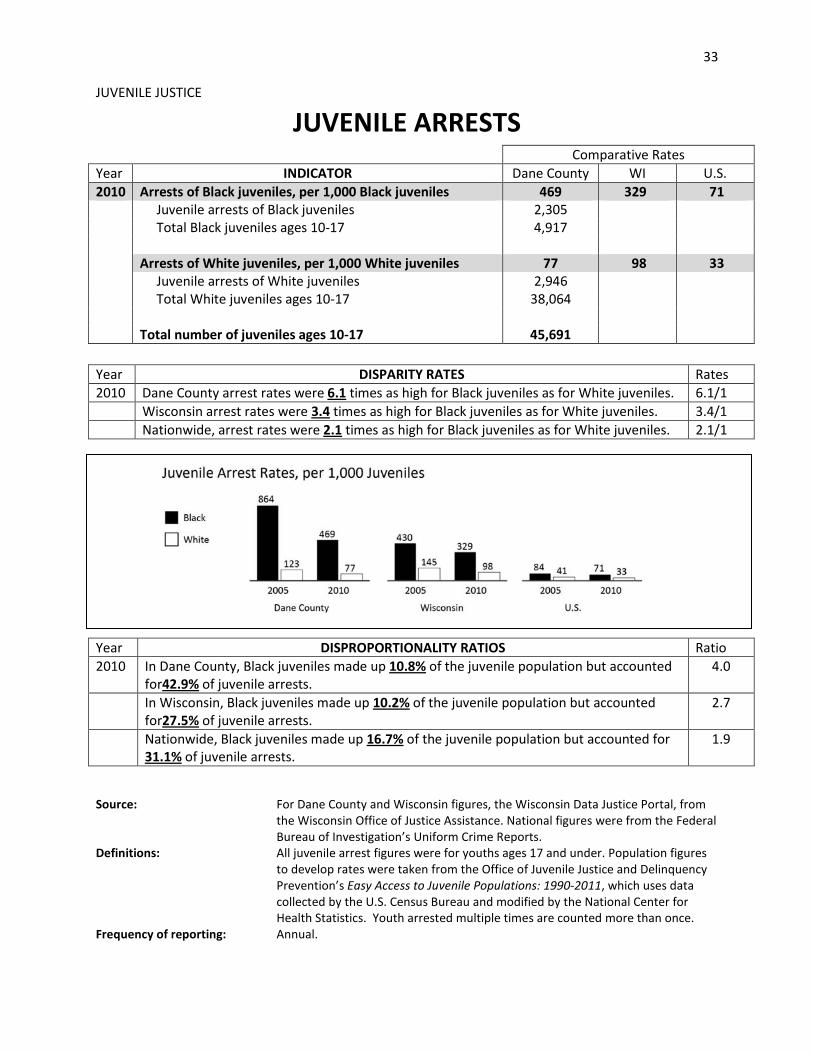
33
JUVENILE JUSTICE
JUVENILE ARRESTS Comparative RatesYear INDICATOR Dane County WI U.S.2010 Arrests of Black juveniles, per 1,000 Black juveniles 469 329 71 Juvenile arrests of Black juveniles 2,305 Total Black juveniles ages 10-17 4,917 Arrests of White juveniles, per 1,000 White juveniles 77 98 33 Juvenile arrests of White juveniles 2,946 Total White juveniles ages 10-17 38,064 Total number of juveniles ages 10-17 45,691 Year DISPARITY RATES Rates2010 Dane County arrest rates were 6.1 times as high for Black juveniles as for White juveniles. 6.1/1 Wisconsin arrest rates were 3.4 times as high for Black juveniles as for White juveniles. 3.4/1 Nationwide, arrest rates were 2.1 times as high for Black juveniles as for White juveniles. 2.1/1
Year DISPROPORTIONALITY RATIOS Ratio2010 In Dane County, Black juveniles made up 10.8% of the juvenile population but accounted
for42.9% of juvenile arrests. 4.0
In Wisconsin, Black juveniles made up 10.2% of the juvenile population but accounted for27.5% of juvenile arrests.
2.7
Nationwide, Black juveniles made up 16.7% of the juvenile population but accounted for 31.1% of juvenile arrests.
1.9
Source: For Dane County and Wisconsin figures, the Wisconsin Data Justice Portal, from the Wisconsin Office of Justice Assistance. National figures were from the Federal Bureau of Investigation’s Uniform Crime Reports.
Definitions: All juvenile arrest figures were for youths ages 17 and under. Population figures to develop rates were taken from the Office of Juvenile Justice and Delinquency Prevention’s Easy Access to Juvenile Populations: 1990-2011, which uses data collected by the U.S. Census Bureau and modified by the National Center for Health Statistics. Youth arrested multiple times are counted more than once.
Frequency of reporting: Annual.
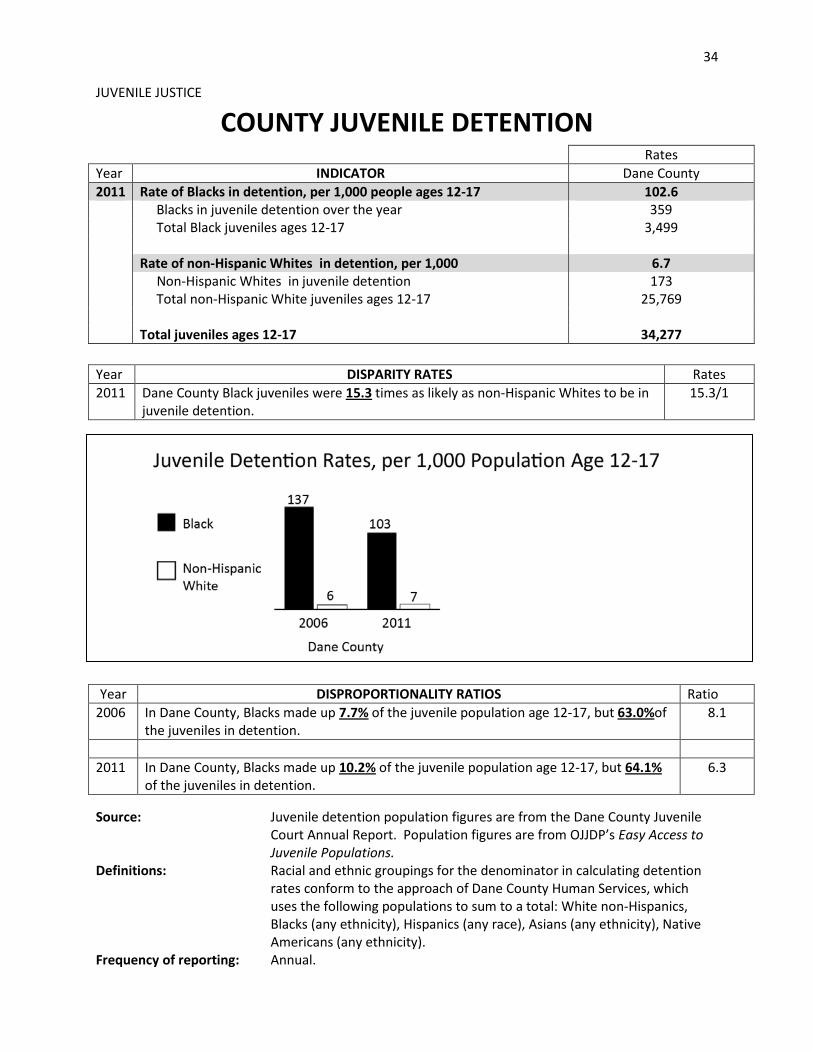
34
JUVENILE JUSTICE
COUNTY JUVENILE DETENTION RatesYear INDICATOR Dane County2011 Rate of Blacks in detention, per 1,000 people ages 12-17 102.6 Blacks in juvenile detention over the year 359 Total Black juveniles ages 12-17 3,499 Rate of non-Hispanic Whites in detention, per 1,000 6.7 Non-Hispanic Whites in juvenile detention 173 Total non-Hispanic White juveniles ages 12-17 25,769 Total juveniles ages 12-17 34,277 Year DISPARITY RATES Rates2011 Dane County Black juveniles were 15.3 times as likely as non-Hispanic Whites to be in
juvenile detention. 15.3/1
Year DISPROPORTIONALITY RATIOS Ratio2006 In Dane County, Blacks made up 7.7% of the juvenile population age 12-17, but 63.0%of
the juveniles in detention. 8.1
2011 In Dane County, Blacks made up 10.2% of the juvenile population age 12-17, but 64.1%
of the juveniles in detention. 6.3
Source: Juvenile detention population figures are from the Dane County Juvenile Court Annual Report. Population figures are from OJJDP’s Easy Access to Juvenile Populations.
Definitions: Racial and ethnic groupings for the denominator in calculating detention rates conform to the approach of Dane County Human Services, which uses the following populations to sum to a total: White non-Hispanics, Blacks (any ethnicity), Hispanics (any race), Asians (any ethnicity), Native Americans (any ethnicity).
Frequency of reporting: Annual.
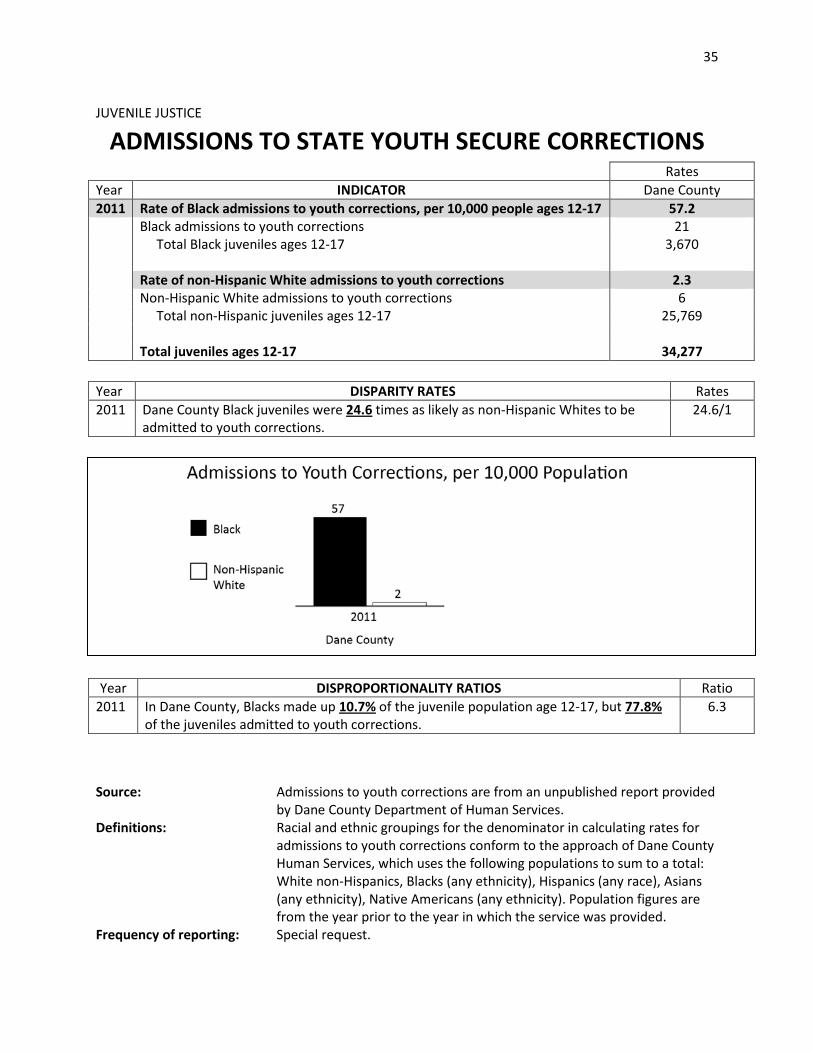
35
JUVENILE JUSTICE
ADMISSIONS TO STATE YOUTH SECURE CORRECTIONS RatesYear INDICATOR Dane County2011 Rate of Black admissions to youth corrections, per 10,000 people ages 12-17 57.2 Black admissions to youth corrections 21 Total Black juveniles ages 12-17 3,670 Rate of non-Hispanic White admissions to youth corrections 2.3 Non-Hispanic White admissions to youth corrections 6 Total non-Hispanic juveniles ages 12-17 25,769 Total juveniles ages 12-17 34,277 Year DISPARITY RATES Rates2011 Dane County Black juveniles were 24.6 times as likely as non-Hispanic Whites to be
admitted to youth corrections. 24.6/1
Year DISPROPORTIONALITY RATIOS Ratio
2011 In Dane County, Blacks made up 10.7% of the juvenile population age 12-17, but 77.8% of the juveniles admitted to youth corrections.
6.3
Source: Admissions to youth corrections are from an unpublished report provided by Dane County Department of Human Services.
Definitions: Racial and ethnic groupings for the denominator in calculating rates for admissions to youth corrections conform to the approach of Dane County Human Services, which uses the following populations to sum to a total: White non-Hispanics, Blacks (any ethnicity), Hispanics (any race), Asians (any ethnicity), Native Americans (any ethnicity). Population figures are from the year prior to the year in which the service was provided.
Frequency of reporting: Special request.
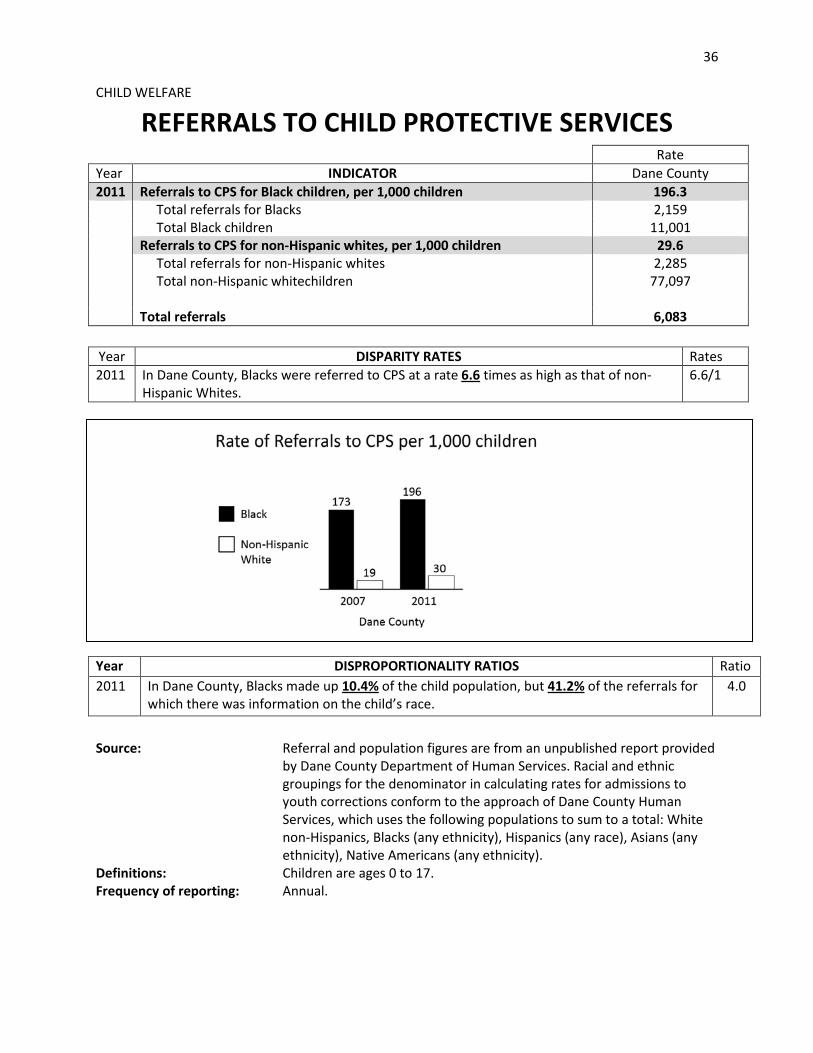
36
CHILD WELFARE
REFERRALS TO CHILD PROTECTIVE SERVICES RateYear INDICATOR Dane County2011 Referrals to CPS for Black children, per 1,000 children 196.3 Total referrals for Blacks 2,159 Total Black children 11,001 Referrals to CPS for non-Hispanic whites, per 1,000 children 29.6 Total referrals for non-Hispanic whites 2,285 Total non-Hispanic whitechildren 77,097 Total referrals 6,083 Year DISPARITY RATES Rates2011 In Dane County, Blacks were referred to CPS at a rate 6.6 times as high as that of non-
Hispanic Whites. 6.6/1
Year DISPROPORTIONALITY RATIOS Ratio2011 In Dane County, Blacks made up 10.4% of the child population, but 41.2% of the referrals for
which there was information on the child’s race. 4.0
Source: Referral and population figures are from an unpublished report provided by Dane County Department of Human Services. Racial and ethnic groupings for the denominator in calculating rates for admissions to youth corrections conform to the approach of Dane County Human Services, which uses the following populations to sum to a total: White non-Hispanics, Blacks (any ethnicity), Hispanics (any race), Asians (any ethnicity), Native Americans (any ethnicity).
Definitions: Children are ages 0 to 17.Frequency of reporting: Annual.
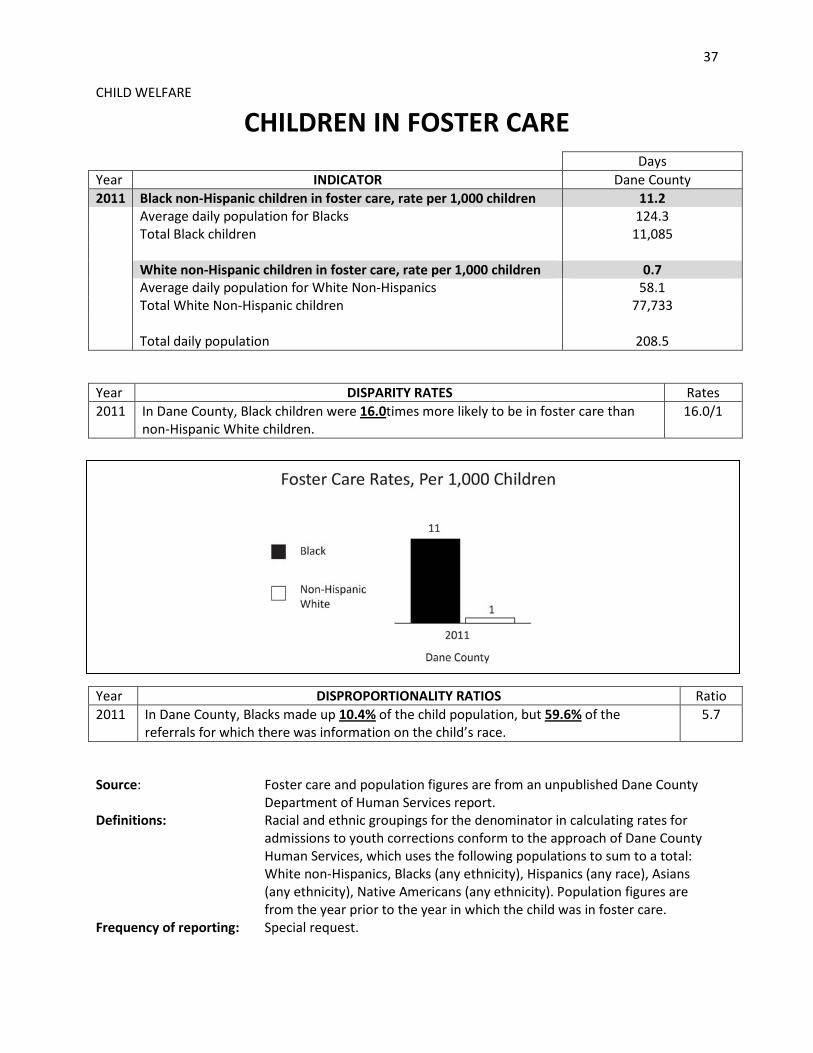
37
CHILD WELFARE
CHILDREN IN FOSTER CARE
Source: Foster care and population figures are from an unpublished Dane County Department of Human Services report.
Definitions: Racial and ethnic groupings for the denominator in calculating rates for admissions to youth corrections conform to the approach of Dane County Human Services, which uses the following populations to sum to a total: White non-Hispanics, Blacks (any ethnicity), Hispanics (any race), Asians (any ethnicity), Native Americans (any ethnicity). Population figures are from the year prior to the year in which the child was in foster care.
Frequency of reporting: Special request.
Days Year INDICATOR Dane County2011 Black non-Hispanic children in foster care, rate per 1,000 children 11.2 Average daily population for Blacks 124.3 Total Black children 11,085 White non-Hispanic children in foster care, rate per 1,000 children 0.7 Average daily population for White Non-Hispanics 58.1 Total White Non-Hispanic children 77,733 Total daily population 208.5
Year DISPARITY RATES Rates2011 In Dane County, Black children were 16.0times more likely to be in foster care than
non-Hispanic White children. 16.0/1
Year DISPROPORTIONALITY RATIOS Ratio2011 In Dane County, Blacks made up 10.4% of the child population, but 59.6% of the
referrals for which there was information on the child’s race. 5.7
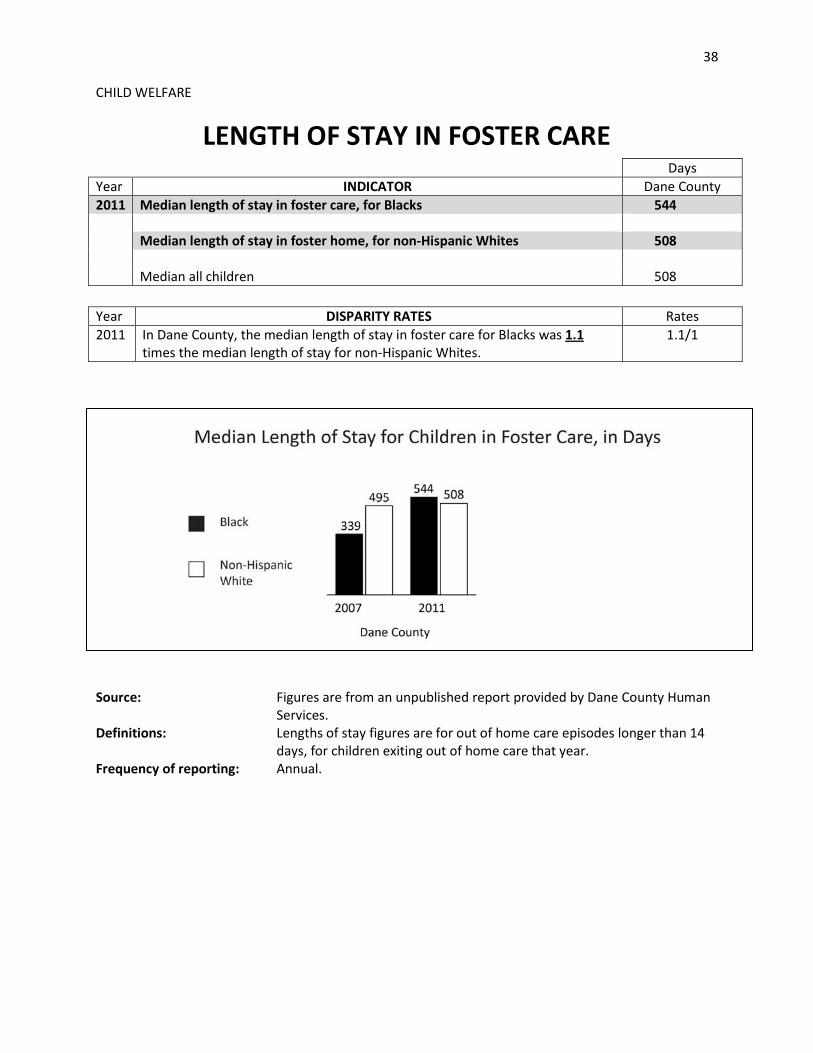
38
CHILD WELFARE
LENGTH OF STAY IN FOSTER CARE DaysYear INDICATOR Dane County2011 Median length of stay in foster care, for Blacks 544 Median length of stay in foster home, for non-Hispanic Whites 508 Median all children 508 Year DISPARITY RATES Rates2011 In Dane County, the median length of stay in foster care for Blacks was 1.1
times the median length of stay for non-Hispanic Whites. 1.1/1
Source: Figures are from an unpublished report provided by Dane County Human Services.
Definitions: Lengths of stay figures are for out of home care episodes longer than 14 days, for children exiting out of home care that year.
Frequency of reporting: Annual.
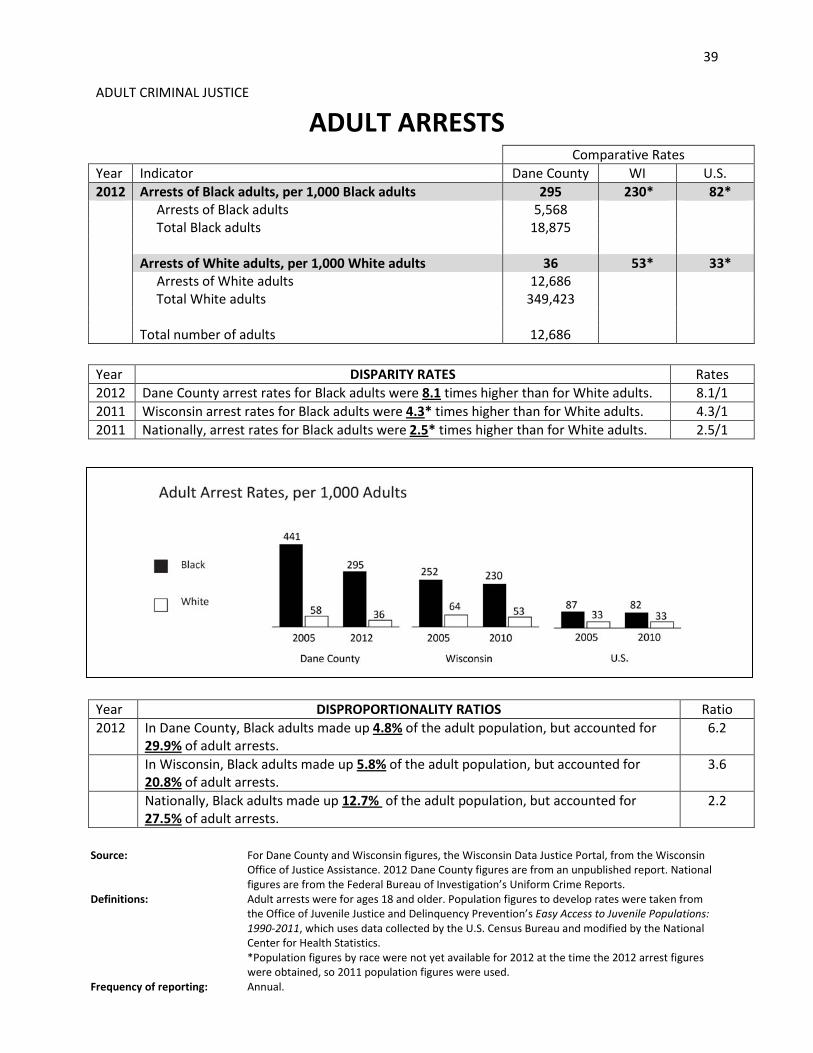
39
ADULT CRIMINAL JUSTICE
ADULT ARRESTS Comparative RatesYear Indicator Dane County WI U.S.2012 Arrests of Black adults, per 1,000 Black adults 295 230* 82* Arrests of Black adults 5,568 Total Black adults 18,875 Arrests of White adults, per 1,000 White adults 36 53* 33* Arrests of White adults 12,686 Total White adults 349,423 Total number of adults 12,686 Year DISPARITY RATES Rates2012 Dane County arrest rates for Black adults were 8.1 times higher than for White adults. 8.1/12011 Wisconsin arrest rates for Black adults were 4.3* times higher than for White adults. 4.3/12011 Nationally, arrest rates for Black adults were 2.5* times higher than for White adults. 2.5/1
Year DISPROPORTIONALITY RATIOS Ratio2012 In Dane County, Black adults made up 4.8% of the adult population, but accounted for
29.9% of adult arrests. 6.2
In Wisconsin, Black adults made up 5.8% of the adult population, but accounted for
20.8% of adult arrests. 3.6
Nationally, Black adults made up 12.7% of the adult population, but accounted for 27.5% of adult arrests.
2.2
Source: For Dane County and Wisconsin figures, the Wisconsin Data Justice Portal, from the Wisconsin Office of Justice Assistance. 2012 Dane County figures are from an unpublished report. National figures are from the Federal Bureau of Investigation’s Uniform Crime Reports.
Definitions: Adult arrests were for ages 18 and older. Population figures to develop rates were taken from the Office of Juvenile Justice and Delinquency Prevention’s Easy Access to Juvenile Populations: 1990-2011, which uses data collected by the U.S. Census Bureau and modified by the National Center for Health Statistics. *Population figures by race were not yet available for 2012 at the time the 2012 arrest figures were obtained, so 2011 population figures were used.
Frequency of reporting: Annual.
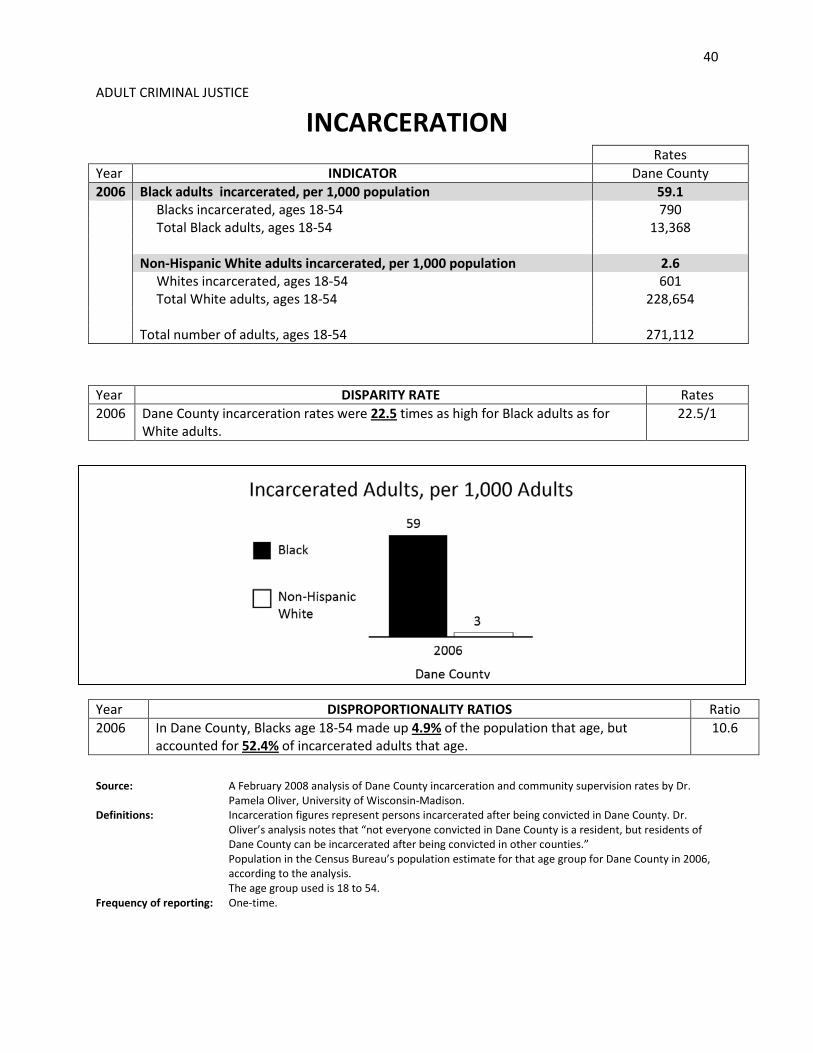
40
ADULT CRIMINAL JUSTICE
INCARCERATION RatesYear INDICATOR Dane County2006 Black adults incarcerated, per 1,000 population 59.1 Blacks incarcerated, ages 18-54 790 Total Black adults, ages 18-54 13,368 Non-Hispanic White adults incarcerated, per 1,000 population 2.6 Whites incarcerated, ages 18-54 601 Total White adults, ages 18-54 228,654 Total number of adults, ages 18-54 271,112 Year DISPARITY RATE Rates2006 Dane County incarceration rates were 22.5 times as high for Black adults as for
White adults. 22.5/1
Year DISPROPORTIONALITY RATIOS Ratio2006 In Dane County, Blacks age 18-54 made up 4.9% of the population that age, but
accounted for 52.4% of incarcerated adults that age. 10.6
Source: A February 2008 analysis of Dane County incarceration and community supervision rates by Dr. Pamela Oliver, University of Wisconsin-Madison.
Definitions: Incarceration figures represent persons incarcerated after being convicted in Dane County. Dr. Oliver’s analysis notes that “not everyone convicted in Dane County is a resident, but residents of Dane County can be incarcerated after being convicted in other counties.” Population in the Census Bureau’s population estimate for that age group for Dane County in 2006, according to the analysis. The age group used is 18 to 54.
Frequency of reporting: One-time.
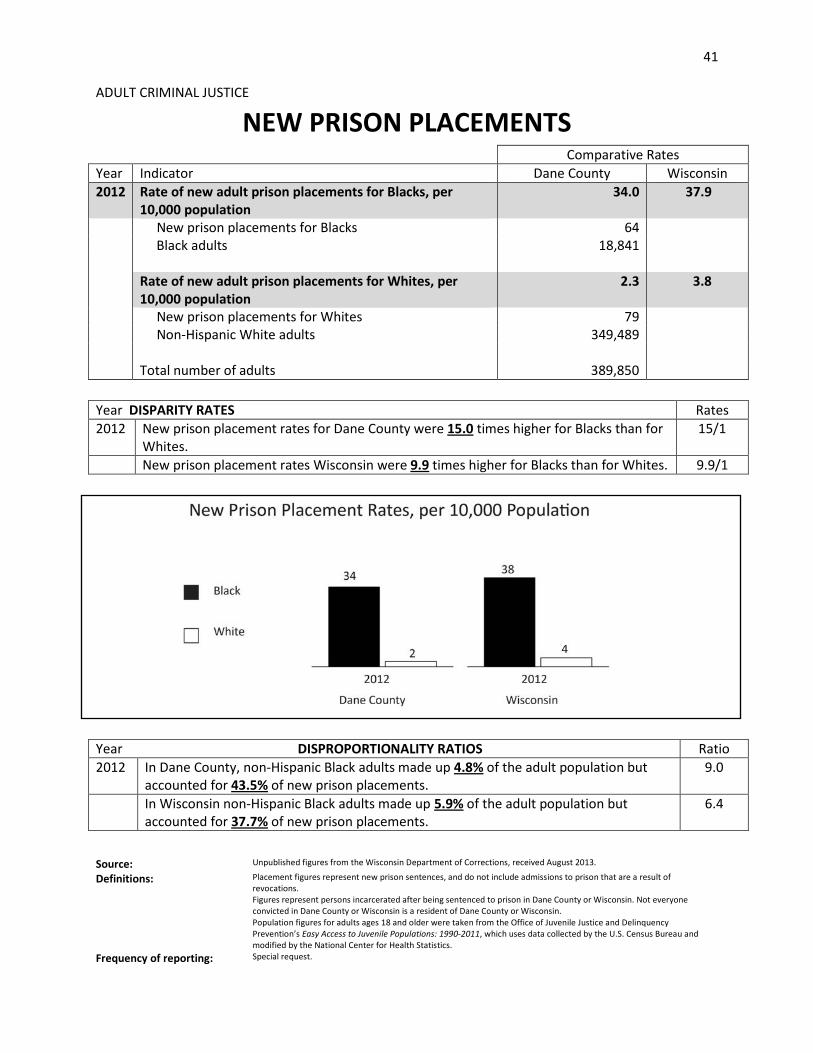
41
ADULT CRIMINAL JUSTICE
NEW PRISON PLACEMENTS Comparative RatesYear Indicator Dane County Wisconsin2012 Rate of new adult prison placements for Blacks, per
10,000 population 34.0 37.9
New prison placements for Blacks 64 Black adults 18,841 Rate of new adult prison placements for Whites, per
10,000 population 2.3 3.8
New prison placements for Whites 79 Non-Hispanic White adults 349,489 Total number of adults 389,850 Year DISPARITY RATES Rates2012 New prison placement rates for Dane County were 15.0 times higher for Blacks than for
Whites. 15/1
New prison placement rates Wisconsin were 9.9 times higher for Blacks than for Whites. 9.9/1
Year DISPROPORTIONALITY RATIOS Ratio2012 In Dane County, non-Hispanic Black adults made up 4.8% of the adult population but
accounted for 43.5% of new prison placements. 9.0
In Wisconsin non-Hispanic Black adults made up 5.9% of the adult population but accounted for 37.7% of new prison placements.
6.4
Source: Unpublished figures from the Wisconsin Department of Corrections, received August 2013.
Definitions: Placement figures represent new prison sentences, and do not include admissions to prison that are a result of revocations. Figures represent persons incarcerated after being sentenced to prison in Dane County or Wisconsin. Not everyone convicted in Dane County or Wisconsin is a resident of Dane County or Wisconsin. Population figures for adults ages 18 and older were taken from the Office of Juvenile Justice and Delinquency Prevention’s Easy Access to Juvenile Populations: 1990-2011, which uses data collected by the U.S. Census Bureau and modified by the National Center for Health Statistics.
Frequency of reporting: Special request.
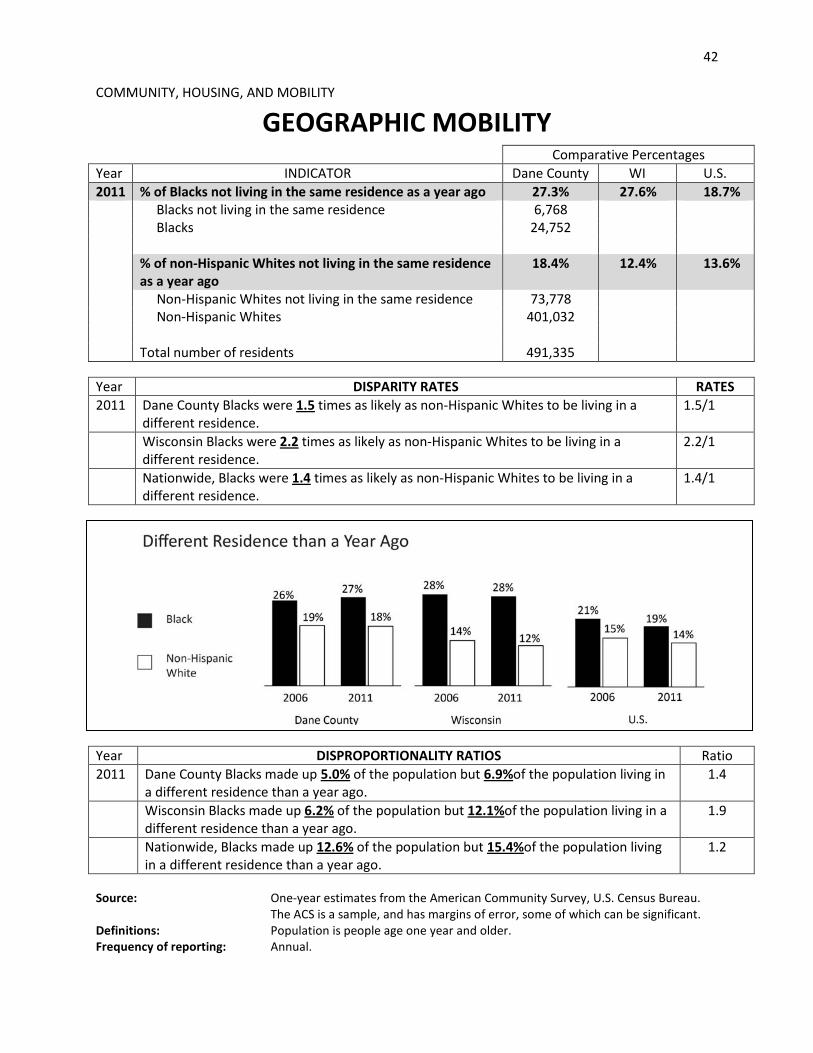
42
COMMUNITY, HOUSING, AND MOBILITY
GEOGRAPHIC MOBILITY Comparative PercentagesYear INDICATOR Dane County WI U.S.2011 % of Blacks not living in the same residence as a year ago 27.3% 27.6% 18.7% Blacks not living in the same residence 6,768 Blacks 24,752 % of non-Hispanic Whites not living in the same residence
as a year ago 18.4% 12.4% 13.6%
Non-Hispanic Whites not living in the same residence 73,778 Non-Hispanic Whites 401,032
Total number of residents 491,335
Year DISPARITY RATES RATES2011 Dane County Blacks were 1.5 times as likely as non-Hispanic Whites to be living in a
different residence. 1.5/1
Wisconsin Blacks were 2.2 times as likely as non-Hispanic Whites to be living in a different residence.
2.2/1
Nationwide, Blacks were 1.4 times as likely as non-Hispanic Whites to be living in a different residence.
1.4/1
Year DISPROPORTIONALITY RATIOS Ratio2011 Dane County Blacks made up 5.0% of the population but 6.9%of the population living in
a different residence than a year ago. 1.4
Wisconsin Blacks made up 6.2% of the population but 12.1%of the population living in a different residence than a year ago.
1.9
Nationwide, Blacks made up 12.6% of the population but 15.4%of the population living in a different residence than a year ago.
1.2
Source: One-year estimates from the American Community Survey, U.S. Census Bureau. The ACS is a sample, and has margins of error, some of which can be significant.
Definitions: Population is people age one year and older. Frequency of reporting: Annual.
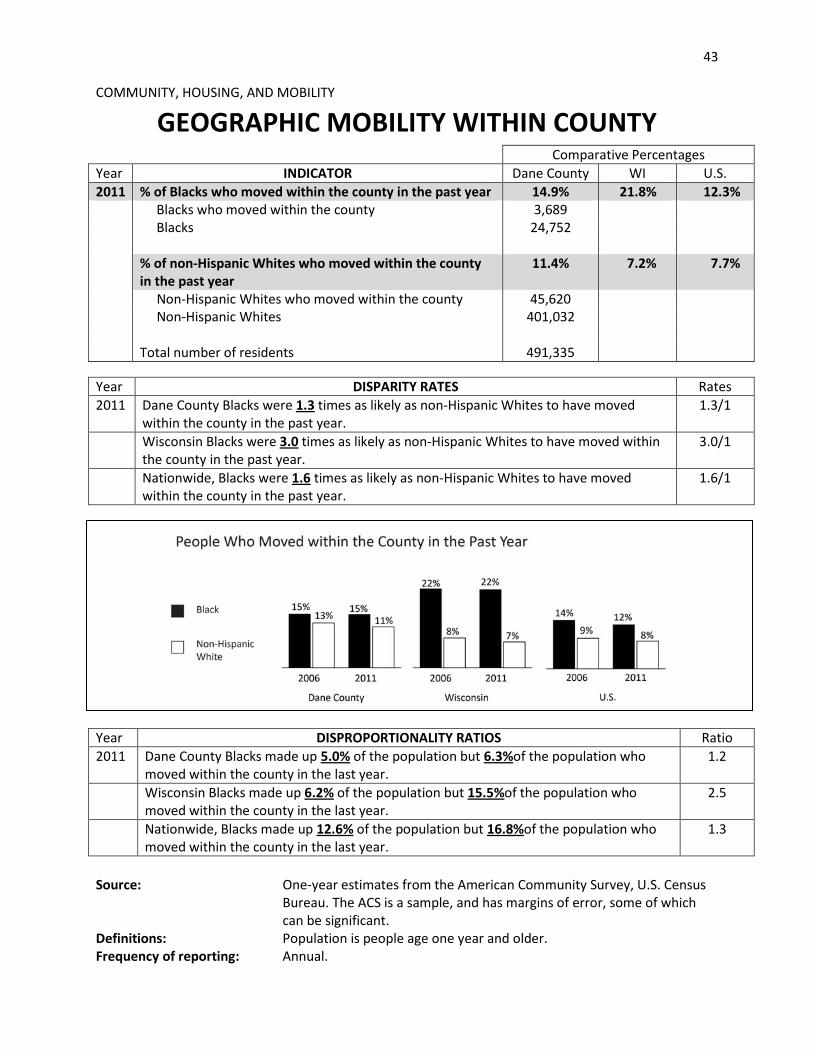
43
COMMUNITY, HOUSING, AND MOBILITY
GEOGRAPHIC MOBILITY WITHIN COUNTY Comparative PercentagesYear INDICATOR Dane County WI U.S.2011 % of Blacks who moved within the county in the past year 14.9% 21.8% 12.3% Blacks who moved within the county 3,689 Blacks 24,752 % of non-Hispanic Whites who moved within the county
in the past year 11.4% 7.2% 7.7%
Non-Hispanic Whites who moved within the county 45,620 Non-Hispanic Whites 401,032 Total number of residents 491,335
Year DISPARITY RATES Rates2011 Dane County Blacks were 1.3 times as likely as non-Hispanic Whites to have moved
within the county in the past year. 1.3/1
Wisconsin Blacks were 3.0 times as likely as non-Hispanic Whites to have moved within the county in the past year.
3.0/1
Nationwide, Blacks were 1.6 times as likely as non-Hispanic Whites to have moved within the county in the past year.
1.6/1
Year DISPROPORTIONALITY RATIOS Ratio2011 Dane County Blacks made up 5.0% of the population but 6.3%of the population who
moved within the county in the last year. 1.2
Wisconsin Blacks made up 6.2% of the population but 15.5%of the population who moved within the county in the last year.
2.5
Nationwide, Blacks made up 12.6% of the population but 16.8%of the population who moved within the county in the last year.
1.3
Source: One-year estimates from the American Community Survey, U.S. Census Bureau. The ACS is a sample, and has margins of error, some of which can be significant.
Definitions: Population is people age one year and older.Frequency of reporting: Annual.
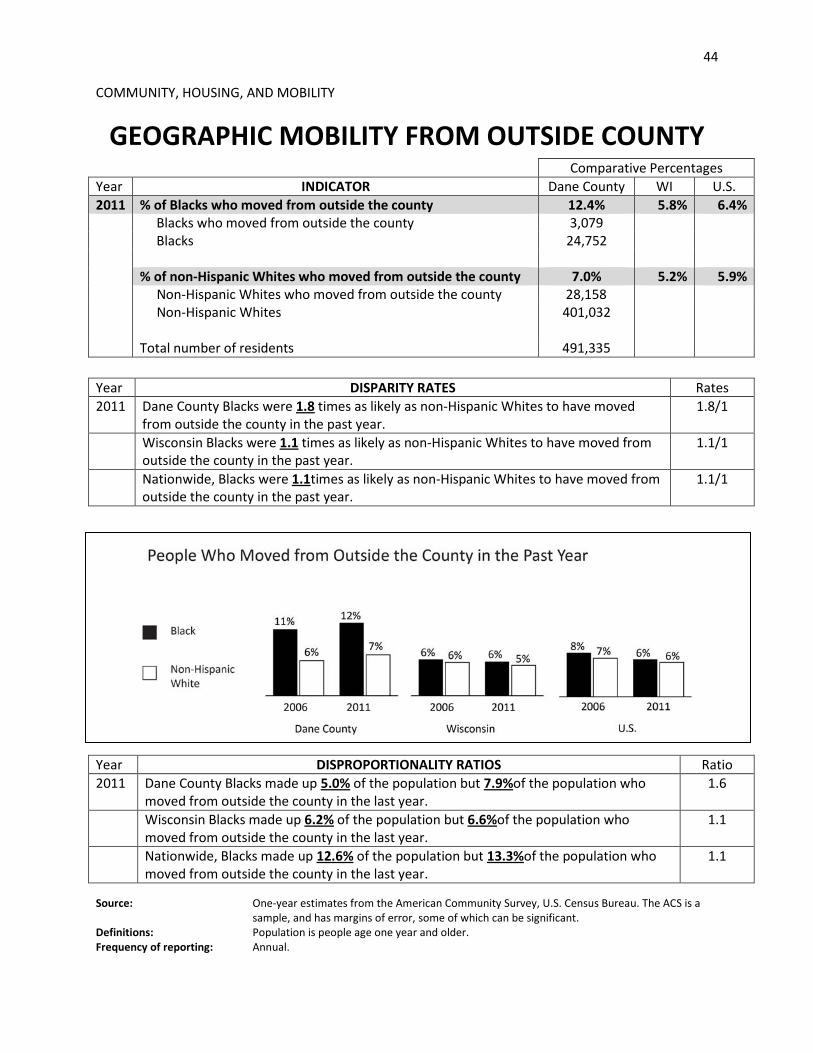
44
COMMUNITY, HOUSING, AND MOBILITY
GEOGRAPHIC MOBILITY FROM OUTSIDE COUNTY Comparative PercentagesYear INDICATOR Dane County WI U.S.2011 % of Blacks who moved from outside the county 12.4% 5.8% 6.4% Blacks who moved from outside the county 3,079 Blacks 24,752 % of non-Hispanic Whites who moved from outside the county 7.0% 5.2% 5.9% Non-Hispanic Whites who moved from outside the county 28,158 Non-Hispanic Whites 401,032 Total number of residents 491,335 Year DISPARITY RATES Rates2011 Dane County Blacks were 1.8 times as likely as non-Hispanic Whites to have moved
from outside the county in the past year. 1.8/1
Wisconsin Blacks were 1.1 times as likely as non-Hispanic Whites to have moved from outside the county in the past year.
1.1/1
Nationwide, Blacks were 1.1times as likely as non-Hispanic Whites to have moved from outside the county in the past year.
1.1/1
Year DISPROPORTIONALITY RATIOS Ratio2011 Dane County Blacks made up 5.0% of the population but 7.9%of the population who
moved from outside the county in the last year. 1.6
Wisconsin Blacks made up 6.2% of the population but 6.6%of the population who moved from outside the county in the last year.
1.1
Nationwide, Blacks made up 12.6% of the population but 13.3%of the population who moved from outside the county in the last year.
1.1
Source: One-year estimates from the American Community Survey, U.S. Census Bureau. The ACS is a sample, and has margins of error, some of which can be significant.
Definitions: Population is people age one year and older. Frequency of reporting: Annual.

APPENDIX II
MAPS
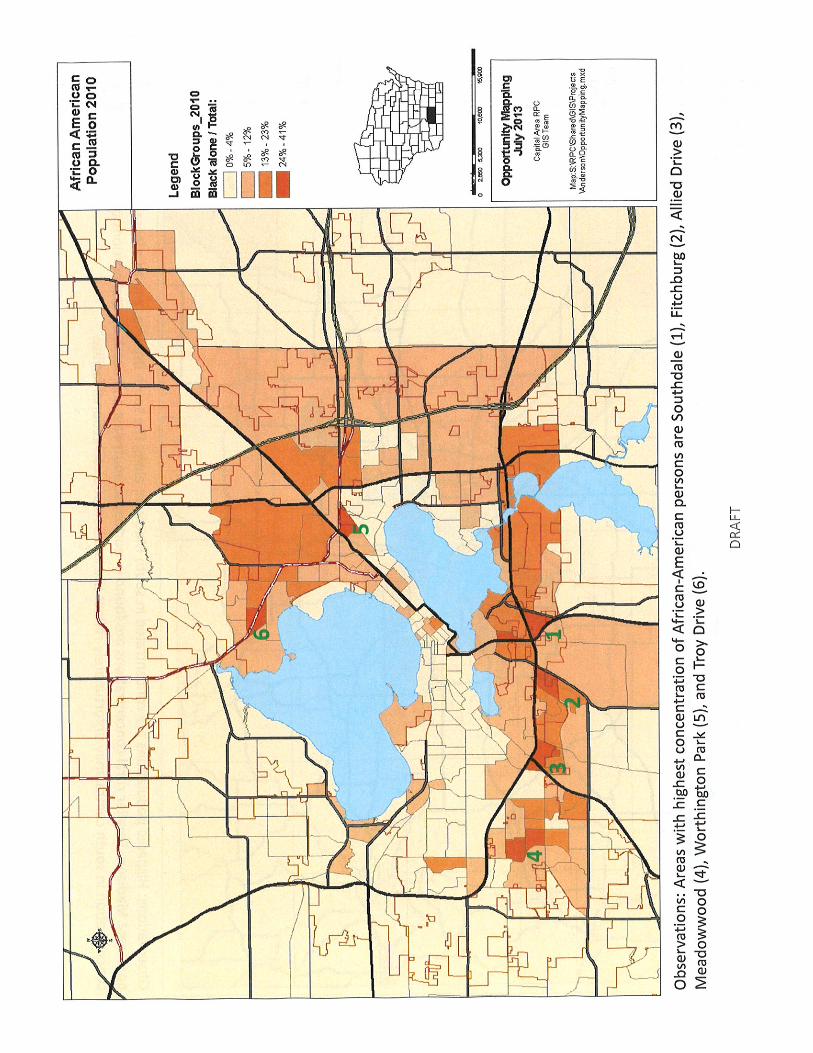
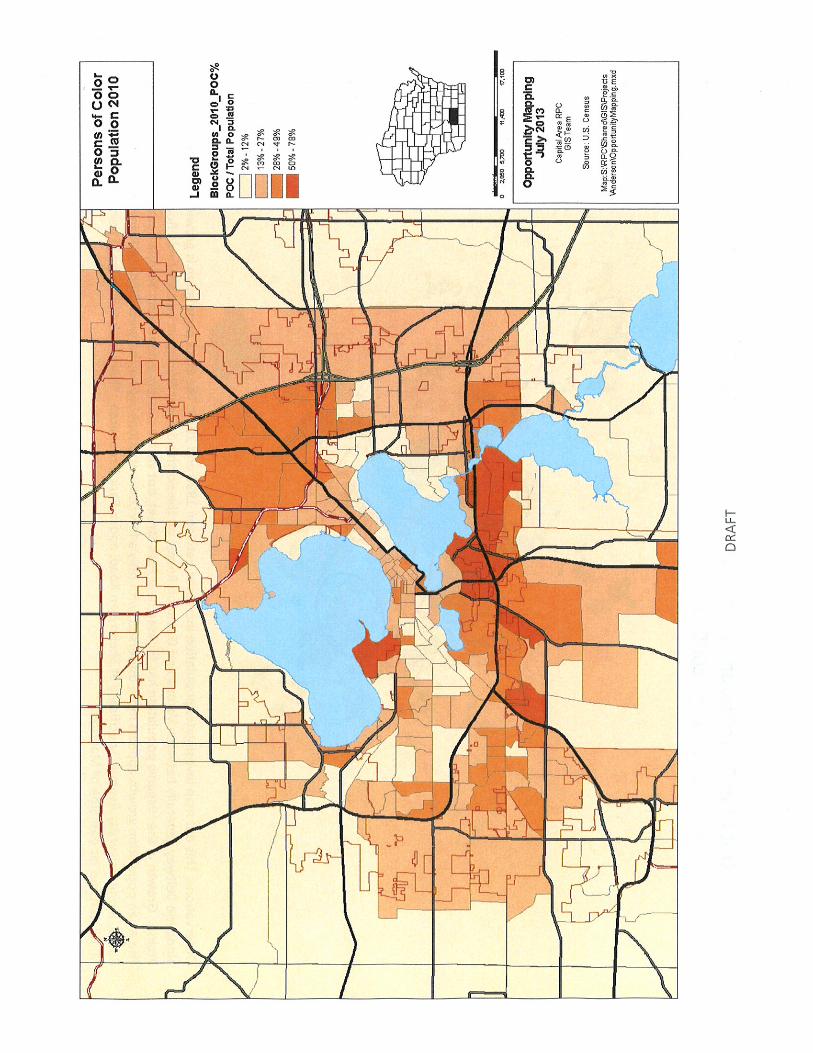
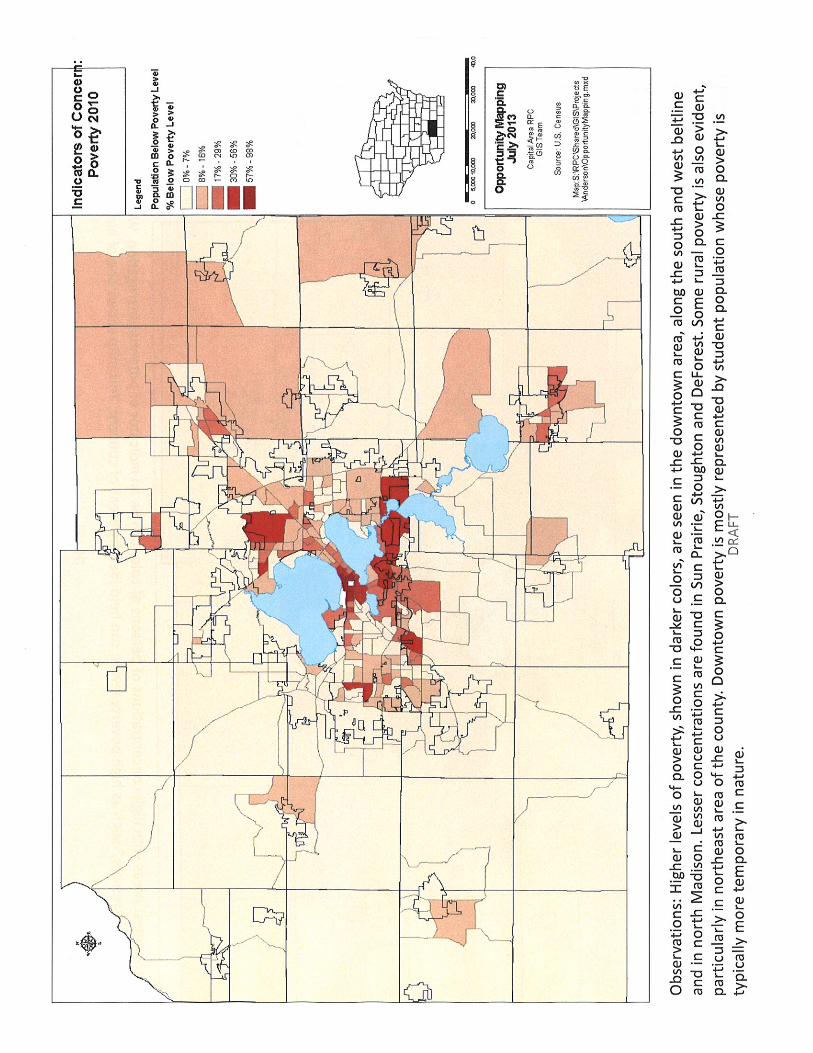
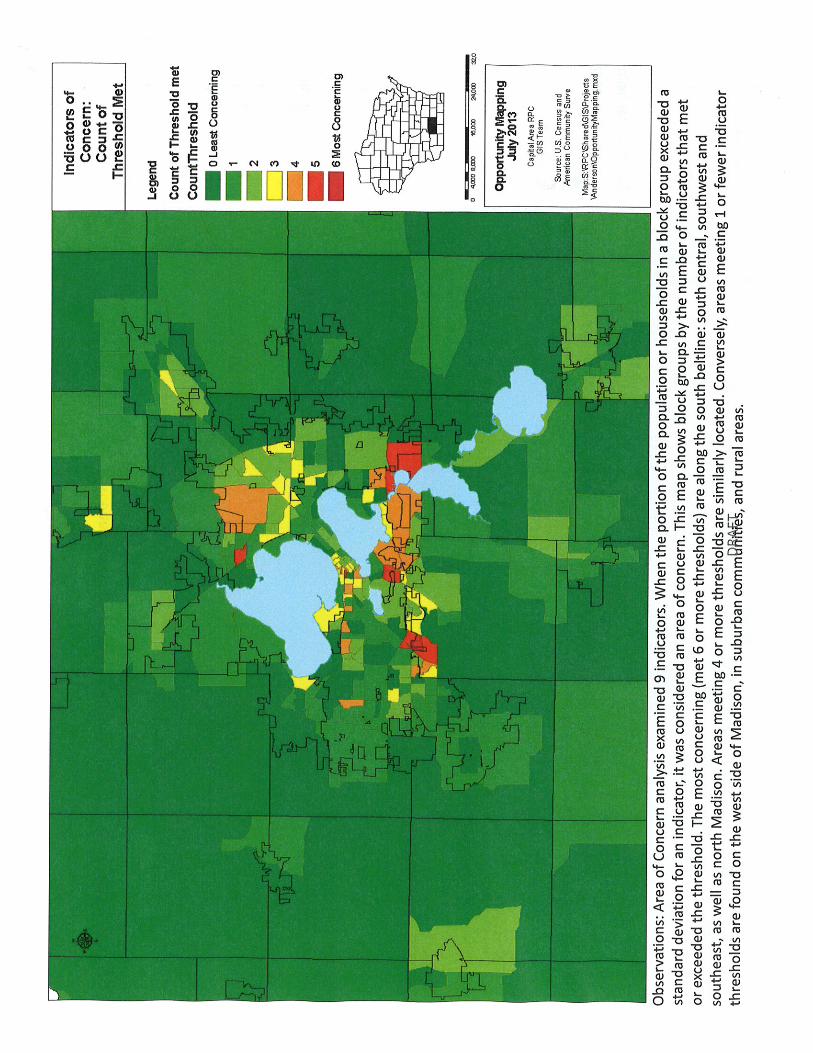
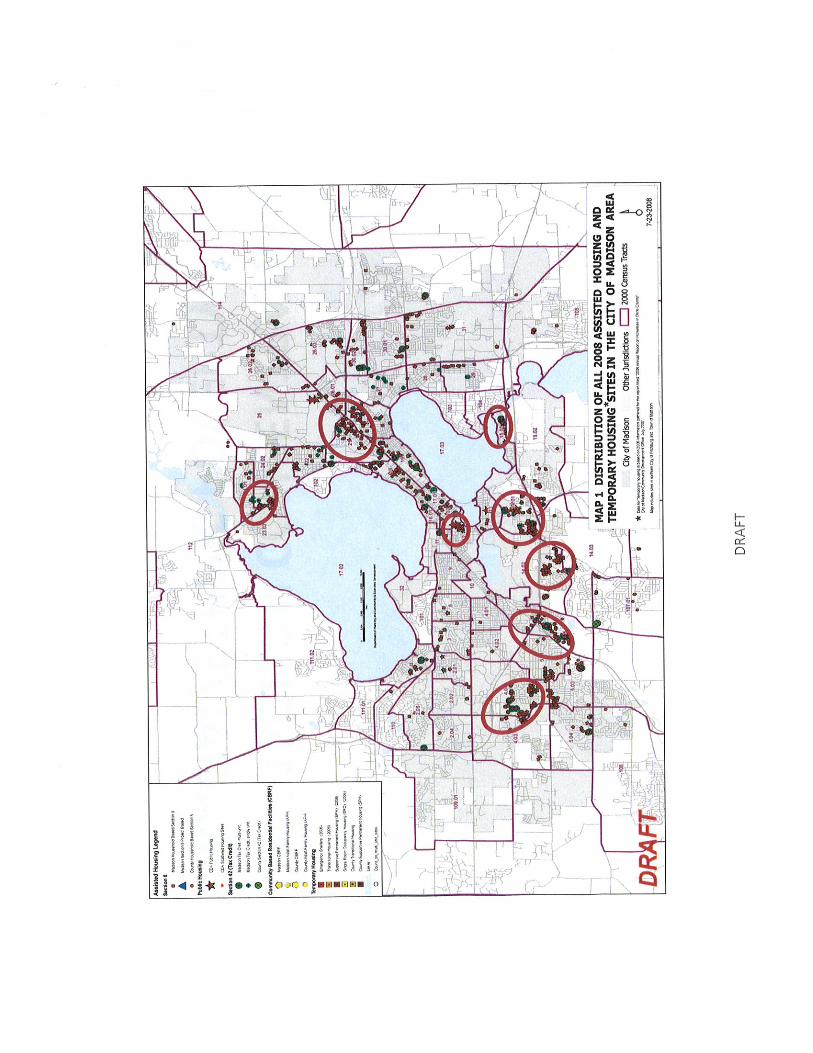
The Wisconsin Council on Children and Families555 W Washington Avenue Suite 200
Madison WI 53703608-284-0580 • www.wccf.org
Permission to copy, disseminate or otherwise use this information from this policy report is granted as long as appropriate acknowledgement is given.