Embed Size (px)
Citation preview

PH: S0273-1223(96)00740-8
e Pergamon Waf. Sci. Tech. Vol. 34, No. 7-8, pp. 163-168, 1996.Copyright © 1996 IAwQ. Published by Elsevier Science Ltd
Printed in Great Britain. All rights reserved.0273-1223/96 $15·00 + 0·00
A BASIC STUDY ON COMPREHENSIVEWATER INDICES USING GLASS FIBERFILTERS AND A SPECTROPHOTOMETER
Keigo Nakamura and Yukihiro Shimatani
River Environment Division, Environment Department, Public Works ResearchInstitute, Ministry ojConstruction, Asahi 1, Tsukuba-shi, Ibaraki 305, Japan
ABSTRACT
Chemical and biotic indices of water quality have some problems. They need a lot of time to measure andtechnology, therefore we considered evaluating water color objectively and quantitatively. This method is asfollows; after filtering sampling water on the glass fiber filter, absorbance spectrum of this filter is measuredby the spectrophotometer. This method does not need, technology and cost. We surveyed the relationbetween absorbance spectrum and conventional water indices. As a result, this method is very effective toevaluate water quality change from the water color point of view abd it can also evaluate turbidity andChlorophyII-a very easily. We expect this method to lead to a new water quality index. Copyright © 1996IAWQ. Published by Elsevier Science Ltd.
KEYWORDS
Water color; spectrophotometer; alga; absorbance; water quality; index; turbidity.
INTRODUCTION
Chemical water indices are the main indices for evaluating water quality these days. Partially biotic indicesare used and water color is rarely used for water indices. But conventional water indices have someproblems. Chemical water indices generally need time and cost. It also needs techniques for analysis. Bioticwater indices need the identification of species and also have a problem of survey. Fonner, water color indexwas not quantitative and not objective. However, a basic factor when people evaluate water quality is watercolor, and water color may be considered as the comprehensive index of water quality. Therefore we devisedobjective and quantitative water quality indices which measured the color on a glass fiber filter (pore size1.0mm) after filtering sample water. This color is evaluated from the absorbance spectrum of filter measuredby a spectrophotometer. This paper discusses how to measure these new indices and the relations betweenthis water quality index and conventional chemical water quality indices.
METHODS
The definition of "Absorbance"
According to the "The Dictionary of Biology" published by Iwanami Publisher in Japanese, "absorbance oroprical sensity (O.D.) is defined as log (10/1) of a wavelength when a light of a wavelength and strength 10
163
164 K. NAKAMURA and Y. SHIMATANI
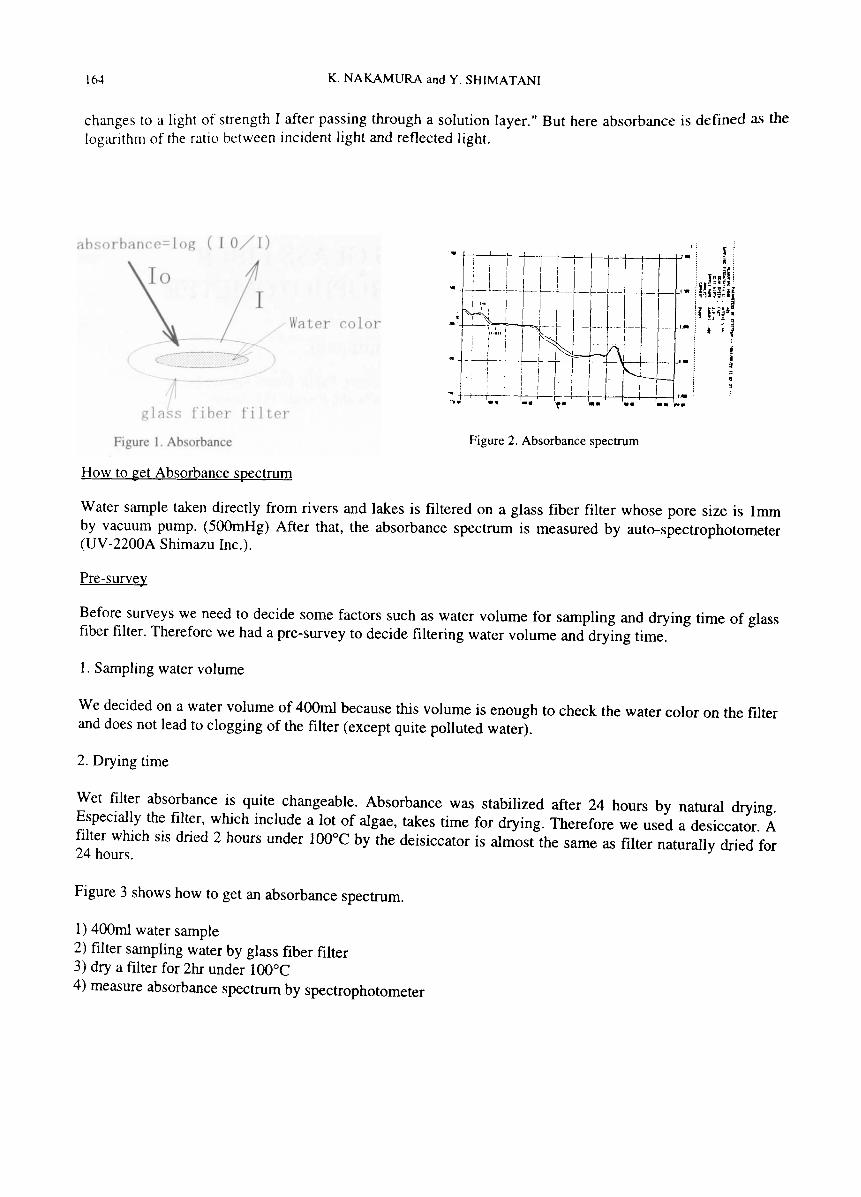
changes to a light of strength I after passing through a solution layer." But here absorbance is defined as thelogarithm of the ratio between incident light and reflected light.
.t --'I
glass fih~r fi Iter
Clhsorhancc= log ( 10/1)
--f Water color
Figure I. Absorbance
How to get Absorbance spectrum
Figure 2. Absorbance spectrum
Water sample taken directly from rivers and lakes is filtered on a glass fiber filter whose pore size is lrnmby vacuum pump. (500mHg) After that, the absorbance spectrum is measured by auto-spectrophotometer(UV-2200A Shimazu Inc.).
Pre-survey
Before surveys we need to decide some factors such as water volume for sampling and drying time of glassfiber filter. Therefore we had a pre-survey to decide filtering water volume and drying time.
1. Sampling water volume
We decided on a water volume of 400ml because this volume is enough to check the water color on the filterand does not lead to clogging of the filter (except quite polluted water).
2. Drying time
Wet filter absorbance is quite changeable. Absorbance was stabilized after 24 hours by natural drying.Especially the filter, which include a lot of algae, takes time for drying. Therefore we used a desiccator. Afilter which sis dried 2 hours under 100°C by the deisiccator is almost the same as filter naturally dried for24 hours.
Figure 3 shows how to get an absorbance spectrum.
1) 400ml water sample2) filter sampling water by glass fiber filter3) dry a filter for 2hr under 100°C4) measure absorbance spectrum by spectrophotometer

Comprehensive water indices 165
-+ DRYERD
filtnl1ioJ) hy glilssfiber Cilh'l"
looe
absorbency curve spectrophotometer
Figure 3. How to measure absorbance spectrum
Survey
We surveyed water quality at 27 points in 7 rivers and 1 lake comparing absorbance spectrum and chemicalwater indices.
Table 1. Survey points
River name survey pointsSumidagawa 2Nakagawa 2Ayasegawa 2Edogawa 4Ksumigaura Lake IKokaigawa 6Tamagawa 5Yukawa 5
RESULT
We got the following results according to my survey.
Table 2. Surveyed water indices
survcvd watcr indicesT-P P-BODP04-P D-BODT-N CODerN03-N TurbidityChI-a 55
1. Water samples which have high chlorophyll-a value absorb a lot around 670nm. However, the correlationbetween absorbance and chlorophyll-a is not so high (R=O.79). Therefore we divide 670nm from curve. Asshown in Figure 3, we devise around Alga Index (An. We found that the correlation between Alga Index(AI) and chlorophyll-a is very high (R=O.94.)
JWST 34:7/8-G

166 K. NAKAMURA and Y. SHIMATANI
.' ' ......~ ...
~~~650700 "" ~ .. ' .. '.
wave length ~:.. , j .: 0.g
'. 400 800 .• '.... w.v.l~th
.......
Figure 4. Total Absorbance and Algae Index
2. We devised another index which we named Total Absorbency (TAl. It is the integration value ofabsorbance between 400nm and 800nm. We think it means comprehensive water quality. The correlationbetween Total Absorbency and turbidity (R=0.93), SS (R=0.71), CODer (R=0.74) is high.
Chl-a = 4.0AI-0.42 (r = 0.94)
Turbidity =0.073TA-3.5 (r = 0.93)
SS = 0.12TA-5.3 (r = 0.71)
CODer = 0.060TA-1.3 (r = 0.74)
Figure 5. Chl-a and algae index. Figure 6. Turbidity and total absorbance.
--i300r -0 250
t•r+
CJ •200 •• •- •:x> 150
1 f
0-VI0,0-
100 •.c.CD
50 t-Oo 2 I I I I I I I I I
4 6 8 1012 14 16 18 20Turbidity
•
••
61
4t ·~ ; .., ,
o 5 10 15 20 25 30 35 40 45CHI-a (mg/m3)
lOT81
::::Ja..CDx
--i300r • 300
*'--i0 250 •• 0 250r+ r+ -«et-CJ 200 • CJ 200 *"t+ • • ". "* '*" f"Ie
CJ 150 :. » 150 t-o- • 0- ,'\- f*VI 100 .,.. VI 100 i h+
0 0,50 . .: ,
0- • 0- 50CJ CJ
00 5 00 -t- I I I I I I10 15 20 25 5 10 15 20 25 30 35 40CODe r (mg/ I) SS.(mg/ I)
Figure 7. CODer and total absorbance. Figure 8. SS and total absorbance.
3. A comparison between water quality and the change of absorbance in Kokai River.
Figure 9 shows the change of the absorbance from upstream (A) to downstream (F) and Table 3 shows thewater quality of each point in Kokai river. We can easily recognize the water quality change from A to F by

Comprehensive water indices 167
Fi~e 9. Es~cially the shape of curve around 670mm shows the concentration of algae. This tendency isqUIte outstandmg at C and F. C and F have high values of chlorophyll-a. Absorbance of C is generally higherthan that of D except in the area of wavelength of less than 400mm.
Table 3. Water quality of Kokai river
A B C D E FBOD 1.10 1.10 1.70 2.40 2.20 2.00
P-BOD 0.50 0.50 0.60 1.20 0.90 0.50CODer 5.30 4.60 7.80 7.70 9.90 12.30
SS 6.40 4.80 11.20 11.20 19.60 21.00Turbidity 3.30 3.60 6.00 5.90 10.00 18.00
Chl-a 2.63 3.04 23.45 8.94 9.83 26.26T-N 2.44 2.58 2.46 3.43 3.36 3.12
N03-N 1.85 2.05 2.00 2.60 2.63 2.34
T-P 0.031 0.050 0.055 0.068 0.089 0.105
P04-P 0.013 0.019 0.023 0.031 0.044 0.054
1.4
1.2-:.0"
+-~.
·"·f
absorbancy
1.0
0.8
0.6
0.4
0.0 +-------'f----t-----+----+--+----l----l
200 300 400 500 600 700 800 900wavelength(nm)
Figure 9. The change of the absorbance from upstream (A) to downstream (F).
DISCUSSION
This method is a quite simple but effective way to monitor water condition. From the spectrum curve we canassess the character of water. This method does not need special techniques, so we think this method is goodfor management in local area. This method also does not entail a high cost, so it is very reasonable to take
many samples.

168 K. NAKAMURA and Y. SHIMATANI
We expect that the absorbance curve includes a lot of information on water quality such as the species ofalgae, mineral, and how much it includes treated water. Algae have a special color derived from plantpigments. At least we can know the character of algae absorbance spectrum such as blue-green algae, diatomand green algae. The curve also gives us the information of particle nutrient salts. In Figure 9 the absorbanceof D is higher than that of C in the area less than 400mm. The nutrient salt of D such as T-N, T-P, NOrN,and P04-P is also more than that of C. The curve in the ultraviolet area probably gives us the information onnutrient salt. The nutrient at D is probably detritus here.
CONCLUSIONS
We evaluate water color objectively and quantitatively by measuring the absorbance of the glass fiber filterusing the spectrophotometer after filtering the water sample. In this study we found drying time of filter is 2hours under 100 C in the desiccator and water volume for filtering is 400ml. We made it possible to evaluatewater quality by measuring absorbance spectrum. By this method we can infer chlorophyll-a, turbidity, SS,and CODer very easily and reasonably.
REFERENCES
Yamada, T. et al. (1994). The Dictionary ofBiology, Tokyo, Japan (in Japanese)