Embed Size (px)
Citation preview
A Bayesian Framework to Account for Complex Non-Genetic Factors in Gene Expression Levels GreatlyIncreases Power in eQTL StudiesOliver Stegle1,2*., Leopold Parts3., Richard Durbin3, John Winn4*
1 Max Planck Institutes Tubingen, Tubingen, Germany, 2 University of Cambridge, Cambridge, United Kingdom, 3 Wellcome Trust Sanger Institute, Hinxton, Cambridge,
United Kingdom, 4 Microsoft Research, Cambridge, United Kingdom
Abstract
Gene expression measurements are influenced by a wide range of factors, such as the state of the cell, experimentalconditions and variants in the sequence of regulatory regions. To understand the effect of a variable of interest, such as thegenotype of a locus, it is important to account for variation that is due to confounding causes. Here, we present VBQTL, aprobabilistic approach for mapping expression quantitative trait loci (eQTLs) that jointly models contributions fromgenotype as well as known and hidden confounding factors. VBQTL is implemented within an efficient and flexibleinference framework, making it fast and tractable on large-scale problems. We compare the performance of VBQTL withalternative methods for dealing with confounding variability on eQTL mapping datasets from simulations, yeast, mouse, andhuman. Employing Bayesian complexity control and joint modelling is shown to result in more precise estimates of thecontribution of different confounding factors resulting in additional associations to measured transcript levels compared toalternative approaches. We present a threefold larger collection of cis eQTLs than previously found in a whole-genome eQTLscan of an outbred human population. Altogether, 27% of the tested probes show a significant genetic association in cis,and we validate that the additional eQTLs are likely to be real by replicating them in different sets of individuals. Ourmethod is the next step in the analysis of high-dimensional phenotype data, and its application has revealed insights intogenetic regulation of gene expression by demonstrating more abundant cis-acting eQTLs in human than previously shown.Our software is freely available online at http://www.sanger.ac.uk/resources/software/peer/.
Citation: Stegle O, Parts L, Durbin R, Winn J (2010) A Bayesian Framework to Account for Complex Non-Genetic Factors in Gene Expression Levels GreatlyIncreases Power in eQTL Studies. PLoS Comput Biol 6(5): e1000770. doi:10.1371/journal.pcbi.1000770
Editor: Aviv Regev, Broad Institute of MIT and Harvard, United States of America
Received May 13, 2009; Accepted March 30, 2010; Published May 6, 2010
Copyright: � 2010 Stegle et al. This is an open-access article distributed under the terms of the Creative Commons Attribution License, which permitsunrestricted use, distribution, and reproduction in any medium, provided the original author and source are credited.
Funding: This work was supported by the Wellcome Trust [grant number WT077192/Z/05/Z] and the Technical Computing Initiative (Microsoft Research). OSreceived funding from EPSRC and the Cambridge Gates Trust. The funders had no role in study design, data collection and analysis, decision to publish, orpreparation of the manuscript.
Competing Interests: The authors have declared that no competing interests exist.
* E-mail: [email protected] (OS); [email protected] (JW)
. These authors contributed equally to this work.
Introduction
DNA microarray technologies allow for quantification of
expression levels of thousands of loci in the genome. These
measurements enable exploring how a variable, such as clinical
phenotype, tissue type, or genetic background, affects the
transcriptional state of the sample. Recently, gene expression
levels have been studied as quantitative genetic traits, investigating
the effect of genotype as the primary variable. Studies have found
and characterised large numbers of expression quantitative trait
loci (eQTLs) [1–3], exploring their complexity [2], population
genetics [4,5] and associations with disease [6,7].
An important issue in such studies is additional variation in
expression data that is not due to the genetic state, as illustrated in
Figure 1. Intracellular fluctuations, environmental conditions, and
experimental procedures are factors that all can have a strong
effect on the measured transcript levels [2,8–10] and thereby
obscure the association signal. When measured, correct estimation
of the additional variation due to these known factors allows for a
more sensitive analysis of the genetic effect. For example, it has
been reported that additional human eQTLs can be found when
including the known factors of age, and blood cell counts in the
model [7]. It is also standard procedure to correct for batch effects,
such as image artefacts or sample preparation differences [11].
In practise it is not possible to measure or even be aware of all
potential sources of variation, but nevertheless it is important to
account for them. Unobserved, hidden factors, such as cell culture
conditions [12] often have an influence on large numbers of genes.
We and others have proposed methods to detect and correct for
such effects [9,13,14]. These studies demonstrated the importance
of accounting for hidden factors, yielding a stronger statistical
discrimination signal.
The challenge in modelling several confounding sources of
variation (Figure 1) is to correctly estimate the contribution that is
due to each one of them. There are open questions how to ensure
that only spurious signal is eliminated by methods that account for
hidden factors (see for instance discussion in [14]), and how to deal
with situations when both known and hidden factors are present.
The problem of identifying the correct causes of the signal is even
harder in the presence of additional sources of variability. For
PLoS Computational Biology | www.ploscompbiol.org 1 May 2010 | Volume 6 | Issue 5 | e1000770
example, when searching for epistatic or genotype-environment
interactions, the primary effects of other known factors and hidden
factors also need to be accounted for.
The key for correctly attributing expression variability is
controlling the complexity of the statistical models for each source
of variation. For example, the number of genotypes considered in
an association scan can be enormous, and not all of them affect the
expression level of every probe. Threshold values, obtained from
likelihood ratio statistics or empirical p-value distributions, can be
used to determine the significance of individual associations,
thereby avoiding overfitting by controlling the model complexity
[4,15]. Similar measures are necessary for models of other sources
of variability such as hidden factors.
In this work we present VBQTL (Variational Bayesian QTL
mapper), a joint Bayesian framework for gene expression
variability that accounts for the signal from genotype, known
factors, and hidden factors. VBQTL is implemented within a
general framework that provides commonly used models for
sources of phenotypic variation, which can be combined as
needed. While previous attempts have been specific to a narrow set
of underlying sources, our approach is flexible and can be adapted
to a particular study design. The probabilistic treatment allows
uncertainty to be propagated between models, and yields a
posterior distribution over model parameters. Complexity control
is tackled at the level of individual models, where parameters are
regularised in a Bayesian manner.
We compare the performance of VBQTL with existing
approaches for detecting expression QTLs. A simulation experi-
ment contrasts VBQTL with common approaches that use non-
Bayesian techniques for distinguishing global hidden factor effects
from genetic effects. This study highlights differences in the
methodology to control model complexity with implications to
eQTL detection power. The necessity and difficulty to account for
variability that confounds the genetic signal is demonstrated. Results
on datasets from a human outbred population and crosses of inbred
yeast and mouse strains show that VBQTL identifies more
significant associations than alternative methods. Finally, we apply
VBQTL to perform a whole-genome eQTL scan on the HapMap
phase 2 expression and genotype data, demonstrating the scalability
of our framework to large numbers of samples and probes. We find
three times more cis eQTLs than a standard association mapping
method, suggesting more extensive genetic control of gene
expression by common variants than previously shown.
Methods
Here, we present VBQTL, a configuration of a general
framework for modelling diverse sources of gene expression
variability. The model underlying this framework assumes that
gene expression levels are influenced by additive effects from
independent sources, e.g. in the case of VBQTL these are
contributions from genotype, known factors, and hidden factors
(Figures 1, 2a). We cast the full model in a probabilistic setting,
treating its parameters as random variables.
We perform Bayesian inference in the joint model, which is
appealing for several reasons. First, it allows possible dependencies
between the different sources of variation to be captured. The effects
of the genotype, known and hidden factors are learned jointly,
taking other parts of the model into account. Propagation of
uncertainty leads to more accurate parameter estimates [16], and
avoids possible pathologies, for instance of maximum likelihood
methods [17]. Second, Bayesian inference allows different models to
be flexibly combined according to the needs of a particular study.
Many existing approaches can be cast as special cases of this general
framework, with some examples given in Figure 1. Finally, the
Bayesian approach leads itself to efficient approximate inference
schemes such as variational methods [18], rendering the resulting
algorithms applicable to large-scale and high-dimensional datasets.
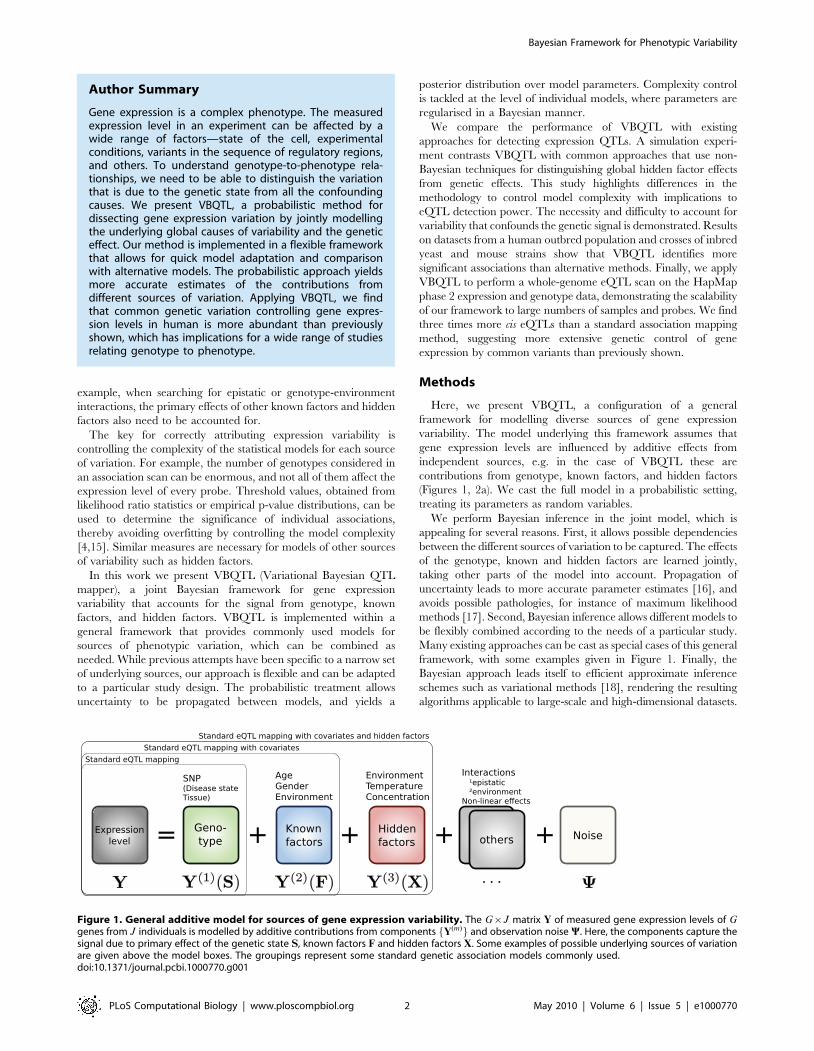
Figure 1. General additive model for sources of gene expression variability. The G|J matrix Y of measured gene expression levels of Ggenes from J individuals is modelled by additive contributions from components fY(m)g and observation noise Y. Here, the components capture thesignal due to primary effect of the genetic state S, known factors F and hidden factors X. Some examples of possible underlying sources of variationare given above the model boxes. The groupings represent some standard genetic association models commonly used.doi:10.1371/journal.pcbi.1000770.g001
Author Summary
Gene expression is a complex phenotype. The measuredexpression level in an experiment can be affected by awide range of factors—state of the cell, experimentalconditions, variants in the sequence of regulatory regions,and others. To understand genotype-to-phenotype rela-tionships, we need to be able to distinguish the variationthat is due to the genetic state from all the confoundingcauses. We present VBQTL, a probabilistic method fordissecting gene expression variation by jointly modellingthe underlying global causes of variability and the geneticeffect. Our method is implemented in a flexible frameworkthat allows for quick model adaptation and comparisonwith alternative models. The probabilistic approach yieldsmore accurate estimates of the contributions fromdifferent sources of variation. Applying VBQTL, we findthat common genetic variation controlling gene expres-sion levels in human is more abundant than previouslyshown, which has implications for a wide range of studiesrelating genotype to phenotype.
Bayesian Framework for Phenotypic Variability
PLoS Computational Biology | www.ploscompbiol.org 2 May 2010 | Volume 6 | Issue 5 | e1000770
Also, variational learning allows an inference schedule to be
specified by the user, leading to distinct algorithms with different
computational complexity and properties (see Inference).
In the following, we present the mathematical model of
VBQTL, and an outline of the inference procedure. We then
describe alternative non-Bayesian models for expression QTL
studies used in the experiments. An in-depth treatment of the
framework including full details about the parameter estimation is
provided in Text S1.
VBQTL - a joint Bayesian model for gene expressionvariability
The observed gene expression matrix Y~fyg,jg for genes
g[f1, . . . ,Gg and individuals j [f1, . . . ,Jg is modelled by the sum
of contributions Y(1),Y(2),Y(3) from the genotype, known and
hidden factor models and Gaussian noise with precisions tg for
each gene g
P(yg,j Dy(1)g,j ,y
(2)g,j ,y
(3)g,j ,tg)~N (yg,j Dy
(1)g,j zy
(2)g,j zy
(3)g,j ,
1
tg
), ð1Þ
with a gamma prior on the noise precisions P(tg)~C(tg Dat,bt)
(Figure 2a). The Y(i) comprise the contribution of individual
sources to the variability in the observed expression levels, and are
themselves treated as random variables with different underlying
models.
1) Genotype effect model represents the probabilistic
variant of the standard genetic association model, where some of
the SNP genotypes have a linear effect on gene expression levels.
The genetic component of the expression level y(1)g,j of the gth gene
probe in the jth individual is explained by linear effects of the
genotypes of N SNPs sj~fs1,j , . . . ,sN,jg (Figure 2a, green plate):
P(y(1)g,j Dsj ,bg,ug,tg)~N (y
(1)g,jDX
N
n~1
bn,g: un,gsn,j
� �,
1
tg
) ð2Þ
P(bn,g)~Bernoulli(bn,g Dpass) ð3Þ
P(un,g)~N (un,g D0,1): ð4Þ
The weights ug~ u1,g, . . . ,uN,g
� �control the magnitude of the
effect of the SNP on the expression levels of genes g. The binary
variables bg~ b1,g, . . . ,bN,g
� �determine whether the SNP effect is
significant (bn,g~true) or not (bn,g~false). The prior probability
pass of an individual association controls the complexity of the
model by influencing the a priori expected number of significant
associations; this parameter corresponds to a significance threshold
in a classical setting (Text S1).
To reduce the computational cost, inference in the association
model is approximated, only considering a single most relevant
SNP-regulator per gene, with the other bn,g forced to 0. This
bottleneck approximation ensures tractability of the joint associ-
ation model for large-scale studies (Text S1), avoiding the need to
track the covariance between effects from multiple SNPs.
2) Known factor model accounts for the effect of known
covariates F of individual samples, such as environmental
conditions, gender, or a population indicator. The linear effects
of C measured covariates in the jth individual, f j~ f1,j , . . . ,fC,j
� �,
is taken into account using a variant of Bayesian regression
(Figure 2a, blue plate):
P(y(2)g,j jf j ,vg,tg)~N (y
(2)g,jjXC
c~1
vg,c fc,j ,1
tg
) ð5Þ
P(vg,cDac)~N (vg,cD0,1
ac
) ð6Þ
P(ac)~C(acDaa,ba): ð7Þ
(b) (c)
(d) (e)(a) Bayesian network of VBQTL
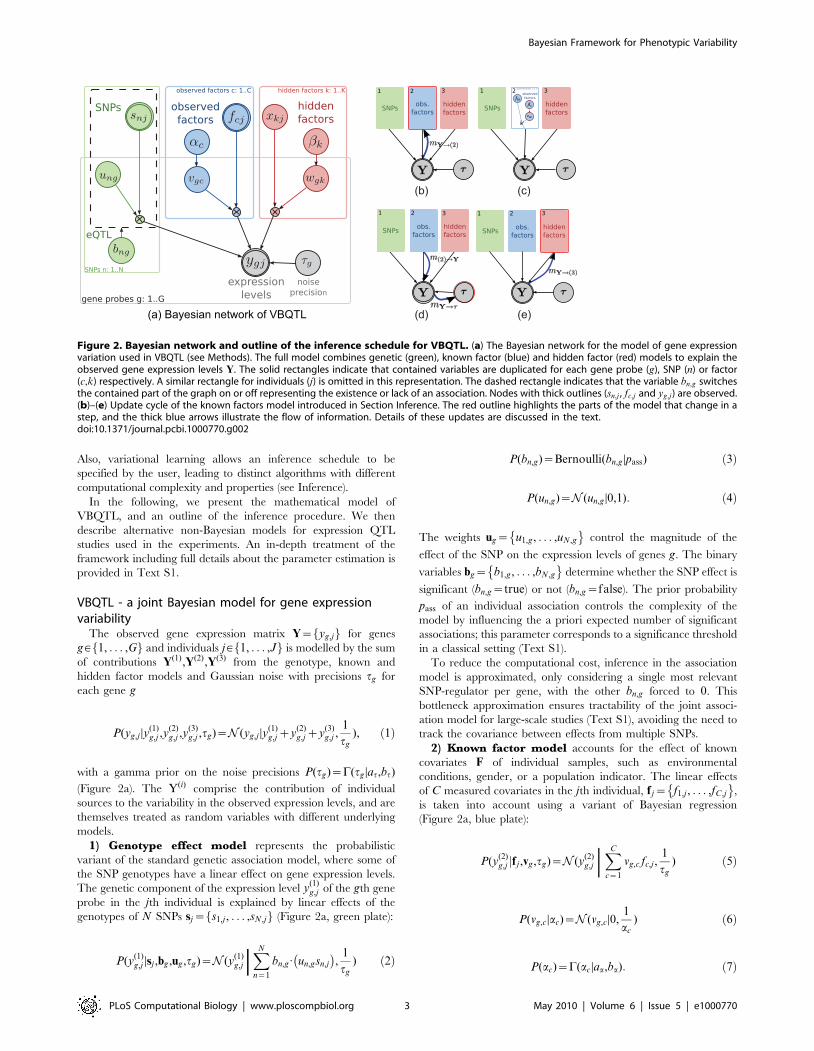
Figure 2. Bayesian network and outline of the inference schedule for VBQTL. (a) The Bayesian network for the model of gene expressionvariation used in VBQTL (see Methods). The full model combines genetic (green), known factor (blue) and hidden factor (red) models to explain theobserved gene expression levels Y. The solid rectangles indicate that contained variables are duplicated for each gene probe (g), SNP (n) or factor(c,k) respectively. A similar rectangle for individuals (j) is omitted in this representation. The dashed rectangle indicates that the variable bn,g switchesthe contained part of the graph on or off representing the existence or lack of an association. Nodes with thick outlines (sn,j , fc,j and yg,j ) are observed.(b)–(e) Update cycle of the known factors model introduced in Section Inference. The red outline highlights the parts of the model that change in astep, and the thick blue arrows illustrate the flow of information. Details of these updates are discussed in the text.doi:10.1371/journal.pcbi.1000770.g002
Bayesian Framework for Phenotypic Variability
PLoS Computational Biology | www.ploscompbiol.org 3 May 2010 | Volume 6 | Issue 5 | e1000770
Here, vg~ vg,1, . . . ,vg,C
� �is the corresponding weight vector for
each gene g. The gamma prior on the inverse variance ac for
weights of each factor introduces automatic relevance detection
(ARD) [19,20], driving the weights of unused factors to 0 and
thereby switching them off. This provides complexity control of
the model by regularising the effective number of covariates.
3) Hidden factor model accounts for the effect of hidden
factors (such as unmeasured covariates and global effects) on the
gene expression levels. We use a probabilistic variant of the
classical factor analysis model for this task. We have previously
shown that this model captures hidden factors better than
alternative linear models, such as probabilistic principal compo-
nent analysis or independent component analysis [13]. Similarly to
known factors, the expression level of gene g in individual j is
modelled by linear effects from a chosen number of K hidden
factors xj~fx1,j , . . . ,xK,jg (Figure 2a, red plate).
P(y(3)g,j Dxj ,wg,tg)~N (y
(3)g,jDX
K
k~1
wg,k xk,j ,1
tg
) ð8Þ
P(wg,k Dbk)~N (wg,kD0,1
bk
) ð9Þ
P(xk,j)~N (xk,j D0,1) ð10Þ
P(bk)~C(bk Dab,bb): ð11Þ
Note that in contrast to the known factor model, the factor
activations X~fx1, . . . ,xJg are unobserved random variables that
need to be inferred from the expression profiles. Again, the ARD
prior switches unused factors off, thereby providing probabilistic
complexity control ([13], Results).
InferenceParameter inference in VBQTL is implemented using varia-
tional Bayesian learning [18], a generalisation of the expectation
maximisation algorithm. An approximate Q-distribution over
model parameters is iteratively refined until convergence. In each
iteration, approximate distributions of individual parameters are
updated according to a specified schedule, taking the current state
of all other parameter distributions into account (Figure 2b–e).
Choosing an approximation that factorises over individual models,
the variational update equations have an intuitive interpretation:
1. The current belief of the residual dataset for a particular active
model is calculated, taking the prediction form all other models
and the estimated noise precision into account (Figure 2b).
2. The parameters of the active ith model are updated based on
their previous states and the new residual dataset (Figure 2c).
3. The distribution of the model contribution Y(i) is recalculated
using the updated parameter values. The global noise
precisions tg are updated (Figure 2d) based on the first and
second moments of all the contributions.
4. The same procedure is in turn applied to the remaining models
in the schedule (Figure 2e) until convergence.
This iterative procedure, performing updates of local parameter
distributions in turn, can be interpreted as a message passing
algorithm, where sufficient statistics of parameter and data
distributions are propagated across the graphical model [21].
The initial values of parameters are determined from maximum
likelihood solutions. A random initialisation via sampling from the
prior is possible as well; we have not explored the implications of
this alternative here. Details on inference and the individual
parameter update equations are given in Text S1.
In experiments, we compare two alternative inference schedules
of VBQTL. In iterative VBQTL (iVBQTL), the model parameters
are learned using several iterations through all model components,
first updating the genetic model, then known and hidden factors
(Text S1). An important property of iVBQTL is that hidden
factors are estimated jointly with the genetic state and known
factors. This choice of schedule and the iterative learning help to
ensure that variability that is due to genetic associations is not
explained away by other parts of the model (Results).
In cases where neither known nor hidden factors are correlated
with the genetic state, their effect can be learned independently
without running the risk of explaining away meaningful associa-
tion signal. This motivates fast VBQTL (fVBQTL), which
performs a single update iteration of the full model, first inferring
the contribution from the known and hidden factors, and then
from the genetic state. This simpler schedule can save significant
computation time, since the factor effects can be precalculated,
and only a single iteration of the computationally more expensive
genetic association model is needed. In cases where the genetic
state is approximately orthogonal to the known and hidden
factors, this cheaper approximation performs equally with
iVBQTL for finding genetic associations (Results).
Alternative methods to account for confoundingvariation in expression QTL studies
We compared VBQTL with previous methods that account for
confounding variance in the context of expression QTL mapping.
Similarly to VBQTL, they model known and hidden factors in the
expression levels. The differences between the alternative methods
are in the hidden factor model used, which in turn vary in the
complexity control approach employed as highlighted below. Thus
these alternative models are named after the hidden factor
estimation method.
N Standard model explains the expression variability solely by
the effects of known factors and SNP genotypes, without
accounting for the hidden factors.
N PCA uses principal component analysis to detect hidden
factors. In general, PCA can explain all the variability in the
data. Complexity is controlled by specifying the number of
components to use as a parameter.
N PCAsig is an extension of PCA to account for hidden factors.
In this model, complexity control is achieved via significance
testing of eigenvalues, retaining only components that explain
more variance than expected by chance at a specified
significance cutoff (Text S1).
N SVA model controls complexity similarly to PCAsig, and also
accommodates a per-gene noise model and explicitly allows for
sparse non-orthogonal components [9].
For a quantitative evaluation of the performance of each
method, we considered the resulting residuals of the estimated
effects from known and hidden factors. To detect eQTLs we
applied standard statistical tests employing a linear model on the
SNP genotype on these residual datasets (Text S1). For iVBQTL
and fVBQTL, we inferred the posterior parameter distributions,
and subtracted off the estimated effect of known and hidden
Bayesian Framework for Phenotypic Variability
PLoS Computational Biology | www.ploscompbiol.org 4 May 2010 | Volume 6 | Issue 5 | e1000770
factors. For other methods, we first subtracted off the standard
linear regression fit of the known factors, and then learned and
subtracted off the hidden factor effects on the residuals. All these
alternative methods are also implemented in the general
framework; for details see Text S1.
While VBQTL shares basic assumptions with these alternatives,
there are a number of differences. First, it is a probabilistic model
that operates with uncertainties in the parameter estimates as
explained above. Second, the hidden factor model allows for non-
orthogonal components, and provides probabilistic complexity
control based on ARD. Third, the iVBQTL schedule takes the
genetic signal into account when estimating the hidden factor
effect. Finally, the VBQTL model estimates a global gene-specific
noise level, while the non-Bayesian models either estimate noise
levels implicitly (SVA) or assume noise-free observations (PCA,
PCAsig).
Results
Simulation study highlights performance differences dueto complexity control approaches
We employed a simulated dataset to highlight the differences
between alternative approaches to account for global factors in
eQTL finding. Our synthetic expression data combines linear effects
from genetic associations (eQTLs), known, hidden, and genetic
global factors, and gene-specific noise (Text S1). We used three
known and seven unknown global factors whose influence varies
significantly to simulate effects with a range of magnitudes. These
factors are meant to represent sources of confounding variation that
are encountered in the study of the real datasets. We also introduced
three global genetic factors giving rise to trans eQTL hotspots,
mimicking the action of a genetic variant in a transcriptional
regulator (e.g. transcription factor or pathway component). Such loci
have been observed in several eQTL mapping studies [1,3]. We
designated three genes with a simulated eQTL as such regulators,
and simulated correlated expression levels for 15% of the genes for
each. While the specific simulation scenario may be biased in the
comparative performance of different methods, its underlying linear
model is shared by all the considered approaches, and it gives
intuition for the results on real datasets discussed later.
Complexity control determines the accuracy of the hidden
factor model. We assessed the ability of the considered methods
to recover the simulated confounding variability. For those
approaches that do infer hidden factor effects, we varied the
corresponding complexity control parameters to investigate the
influence on performance. For methods that take the number of
components in the hidden factor model as a parameter (PCA,
VBQTL), performance for one to 50 hidden factors was compared.
For significance-testing based methods, we considered different
significance cutoffs a in the range ½0:01,0:5�.iVBQTL correctly captured the non-genetic global factor effects
(Figure 3a), as it is the only method that models the genetic signal
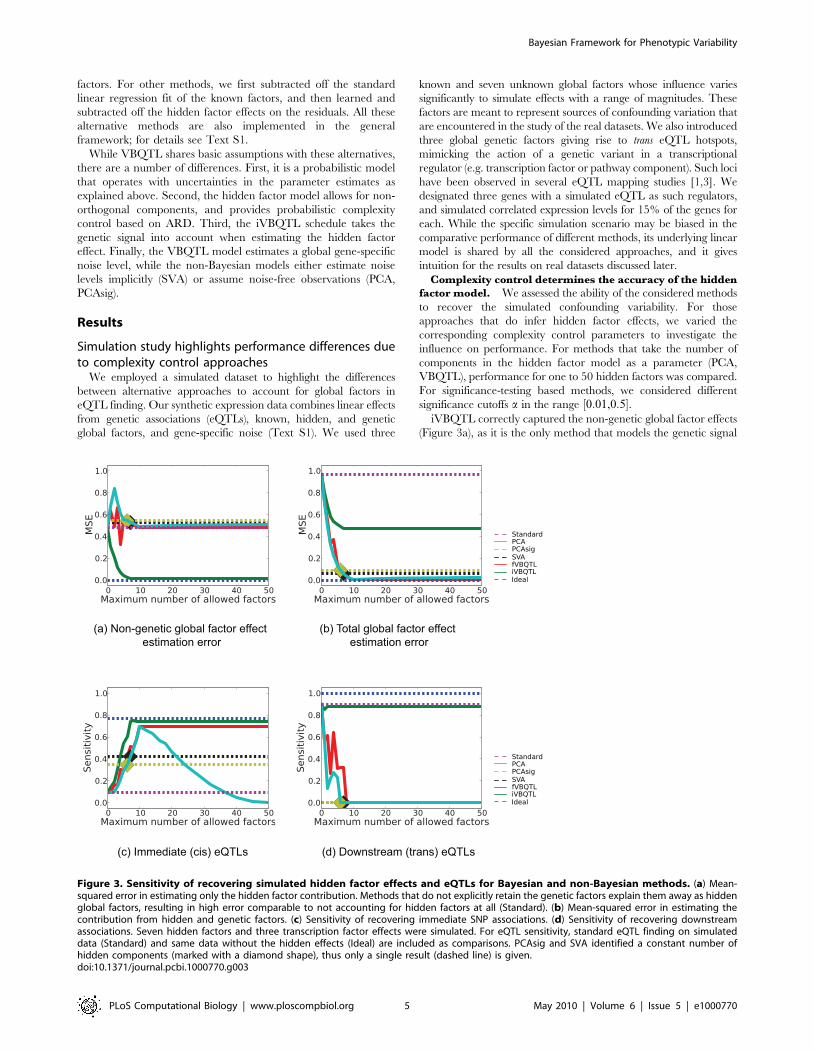
(a) Non-genetic global factor effect estimation error
(b) Total global factor effect estimation error
(c) Immediate (cis) eQTLs (d) Downstream (trans) eQTLs
Figure 3. Sensitivity of recovering simulated hidden factor effects and eQTLs for Bayesian and non-Bayesian methods. (a) Mean-squared error in estimating only the hidden factor contribution. Methods that do not explicitly retain the genetic factors explain them away as hiddenglobal factors, resulting in high error comparable to not accounting for hidden factors at all (Standard). (b) Mean-squared error in estimating thecontribution from hidden and genetic factors. (c) Sensitivity of recovering immediate SNP associations. (d) Sensitivity of recovering downstreamassociations. Seven hidden factors and three transcription factor effects were simulated. For eQTL sensitivity, standard eQTL finding on simulateddata (Standard) and same data without the hidden effects (Ideal) are included as comparisons. PCAsig and SVA identified a constant number ofhidden components (marked with a diamond shape), thus only a single result (dashed line) is given.doi:10.1371/journal.pcbi.1000770.g003
Bayesian Framework for Phenotypic Variability
PLoS Computational Biology | www.ploscompbiol.org 5 May 2010 | Volume 6 | Issue 5 | e1000770
when learning hidden factors. All other methods treat the
simulated transcription factor contributions as confounding
variation and explain them away. This can be a desired effect
when the genetic signal is not of primary interest, or a serious
shortcoming when downstream eQTLs are sought.
Complexity control settings determined the performance of
capturing the simulated global effects on expression levels. PCA
was most accurate when the number of hidden factors was set to
10, since seven hidden factors and three transcription factors were
simulated. For larger number of components PCA overfitted, and
started explaining away genetic signal, resulting in the increase in
error. For a small number of components, transcription factor
effects were explained away first, which increased the error in
estimating the hidden factors alone. However, the estimates of the
total global effects improved. PCAsig and SVA found 6 and 7
significant hidden factors for the wide range of significance cutoffs,
a[ ½0:01,0:5�, respectively. They failed to detect some of the
weaker hidden effects that continued to mask the genetic signal,
and underfitted the data. Their performance was similar to PCA
with the matching number of components. While the significance-
testing based complexity control prevents these approaches from
overfitting, only a single outcome is observed for a wide range of
parameter settings, with the models settling to a rigid suboptimal
solution. fVBQTL achieved the most accurate estimation of global
variation. Notably, unlike PCA, its performance did not degrade
for large numbers of hidden factors in the model, exhibiting good
complexity control in this scenario.
Hidden factor effect estimation accuracy is mirrored in
eQTL finding sensitivity. We determined the sensitivity and
specificity of the considered methods for detecting the immediate
and downstream simulated genetic associations. The significance
of an eQTL was tested using a two-sided t test on the correlation
coefficient with a 0:1% Bonferroni corrected per-gene false
positive rate in the genetic association model. The results when
calling eQTLs using regression on ranks, or permutations to
establish the empirical null distribution of LOD scores were almost
identical (Figure S1). As a benchmark, the comparison includes
eQTL finding using the standard method on both raw expression
data (Standard), and an ideal case, where the simulated hidden
factor effects are removed, but the simulated genetic factors
maintained (Ideal).
The accuracy of the hidden factor effect estimation mirrored the
immediate eQTL finding sensitivity (Figure 3c). The specificity
was consistent with the chosen false positive rate for all methods
(data not shown). fVBQTL and iVBQTL recovered more true cis
eQTLs compared to other methods, approaching the performance
of the ideal case, mirroring the accuracy of estimating hidden
factor effects. PCA overfitted when the number of components
used was greater than the true number of ten simulated global
factors, explaining away genetic signal. While the PCA error for
detecting global effects increased only marginally, the decrease in
sensitivity for identifying eQTLs was severe. The overfitting in
case of PCA, and underfitting in case of PCAsig and SVA both
resulted in a loss of sensitivity to find the simulated cis associations.
fVBQTL and iVBQTL did not suffer from either deficiency,
capturing nearly all the associations possible in the ideal case.
All methods except iVBQTL and standard method explained
away simulated trans eQTL hotspots (Figure 3d). This is due to the
global factor effect estimation accuracy, where iVBQTL alone
refrained from explaining the hotspots away as a global factor.
The standard method found nearly all the original trans
associations, actually outperforming methods that explain away
confounding variability. Thus, in cases where there is true genetic
signal with widespread downstream effects, its contribution needs
to be taken into account to retain its relation to genotype, and
avoid attributing it to a confounding global cause. This is
straightforward in our framework, and is demonstrated by the
good performance of iVBQTL in this scenario. iVBQTL retained
the original associations, while explaining away non-genetic causes
of expression variability, thus adding power to detect the weaker,
masked eQTLs. This effect is also observed in the study of crosses
of inbred strains below.
Taken together these results suggest that it is important to
account for the confounding sources of variation in expression
levels, while keeping the signal of the genetic state. Correct
complexity control is required to avoid over- and underfitting in
order to achieve optimal sensitivity for detecting true genetic
associations.
VBQTL finds additional expression QTLs in real datasetsNext, we compared the same methods for expression QTL
finding on yeast [2], mouse [3] and human [4] datasets. These
represent common study designs of an outbred population
(human), and a population of crosses between inbred strains
(yeast, mouse). We considered 5, 15, 30, and 60 hidden factors for
PCA and VBQTL, and 0:01,0:1, and 0:3 as significance cutoffs for
SVA and PCAsig. Expression QTLs were detected using a two-
sided t test analogously to the simulation scenario. Again, results
for alternative genetic association tests were similar (Figures S2,
S3, S4).
Accounting for hidden factors helps to detect additional
cis eQTLs in an outbred population. We applied the
considered methods on the genotype and expression data from
90 individuals of the CEU (CEPH from Utah) HapMap phase 2
samples [4,22]. The data consisted of genotypes of 55,000 SNPs
and expression levels of 618 probes from chromosome 19 (results
for three more chromosomes were similar, data not shown). The
expression levels were measured in EBV-transformed lympho-
blastoid cell lines of healthy individuals. The gender covariate was
included as a known factor for all methods. We did not consider
probes with overlapping SNPs. Following [4], an association was
called to be in cis when the SNP was within 1Mb from the probe
midpoint and in trans otherwise.
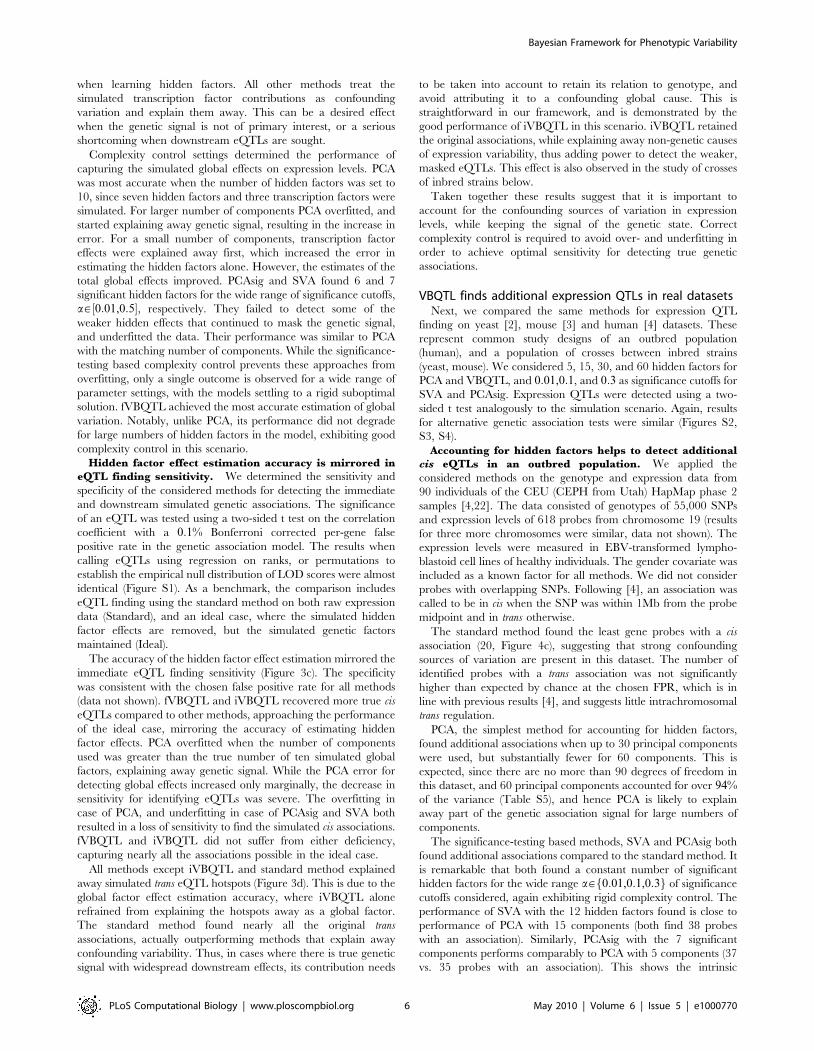
The standard method found the least gene probes with a cis
association (20, Figure 4c), suggesting that strong confounding
sources of variation are present in this dataset. The number of
identified probes with a trans association was not significantly
higher than expected by chance at the chosen FPR, which is in
line with previous results [4], and suggests little intrachromosomal
trans regulation.
PCA, the simplest method for accounting for hidden factors,
found additional associations when up to 30 principal components
were used, but substantially fewer for 60 components. This is
expected, since there are no more than 90 degrees of freedom in
this dataset, and 60 principal components accounted for over 94%of the variance (Table S5), and hence PCA is likely to explain
away part of the genetic association signal for large numbers of
components.
The significance-testing based methods, SVA and PCAsig both
found additional associations compared to the standard method. It
is remarkable that both found a constant number of significant
hidden factors for the wide range a[f0:01,0:1,0:3g of significance
cutoffs considered, again exhibiting rigid complexity control. The
performance of SVA with the 12 hidden factors found is close to
performance of PCA with 15 components (both find 38 probes
with an association). Similarly, PCAsig with the 7 significant
components performs comparably to PCA with 5 components (37
vs. 35 probes with an association). This shows the intrinsic
Bayesian Framework for Phenotypic Variability
PLoS Computational Biology | www.ploscompbiol.org 6 May 2010 | Volume 6 | Issue 5 | e1000770
similarity of these methods to PCA, as was also observed in the
simulation scenario.
fVBQTL and iVBQTL found more probes with an association
(55 and 54) than all other methods, representing an almost
threefold increase in the number of genes with a cis eQTL.
Complexity control assured that the performance saturated for
large enough number of factors and did not degrade as for PCA.
None of the estimated hidden factors was significantly correlated
to a SNP genotype, suggesting that individual genetic variants do
not have global effects on many gene expression levels in this
dataset.
It is important to note that the model performance depends on
two aspects. First, the model complexity control, regulating the
amount of variance explained, is important to ensure that genetic
signal is not attributed to hidden factors. Overfitting in case of
PCA for a large number of components is an example of such an
effect. Second, while alternative hidden factor models explained
similar amounts of variance, their performance differed due to the
underlying model. For example, PCA and fVBQTL both
explained about 70% of variance in the observed expression levels
(Table S5), yet fVBQTL identified additional associations. These
findings are consistent with the simulation study results, and
suggest that the additional associations found with Bayesian
models are due to differences in the underlying model and
complexity control.
Accounting for hidden factors adds power to detect cis
associations in crosses between inbred mouse and yeast
strains. Next, we applied the methods to two datasets of inbred
strain crosses. The yeast expression dataset [2] (GEO [23]
accession GSE1990 with genotypes provided by authors)
contained 7084 expression measurements and 2925 genotyped
loci in 112 crosses of segregating yeast strains. The mouse
expression data [3] consisted of 23,698 expression measurements
for 111 F2 mouse lines, and genotypes at 137 genetic markers. An
association was called to be in cis if the probe and the genotyped
locus were from the same chromosome, and in trans otherwise.
The relative performance of different methods was similar to
their ability to detect cis eQTLs in the outbred population dataset
(Figures 4a, 4b). The absolute performance gain was significantly
lower for all methods, however. This finding suggests that the
genetic signal is stronger compared to confounding sources of
variation, which is not unexpected from the study design. All
factor methods identified additional associations compared to the
standard method. PCA overfitted for larger numbers of principal
components used, explaining away genetic association signal. SVA
and PCAsig found the same number of significant hidden factors
for a range of significance cutoffs considered, exhibiting little
flexibility. Again, their performance was similar to extrapolation of
PCA results with matching numbers of effective components.
fVBQTL and iVBQTL found additional genetic associations in cis
compared to the standard model and other methods for
accounting for confounding variance, as observed in simulations
and human dataset. Summary statistics for the method perfor-
mance can be found in Table S6 and S7 respectively.
Iterative learning with iVBQTL overcomes difficulties in
detecting trans associations for crosses of inbred
strains. All methods found additional trans associations in
mouse, but fewer than the standard method in yeast (Figure 4d,
(a) Yeast cis eQTLs
(e) Mouse trans eQTLs
(c) Human cis eQTLs
(d) Yeast trans eQTLs
(b) Mouse cis eQTLs
Figure 4. Number of probes with an eQTL found as a function of maximum number of hidden factors for three previouslypublished datasets. Significance-testing based methods (PCAsig, SVA) identified the same number of factors for a wide range of cutoff values(a[ ½0:01,0:3�), thus only a single count is given (dashed lines), together with the number of factors found (diamond shape). Other methods wereapplied with a maximum number of 5, 15, 30 and 60 hidden factors.doi:10.1371/journal.pcbi.1000770.g004
Bayesian Framework for Phenotypic Variability
PLoS Computational Biology | www.ploscompbiol.org 7 May 2010 | Volume 6 | Issue 5 | e1000770
4e). In yeast, the more variance was explained by the hidden
factors, the fewer trans eQTLs were found, suggesting that the
global determinants of gene expression variation were correlated
with the genetic state. Indeed, the inferred hidden factor levels
were correlated with genotypes of ‘‘pivotal loci’’ that are associated
with expression levels of hundreds of genes.
The effect of pivotal loci has been observed before, and
interpreted in different ways [9,14]. It could be that the additional
variation is artefactual, and correlated to the genetic state by
chance. In this case, all the original trans associations are spurious.
The alternative explanation is that the genotype of these loci have
real downstream effects on the expression profiles of the genes. In
this case the variance is not confounding the genetic signal, but in
fact is a part of it, and hence should not be explained away.
Previous methods do not provide consistent ways of dealing with
this issue. The SVA authors also suggest to remove the effect of the
primary variable first. However, the authors do not consider
accounting for the genetic effect in their application to the same
yeast dataset [9]. In a second study [14], the application of a
correction procedure also explains away trans associations. We
provide a principled approach for dealing with this situation and
show its merit. The iVBQTL scheduling takes the genetic state
into account while learning the hidden factors, and as a
consequence is more sensitive to genetic associations.
Application of VBQTL recovers three times more probeswith a cis eQTL in a whole-genome scan of HapMapphase II data
Motivated by the results of the initial study of a single human
chromosome, we applied fVBQTL, learning 30 hidden factors, to
the 10,000 most variable expression probes of the HapMap 2
dataset. We searched for cis eQTLs in the original expression data
(standard eQTLs) as well as the residuals of fVBQTL (VBeQTLs),
using a 2-tailed t test with 0:1% Bonferroni-corrected per-gene
FPR to assess the significance of association.
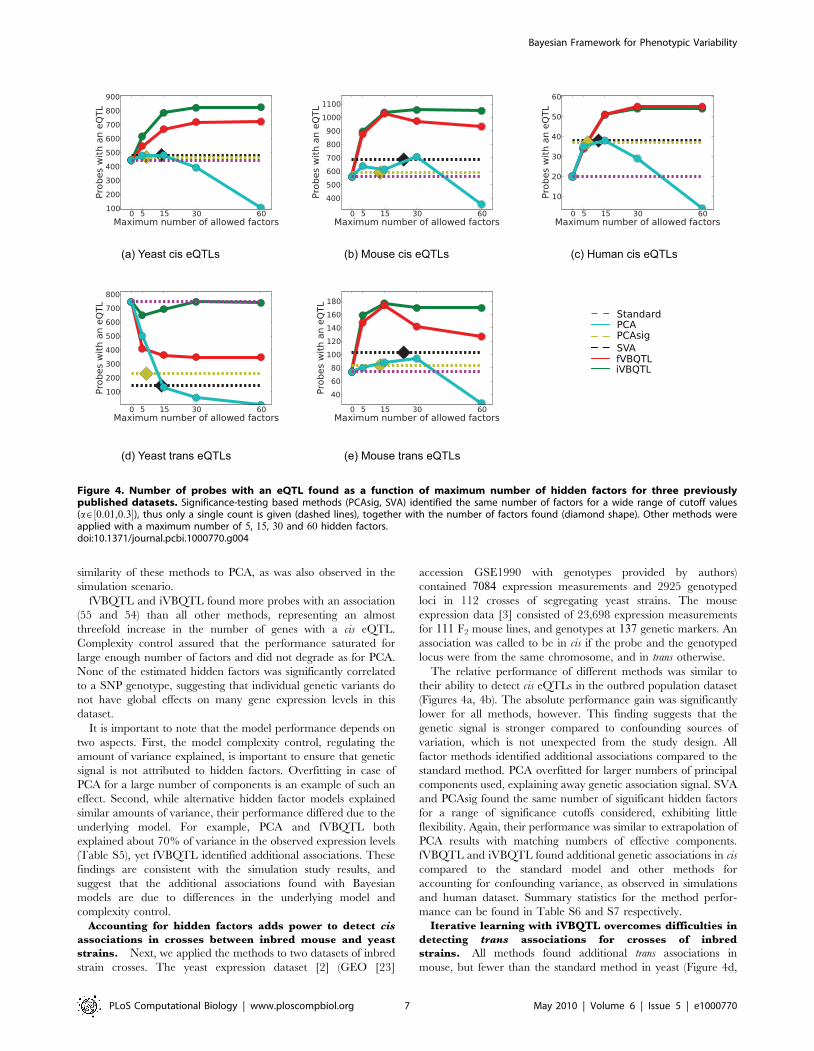
On the CEU population, we found 1051 genes with a VBeQTL
at false discovery rate (FDR) of 0:9%, and 382 genes with a
standard eQTL at FDR of 2:6% (Figure 5). This result
corresponds to nearly a threefold increase in the number of genes
with an association, and is consistent across chromosomes. A
similar increase in the number of associations was found for other
populations (Table S1).
We repeated this genome-wide experiment on pooled popula-
tions. Due to the increased sample size, it was possible to detect
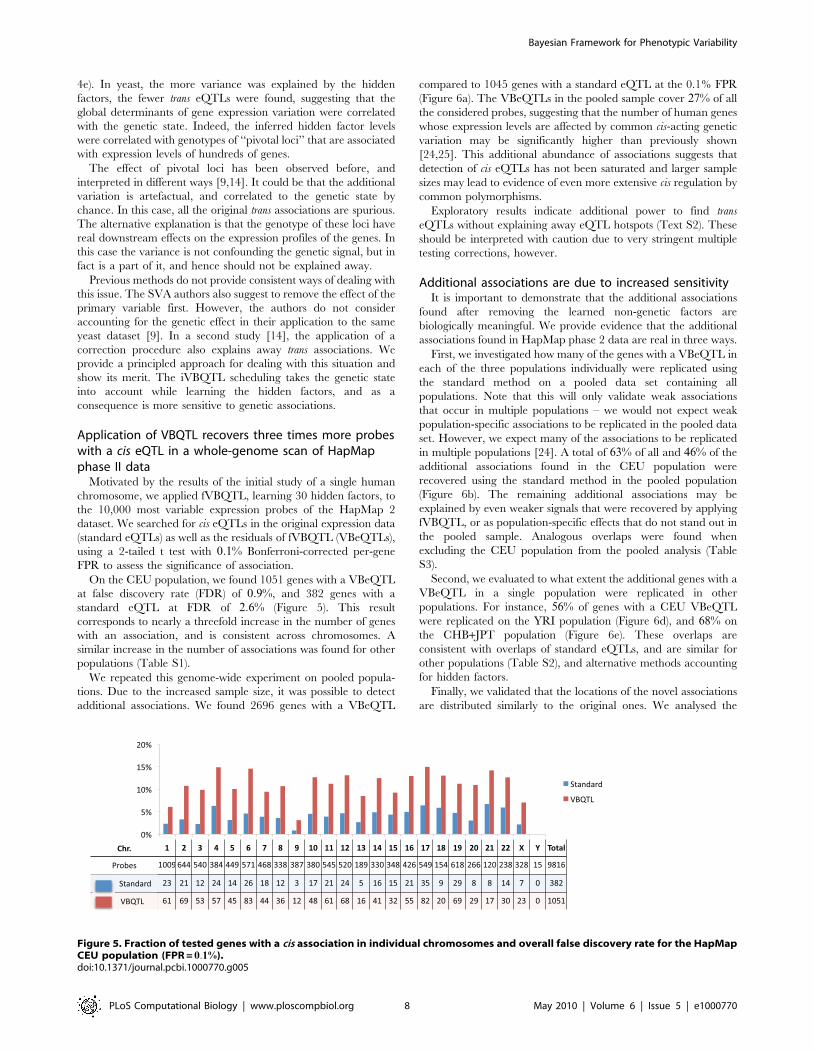
additional associations. We found 2696 genes with a VBeQTL
compared to 1045 genes with a standard eQTL at the 0.1% FPR
(Figure 6a). The VBeQTLs in the pooled sample cover 27% of all
the considered probes, suggesting that the number of human genes
whose expression levels are affected by common cis-acting genetic
variation may be significantly higher than previously shown
[24,25]. This additional abundance of associations suggests that
detection of cis eQTLs has not been saturated and larger sample
sizes may lead to evidence of even more extensive cis regulation by
common polymorphisms.
Exploratory results indicate additional power to find trans
eQTLs without explaining away eQTL hotspots (Text S2). These
should be interpreted with caution due to very stringent multiple
testing corrections, however.
Additional associations are due to increased sensitivityIt is important to demonstrate that the additional associations
found after removing the learned non-genetic factors are
biologically meaningful. We provide evidence that the additional
associations found in HapMap phase 2 data are real in three ways.
First, we investigated how many of the genes with a VBeQTL in
each of the three populations individually were replicated using
the standard method on a pooled data set containing all
populations. Note that this will only validate weak associations
that occur in multiple populations – we would not expect weak
population-specific associations to be replicated in the pooled data
set. However, we expect many of the associations to be replicated
in multiple populations [24]. A total of 63% of all and 46% of the
additional associations found in the CEU population were
recovered using the standard method in the pooled population
(Figure 6b). The remaining additional associations may be
explained by even weaker signals that were recovered by applying
fVBQTL, or as population-specific effects that do not stand out in
the pooled sample. Analogous overlaps were found when
excluding the CEU population from the pooled analysis (Table
S3).
Second, we evaluated to what extent the additional genes with a
VBeQTL in a single population were replicated in other
populations. For instance, 56% of genes with a CEU VBeQTL
were replicated on the YRI population (Figure 6d), and 68% on
the CHB+JPT population (Figure 6e). These overlaps are
consistent with overlaps of standard eQTLs, and are similar for
other populations (Table S2), and alternative methods accounting
for hidden factors.
Finally, we validated that the locations of the novel associations
are distributed similarly to the original ones. We analysed the
Figure 5. Fraction of tested genes with a cis association in individual chromosomes and overall false discovery rate for the HapMapCEU population (FPR = 0:1%).doi:10.1371/journal.pcbi.1000770.g005
Bayesian Framework for Phenotypic Variability
PLoS Computational Biology | www.ploscompbiol.org 8 May 2010 | Volume 6 | Issue 5 | e1000770
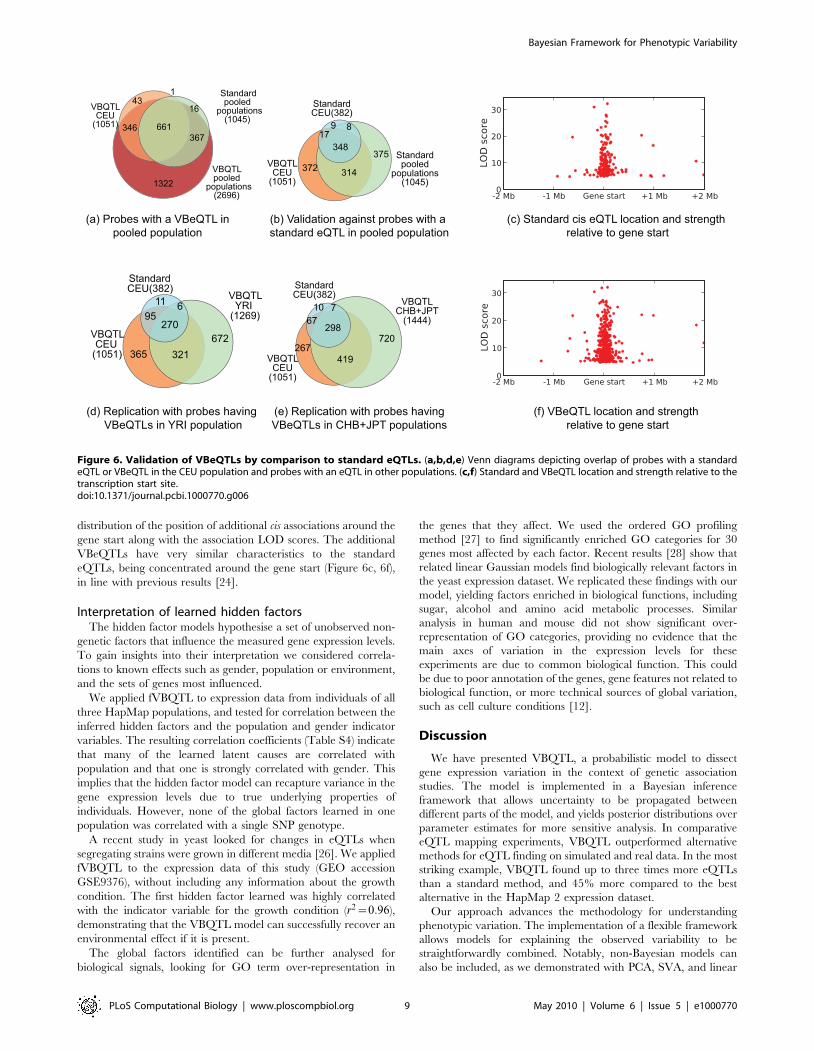
distribution of the position of additional cis associations around the
gene start along with the association LOD scores. The additional
VBeQTLs have very similar characteristics to the standard
eQTLs, being concentrated around the gene start (Figure 6c, 6f),
in line with previous results [24].
Interpretation of learned hidden factorsThe hidden factor models hypothesise a set of unobserved non-
genetic factors that influence the measured gene expression levels.
To gain insights into their interpretation we considered correla-
tions to known effects such as gender, population or environment,
and the sets of genes most influenced.
We applied fVBQTL to expression data from individuals of all
three HapMap populations, and tested for correlation between the
inferred hidden factors and the population and gender indicator
variables. The resulting correlation coefficients (Table S4) indicate
that many of the learned latent causes are correlated with
population and that one is strongly correlated with gender. This
implies that the hidden factor model can recapture variance in the
gene expression levels due to true underlying properties of
individuals. However, none of the global factors learned in one
population was correlated with a single SNP genotype.
A recent study in yeast looked for changes in eQTLs when
segregating strains were grown in different media [26]. We applied
fVBQTL to the expression data of this study (GEO accession
GSE9376), without including any information about the growth
condition. The first hidden factor learned was highly correlated
with the indicator variable for the growth condition (r2~0:96),
demonstrating that the VBQTL model can successfully recover an
environmental effect if it is present.
The global factors identified can be further analysed for
biological signals, looking for GO term over-representation in
the genes that they affect. We used the ordered GO profiling
method [27] to find significantly enriched GO categories for 30
genes most affected by each factor. Recent results [28] show that
related linear Gaussian models find biologically relevant factors in
the yeast expression dataset. We replicated these findings with our
model, yielding factors enriched in biological functions, including
sugar, alcohol and amino acid metabolic processes. Similar
analysis in human and mouse did not show significant over-
representation of GO categories, providing no evidence that the
main axes of variation in the expression levels for these
experiments are due to common biological function. This could
be due to poor annotation of the genes, gene features not related to
biological function, or more technical sources of global variation,
such as cell culture conditions [12].
Discussion
We have presented VBQTL, a probabilistic model to dissect
gene expression variation in the context of genetic association
studies. The model is implemented in a Bayesian inference
framework that allows uncertainty to be propagated between
different parts of the model, and yields posterior distributions over
parameter estimates for more sensitive analysis. In comparative
eQTL mapping experiments, VBQTL outperformed alternative
methods for eQTL finding on simulated and real data. In the most
striking example, VBQTL found up to three times more eQTLs
than a standard method, and 45% more compared to the best
alternative in the HapMap 2 expression dataset.
Our approach advances the methodology for understanding
phenotypic variation. The implementation of a flexible framework
allows models for explaining the observed variability to be
straightforwardly combined. Notably, non-Bayesian models can
also be included, as we demonstrated with PCA, SVA, and linear
(a) Probes with a VBeQTL inpooled population
(b) Validation against probes with a standard eQTL in pooled population
(d) Replication with probes having VBeQTLs in YRI population
(e) Replication with probes havingVBeQTLs in CHB+JPT populations
(f) VBeQTL location and strength relative to gene start
(c) Standard cis eQTL location and strength relative to gene start
VBQTLCEU
(1051)
Standardpooled
populations(1045)
1643
661346
1
VBQTLpooled
populations(2696)
1322
367
Standardpooled
populations(1045)
VBQTLCEU
(1051)
StandardCEU(382)
9
375348
817
314372
321
270
11 695
365672VBQTL
CEU(1051)
StandardCEU(382)
VBQTLYRI
(1269)
VBQTLCEU
(1051)
StandardCEU(382)
VBQTLCHB+JPT
(1444)
419
29867
10
720267
7
Figure 6. Validation of VBeQTLs by comparison to standard eQTLs. (a,b,d,e) Venn diagrams depicting overlap of probes with a standardeQTL or VBeQTL in the CEU population and probes with an eQTL in other populations. (c,f) Standard and VBeQTL location and strength relative to thetranscription start site.doi:10.1371/journal.pcbi.1000770.g006
Bayesian Framework for Phenotypic Variability
PLoS Computational Biology | www.ploscompbiol.org 9 May 2010 | Volume 6 | Issue 5 | e1000770
regression models. VBQTL controls the model complexity at the
level of all individual components of expression variability, thereby
preventing from over- and underfitting. Our experimental results
on simulation and real data showed how explaining away too
much variability removes some signal of interest from the data,
and failing to account for all sources of confounding variation
decreases power to detect the relevant signal. When the variable of
interest is correlated with many gene expression levels, its effect
can be falsely explained away by the hidden factor model. We
showed that in such settings the choice of an iterative schedule
helps to ensure that variability is explained by the appropriate part
of the model. There can be no silver bullet solution that provides
perfect results in any scenario with no supervision. Instead,
modelling assumptions must be made explicit, and incorporated in
the analysis, as is elegantly done in the Bayesian setting.
VBQTL and other methods that account for hidden factors all
found additional expression QTLs in the datasets studied
compared to the standard method. It is remarkable that, with
only 270 samples, and looking in one tissue type, we can find
significant genetic associations to 27% of the expressed genes.
While similar results have been reported before, we have shown a
threefold increase in the number of associations for the HapMap
dataset, and analysed their repeatability and location distribution.
The replication of the additional associations in different
populations suggests that they are genuine. The increase in power
is due to the hidden factor model, which explains away unwanted
non-genetic variability, thereby allowing the genetic effects to
stand out to a greater extent. The high number of additional
associations suggests that association finding studies in human
have not saturated, and we expect the fraction of genes with an
eQTL will increase further as the number of samples grows. It
may be that the expression of majority of human genes varies as a
result of segregating genetic variation. While previous studies have
reported only 12% of heritable variation to be due to cis variants
[29], this does not contradict the presence of weak cis eQTLs for a
large fraction of the genes.
In conclusion, we believe that VBQTL provides a principled
and accurate way to study gene expression and other high-
dimensional data. Increasingly complex models combining genetic
and other effects can explain significantly more of the variance in
observed phenotypes, as suggested by this study and others. Our
general framework provides the flexibility to facilitate these richer
models, for example, we have already started exploring interaction
effects as an additional model of the framework. It will be
interesting to see how these approaches can contribute to our
understanding of human disease genetics, potentially involving
intermediate phenotypes such as gene expression and other
factors.
The software used in this study is freely available online at
http://www.sanger.ac.uk/resources/software/peer/.
Supporting Information
Text S1 Supplementary methods.
Found at: doi:10.1371/journal.pcbi.1000770.s001 (0.23 MB PDF)
Text S2 Supplementary results.
Found at: doi:10.1371/journal.pcbi.1000770.s002 (0.86 MB PDF)
Figure S1 Sensitivity of recovering simulated eQTLs for
alternative eQTL models. (a–b) Using a standard model for
expression values, performing 2-tailed t tests on the statistic based
on correlation coefficient between expression level and genotype.
(c–d) Similar test for ranks of expression values. (e–f) Permutation
test with 1000 permutations and 0.1% FPR. Bonferroni correction
to 0.1% false positive rate was used for (a–d) to correct for multiple
testing as detailed in Text S1.
Found at: doi:10.1371/journal.pcbi.1000770.s003 (0.30 MB PDF)
Figure S2 Sensitivity of recovering human eQTLs for alterna-
tive eQTL models. (a–b) Using a standard nested model for
expression values, performing chi-squared tests with one degree of
freedom on the log likelihood ratio for adding the genetic
association term to the model. (c–d) Using a standard nested
model for ranks of expression values, performing t tests with N-2
degrees of freedom as described in Supplementary Methods.
Bonferroni correction to 1% false positive rate was used for both
methods to correct for multiple testing as detailed in Text S1.
Found at: doi:10.1371/journal.pcbi.1000770.s004 (0.23 MB PDF)
Figure S3 Sensitivity of recovering yeast eQTLs for alternative
eQTL models. (a–b) Using a standard model for expression values,
performing 2-tailed t tests on the statistic based on correlation
coefficient between expression level and genotype. (c–d) Similar
test for ranks of expression values. Bonferroni correction to 0.1%
false positive rate was used for both methods to correct for multiple
testing as detailed in Text S1.
Found at: doi:10.1371/journal.pcbi.1000770.s005 (0.26 MB PDF)
Figure S4 Sensitivity of recovering mouse eQTLs for alternative
eQTL models. (a–b) Using a standard model for expression values,
performing 2-tailed t tests on the statistic based on correlation
coefficient between expression level and genotype. (c–d) Similar
test for ranks of expression values. Bonferroni correction to 0.1%
false positive rate was used for both methods to correct for multiple
testing as detailed in Text S1.
Found at: doi:10.1371/journal.pcbi.1000770.s006 (0.25 MB PDF)
Table S1 Number of probes with a cis association for individual
chromosomes and per-probe false discovery rate for the consid-
ered populations (per-probe FPR = 0.100%, Bonferroni corrected
for testing multiple SNPs per probe, 2-tailed t test) on raw
expression data (Standard) and after accounting for hidden factors
(fVBQTL).
Found at: doi:10.1371/journal.pcbi.1000770.s007 (0.02 MB PDF)
Table S2 Magnitude and fraction of overlap between probes
with a Standard of fVBQTL cis eQTL respectively, for different
populations and methods. Total numbers for each population and
method are given in parenthesis after the population. 955 probes
had a standard eQTL in some population, and 148 in every
population. 2236 probes had a fVBQTL eQTL in some
population, and 477 in every population.
Found at: doi:10.1371/journal.pcbi.1000770.s008 (0.02 MB PDF)
Table S3 Overlap of VBQTLs in one population (2.) with
standard eQTLs found when pooling the other two populations
(3.). Overlaps are given both for all QTLs (2. & 3.) and only for
additional ones (2. - 1. & 3. - 1.) compared to standard eQTLs in
the population. Per-probe eQTL FPR = 0.1%, Bonferroni cor-
rected for testing multiple SNPs per probe, 2-tailed t test.
Found at: doi:10.1371/journal.pcbi.1000770.s009 (0.01 MB PDF)
Table S4 Pearson correlation coefficient between top 6 factors
learned on the pooled HapMap data, and 4 indicator variables
relating to the background of the individual. Correlations with
absolute value above 0.6 are highlighted.
Found at: doi:10.1371/journal.pcbi.1000770.s010 (0.01 MB PDF)
Table S5 Summary statistics for method performances on the
human chromosome 19 dataset presented in the main text. The
parameters for different methods are varied by the number of
allowed factors K (PCA, VBQTL) or by the significance cutoff a
Bayesian Framework for Phenotypic Variability
PLoS Computational Biology | www.ploscompbiol.org 10 May 2010 | Volume 6 | Issue 5 | e1000770
(PCAsig, SVA). Hidden factor summary is given by the number of
factors found and the variance explained by the hidden factor
effects. The number of probes with a cis and trans eQTL, as well as
the sensitivity and specificity of recovering probes with a standard
eQTL are given. Per-probe eQTL FPR = 0.001, Bonferroni
corrected for testing multiple SNPs per probe, 2-tailed t test.
Found at: doi:10.1371/journal.pcbi.1000770.s011 (0.02 MB PDF)
Table S6 Summary statistics for method performances on the
yeast dataset presented in the main text. The parameters for
different methods are varied by the number of allowed factors K
(PCA, VBQTL) or by the significance cutoff a (PCAsig, SVA).
Hidden factor summary is given by the number of factors found
and the variance explained by the hidden factor effects. The
number of probes with a cis and trans eQTL, as well as the
sensitivity and specificity of recovering probes with a standard
eQTL are given. Per-probe eQTL FPR = 0.001, Bonferroni
corrected for testing multiple SNPs per probe, 2-tailed t test.
Found at: doi:10.1371/journal.pcbi.1000770.s012 (0.02 MB PDF)
Table S7 Summary statistics for method performances on the
mouse dataset presented in the main text. The parameters for
different methods are varied by the number of allowed factors K
(PCA, VBQTL) or by the significance cutoff a (PCAsig, SVA).
Hidden factor summary is given by the number of factors found
and the variance explained by the hidden factor effects. The
number of probes with a cis and trans eQTL, as well as the
sensitivity and specificity of recovering probes with a standard
eQTL are given. Per-probe eQTL FPR = 0.001, Bonferroni
corrected for testing multiple SNPs per probe, 2-tailed t test.
Found at: doi:10.1371/journal.pcbi.1000770.s013 (0.02 MB PDF)
Acknowledgments
The authors would like to thank Manolis Dermitzakis for helpful
discussions and feedback, Rachel Brem, Eric Schadt and Barbara Stranger
for access to gene expression and genotype data, Claude Beasley for
assistance, Richard Bourgon for advice, and Alexandra Nica and members
of the Durbin group for comments on the manuscript.
Author Contributions
Conceived and designed the experiments: OS LP RD JW. Performed the
experiments: OS LP. Analyzed the data: OS LP. Wrote the paper: OS LP
RD JW. Developed methodology: OS LP RD JW.
References
1. Brem RB, Yvert G, Clinton R, Kruglyak L (2002) Genetic dissection of
transcriptional regulation in budding yeast. Science 296: 752–755.2. Brem RB, Kruglyak L (2005) The landscape of genetic complexity across 5,700
gene expression traits in yeast. Proc Natl Acad Sci 102: 1572–7.3. Schadt EE, Lamb J, Yang X, Zhu J, Edwards S, et al. (2005) An integrative
genomics approach to infer causal associations between gene expression and
disease. Nature genetics 37: 710–7.4. Stranger BEE, Nica ACC, Forrest MSS, Dimas A, Bird CPP, et al. (2007)
Population genomics of human gene expression. Nature genetics 39: 1217.5. Spielman RSS, Bastone LAA, Burdick JTT, Morley M, Ewens WJJ, et al. (2007)
Common genetic variants account for differences in gene expression among
ethnic groups. Nature genetics 200: 7.6. Chen Y, Zhu J, Lum PY, Yang X, Pinto S, et al. (2008) Variations in DNA
elucidate molecular networks that cause disease. Nature 452: 429.7. Emilsson V, Thorleifsson G, Zhang B, Leonardson AS, Zink F, et al. (2008)
Genetics of gene expression and its effect on disease. Nature 452: 423–428.8. Gibson G (2008) The environmental contribution to gene expression profiles.
Nature Reviews Genetics 9: 575–581.
9. Leek JT, Storey JD (2007) Capturing heterogeneity in gene expression studies bysurrogate variable analysis. PLoS Genetics 3: e161.
10. Plagnol V, Uz E, Wallace C, Stevens H, Clayton D, et al. (2008) Extremeclonality in lymphoblastoid cell lines with implications for allele specific
expression analyses. PLoS ONE 3.
11. Balding D, Bishop M, Cannings (2003) Handbook of Statistical Genetics. N.Y.:Wiley J. and Sons Ltd., second edition.
12. Pastinen T, Ge B, Hudson TJ (2006) Influence of human genome polymorphismon gene expression. Hum Mol Genet 15: R9.
13. Stegle O, Kannan A, Durbin R, Winn J (2008) Accounting for non-geneticfactors improves the power of eQTL studies. In: Research in Computational
Molecular Biology Springer. pp 411–422.
14. Kang HM, Ye C, Eskin E (2008) Accurate discovery of expression quantitativetrait loci under confounding from spurious and genuine regulatory hotspots.
Genetics 180: 1909–1925.15. Lander E, Botstein D (1989) Mapping mendelian factors underlying quantitative
traits using RFLP linkage maps. Genetics 121: 185–199.
16. Rattray M, Liu X, Sanguinetti G, Milo M, Lawrence ND (2006) Propagating
uncertainty in microarray data analysis. Briefings in Bioinformatics 7: 37–47.
17. MacKay DJC (2003) Information theory, inference and learning algorithms
Cambridge University Press.
18. Jordan M, Ghahramani Z, Jaakkola T, Saul L (1999) An introduction to
variational methods for graphical models. Machine Learning 37: 183–233.
19. Mackay DJC (1995) Probable networks and plausible predictions - a review of
practical Bayesian methods for supervised neural networks. Network: Compu-
tation in Neural Systems 6: 469–505.
20. Neal RM (1996) Bayesian Learning for Neural Networks Springer.
21. Winn J, Bishop C (2006) Variational Message Passing. Journal of Machine
Learning Research 6: 661.
22. The International HapMap Consortium (2005) A haplotype map of the human
genome. Nature 437: 1299–1320.
23. Barrett T, Troup DB, Wilhite SE, Ledoux P, Rudnev D, et al. (2007) NCBI
GEO: mining tens of millions of expression profiles–database and tools update.
Nucleic acids research 35: D760.
24. Stranger B, Forrest M, Dunning M, Ingle C, Beazley C, et al. (2007) Relative
impact of nucleotide and copy number variation on gene expression phenotypes.
Science 315: 848–853.
25. Williams RB, Chan EK, Cowley MJ, Little PF (2007) The influence of genetic
variation on gene expression. Genome Res 17: 1707–1716.
26. Smith EN, Kruglyak L (2008) Gene-environment interaction in yeast gene
expression. PLoS Biology 6: e83+.
27. Reimand J, Kull M, Peterson H, Hansen J, Vilo J (2007) g:Profiler–a web-based
toolset for functional profiling of gene lists from large-scale experiments. Nucleic
acids research 35.
28. Biswas S, Storey JD, Akey JM (2008) Mapping gene expression quantitative trait
loci by singular value decomposition and independent component analysis.
BMC Bioinformatics 9: 244.
29. Price AL, Patterson N, Hancks DC, Myers S, Reich D, et al. (2008) Effects of cis
and trans genetic ancestry on gene expression in african americans. PLoS
Genetics 4: e1000294+.
Bayesian Framework for Phenotypic Variability
PLoS Computational Biology | www.ploscompbiol.org 11 May 2010 | Volume 6 | Issue 5 | e1000770