Embed Size (px)
Citation preview

Camborne School of Mines
University of Exeter, Cornwall Campus, UKwww.ex.ac.uk/cornwall/csm
A BEHAVIOURAL-BASED APPROACH TO IMPROVING SAFETY PERFORMANCE
IN THE MINERALS INDUSTRY
Presentation to the Atlantic Alliance Occupational Health & Safety Conference 2007
ANAM PARAND

AIMS
• Background of:
UK Quarrying Industry
• Overview of:
Current Study (BSQ)
Behavioural Safety
KPI Figures
-what is it? -why use it? -does it work?
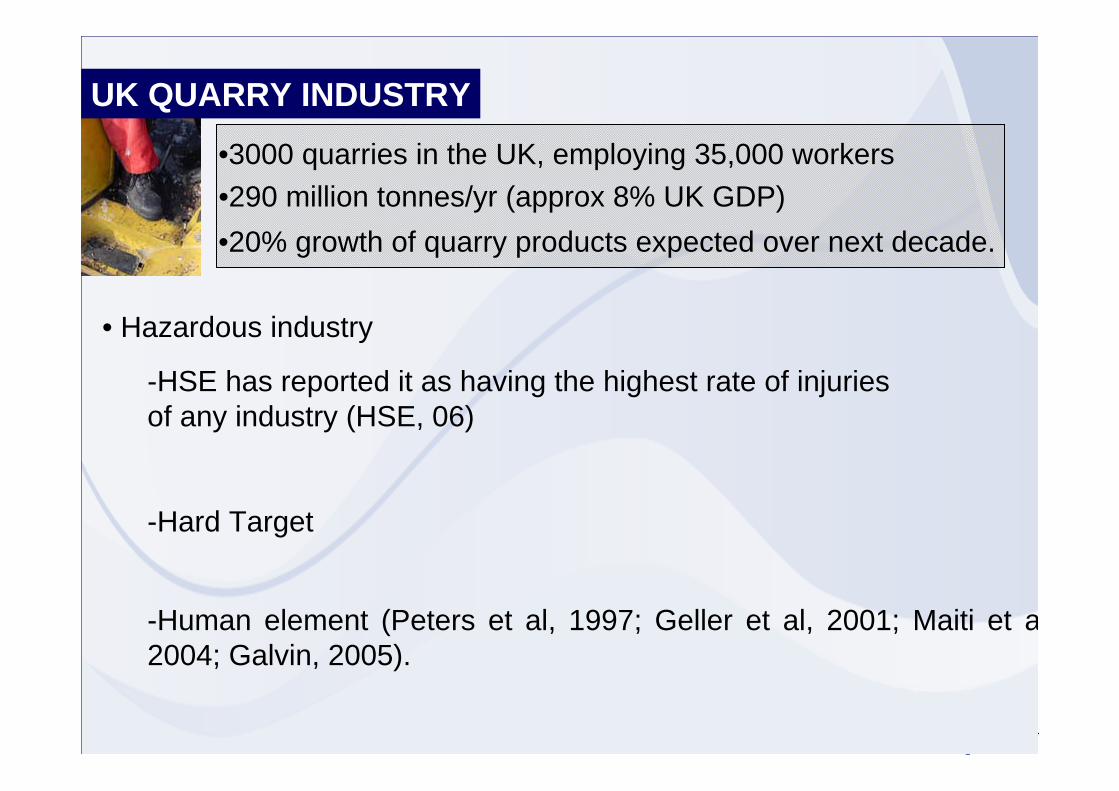
•3000 quarries in the UK, employing 35,000 workers•290 million tonnes/yr (approx 8% UK GDP)•20% growth of quarry products expected over next decade.
• Hazardous industry
UK QUARRY INDUSTRY
-HSE has reported it as having the highest rate of injuries of any industry (HSE, 06)
-Hard Target
-Human element (Peters et al, 1997; Geller et al, 2001; Maiti et a2004; Galvin, 2005).

WHY FOCUS ON BEHAVIOUR?
Behaviours96%
Conditions 4%
1 Major Injury
29Minor Injuries
300Unsafe Acts
Figure 2 Heinrich’s (1931) Accident Pyramid
• Most common injuries across quarry and mining sites:
• manual handling
• transport
• falls from height
• slips & trips
Figure 1 Pie Chart of Percentage of Behaviours & Conditions Attributed to Workplace Accidents
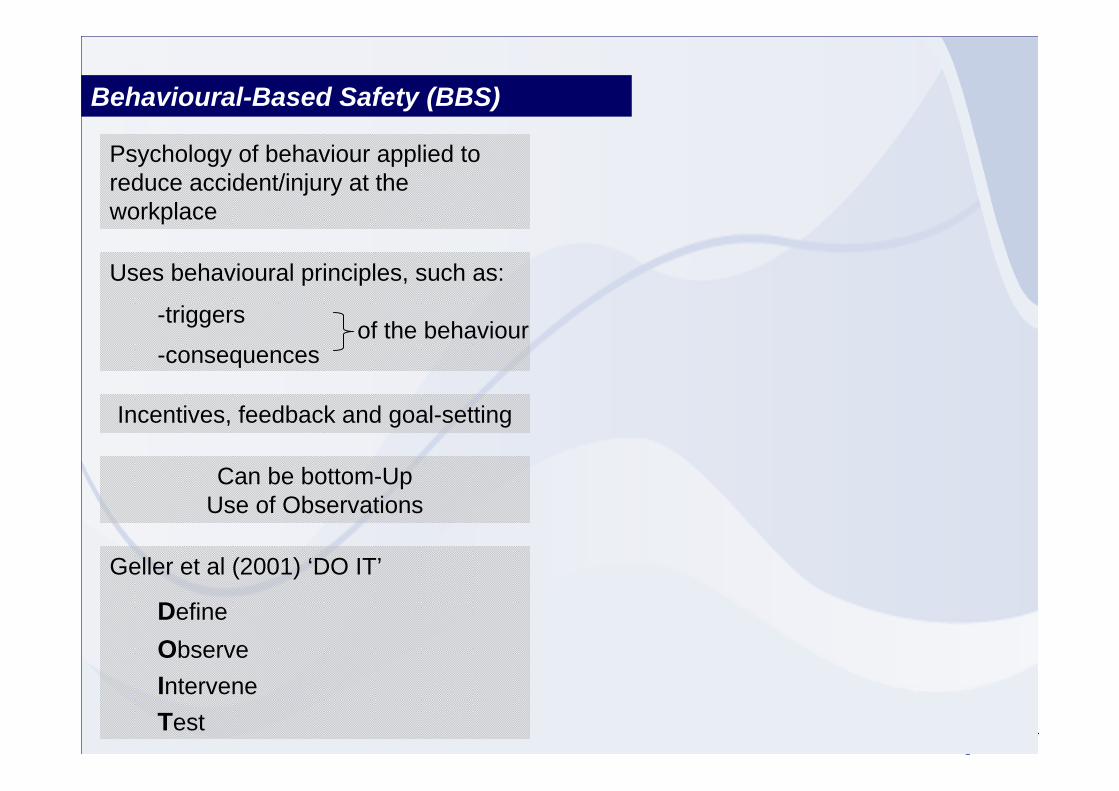
Uses behavioural principles, such as:
-triggers
-consequences
Behavioural-Based Safety (BBS)
Psychology of behaviour applied to reduce accident/injury at the workplace
Geller et al (2001) ‘DO IT’
Define ObserveIntervene Test
Can be bottom-UpUse of Observations
Incentives, feedback and goal-setting
of the behaviour

Success of BBS Across Industries•McAfee and Winn (1989) - commercial organisations
•Guastello (1993) - “behavior modification techniques are potentially useful in many industries”.
•Krause et al (1999) - 73 BBS applications; paper, petroleum, chemical, and food
BBS Applied Research in the Minerals Industry
-Fox et al (1987) -Rhoton (1980)
- Hickman and Geller (2003)
-Talbot et al (1996); Schutte (1998);
-Simpson et al (1993)
•US Mines
•US Quarry
-Laurence (2005); Pitzer (2005)
•S.Africa Mines
•Australia Mines
•UK Mines
DOES IT WORK IN PRACTICE?

The Unique Work Environment of the Quarry
•Small workforce; many lone workers.
•Lack of evaluative research of BBS with lone workers (Olson and Austin, 2001)
•Peer-reporting often described as vital to the BBS system (Krause, 2002)
•Self-observations.
Support:
-SSM approach.
-Findings of self-monitoring improving safety performance as part of a BBS measure (Olson and Austin, 2001).
-Endorsement from behavioural safety experts (Krause, 1997; McSween, 2003).
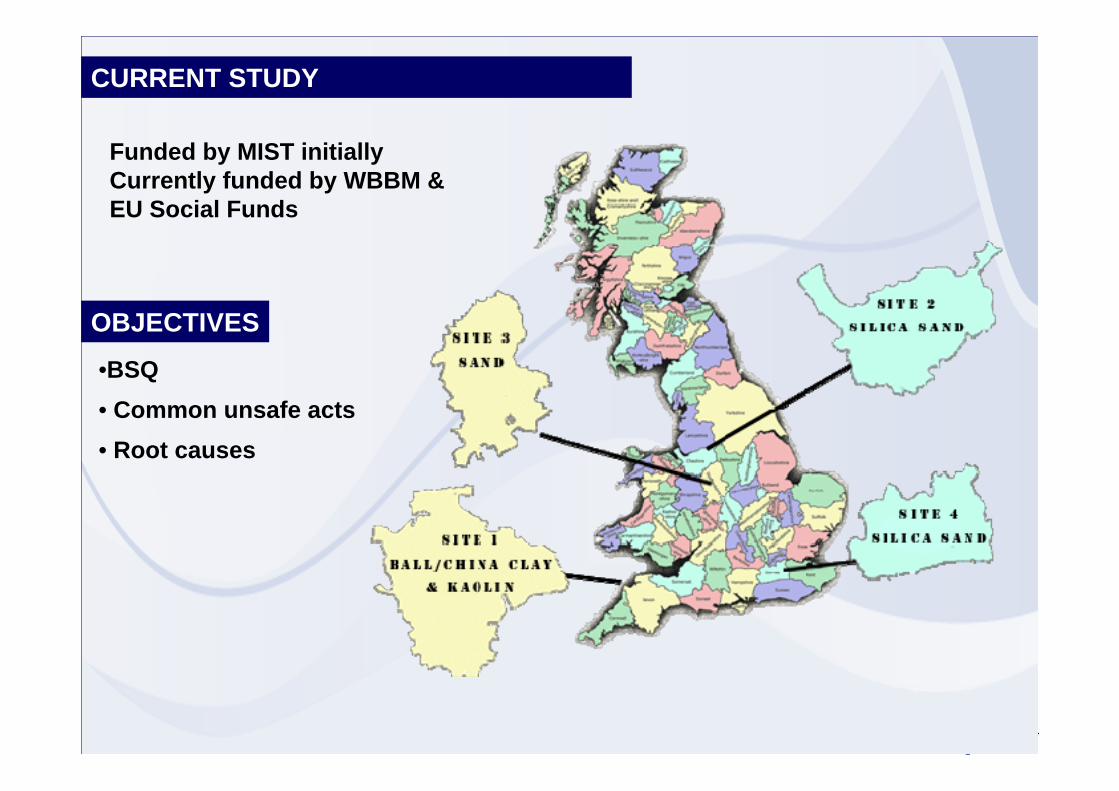
•BSQ• Common unsafe acts• Root causes
OBJECTIVES
Funded by MIST initiallyCurrently funded by WBBM & EU Social Funds
CURRENT STUDY

Phases of the BSQ Programme

KPI: Behavioural Safety Index
Figure 1. BSI % During Base-line & Follow-up
70%
75%
80%
85%
90%
95%
1 2 3 4 1 2 3 4
Baseline Period Follow-Up PeriodWeeks
BSI
(%) Site 1
Site 2
•One month pre & post measure•BSI started to increase from the beginning of the baseline
•Hawthorne Effect
•social desirability bias
•Alvero and Austin’s (2004)
•Good percentage of involvement
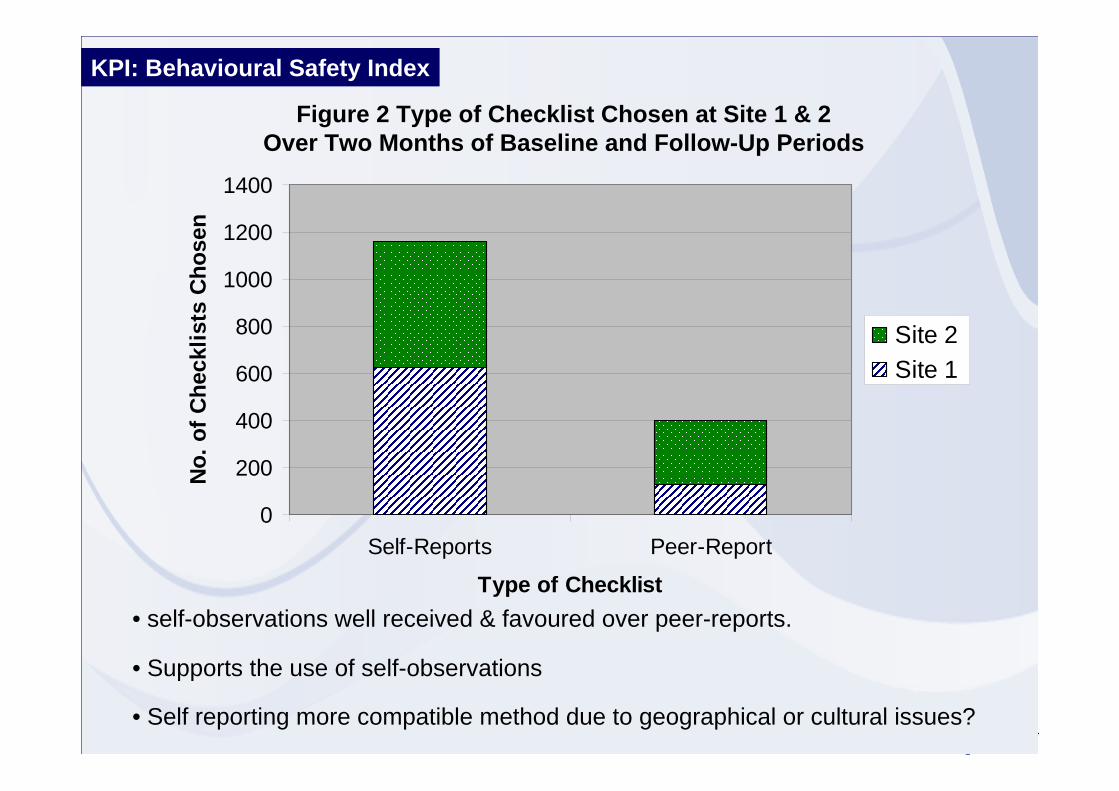
• self-observations well received & favoured over peer-reports.
KPI: Behavioural Safety Index
0
200
400
600
800
1000
1200
1400
Self-Reports Peer-Report
Type of Checklist
No.
of C
heck
lists
Cho
sen
Site 2 Site 1
• Supports the use of self-observations
• Self reporting more compatible method due to geographical or cultural issues?
Figure 2 Type of Checklist Chosen at Site 1 & 2 Over Two Months of Baseline and Follow-Up Periods

KPI: Behavioural Safety Index
50%55%60%65%70%75%80%85%90%95%
100%
Self-Reports Peer-Report
Type of Checklist
BSI
(%)
Site 1Site 2
50%55%60%65%70%75%80%85%90%95%
100%
Self-Reports Peer-Report
Type of Checklist
BSI
(%)
•Fig 3 self-reports have assessed a higher no. of safe acts compared with peer-reports.•Attributable to:
-lack of self-awareness of own at-risk behaviours-dishonesty in self-reports (self-serving/social-desirability bias) •good level of honesty (14% at-risk acts)
Figure 3: BSI by Checklist (BASELINE) Figure 4: BSI by Checklist (FOLLOW UP)
•However, Fig 4 Peer-reports have assessed a higher no. of safe acts compared with self-reports.
•double-sided query on the levels of honesty of the self and peer reports.
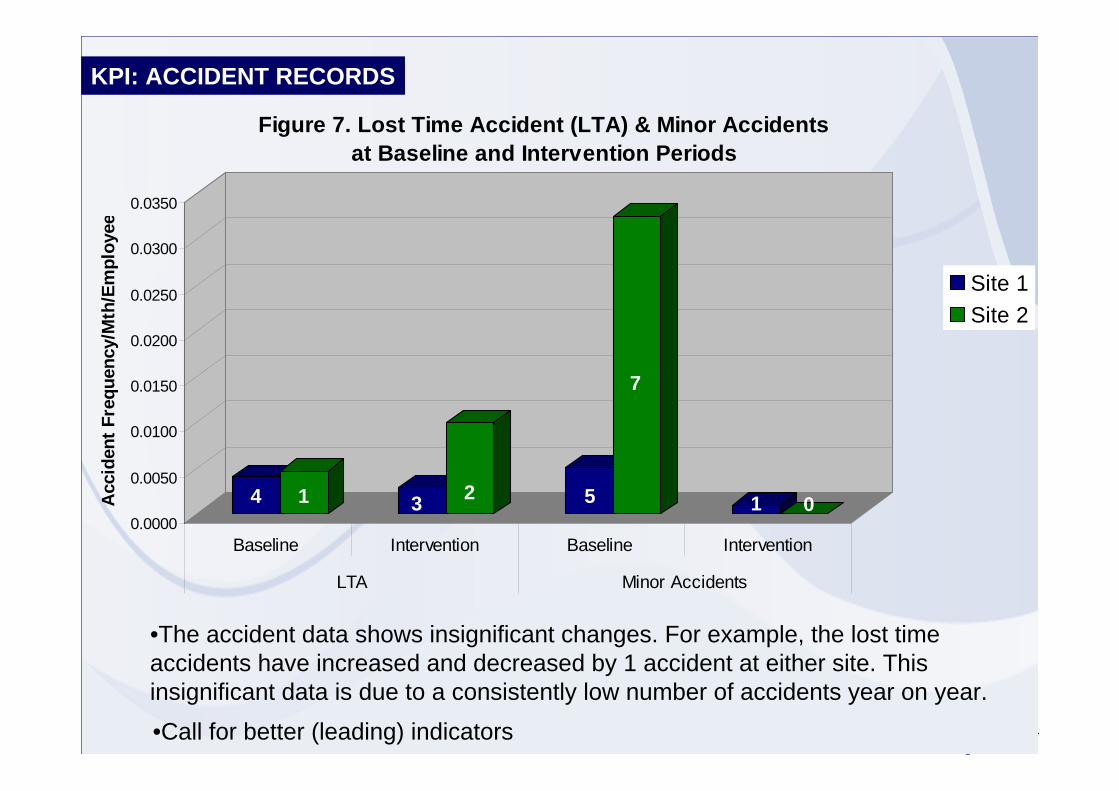
KPI: ACCIDENT RECORDS
0.0000
0.0050
0.0100
0.0150
0.0200
0.0250
0.0300
0.0350
Acc
iden
t Fre
quen
cy/M
th/E
mpl
oyee
Baseline Intervention Baseline Intervention
LTA Minor Accidents
Figure 7. Lost Time Accident (LTA) & Minor Accidents at Baseline and Intervention Periods
Site 1Site 2
4 31 2 5
7
1 0
•The accident data shows insignificant changes. For example, the lost time accidents have increased and decreased by 1 accident at either site. This insignificant data is due to a consistently low number of accidents year on year.•Call for better (leading) indicators
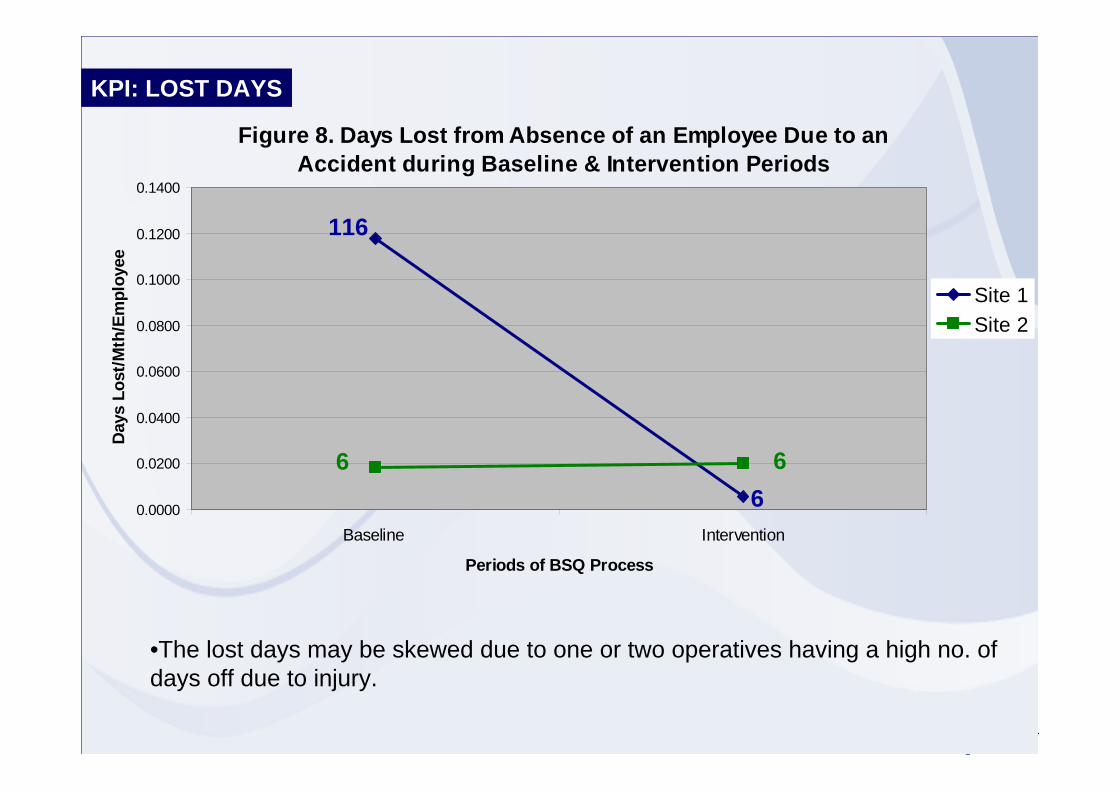
KPI: LOST DAYS
Figure 8. Days Lost from Absence of an Employee Due to an Accident during Baseline & Intervention Periods
0.0000
0.0200
0.0400
0.0600
0.0800
0.1000
0.1200
0.1400
Baseline Intervention
Periods of BSQ Process
Day
s Lo
st/M
th/E
mpl
oyee
Site 1Site 2
116
666
•The lost days may be skewed due to one or two operatives having a high no. of days off due to injury.
•Nevertheless, the tangible data indicates that at both sites:
-No. of key unsafe acts has decreased (increase in BSI % between baseline and intervention periods)
-There has been a decrease in minor accidents-There has been a decrease or no change of days lost due to injury.
•Workable method for industry
•Encouraging implications for self reporting safety behaviours -worker buy-in of the self-report-the increase in BSI (led by a majority of self-reports); -substantial no. of at-risk behaviours reported in the self-report checklists.
•Accuracy of self report?
•“self-monitoring alone lacks the accuracy and credibility of a more objective observational system” (Hickman and Geller, 2003)
•Combination of peer and self-reporting
•Further measures of evaluation, including leading indicators
CONCLUSION