Embed Size (px)
Citation preview
International Journal of Engineering Business Management
A Behavioural Model of E-Banking Usage in Italy Regular Paper
Guendalina Capece1,* and Domenico Campisi1
1 University of Rome “Tor Vergata”, Department of Enterprise Engineering, Rome, Italy * Corresponding author E-mail: [email protected] Received 5 April 2013; Accepted 30 April 2013 DOI: 10.5772/56606 © 2013 Capece and Capisi; licensee InTech. This is an open access article distributed under the terms of the Creative Commons Attribution License (http://creativecommons.org/licenses/by/3.0), which permits unrestricted use, distribution, and reproduction in any medium, provided the original work is properly cited.
Abstract E‐banking is defined as the automated delivery of new and traditional banking products and services directly to customers through electronic, interactive communication channels. “Pure online” banks are characterized by the absence of physical windows and front‐office personnel. Traditional banks are still integrating traditional distribution channels with online ones; the scenario is therefore still evolving over time. Despite the intrinsic potentialities, Italy is far from being a leader in the usage of innovative online instruments in the banking system and will struggle with new innovation waves. In this paper, we measure the potential effective e‐banking usage. Furthermore, we investigate the behaviour of users and adopters, identifying the major causes influencing satisfaction and usage and the impact of these different causes on the intensity of utilization. The analysis is based on a panel of 495 real users, thus allowing the profiling of the Italian adopter to discover the causes of usage and outline strategies for the growth of e‐banking services in Italy. Keywords E‐Banking Usage, Behavioural Model, Satisfaction
1. Introduction
The financial and economic crisis, which began in 2008, permeating throughout the production and service sectors, influencing business performances (e.g. [1,2]), pushed companies to develop new and innovative customer‐oriented services in order to maintain competitiveness against competitors. In this paper we analyse the available pure and hybrid e‐banking services in Italy and examine the role of passive and proactive users. Recent research efforts have continuously suggested that efficiency increases with the level of e‐banking usage. With reference to different countries in Europe, efficiency augments the overall capacity of users to adapt to new technologies or ways of doing business by improving personal ability to draw new results from traditional channels [3‐7]. Even though e‐banking is a predominantly goal‐directed service, the computer‐mediated channel provides wider possibilities for hedonic perceptions and behaviours [8,9]. The interactive nature of online channels opens new possibilities for exploratory behaviour, traditionally linked to intrinsic motivation [10‐14]. The literature refers to the Internet as a channel that simultaneously provides recreational and utilitarian features [15‐18]. However,
Guendalina Capece and Domenico Campisi: A Behavioural Model of E-Banking Usage in Italy 1www.intechopen.com
ARTICLE
www.intechopen.com Int. j. eng. bus. manag., 2013, Vol. 5, 16:2013
despite the evidence that online banking provides many advantages, such as faster transaction speed and lower handling fees [19], there are still a large group of customers who are reluctant to adopt such services [20,21]. Understanding the reasons for this resistance would be useful for bank managers in formulating strategies aimed at increasing online banking usage. The challenge of this work is therefore to prove the existence of the flow construct (also called cognitive absorption or playfulness) as representative of the hedonic component at a typical goal‐directed service such as internet banking. In our study the basic assumption is that banking consumers have to be proactive in detecting relevant trends and early signals provided by the environment within which the organization operates. We measure the potential e‐banking usage by means its effective usage. Then, we investigate the behaviour of users, identifying the major causes influencing real adopters’ satisfaction and usage and the impact of these causes on the intensity of use. The analysis is based on a panel of 495 real online clients, allowing the profiling of the Italian adopter to discover the causes of factual usage and outline strategies for the growth of e‐banking services in this country. Although several research projects have focused on the factors that impact on the adoption of Information and Communication Technologies (ICTs) or Internet over the past decade [22‐29], there is limited empirical work which captures the success factors or positive factors of online banking to help form a strategic agenda. In this study, we explore and integrate the advantages of online banking to develop a predictor named “satisfaction” to explain and predict customer intention to adopt online banking. Our research may give practitioners an increased understanding of customers’ risk perceptions which can then be used to develop strategies and trust‐building mechanisms [30‐34] to encourage online trading adoption. Indeed, in order to gain and maintain the long lasting trust of their customers, companies have to adopt a socially responsible behaviour aligning their conduct to consumer values and beliefs [35,36]. In particular, in the banking sector customers are more sensible to trust issues [37]. The main purposes of this study are twofold: The first aim is to investigate whether satisfaction significantly impacts customers’ behavioural intention to use online banking. The second aim is to clarify which factors are more influential in affecting the decision to use online banking.
The paper is organized into six sections. In the next section we discuss the advantages of online banking. In Section 3 we provide the preliminaries and the background material for our study. Then, we focus the objective of our study, outlining a model of the e‐banking usage, and propose the related measurement framework. Reliability measures and construct validity measures are carried out. Finally, we present a short discussion of the implications of the research and consider possible future directions for research in the concluding section.
2. The advantages of online banking
Online banking has recently come to be considered as one of the most effective banking transaction methods [38] because it possesses many advantages which offline banking channels cannot offer. Online banking managers aim to utilize these advantages to increase the online banking adoption rate. Based to a certain extent on reasons offered by Lee [39], there are two main types of perceived benefits, which can be categorized as direct and indirect advantages. Direct advantages refer to immediate and tangible benefits that customers would enjoy by using online banking. For example, customers can benefit from series of services [40], as a wider range of financial benefits, faster transaction speed, and increased information transparency. First, this wider range of financial benefits includes the lower transaction handling fees, higher deposit rates, opportunities to win prizes and extra credit card bonus points. Second, the faster transaction speed obviously means that time can be saved since online banking does not need paper documents, the processing of which can give rise to errors and delays, and which also requires more personnel. Online banking automates this process by mediating transactions through websites and electronic data interchange, and can also reduce the need for customers to communicate with bank staff regarding transaction details because these can be obtained from a website. Third, during the transaction, online banking allows customers to monitor contractual performance at any time, or to confirm delivery automatically. In other words, more relevant information is immediately available and transparent to customers. Indirect advantages are those benefits that are more intangible and difficult to measure [41,42]. For example, online banking allows customer to perform banking transactions anywhere in the world and enjoy 24‐hour service, as well as offering customers more investment opportunities and services, such as stock quotations and news updates. The factors outlined above are the perceived benefits that will be considered in the preliminary model of online banking adoption [43].
Int. j. eng. bus. manag., 2013, Vol. 5, 16:20132 www.intechopen.com
3. A model of e‐banking usage
In this section we investigate the factors influencing the usage of e–banking services and measure both the satisfaction level of consumers and their level of usage. The starting point is based on recent studies on intrinsic motivation in online banking [44,45]. In particular, starting from a recent paper dealing with the role of intrinsic motivation in Portuguese Internet banking [46,47], we focus our interest on the satisfaction levels modelled both as constituent elements of the service (perceived quality and usage facility) and elements related to behavioural elements (intrinsic motivation) [48‐50]. The Theory of Planned Behaviour (TPB) has been proven successful in predicting and explaining human behaviour across various information technologies [49, 51‐53]. According to the TPB, a person’s actual behaviour in performing certain actions is directly influenced by his or her behavioural intention and, in turn, is jointly determined by his or her attitude, subjective norms and perceived behavioural controls towards the behaviour. Behavioural intention is a measure of the strength of one’s willingness to exert effort in certain behaviours. Attitude explains a person’s favourable or unfavourable assessment regarding the behaviour in question. A favourable or unfavourable attitude directly influences the strength of the behaviour and beliefs regarding the likely outcome. Notice that the three elements satisfaction, perceived quality and intrinsic motivation are strongly linked by the intrinsic interactive nature of the service. The perceived quality can be revealed through a number of components such as quality of services and information, comfort and trust in the instrument. In accordance with these aims, we formulate a series of research hypotheses (H) to be tested by means of our online technology acceptance model: H1: The quality level of the banking service and
information service has a positive impact on the satisfaction level.
H2: The perceived comfort perception has a positive impact on the satisfaction level.
H3: Trust in the e‐banking instruments positively influences the satisfaction level. Furthermore, if we believe that ease of use (user friendliness) has a positive impact on the level of service and client satisfaction, we can assume:
H4: The easier the e‐banking instruments usage is, the higher the satisfaction level.
H5: The easier the e‐banking utilization is perceived to be, the higher the quality of services and information.
H6: There exists a positive trade‐off between quality of services and information gathering. The net, thanks to its interactive nature, induces explorative behaviour in the e‐banking services. This
intrinsic motivation [54] easily induces the flow‐state (a pleasant activity produces a “friendly” usage of the web instrument and increases the user’s inclination to repeat the experience). Then, we can hypothesize the following:
H7: The intrinsic motivation to use e‐banking services is related to the flow [55,56].
H8: The flow perception is positively related to the level of interest. Furthermore, we wish to establish whether the satisfaction level is positively related to the flow and that the latter is influenced by the quality of service and information [56‐59]. Therefore, we presume that:
H9: A higher flow perception leads to a higher level of satisfaction.
H10: A higher quality of service and information has a positive impact on the flow state.
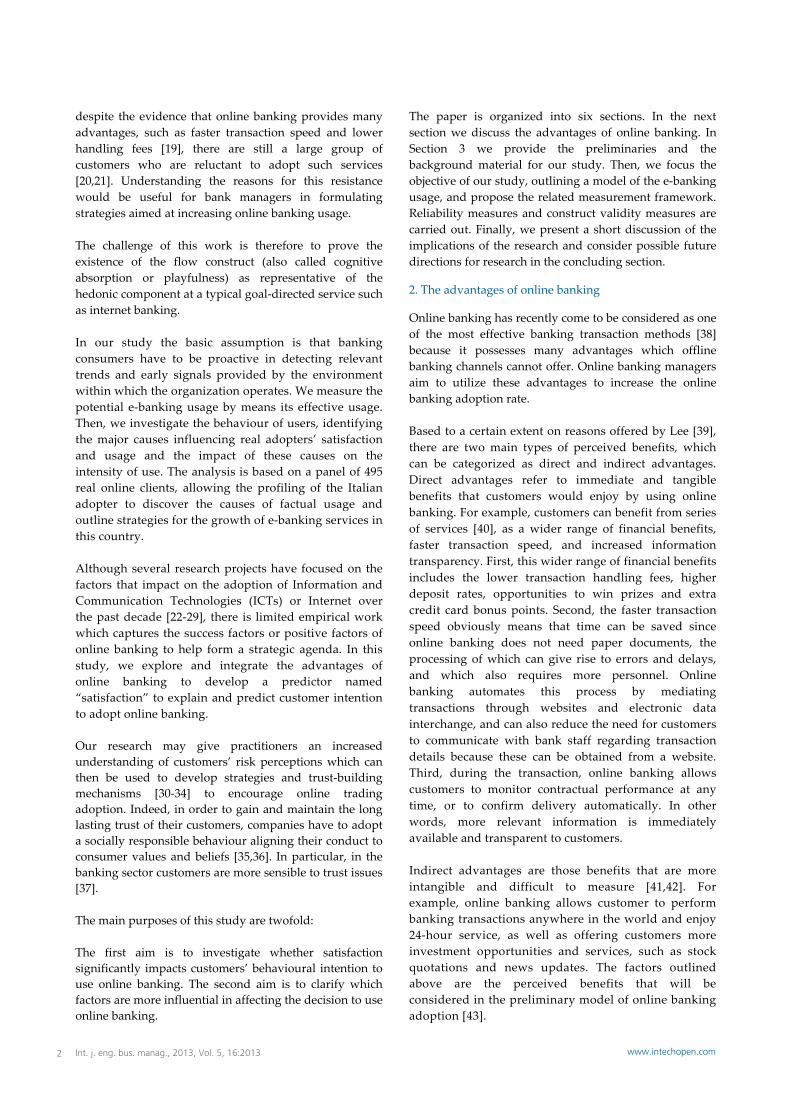
The proposed ten research hypotheses are linked by causality relationships modelled as illustrated in the flow chart design in Fig. 1.
Figure 1. Flow chart: the acceptance model and research hypotheses
Our research hypotheses aim to answer the following research questions: Does the perceived quality lead to client satisfaction (H1, H2, and H3)? Does the ease of use have a positive impact on the satisfaction level (H4) and on the quality of services and information (H5)? Does the quality of services and information have a positive impact on the level of attention (H6)? Does the intrinsic motivation, proper of users with explorative behaviours, lead to a higher level of involvement measured by the flow state (H7)? Does the flow perception have a positive impact on the level of attention (H8)? Are high flow levels positively related to the level of satisfaction in the use of the service (H9)? Does the quality of services and information have a positive impact on the flow state (H10)?
4. An application to the Italian case
The model depicted in Figure 1 was tested on a panel of 495 e‐banking users. The private bank helped to email invitation letters to its users with a message explaining
Guendalina Capece and Domenico Campisi: A Behavioural Model of E-Banking Usage in Italy 3www.intechopen.com
the need to understand their (the users’) experience in their initial adoption of online banking services. The invitation letter also linked to a website where users could fill out an online questionnaire. To encourage participation, incentives of the latest models of mobile phones and MP3 players were offered as lucky draw prizes. To reduce the possibility of a respondent participating in the survey more than once, each respondent was required to provide his/her mobile phone number in the survey. Later, duplicate mobile phone numbers were used to filter out multiple responses from the same respondent. Users were free to participate at their own discretion and the survey was in anonymous form. This online survey, which yielded 564 responses, was conducted over three months, with incomplete responses and missing values deleted, resulting in a sample size of 495 users with an overall response rate of 87%. The first part of the survey concerns basic information about respondents’ characteristics, including gender, age, education, occupation, and experience in using online banking. Sample demographics are depicted in Table 1. 65.5% percent of the respondents were male and the remaining 35.5% were female. The majority of respondents (77.3%) were over 30 years old. 21.8% of the respondents were pure online users, while 78.2% used a conventional bank with e‐banking services. Finally, 46.4% of respondents had graduated from high school and 53.6% had a university degree. The second part of the questionnaire was developed based on the constructs of our model. Each respondent was asked to provide answers to each question in the form of a response on a multi‐dimensional Likert scale from one to six. Likert scaling is a bipolar scaling method, measuring either positive or negative response to a statement. Level of agreement or disagreement is then measured. A pair‐point scale is used. This is a forced‐choice method since the middle option of “neither agree nor disagree” is not available. We wanted people to think before answering the questions and therefore we eliminated the “middle” response equivalent to “I don’t know”. The following interpretation of the numerical values was provided to the respondents: 1‐ Strongly disagree 2‐ Disagree 3‐ Slightly disagree 4‐ Slightly agree 5‐ Agree 6‐ Strongly agree. Before conducting the main survey, we performed a pre‐test to validate the instrument.
The pre‐test involved 15 respondents with more than three years experience using online banking. Respondents were asked to comment on the length of the instrument, the format, and the wording of the scales. Therefore, the instrument has confirmed content validity.
4.1 Data set
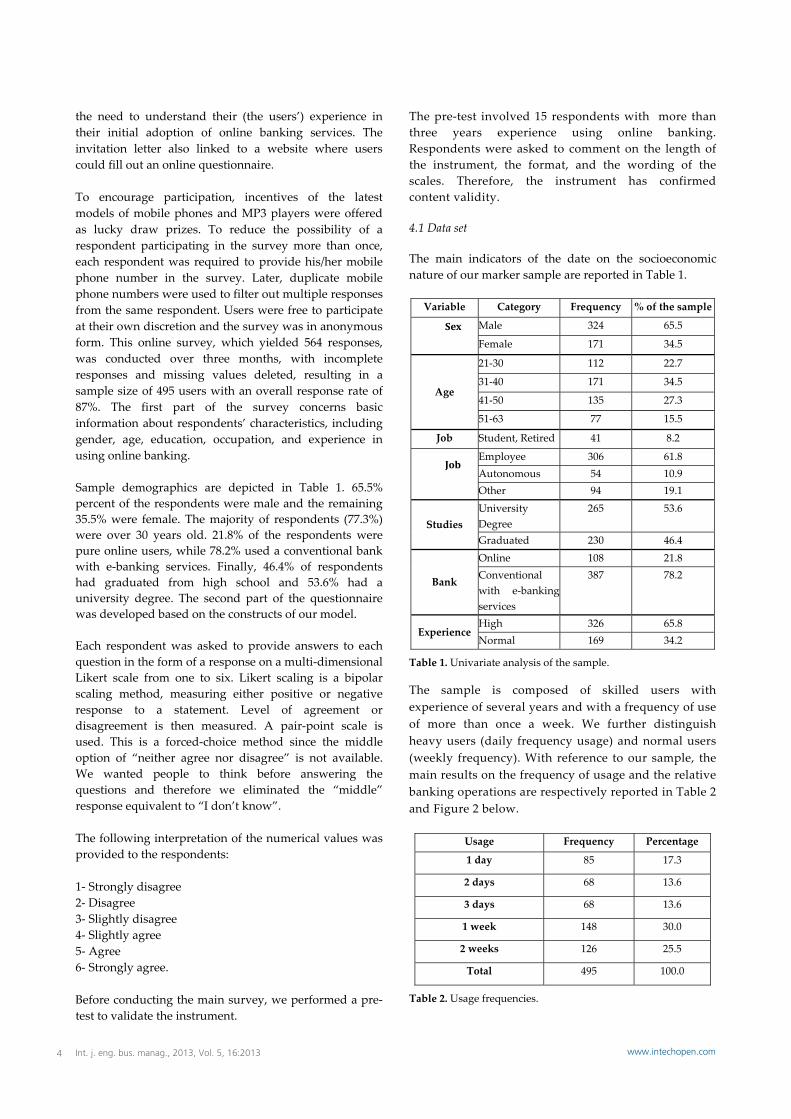
The main indicators of the date on the socioeconomic nature of our marker sample are reported in Table 1. Variable Category Frequency % of the sample
Sex Male 324 65.5
Female 171 34.5
Age
21‐30 112 22.7
31‐40 171 34.5
41‐50 135 27.3
51‐63 77 15.5
Job Student, Retired 41 8.2
JobEmployee 306 61.8 Autonomous 54 10.9 Other 94 19.1
Studies University Degree
265 53.6
Graduated 230 46.4
Bank
Online 108 21.8 Conventional with e‐banking services
387 78.2
Experience High 326 65.8 Normal 169 34.2
Table 1. Univariate analysis of the sample.
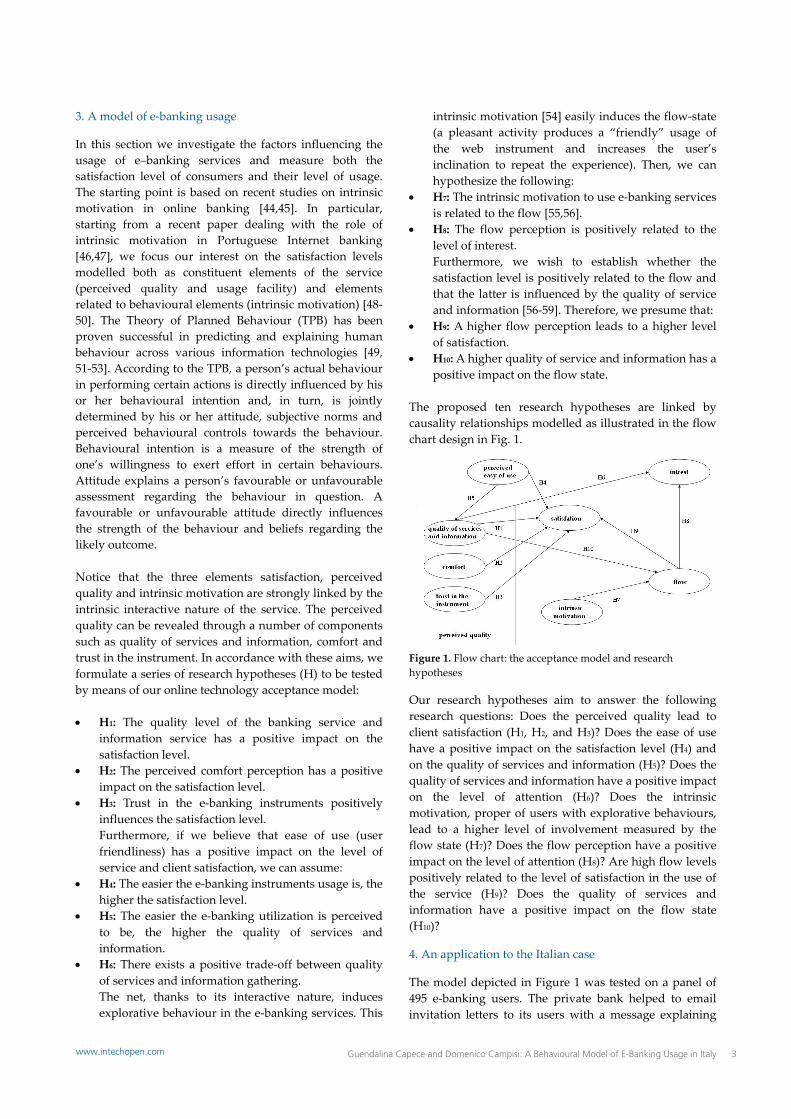
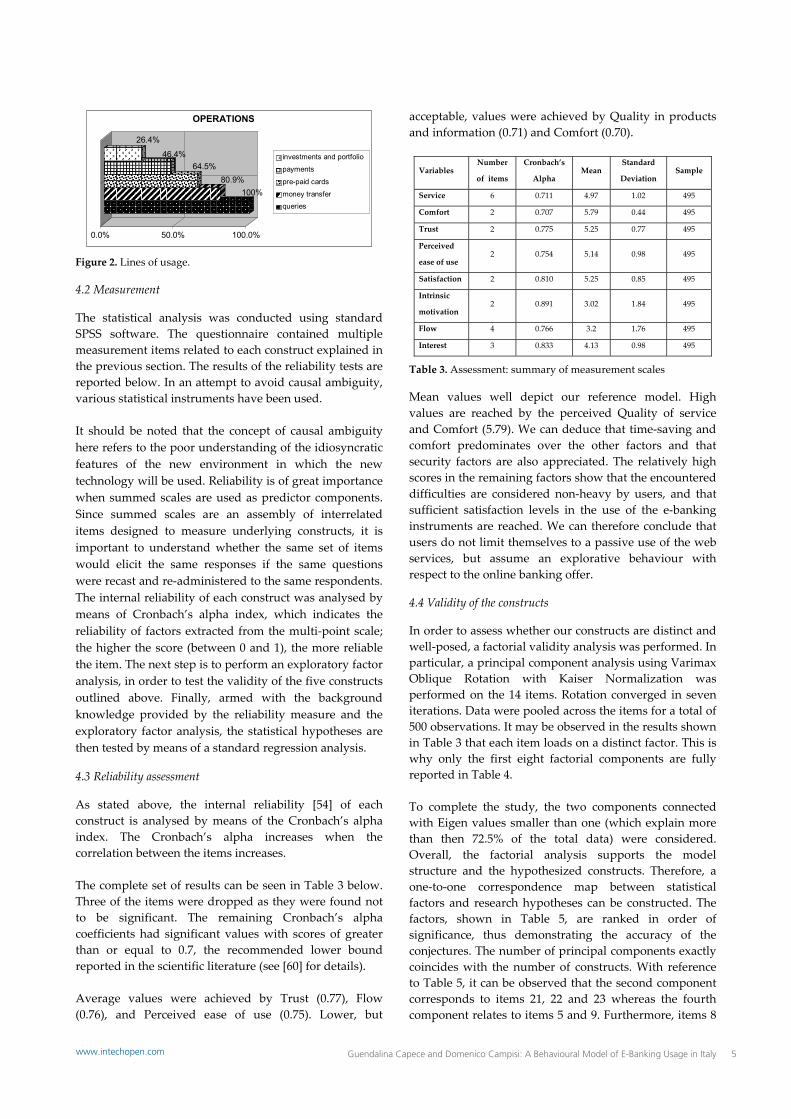
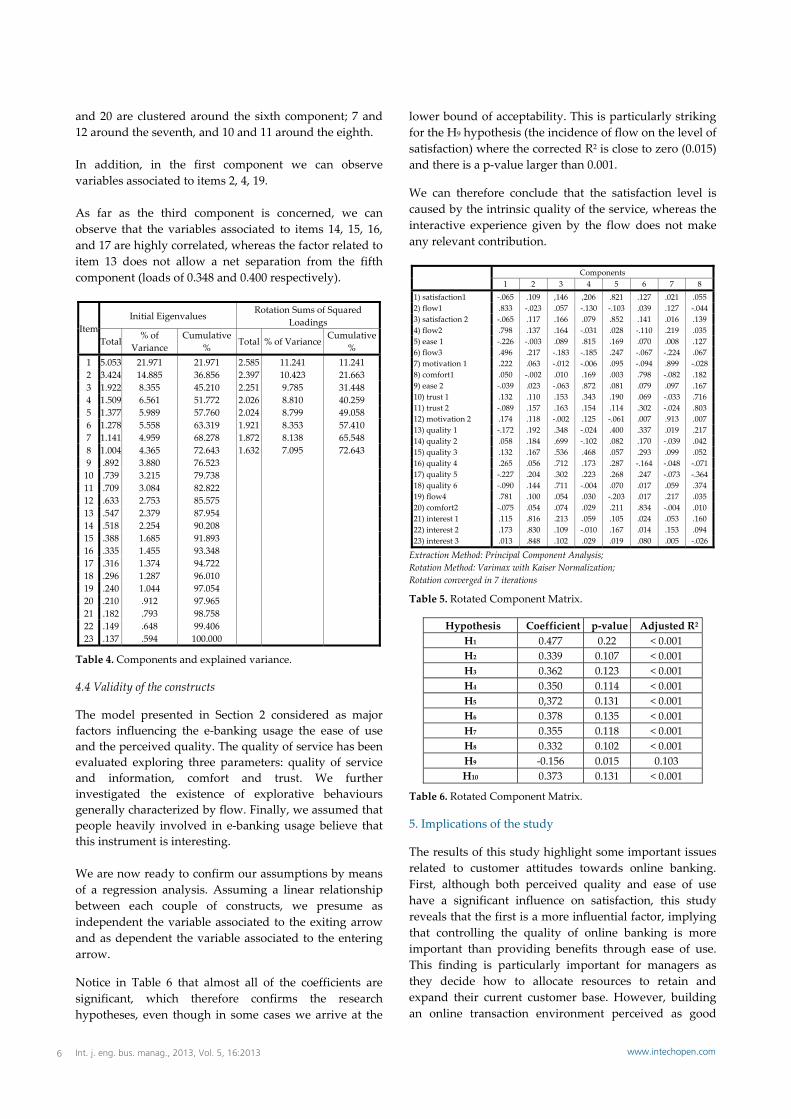
The sample is composed of skilled users with experience of several years and with a frequency of use of more than once a week. We further distinguish heavy users (daily frequency usage) and normal users (weekly frequency). With reference to our sample, the main results on the frequency of usage and the relative banking operations are respectively reported in Table 2 and Figure 2 below.
Usage Frequency Percentage
1 day 85 17.3
2 days 68 13.6
3 days 68 13.6
1 week 148 30.0
2 weeks 126 25.5
Total 495 100.0
Table 2. Usage frequencies.
Int. j. eng. bus. manag., 2013, Vol. 5, 16:20134 www.intechopen.com
100%80.9%
64.5%46.4%
26.4%
0.0% 50.0% 100.0%
OPERATIONS
investments and portfolio
payments
pre-paid cards
money transferqueries
Figure 2. Lines of usage.
4.2 Measurement
The statistical analysis was conducted using standard SPSS software. The questionnaire contained multiple measurement items related to each construct explained in the previous section. The results of the reliability tests are reported below. In an attempt to avoid causal ambiguity, various statistical instruments have been used. It should be noted that the concept of causal ambiguity here refers to the poor understanding of the idiosyncratic features of the new environment in which the new technology will be used. Reliability is of great importance when summed scales are used as predictor components. Since summed scales are an assembly of interrelated items designed to measure underlying constructs, it is important to understand whether the same set of items would elicit the same responses if the same questions were recast and re‐administered to the same respondents. The internal reliability of each construct was analysed by means of Cronbach’s alpha index, which indicates the reliability of factors extracted from the multi‐point scale; the higher the score (between 0 and 1), the more reliable the item. The next step is to perform an exploratory factor analysis, in order to test the validity of the five constructs outlined above. Finally, armed with the background knowledge provided by the reliability measure and the exploratory factor analysis, the statistical hypotheses are then tested by means of a standard regression analysis.
4.3 Reliability assessment
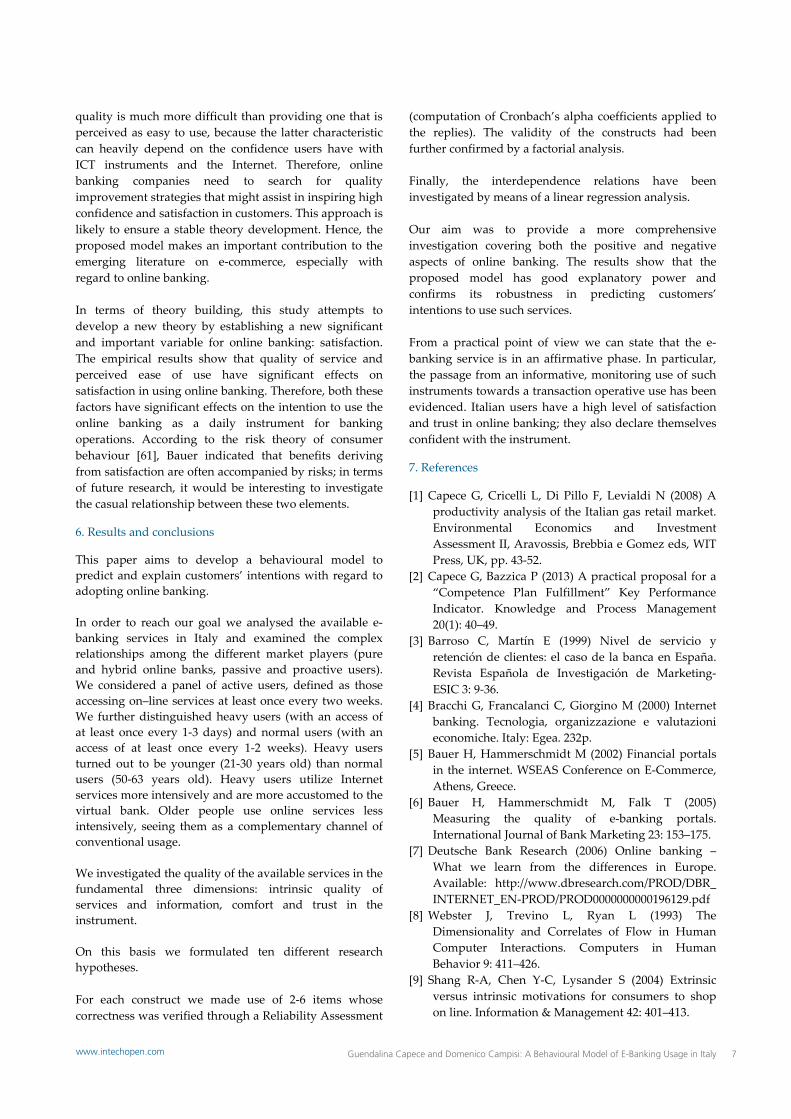
As stated above, the internal reliability [54] of each construct is analysed by means of the Cronbach’s alpha index. The Cronbach’s alpha increases when the correlation between the items increases. The complete set of results can be seen in Table 3 below. Three of the items were dropped as they were found not to be significant. The remaining Cronbach’s alpha coefficients had significant values with scores of greater than or equal to 0.7, the recommended lower bound reported in the scientific literature (see [60] for details). Average values were achieved by Trust (0.77), Flow (0.76), and Perceived ease of use (0.75). Lower, but
acceptable, values were achieved by Quality in products and information (0.71) and Comfort (0.70).
Variables Number
of items
Cronbach’s
Alpha Mean
Standard
Deviation Sample
Service 6 0.711 4.97 1.02 495
Comfort 2 0.707 5.79 0.44 495
Trust 2 0.775 5.25 0.77 495
Perceived
ease of use 2 0.754 5.14 0.98 495
Satisfaction 2 0.810 5.25 0.85 495
Intrinsic
motivation 2 0.891 3.02 1.84 495
Flow 4 0.766 3.2 1.76 495
Interest 3 0.833 4.13 0.98 495
Table 3. Assessment: summary of measurement scales
Mean values well depict our reference model. High values are reached by the perceived Quality of service and Comfort (5.79). We can deduce that time‐saving and comfort predominates over the other factors and that security factors are also appreciated. The relatively high scores in the remaining factors show that the encountered difficulties are considered non‐heavy by users, and that sufficient satisfaction levels in the use of the e‐banking instruments are reached. We can therefore conclude that users do not limit themselves to a passive use of the web services, but assume an explorative behaviour with respect to the online banking offer.
4.4 Validity of the constructs
In order to assess whether our constructs are distinct and well‐posed, a factorial validity analysis was performed. In particular, a principal component analysis using Varimax Oblique Rotation with Kaiser Normalization was performed on the 14 items. Rotation converged in seven iterations. Data were pooled across the items for a total of 500 observations. It may be observed in the results shown in Table 3 that each item loads on a distinct factor. This is why only the first eight factorial components are fully reported in Table 4. To complete the study, the two components connected with Eigen values smaller than one (which explain more than then 72.5% of the total data) were considered. Overall, the factorial analysis supports the model structure and the hypothesized constructs. Therefore, a one‐to‐one correspondence map between statistical factors and research hypotheses can be constructed. The factors, shown in Table 5, are ranked in order of significance, thus demonstrating the accuracy of the conjectures. The number of principal components exactly coincides with the number of constructs. With reference to Table 5, it can be observed that the second component corresponds to items 21, 22 and 23 whereas the fourth component relates to items 5 and 9. Furthermore, items 8
Guendalina Capece and Domenico Campisi: A Behavioural Model of E-Banking Usage in Italy 5www.intechopen.com
and 20 are clustered around the sixth component; 7 and 12 around the seventh, and 10 and 11 around the eighth. In addition, in the first component we can observe variables associated to items 2, 4, 19. As far as the third component is concerned, we can observe that the variables associated to items 14, 15, 16, and 17 are highly correlated, whereas the factor related to item 13 does not allow a net separation from the fifth component (loads of 0.348 and 0.400 respectively).
ItemInitial Eigenvalues
Rotation Sums of Squared Loadings
Total % of
Variance Cumulative
% Total % of Variance Cumulative
% 1 5.053 21.971 21.971 2.585 11.241 11.241 2 3.424 14.885 36.856 2.397 10.423 21.663 3 1.922 8.355 45.210 2.251 9.785 31.448 4 1.509 6.561 51.772 2.026 8.810 40.259 5 1.377 5.989 57.760 2.024 8.799 49.058 6 1.278 5.558 63.319 1.921 8.353 57.410 7 1.141 4.959 68.278 1.872 8.138 65.548 8 1.004 4.365 72.643 1.632 7.095 72.643 9 .892 3.880 76.523 10 .739 3.215 79.738 11 .709 3.084 82.822 12 .633 2.753 85.575 13 .547 2.379 87.954 14 .518 2.254 90.208 15 .388 1.685 91.893 16 .335 1.455 93.348 17 .316 1.374 94.722 18 .296 1.287 96.010 19 .240 1.044 97.054 20 .210 .912 97.965 21 .182 .793 98.758 22 .149 .648 99.406 23 .137 .594 100.000
Table 4. Components and explained variance.
4.4 Validity of the constructs
The model presented in Section 2 considered as major factors influencing the e‐banking usage the ease of use and the perceived quality. The quality of service has been evaluated exploring three parameters: quality of service and information, comfort and trust. We further investigated the existence of explorative behaviours generally characterized by flow. Finally, we assumed that people heavily involved in e‐banking usage believe that this instrument is interesting. We are now ready to confirm our assumptions by means of a regression analysis. Assuming a linear relationship between each couple of constructs, we presume as independent the variable associated to the exiting arrow and as dependent the variable associated to the entering arrow.
Notice in Table 6 that almost all of the coefficients are significant, which therefore confirms the research hypotheses, even though in some cases we arrive at the
lower bound of acceptability. This is particularly striking for the H9 hypothesis (the incidence of flow on the level of satisfaction) where the corrected R2 is close to zero (0.015) and there is a p‐value larger than 0.001.
We can therefore conclude that the satisfaction level is caused by the intrinsic quality of the service, whereas the interactive experience given by the flow does not make any relevant contribution. Components 1 2 3 4 5 6 7 8 1) satisfaction1 ‐.065 .109 ,146 ,206 .821 .127 .021 .055 2) flow1 .833 ‐.023 .057 ‐.130 ‐.103 .039 .127 ‐.044 3) satisfaction 2 ‐.065 .117 .166 .079 .852 .141 .016 .139 4) flow2 .798 .137 .164 ‐.031 .028 ‐.110 .219 .035 5) ease 1 ‐.226 ‐.003 .089 .815 .169 .070 .008 .127 6) flow3 .496 .217 ‐.183 ‐.185 .247 ‐.067 ‐.224 .067 7) motivation 1 .222 .063 ‐.012 ‐.006 .095 ‐.094 .899 ‐.028 8) comfort1 .050 ‐.002 .010 .169 .003 .798 ‐.082 .182 9) ease 2 ‐.039 .023 ‐.063 .872 .081 .079 .097 .167 10) trust 1 .132 .110 .153 .343 .190 .069 ‐.033 .716 11) trust 2 ‐.089 .157 .163 .154 .114 .302 ‐.024 .803 12) motivation 2 .174 .118 ‐.002 .125 ‐.061 .007 .913 .007 13) quality 1 ‐.172 .192 .348 ‐.024 .400 .337 .019 .217 14) quality 2 .058 .184 .699 ‐.102 .082 .170 ‐.039 .042 15) quality 3 .132 .167 .536 .468 .057 .293 .099 .052 16) quality 4 .265 .056 .712 .173 .287 ‐.164 ‐.048 ‐.071 17) quality 5 ‐.227 .204 .302 .223 .268 .247 ‐.073 ‐.364 18) quality 6 ‐.090 .144 .711 ‐.004 .070 .017 .059 .374 19) flow4 .781 .100 .054 .030 ‐.203 .017 .217 .035 20) comfort2 ‐.075 .054 .074 .029 .211 .834 ‐.004 .010 21) interest 1 .115 .816 .213 .059 .105 .024 .053 .160 22) interest 2 .173 .830 .109 ‐.010 .167 .014 .153 .094 23) interest 3 .013 .848 .102 .029 .019 .080 .005 ‐.026
Extraction Method: Principal Component Analysis; Rotation Method: Varimax with Kaiser Normalization; Rotation converged in 7 iterations
Table 5. Rotated Component Matrix.
Hypothesis Coefficient p‐value Adjusted R2H1 0.477 0.22 < 0.001 H2 0.339 0.107 < 0.001 H3 0.362 0.123 < 0.001 H4 0.350 0.114 < 0.001 H5 0,372 0.131 < 0.001 H6 0.378 0.135 < 0.001 H7 0.355 0.118 < 0.001 H8 0.332 0.102 < 0.001 H9 ‐0.156 0.015 0.103 H10 0.373 0.131 < 0.001
Table 6. Rotated Component Matrix.
5. Implications of the study
The results of this study highlight some important issues related to customer attitudes towards online banking. First, although both perceived quality and ease of use have a significant influence on satisfaction, this study reveals that the first is a more influential factor, implying that controlling the quality of online banking is more important than providing benefits through ease of use. This finding is particularly important for managers as they decide how to allocate resources to retain and expand their current customer base. However, building an online transaction environment perceived as good
Int. j. eng. bus. manag., 2013, Vol. 5, 16:20136 www.intechopen.com
quality is much more difficult than providing one that is perceived as easy to use, because the latter characteristic can heavily depend on the confidence users have with ICT instruments and the Internet. Therefore, online banking companies need to search for quality improvement strategies that might assist in inspiring high confidence and satisfaction in customers. This approach is likely to ensure a stable theory development. Hence, the proposed model makes an important contribution to the emerging literature on e‐commerce, especially with regard to online banking. In terms of theory building, this study attempts to develop a new theory by establishing a new significant and important variable for online banking: satisfaction. The empirical results show that quality of service and perceived ease of use have significant effects on satisfaction in using online banking. Therefore, both these factors have significant effects on the intention to use the online banking as a daily instrument for banking operations. According to the risk theory of consumer behaviour [61], Bauer indicated that benefits deriving from satisfaction are often accompanied by risks; in terms of future research, it would be interesting to investigate the casual relationship between these two elements.
6. Results and conclusions
This paper aims to develop a behavioural model to predict and explain customers’ intentions with regard to adopting online banking. In order to reach our goal we analysed the available e‐banking services in Italy and examined the complex relationships among the different market players (pure and hybrid online banks, passive and proactive users). We considered a panel of active users, defined as those accessing on–line services at least once every two weeks. We further distinguished heavy users (with an access of at least once every 1‐3 days) and normal users (with an access of at least once every 1‐2 weeks). Heavy users turned out to be younger (21‐30 years old) than normal users (50‐63 years old). Heavy users utilize Internet services more intensively and are more accustomed to the virtual bank. Older people use online services less intensively, seeing them as a complementary channel of conventional usage. We investigated the quality of the available services in the fundamental three dimensions: intrinsic quality of services and information, comfort and trust in the instrument. On this basis we formulated ten different research hypotheses. For each construct we made use of 2‐6 items whose correctness was verified through a Reliability Assessment
(computation of Cronbach’s alpha coefficients applied to the replies). The validity of the constructs had been further confirmed by a factorial analysis. Finally, the interdependence relations have been investigated by means of a linear regression analysis. Our aim was to provide a more comprehensive investigation covering both the positive and negative aspects of online banking. The results show that the proposed model has good explanatory power and confirms its robustness in predicting customers’ intentions to use such services. From a practical point of view we can state that the e‐banking service is in an affirmative phase. In particular, the passage from an informative, monitoring use of such instruments towards a transaction operative use has been evidenced. Italian users have a high level of satisfaction and trust in online banking; they also declare themselves confident with the instrument.
7. References
[1] Capece G, Cricelli L, Di Pillo F, Levialdi N (2008) A productivity analysis of the Italian gas retail market. Environmental Economics and Investment Assessment II, Aravossis, Brebbia e Gomez eds, WIT Press, UK, pp. 43‐52.
[2] Capece G, Bazzica P (2013) A practical proposal for a “Competence Plan Fulfillment” Key Performance Indicator. Knowledge and Process Management 20(1): 40–49.
[3] Barroso C, Martín E (1999) Nivel de servicio y retención de clientes: el caso de la banca en España. Revista Española de Investigación de Marketing‐ESIC 3: 9‐36.
[4] Bracchi G, Francalanci C, Giorgino M (2000) Internet banking. Tecnologia, organizzazione e valutazioni economiche. Italy: Egea. 232p.
[5] Bauer H, Hammerschmidt M (2002) Financial portals in the internet. WSEAS Conference on E‐Commerce, Athens, Greece.
[6] Bauer H, Hammerschmidt M, Falk T (2005) Measuring the quality of e‐banking portals. International Journal of Bank Marketing 23: 153–175.
[7] Deutsche Bank Research (2006) Online banking – What we learn from the differences in Europe. Available: http://www.dbresearch.com/PROD/DBR_ INTERNET_EN‐PROD/PROD0000000000196129.pdf
[8] Webster J, Trevino L, Ryan L (1993) The Dimensionality and Correlates of Flow in Human Computer Interactions. Computers in Human Behavior 9: 411–426.
[9] Shang R‐A, Chen Y‐C, Lysander S (2004) Extrinsic versus intrinsic motivations for consumers to shop on line. Information & Management 42: 401–413.
Guendalina Capece and Domenico Campisi: A Behavioural Model of E-Banking Usage in Italy 7www.intechopen.com
[10] Davis F, Bagozzi R, Warshaw P (1989) User acceptance of computer technology: a comparison of the two theoretical models. Management Science 35: 982–1003.
[11] Ghani JA, Supnick R, Rooney P (1991) The Experience of Flow in Computer‐Mediated and in Face‐to‐Face Groups. Proceedings of the Twelfth International Conference on Information Systems, New York, NY, 229‐237.
[12] Ghani JA, Deshpande SP (1994) Task Characteristics and the Experience of Optimal Flow in Human‐Computer Interaction. Journal of Psychology 128: 381‐391.
[13] Ghani JA (1995) Flow in Human Computer Interactions: Test of a Model. In: Carey J, editor. Human Factors in Information Systems: Emerging Theoretical Bases. New Jersey: Ablex Publishing Corp. pp. 291‐311.
[14] Agarwal R, Karahanna E (2000) Time Flies When You’re Having Fun: Cognitive Absorption and Beliefs About Information Technology Usage. MIS Quarterly 24: 665–694.
[15] Sun H, Zhang P (2006a) The role of moderating factors in user technology acceptance. Journal of Human–Computer Studies 64: 53–78.
[16] Sun H, Zhang P (2006b) Causal relationships between perceived enjoyment and perceived ease of use: An alternative approach. Journal of the Association for Information Systems 7: 618–645.
[17] Sun H, Zhang P (2008) An exploration of affect factors and their role in user technology acceptance: Mediation and causality. Journal of the American Society for Information Science and Technology 59: 1252–1263.
[18] Eurostat News Releases (2012) Internet access and use in 2012 More than half of internet users post messages to social media… …and over 60% read news online, STAT/12/185. Available: http: //europa.eu/rapid/press‐release_STAT‐12 185_en.htm
[19] Kalakota R, Whinston AB (1997), Electronic Commerce: A Manager’s Guide. New York: John Wiley and Sons..
[20] Kuisma T, Laukkanen T, Hiltunen M (2007) Mapping the reasons for resistance to internet banking: a means‐end approach. Int J Inform Manage 27(2):75–85.
[21] Littler D, Melanthiou D (2006) Consumer perceptions of risk and uncertainty and the implications for behaviour towards innovative retail services: the case of internet banking. J Retailing Consum Serv 13(6): 431–43.
[22] Campisi D, Tesauro C (1992) The diffusion and spatial distribution of new telecommunication technologies in the Italian region of Campania. Technovation. 12 (6): 355‐368.
[23] Capece G, Costa R (2009) Measuring knowledge creation in Virtual Teams through the Social Network Analysis. Knowledge Management Research and Practice 7 (4): 329‐338.
[24] Di Pillo F , Cricelli L, Gastaldi M, Levialdi N (2010) Asymmetry in mobile access charges: is it an effective regulatory measure? NETNOMICS: Economic Research and Electronic Networking 11 (3): 291‐314.
[25] Capece G, Campisi D (2011) Technological change and innovation behaviour in high level education: An international comparison between Italian and Portuguese samples. Knowledge and Process Management 18(1): 67–74.
[26] Capece G, Campisi D (2013) User satisfaction affecting the acceptance of an e‐learning platform as a mean for the development of the human capital. Behaviour & Information Technology 32(4): 335‐343.
[27] Capece G, Costa R (2013) The new neighbourhood in the internet era: network communities serving local communities. Behaviour & Information Technology 32(5): 438‐448.
[28] Heijden Hvd (2003) Factors influencing the usage of websites: the case of a generic portal in the Netherlands. Inform Manage 40:541–9.
[29] Taylor S, Todd P (1995) Assessing IT usage the role of prior experience. MIS Quart 19(4):561–70.
[30] Lee MKO, Turban E (2001) A Trust Model for Consumer Internet Shopping. International Journal of Electronic Commerce 6(1): 75‐91.
[31] McKnight DH, Chervany NL (2001) What Trust Means in E‐Commerce Customer Relationships: An Interdisciplinary Conceptual Typology. International Journal of Electronic Commerce 6(2): 35–59.
[32] Papadopoulou P, Andreou A, Kanellis P, Martakos D (2001) Trust and relationship building in electronic commerce. Internet Research: Electronic Networking Applications and Policy 11(4): 322–332.
[33] Ratnasingham P (1998) The Importance of Trust in Electronic Commerce. Information Research. Electronic Networking Applications and Policy 8(4): 313–321.
[34] Schoder D, YinP‐L (2000) Building Firm Trust Online. Communications of the ACM 43(12): 73–79.
[35] Calabrese A, Costa R, Menichini T, Rosati F (2013) Does Corporate Social Responsibility Hit the Mark? A Stakeholder Oriented Methodology for CSR Assessment. Knowledge and Process Management 20 (2): DOI: 10.1002/kpm.1406.
[36] Costa R, Menichini T (2013) A multidimensional approach for CSR assessment: the importance of the stakeholder perception. Expert Systems With Applications. 40 (1): 150‐161.
[37] Calabrese A, Costa R, Menichini T, Rosati F, Sanfelice G (2013) Turning CSR‐Driven Opportunities in Competitive Advantages: a Two‐Dimensional Model. Knowledge and Process Management. 20 (1): 50‐58.
Int. j. eng. bus. manag., 2013, Vol. 5, 16:20138 www.intechopen.com
[38] Huang S‐M, Hung Y‐C, Yen DC (2005) A study on decision factors in adopting an online stock trading system by brokers in Taiwan. Decis Support Syst 40(2): 315–28.
[39] Lee M‐C (2008) Predicting behavioral intention to use online banking. In: Proceedings of the 19th International Conference on Information Management, Taiwan.
[40] Calabrese A, Scoglio F (2012) Reframing the past: A new approach in service quality assessment. Total Quality Management & Business Excellence. 23 (11‐12): 1329‐1343.
[41] Costa, R (2012) Assessing Intellectual Capital efficiency and productivity: an application to the Italian yacht manufacturing sector. Expert Systems With Applications. 39 (8): 7255‐7261.
[42] Calabrese A, Costa R, Menichini, T (2013) Using Fuzzy AHP to manage Intellectual Capital assets: an application to the ICT service industry. Expert Systems With Applications 40 (9): 3747‐3755.[43]Lee M‐C (2009) Factors influencing the adoption of internet banking: An integration of TAM and TPB with perceived risk and perceived benefit. Electronic Commerce Research and Applications 8(3): 130–141.
[44] Fagan M, Neill S, Wooldridge B (2008) Exploring the intention to use computers: an empirical investigation of the role of intrinsic motivation, extrinsic motivation and perceived ease of use. Journal of Computer Information Systems 48: 31–37.
[45] Liao Z, Cheung M (2002) Internet‐based e‐banking and consumer attitudes: an empirical study. Information and Management 39: 283–295.
[46] Cruz P, Munoz P (2004) Flow in e‐bank satisfaction measure. In: Proceedings of the 33th EMAC Conference, Murcia, Spain.
[47] Cruz P, Munoz P (2007). Are Heavy Users Having Fun? The Role of Intrinsic Motivation: Portuguese Internet Banking Evidences. In: Proceedings of the 10th IBIMA Conference on Innovation and Knowledge Management in Business Globalization, Kuala Lumpur, Malaysia.
[48] Rust RT, Oliver RL (1994) Service Quality: new directions in theory and practice. Thousand Oaks, California: Sage Publications, Inc. 300p.
[49] Szymansky D, Hise R (2000) E‐satisfaction: an initial examination. Journal of Retailing 76: 309–322.
[50] Calabrese A (2012) Service productivity and service quality: A necessary trade‐off? International Journal of Production Economics. 135 (2): 800‐812.
[51] Ajzen I (2002) Perceived behavioral control, self‐efficacy, locus of control, and the theory of planned behavior. Journal of Applied Social Psychology 32: 665–683.
[52] Ajzen I (1991) The theory of planned behavior. Organ Behav Hum Dec Proc 50(2): 121–79.
[53] Mathieson K (1991) Predicting User Intentions: Comparing the Technology Acceptance Model with the Theory of Planned Behavior. Information Systems Research 2(3): 173–191.
[54] Cruz P, Salo J, Munoz‐Gallego P, Laukkanen T (2010) Heavy users of e‐banking and Customer Experience Management: evidences on intrinsic motivation. Int. J. of Electronic Business 8(2): 187–209.
[55] Day HI, Berlyne DE (1971) Intrinsic motivation. In: Lesser GS, editor. Psychology and educational practice. Glenview, Illinois: Scott Foresman, 294–335pp.
[56] Sandelands L, Glynn MA, Larson JR Jr. (1991) Control Theory and Social Behavior in the Workplace. Human Relations 44: 1107–1130.
[57] Ghani JA, Supnick R, Rooney P (1991) The Experience of Flow in Computer‐Mediated and in Face‐to‐Face Groups, In: Proceedings of the Twelfth International Conference on Information Systems, New York, 229–237pp.
[58] Koufaris M (2002) Applying the Technology Acceptance Model and Flow Theory to Online Consumer Behavior. Information Systems Research 13(2): 205–223.
[59] Koufaris M, Kambil A, LaBarbera (2001) PA Consumer Behavior in Web‐Based Commerce: An Empirical Study. International Journal of Electronic Commerce 6(2): 115–138.
[60] Stewart T (1986) Task fit, ease‐of‐use and computer facilities. Managing computer impact: An international study of management and organizations, In: Bjørn‐Andersen N, Eason K, Robey D, editors, Managing computer impact. Norwood, NJ: Ablex, 63–76pp.
[61] Bauer RA (1960) Consumer behavior as risk‐taking. In: Hancock RS, editor. Dynamic marketing for a changing world. Chicago: American Marketing Association, 389–398pp.
Guendalina Capece and Domenico Campisi: A Behavioural Model of E-Banking Usage in Italy 9www.intechopen.com