Embed Size (px)
Citation preview
TECHNICAL REPORT UCED 2015/16-06
A BIOCHAR FIELD TRIAL AND DEMONSTRATION PROJECT IN EUREKA, NEVADA
TASK 2: THE EFFECT OF DIFFERENT BIOCHAR AMOUNTS
ON PLANT BIOMASS PRODUCTION, PLANT TISSUE NUTRIENT CONTENT, AND WATER HOLDING CAPACITY
UNIVERSITY OF NEVADA, RENO
A Biochar Field Trial and Demonstration Project in Eureka, Nevada Task 2: The Effect of Different Biochar Amounts on Plant Biomass Production, Plant Tissue Nutrient Content,
and Water Holding Capacity 12/28/2015
ii
A BIOCHAR FIELD TRIAL AND DEMONSTRATION PROJECT IN EUREKA, NEVADA
TASK 2: THE EFFECT OF DIFFERENT BIOCHAR AMOUNTS
ON PLANT BIOMASS PRODUCTION, PLANT TISSUE NUTRIENT CONTENT, AND WATER HOLDING CAPACITY
Richard Jasoni
Curtis Robbins
Jessica Larsen
and
Frederick Steinmann (Project Overview)
Richard Jasoni is an Associate Research Scientist in the Division of Earth and Ecosystem Sciences at the Desert Research Institute.
Curtis Robins is an Assistant Research Engineer in the Division of Atmospheric Services at the
Desert Research Institute. Jessica Larsen is a Staff Research Scientist in the Division of Earth and Ecosystem Sciences at
the Desert Research institute. Frederick Steinmann is an Assistant Research Professor with the University Center for
Economic Development, College of Business at the University of Nevada, Reno.
December 2015
A Biochar Field Trial and Demonstration Project in Eureka, Nevada Task 2: The Effect of Different Biochar Amounts on Plant Biomass Production, Plant Tissue Nutrient Content,
and Water Holding Capacity 12/28/2015
iii
This publication, A Biochar Field Trial and Demonstration Project in Eureka, Nevada Task 2: The Effect of Different Biochar Amounts on Plant Biomass Production Plant Tissue Nutrient Content, and Water Holding Capacity, was published by the University Center for Economic Development in the College of Business at the University of Nevada, Reno. This publication's statements, findings, conclusions, recommendations, and/or data represent solely the findings and views of the authors and do not necessarily represent the views of Eureka County, the Desert Research Institute, the University of Nevada, Reno, or any reference sources used or quoted by this study. Reference to research projects, programs, books, magazines, or newspaper articles does not imply an endorsement or recommendation by the authors unless otherwise stated. Correspondence regarding this document should be sent to:
Frederick A. Steinmann, DPPD University Center for Economic Development
University of Nevada, Reno The College of Business
Mail Stop 204 Reno, Nevada 89557 Phone: 775.784.1655
UCED University of Nevada, Reno
University Center for Economic Development The College of Business
A Biochar Field Trial and Demonstration Project in Eureka, Nevada Task 2: The Effect of Different Biochar Amounts on Plant Biomass Production, Plant Tissue Nutrient Content,
and Water Holding Capacity 12/28/2015
iv
TABLE OF CONTENTS
Table of Contents iv List of Tables v List of Figures vi 1.0 Project Overview 1 2.0 Introduction 2 3.0 Methods 3 3.1 Soil Types, Biochar Amounts, and Plant Culture 3 3.2 Plant Biomass Harvest and Nutrient Analysis 5 3.3 Volumetric Soil Water Content Measurements 6 3.4 Soil Water Holding Capacity 7 3.5 Data Analysis 7 4.0 Results 8 4.1 Plant Biomass 8 4.1.a Alfalfa Seed Mix 8 4.1.b Corner Seed Mix 9 4.1.c Reclamation Seed Mix 10 4.2 Plant Nutrients 11 4.3 Volumetric Soil Water Content (Measured in Field Pots Containing
Alfalfa) 13 4.4 Mine Soil Water Holding Capacity 14 4.5 Water Use Efficiency 15 5.0 Results and Discussion 19 5.1 Summary 19
A Biochar Field Trial and Demonstration Project in Eureka, Nevada Task 2: The Effect of Different Biochar Amounts on Plant Biomass Production, Plant Tissue Nutrient Content,
and Water Holding Capacity 12/28/2015
v
LIST OF TABLES
Table 1: List of Plant Species Contained in the Corner Seed Mix and Reclamation 5
Seed
Table 2: Average Nutrient Content of Dry Alfalfa Biomass from Two Harvests 12 Combined
Table 3: Average Nutrient Content of Dry Corner Seed Mix Biomass from Two 12
Harvests Combined Table 4: Average Nutrient Content of Dry Reclamation Seed Mix Biomass from 13
Two Harvests Combined
A Biochar Field Trial and Demonstration Project in Eureka, Nevada Task 2: The Effect of Different Biochar Amounts on Plant Biomass Production, Plant Tissue Nutrient Content,
and Water Holding Capacity 12/28/2015
vi
LIST OF FIGURES
Figure 1: Photograph of the Biochar Particles Mixed with Field and Mine Soil 3 Figure 2: Photograph of Randomized Pots Located within an EcoCELL before 4
Planting
Figure 3: Alfalfa Seedlings in Field Soil (a), Corner Mix Seedlings in Field Soil (b), 4 Reclamation Seed Mix Seedlings in Mine Soil (c)
Figure 4: Photographs of Corner Mix Plants being Harvested (a), Paper Bags 6 Containing Plant Material inside a Drying Oven (b), Dry Plant Material being Weighed (c)
Figure 5: Photograph of TDR Probe (a) and a TDR Probe Inserted into a Pot 6 Containing Field Soil and Alfalfa
Figure 6: Photograph of a Pot being weighed to Determine Soil Water Holding 7 Capacity
Figure 7: Alfalfa Dry Biomass Weight for the 0 gram, 5 gram, 10 gram, and 20 gram 9 Biochar Treatments
Figure 8: Corner Seed Mix Dry Biomass Weight for the 0 gram, 5 gram, 10 gram, 10
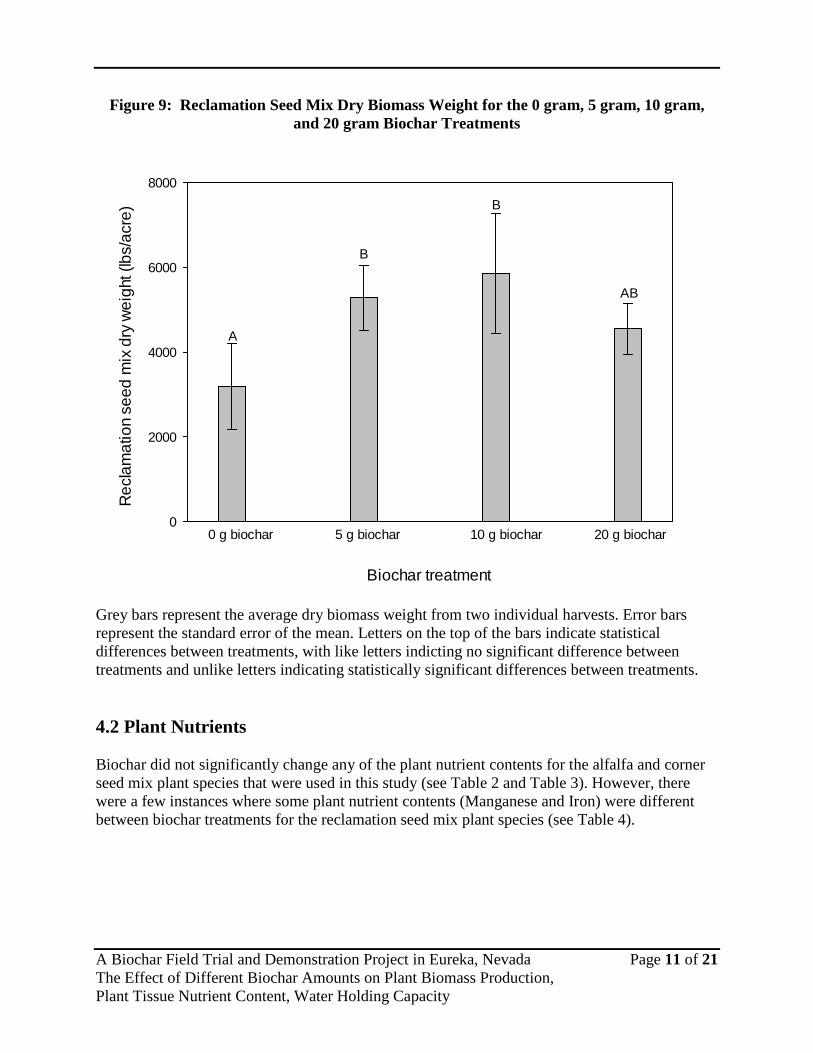
and 20 gram Biochar Treatments Figure 9: Reclamation Seed Mix Dry Biomass Weight for the 0 gram, 5 gram, 10 gram, 11
and 20 gram Biochar Treatments Figure 10: Volumetric Soil Water Holding Capacity of the Field Soil Used 14 Figure 11: Water Holding Capacity of Mine Soil Containing Four Different Levels of 15
Biochar Figure 12: Water Use Efficiency of Alfalfa Plants Grown at Four Different Levels 16 Figure 13: Water Use Efficiency of the Corner Seed Mix Plants at Four Different 17
Biochar Levels Figure 14: Water Use Efficiency of the Reclamation Seed Mix Plants at Four Different 18
Biochar Levels
A Biochar Field Trial and Demonstration Project in Eureka, Nevada Page 1 of 21 The Effect of Different Biochar Amounts on Plant Biomass Production, Plant Tissue Nutrient Content, Water Holding Capacity
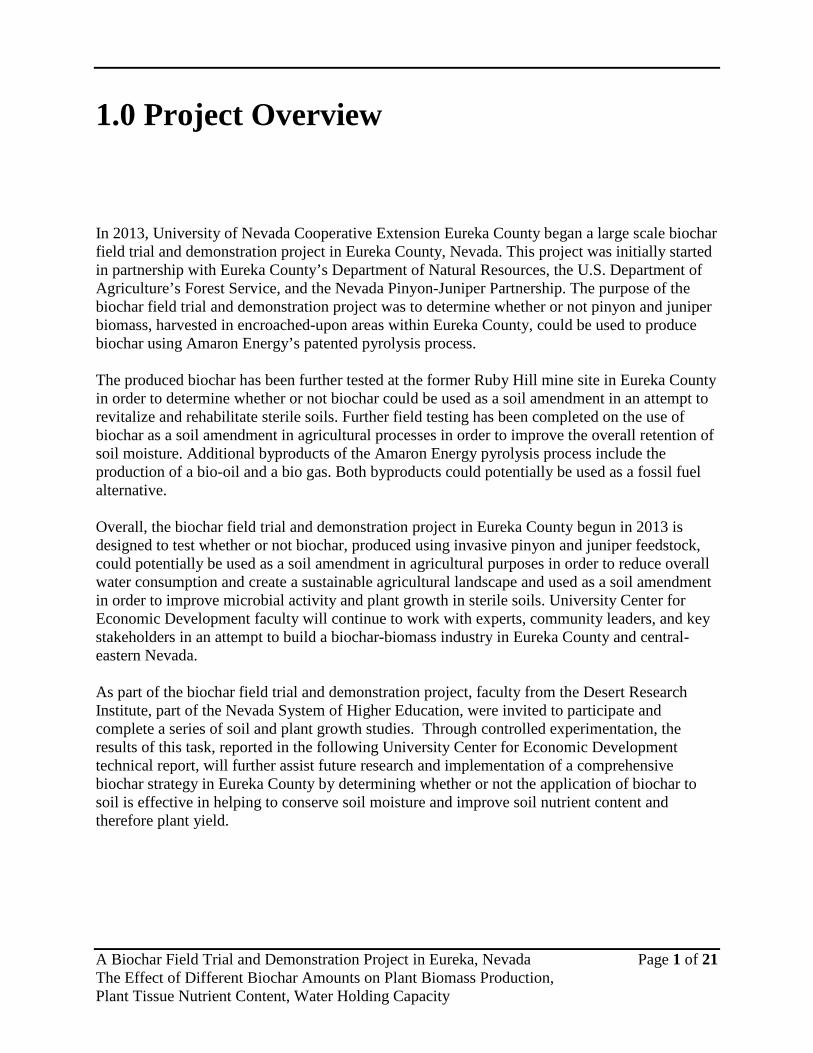
1.0 Project Overview In 2013, University of Nevada Cooperative Extension Eureka County began a large scale biochar field trial and demonstration project in Eureka County, Nevada. This project was initially started in partnership with Eureka County’s Department of Natural Resources, the U.S. Department of Agriculture’s Forest Service, and the Nevada Pinyon-Juniper Partnership. The purpose of the biochar field trial and demonstration project was to determine whether or not pinyon and juniper biomass, harvested in encroached-upon areas within Eureka County, could be used to produce biochar using Amaron Energy’s patented pyrolysis process. The produced biochar has been further tested at the former Ruby Hill mine site in Eureka County in order to determine whether or not biochar could be used as a soil amendment in an attempt to revitalize and rehabilitate sterile soils. Further field testing has been completed on the use of biochar as a soil amendment in agricultural processes in order to improve the overall retention of soil moisture. Additional byproducts of the Amaron Energy pyrolysis process include the production of a bio-oil and a bio gas. Both byproducts could potentially be used as a fossil fuel alternative. Overall, the biochar field trial and demonstration project in Eureka County begun in 2013 is designed to test whether or not biochar, produced using invasive pinyon and juniper feedstock, could potentially be used as a soil amendment in agricultural purposes in order to reduce overall water consumption and create a sustainable agricultural landscape and used as a soil amendment in order to improve microbial activity and plant growth in sterile soils. University Center for Economic Development faculty will continue to work with experts, community leaders, and key stakeholders in an attempt to build a biochar-biomass industry in Eureka County and central-eastern Nevada. As part of the biochar field trial and demonstration project, faculty from the Desert Research Institute, part of the Nevada System of Higher Education, were invited to participate and complete a series of soil and plant growth studies. Through controlled experimentation, the results of this task, reported in the following University Center for Economic Development technical report, will further assist future research and implementation of a comprehensive biochar strategy in Eureka County by determining whether or not the application of biochar to soil is effective in helping to conserve soil moisture and improve soil nutrient content and therefore plant yield.

A Biochar Field Trial and Demonstration Project in Eureka, Nevada Page 2 of 21 The Effect of Different Biochar Amounts on Plant Biomass Production, Plant Tissue Nutrient Content, Water Holding Capacity
2.0 Introduction
Water is a precious natural resource, especially so in the arid regions of the western United States where precipitation is low and demand for water is high (cities and agricultural use). Drought and declining aquafer levels that have been occurring for several years now in many regions of the arid west have decreased water availability for irrigating agricultural crops and has created a need to investigate methods for conserving water used for irrigation. One such method is the application of soil amendments that have the potential to help retain soil moisture and therefore reduce the amount of water that needs to be applied to produce a crop. A soil amendment that has shown some promise in helping to reduce water use is biochar. Biochar is a carbon rich charcoal like material that is produced during pyrolysis – and other oxygen-limited thermal conversion processes – of plant material. There are many potential uses for biochar, but its use as a soil amendment has recently gained significant attention (Steiner et al. 2008; Lehmann et al. 2011). Biochar has the potential to remediate acidic soils (Van Zwieten et al. 2010), provide essential plant nutrients (Lehmann et al. 2006; Liang et al. 2006; Lehmann 2007; Laird 2008; Sohi et al. 2010; Lehmann et al. 2011), and increase soil water holding capacity (Major et al. 2010). Biochar from different feedstocks and thermal conversion processes may vary greatly in their ability to amend soils (e.g., increasing soil water retention) (Beesly et al. 2011) and therefore, not all biochar materials are created equal and each must be tested in order to determine its exact properties as a soil amendment. This current study was conducted to determine if biochar produced from a pinyon pine-juniper (PJ) feedstock can be used as a soil amendment to help increase soil nutrients, increase plant biomass production, and retain soil moisture. The specific objectives of this study were to: 1) determine if biochar will enhance biomass production, 2) determine if biochar will increase plant tissue nutrient content, 3) determine if biochar will increase soil water holding capacity, and 4) determine if biochar will increase water use efficiency (WUE).
A Biochar Field Trial and Demonstration Project in Eureka, Nevada Page 3 of 21 The Effect of Different Biochar Amounts on Plant Biomass Production, Plant Tissue Nutrient Content, Water Holding Capacity
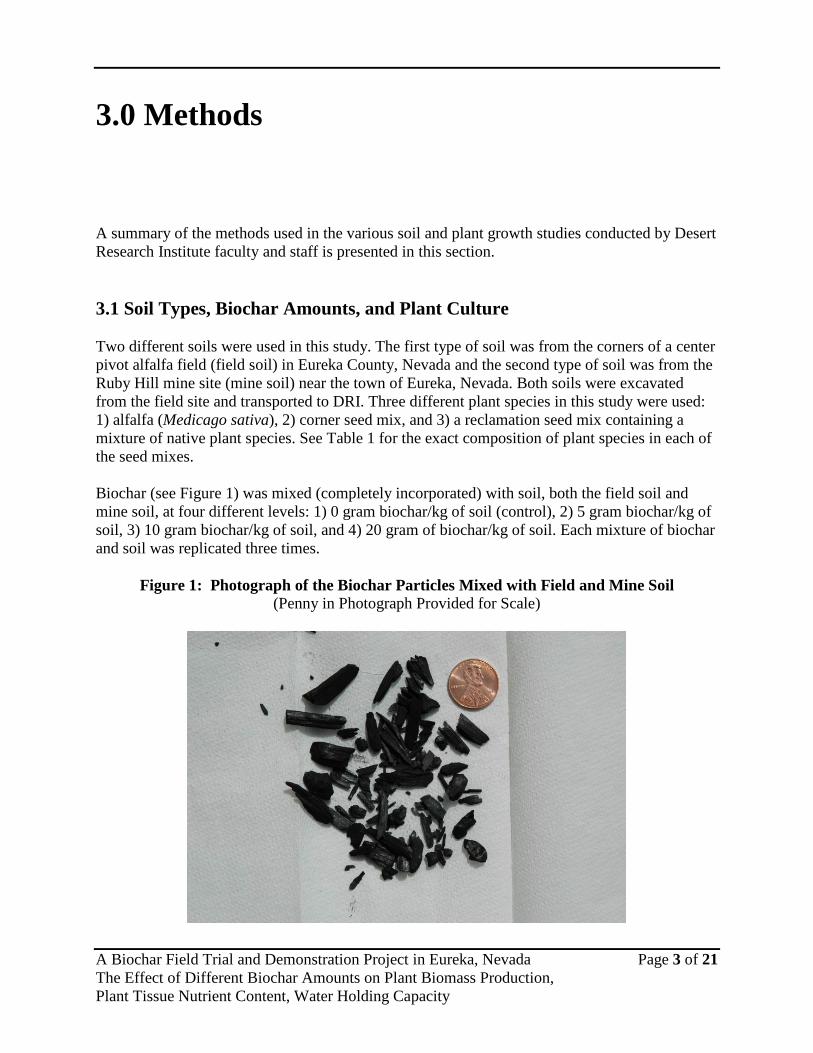
3.0 Methods A summary of the methods used in the various soil and plant growth studies conducted by Desert Research Institute faculty and staff is presented in this section. 3.1 Soil Types, Biochar Amounts, and Plant Culture Two different soils were used in this study. The first type of soil was from the corners of a center pivot alfalfa field (field soil) in Eureka County, Nevada and the second type of soil was from the Ruby Hill mine site (mine soil) near the town of Eureka, Nevada. Both soils were excavated from the field site and transported to DRI. Three different plant species in this study were used: 1) alfalfa (Medicago sativa), 2) corner seed mix, and 3) a reclamation seed mix containing a mixture of native plant species. See Table 1 for the exact composition of plant species in each of the seed mixes. Biochar (see Figure 1) was mixed (completely incorporated) with soil, both the field soil and mine soil, at four different levels: 1) 0 gram biochar/kg of soil (control), 2) 5 gram biochar/kg of soil, 3) 10 gram biochar/kg of soil, and 4) 20 gram of biochar/kg of soil. Each mixture of biochar and soil was replicated three times.
Figure 1: Photograph of the Biochar Particles Mixed with Field and Mine Soil (Penny in Photograph Provided for Scale)
A Biochar Field Trial and Demonstration Project in Eureka, Nevada Page 4 of 21 The Effect of Different Biochar Amounts on Plant Biomass Production, Plant Tissue Nutrient Content, Water Holding Capacity
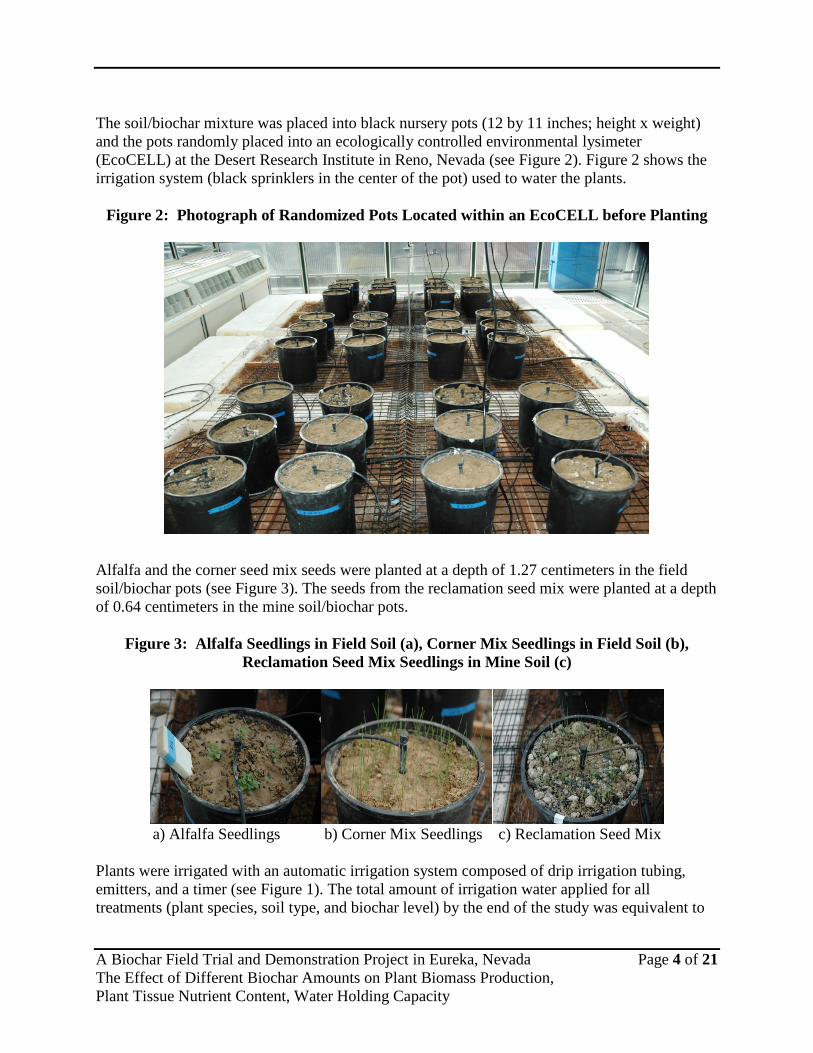
The soil/biochar mixture was placed into black nursery pots (12 by 11 inches; height x weight) and the pots randomly placed into an ecologically controlled environmental lysimeter (EcoCELL) at the Desert Research Institute in Reno, Nevada (see Figure 2). Figure 2 shows the irrigation system (black sprinklers in the center of the pot) used to water the plants.
Figure 2: Photograph of Randomized Pots Located within an EcoCELL before Planting
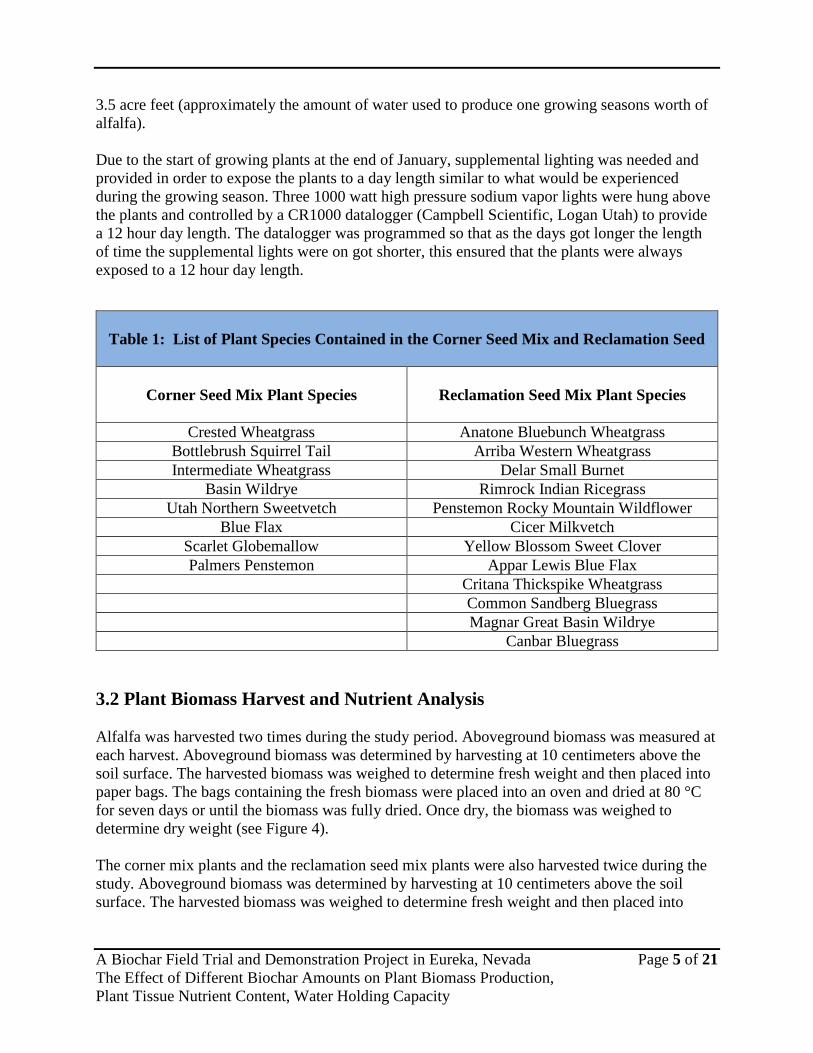
Alfalfa and the corner seed mix seeds were planted at a depth of 1.27 centimeters in the field soil/biochar pots (see Figure 3). The seeds from the reclamation seed mix were planted at a depth of 0.64 centimeters in the mine soil/biochar pots.
Figure 3: Alfalfa Seedlings in Field Soil (a), Corner Mix Seedlings in Field Soil (b), Reclamation Seed Mix Seedlings in Mine Soil (c)
a) Alfalfa Seedlings b) Corner Mix Seedlings c) Reclamation Seed Mix
Plants were irrigated with an automatic irrigation system composed of drip irrigation tubing, emitters, and a timer (see Figure 1). The total amount of irrigation water applied for all treatments (plant species, soil type, and biochar level) by the end of the study was equivalent to
A Biochar Field Trial and Demonstration Project in Eureka, Nevada Page 5 of 21 The Effect of Different Biochar Amounts on Plant Biomass Production, Plant Tissue Nutrient Content, Water Holding Capacity
3.5 acre feet (approximately the amount of water used to produce one growing seasons worth of alfalfa). Due to the start of growing plants at the end of January, supplemental lighting was needed and provided in order to expose the plants to a day length similar to what would be experienced during the growing season. Three 1000 watt high pressure sodium vapor lights were hung above the plants and controlled by a CR1000 datalogger (Campbell Scientific, Logan Utah) to provide a 12 hour day length. The datalogger was programmed so that as the days got longer the length of time the supplemental lights were on got shorter, this ensured that the plants were always exposed to a 12 hour day length.
Table 1: List of Plant Species Contained in the Corner Seed Mix and Reclamation Seed
Corner Seed Mix Plant Species
Reclamation Seed Mix Plant Species
Crested Wheatgrass Anatone Bluebunch Wheatgrass Bottlebrush Squirrel Tail Arriba Western Wheatgrass Intermediate Wheatgrass Delar Small Burnet
Basin Wildrye Rimrock Indian Ricegrass Utah Northern Sweetvetch Penstemon Rocky Mountain Wildflower
Blue Flax Cicer Milkvetch Scarlet Globemallow Yellow Blossom Sweet Clover Palmers Penstemon Appar Lewis Blue Flax
Critana Thickspike Wheatgrass Common Sandberg Bluegrass Magnar Great Basin Wildrye Canbar Bluegrass
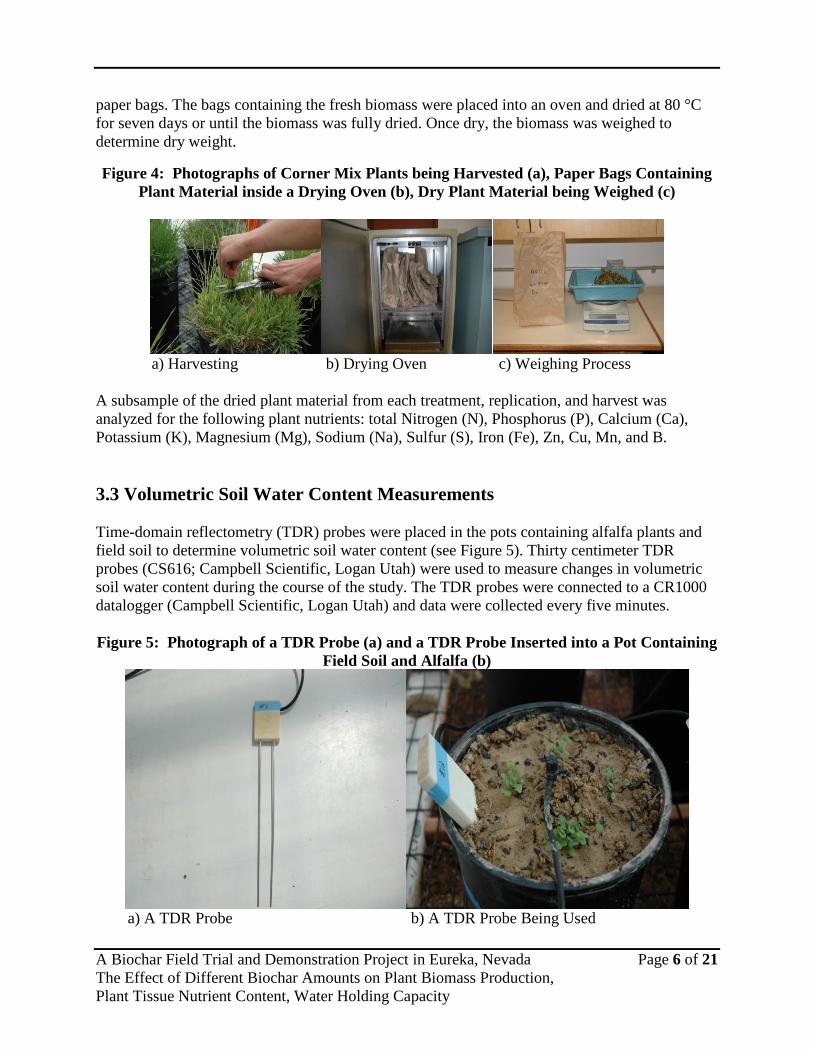
3.2 Plant Biomass Harvest and Nutrient Analysis Alfalfa was harvested two times during the study period. Aboveground biomass was measured at each harvest. Aboveground biomass was determined by harvesting at 10 centimeters above the soil surface. The harvested biomass was weighed to determine fresh weight and then placed into paper bags. The bags containing the fresh biomass were placed into an oven and dried at 80 °C for seven days or until the biomass was fully dried. Once dry, the biomass was weighed to determine dry weight (see Figure 4). The corner mix plants and the reclamation seed mix plants were also harvested twice during the study. Aboveground biomass was determined by harvesting at 10 centimeters above the soil surface. The harvested biomass was weighed to determine fresh weight and then placed into
A Biochar Field Trial and Demonstration Project in Eureka, Nevada Page 6 of 21 The Effect of Different Biochar Amounts on Plant Biomass Production, Plant Tissue Nutrient Content, Water Holding Capacity
paper bags. The bags containing the fresh biomass were placed into an oven and dried at 80 °C for seven days or until the biomass was fully dried. Once dry, the biomass was weighed to determine dry weight.
Figure 4: Photographs of Corner Mix Plants being Harvested (a), Paper Bags Containing Plant Material inside a Drying Oven (b), Dry Plant Material being Weighed (c)
a) Harvesting b) Drying Oven c) Weighing Process
A subsample of the dried plant material from each treatment, replication, and harvest was analyzed for the following plant nutrients: total Nitrogen (N), Phosphorus (P), Calcium (Ca), Potassium (K), Magnesium (Mg), Sodium (Na), Sulfur (S), Iron (Fe), Zn, Cu, Mn, and B. 3.3 Volumetric Soil Water Content Measurements Time-domain reflectometry (TDR) probes were placed in the pots containing alfalfa plants and field soil to determine volumetric soil water content (see Figure 5). Thirty centimeter TDR probes (CS616; Campbell Scientific, Logan Utah) were used to measure changes in volumetric soil water content during the course of the study. The TDR probes were connected to a CR1000 datalogger (Campbell Scientific, Logan Utah) and data were collected every five minutes. Figure 5: Photograph of a TDR Probe (a) and a TDR Probe Inserted into a Pot Containing
Field Soil and Alfalfa (b)
a) A TDR Probe b) A TDR Probe Being Used
A Biochar Field Trial and Demonstration Project in Eureka, Nevada Page 7 of 21 The Effect of Different Biochar Amounts on Plant Biomass Production, Plant Tissue Nutrient Content, Water Holding Capacity
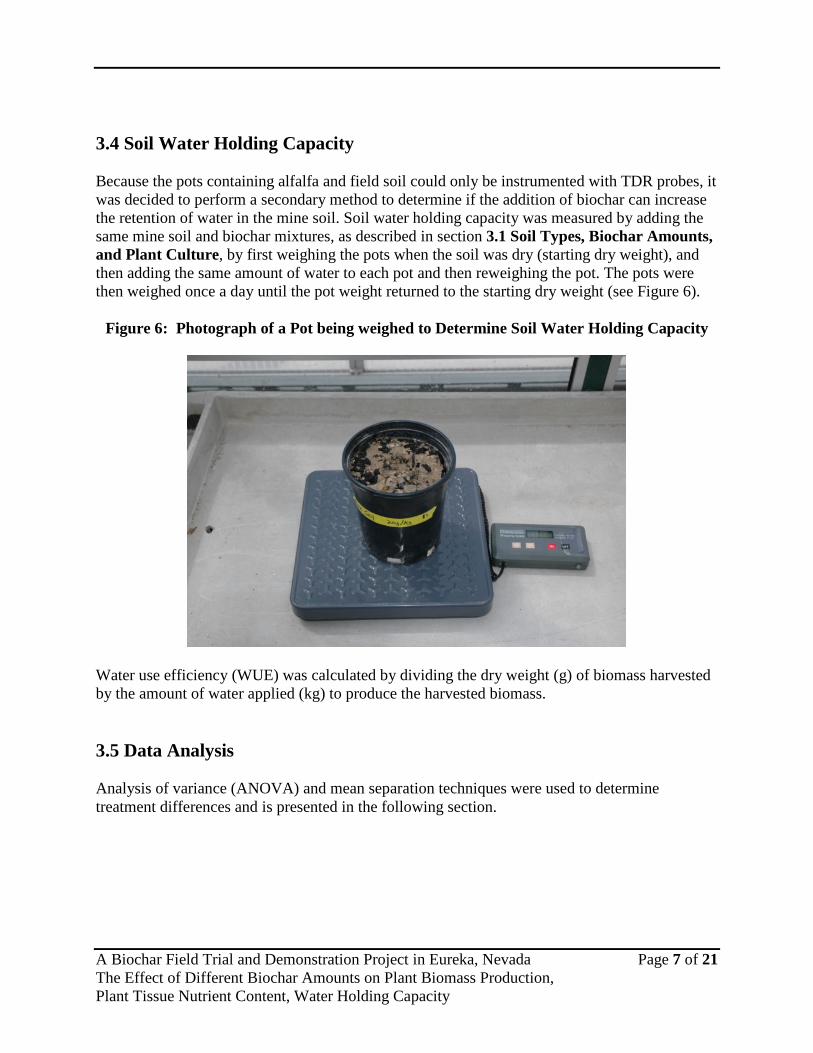
3.4 Soil Water Holding Capacity Because the pots containing alfalfa and field soil could only be instrumented with TDR probes, it was decided to perform a secondary method to determine if the addition of biochar can increase the retention of water in the mine soil. Soil water holding capacity was measured by adding the same mine soil and biochar mixtures, as described in section 3.1 Soil Types, Biochar Amounts, and Plant Culture, by first weighing the pots when the soil was dry (starting dry weight), and then adding the same amount of water to each pot and then reweighing the pot. The pots were then weighed once a day until the pot weight returned to the starting dry weight (see Figure 6).
Figure 6: Photograph of a Pot being weighed to Determine Soil Water Holding Capacity
Water use efficiency (WUE) was calculated by dividing the dry weight (g) of biomass harvested by the amount of water applied (kg) to produce the harvested biomass. 3.5 Data Analysis Analysis of variance (ANOVA) and mean separation techniques were used to determine treatment differences and is presented in the following section.
A Biochar Field Trial and Demonstration Project in Eureka, Nevada Page 8 of 21 The Effect of Different Biochar Amounts on Plant Biomass Production, Plant Tissue Nutrient Content, Water Holding Capacity
4.0 Results Analysis of variance (ANOVA) and mean separation techniques for the soil and plant growth studies are presented in this section. Plant biomass results are presented for the alfalfa seed mix, the corner seed mix, and the reclamation seed mix for the 0 gram, 5 gram, 10 gram, and 20 gram biochar treatment levels. Plant nutrient results are also presented for the alfalfa seed mix, the corner seed mix, and the reclamation seed mix for the 0 gram, 5 gram, 10 gram, and 20 gram biochar treatment levels. Volumetric soil water content, mine soil water holding capacity, and the water use efficiency results are also presented in this section. 4.1 Plant Biomass 4.1.a Alfalfa Seed Mix There were no significant differences in alfalfa biomass dry weight for any of the biochar treatments (reported biomass dry weights are the sum of two harvests) (see Figure 7). Although no significant biomass dry weights were found, there was a slight trend for greater biomass dry weights in the 5, 10 and 20 g of biochar treatments compared to the 0 g of biochar treatment.
A Biochar Field Trial and Demonstration Project in Eureka, Nevada Page 9 of 21 The Effect of Different Biochar Amounts on Plant Biomass Production, Plant Tissue Nutrient Content, Water Holding Capacity
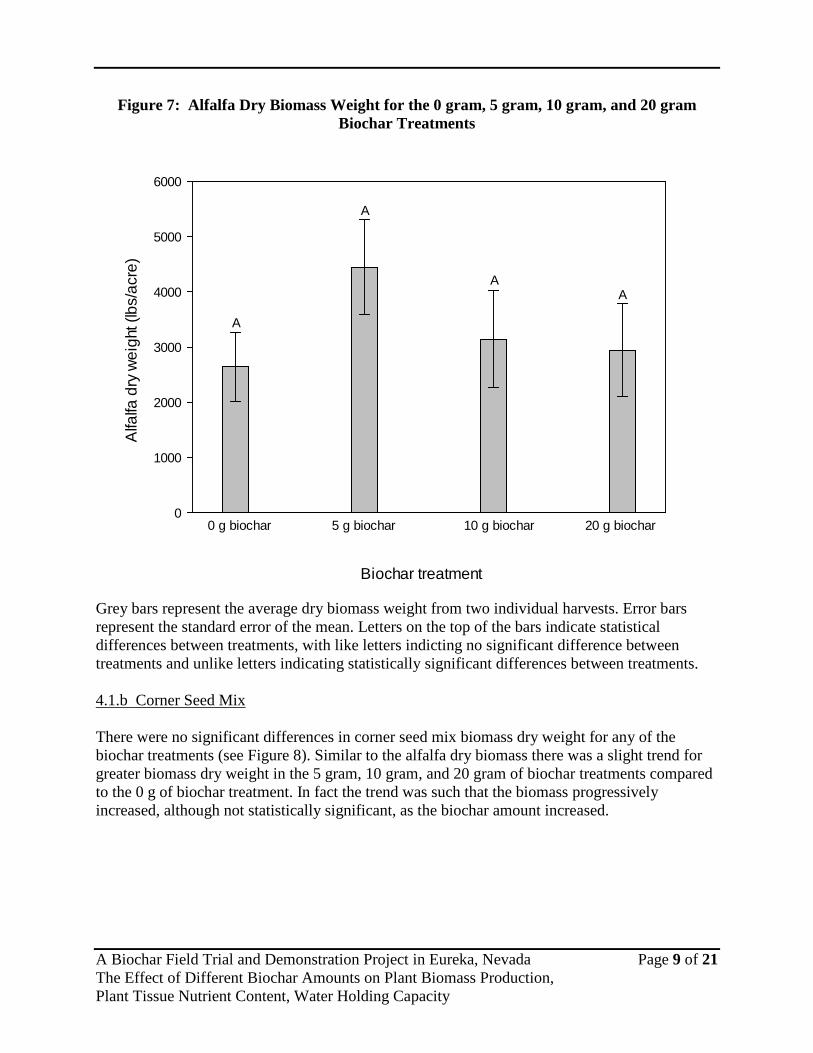
Figure 7: Alfalfa Dry Biomass Weight for the 0 gram, 5 gram, 10 gram, and 20 gram Biochar Treatments
Grey bars represent the average dry biomass weight from two individual harvests. Error bars represent the standard error of the mean. Letters on the top of the bars indicate statistical differences between treatments, with like letters indicting no significant difference between treatments and unlike letters indicating statistically significant differences between treatments. 4.1.b Corner Seed Mix There were no significant differences in corner seed mix biomass dry weight for any of the biochar treatments (see Figure 8). Similar to the alfalfa dry biomass there was a slight trend for greater biomass dry weight in the 5 gram, 10 gram, and 20 gram of biochar treatments compared to the 0 g of biochar treatment. In fact the trend was such that the biomass progressively increased, although not statistically significant, as the biochar amount increased.
Biochar treatment
Alfa
lfa d
ry w
eigh
t (lb
s/ac
re)
0
1000
2000
3000
4000
5000
6000
0 g biochar 5 g biochar 10 g biochar 20 g biochar
A
A
AA
A Biochar Field Trial and Demonstration Project in Eureka, Nevada Page 10 of 21 The Effect of Different Biochar Amounts on Plant Biomass Production, Plant Tissue Nutrient Content, Water Holding Capacity
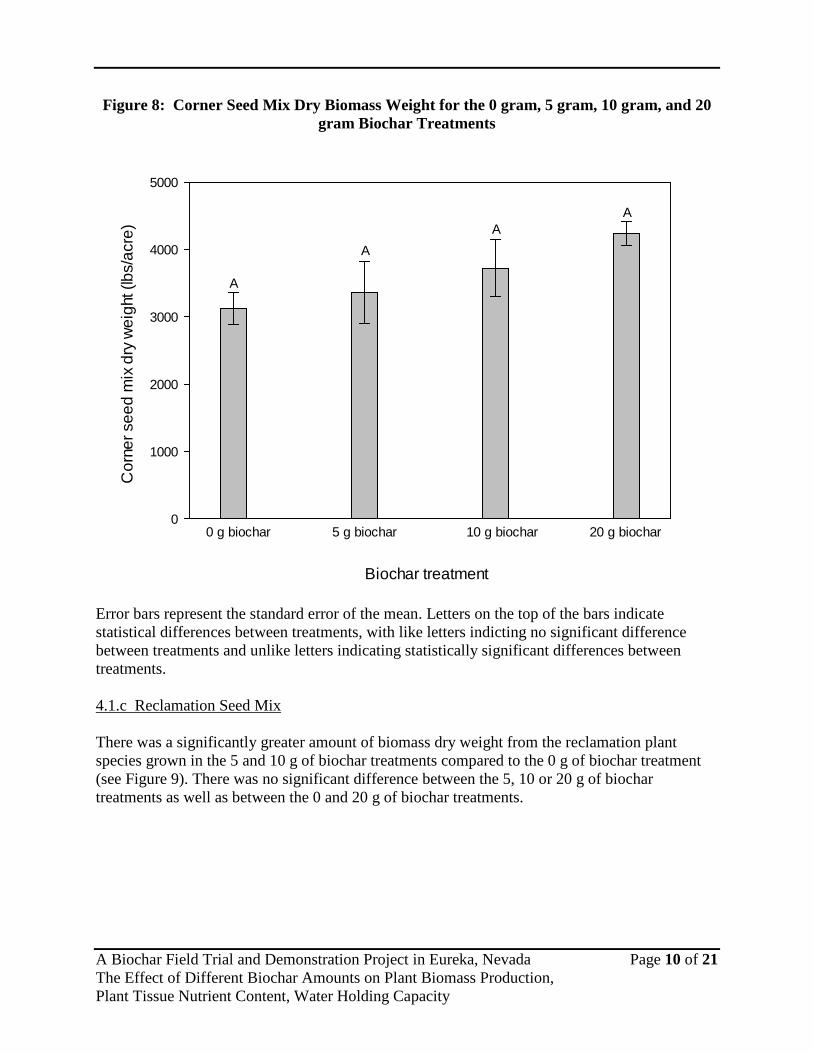
Figure 8: Corner Seed Mix Dry Biomass Weight for the 0 gram, 5 gram, 10 gram, and 20 gram Biochar Treatments
Error bars represent the standard error of the mean. Letters on the top of the bars indicate statistical differences between treatments, with like letters indicting no significant difference between treatments and unlike letters indicating statistically significant differences between treatments. 4.1.c Reclamation Seed Mix
There was a significantly greater amount of biomass dry weight from the reclamation plant species grown in the 5 and 10 g of biochar treatments compared to the 0 g of biochar treatment (see Figure 9). There was no significant difference between the 5, 10 or 20 g of biochar treatments as well as between the 0 and 20 g of biochar treatments.
Biochar treatment
Cor
ner s
eed
mix
dry
wei
ght (
lbs/
acre
)
0
1000
2000
3000
4000
5000
0 g biochar 5 g biochar 10 g biochar 20 g biochar
A
AA
A
A Biochar Field Trial and Demonstration Project in Eureka, Nevada Page 11 of 21 The Effect of Different Biochar Amounts on Plant Biomass Production, Plant Tissue Nutrient Content, Water Holding Capacity
Figure 9: Reclamation Seed Mix Dry Biomass Weight for the 0 gram, 5 gram, 10 gram, and 20 gram Biochar Treatments
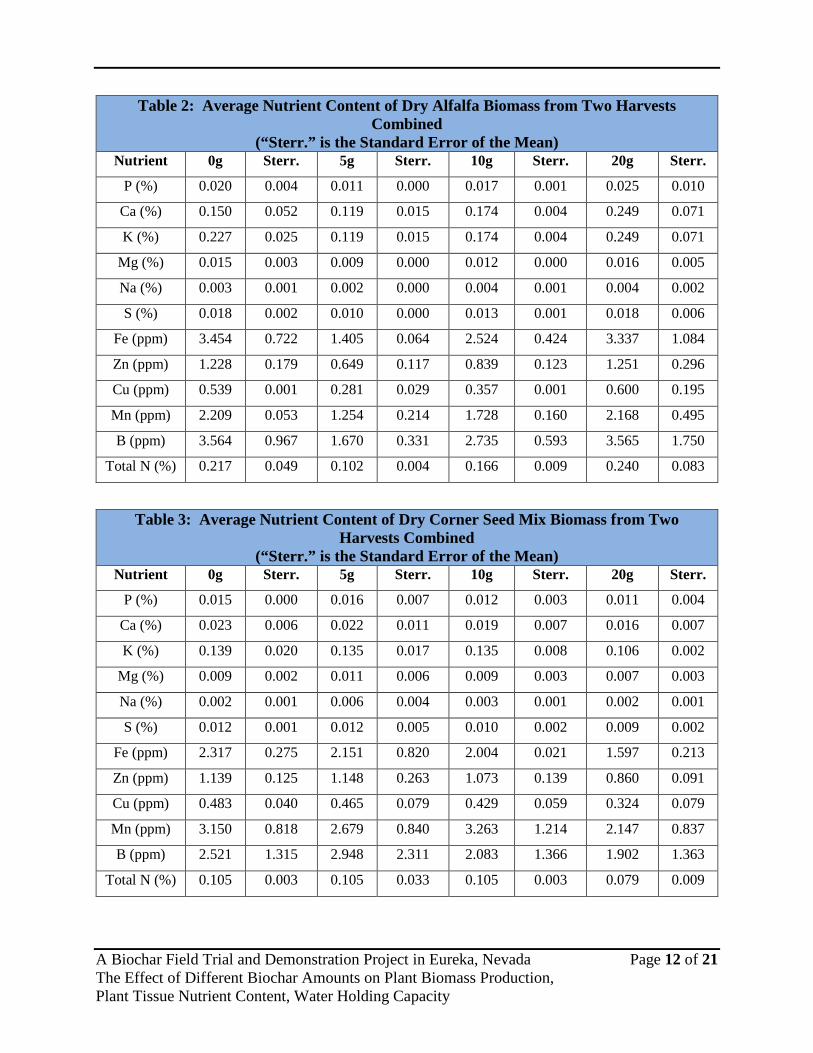
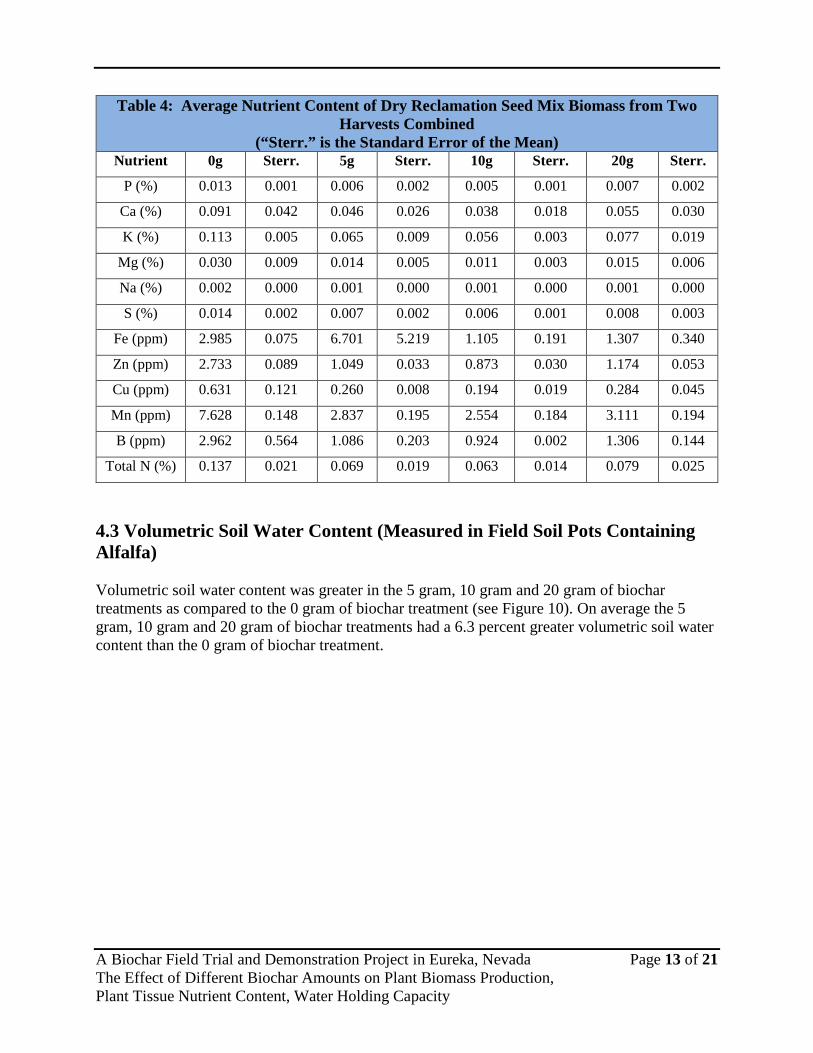
Grey bars represent the average dry biomass weight from two individual harvests. Error bars represent the standard error of the mean. Letters on the top of the bars indicate statistical differences between treatments, with like letters indicting no significant difference between treatments and unlike letters indicating statistically significant differences between treatments. 4.2 Plant Nutrients Biochar did not significantly change any of the plant nutrient contents for the alfalfa and corner seed mix plant species that were used in this study (see Table 2 and Table 3). However, there were a few instances where some plant nutrient contents (Manganese and Iron) were different between biochar treatments for the reclamation seed mix plant species (see Table 4).
Biochar treatment
Rec
lam
atio
n se
ed m
ix d
ry w
eigh
t (lb
s/ac
re)
0
2000
4000
6000
8000
0 g biochar 5 g biochar 10 g biochar 20 g biochar
A
B
B
AB
A Biochar Field Trial and Demonstration Project in Eureka, Nevada Page 12 of 21 The Effect of Different Biochar Amounts on Plant Biomass Production, Plant Tissue Nutrient Content, Water Holding Capacity
Table 2: Average Nutrient Content of Dry Alfalfa Biomass from Two Harvests Combined
(“Sterr.” is the Standard Error of the Mean) Nutrient 0g Sterr. 5g Sterr. 10g Sterr. 20g Sterr.
P (%) 0.020 0.004 0.011 0.000 0.017 0.001 0.025 0.010
Ca (%) 0.150 0.052 0.119 0.015 0.174 0.004 0.249 0.071
K (%) 0.227 0.025 0.119 0.015 0.174 0.004 0.249 0.071
Mg (%) 0.015 0.003 0.009 0.000 0.012 0.000 0.016 0.005
Na (%) 0.003 0.001 0.002 0.000 0.004 0.001 0.004 0.002
S (%) 0.018 0.002 0.010 0.000 0.013 0.001 0.018 0.006
Fe (ppm) 3.454 0.722 1.405 0.064 2.524 0.424 3.337 1.084
Zn (ppm) 1.228 0.179 0.649 0.117 0.839 0.123 1.251 0.296
Cu (ppm) 0.539 0.001 0.281 0.029 0.357 0.001 0.600 0.195
Mn (ppm) 2.209 0.053 1.254 0.214 1.728 0.160 2.168 0.495
B (ppm) 3.564 0.967 1.670 0.331 2.735 0.593 3.565 1.750
Total N (%) 0.217 0.049 0.102 0.004 0.166 0.009 0.240 0.083
Table 3: Average Nutrient Content of Dry Corner Seed Mix Biomass from Two Harvests Combined
(“Sterr.” is the Standard Error of the Mean) Nutrient 0g Sterr. 5g Sterr. 10g Sterr. 20g Sterr.
P (%) 0.015 0.000 0.016 0.007 0.012 0.003 0.011 0.004
Ca (%) 0.023 0.006 0.022 0.011 0.019 0.007 0.016 0.007
K (%) 0.139 0.020 0.135 0.017 0.135 0.008 0.106 0.002
Mg (%) 0.009 0.002 0.011 0.006 0.009 0.003 0.007 0.003
Na (%) 0.002 0.001 0.006 0.004 0.003 0.001 0.002 0.001
S (%) 0.012 0.001 0.012 0.005 0.010 0.002 0.009 0.002
Fe (ppm) 2.317 0.275 2.151 0.820 2.004 0.021 1.597 0.213
Zn (ppm) 1.139 0.125 1.148 0.263 1.073 0.139 0.860 0.091
Cu (ppm) 0.483 0.040 0.465 0.079 0.429 0.059 0.324 0.079
Mn (ppm) 3.150 0.818 2.679 0.840 3.263 1.214 2.147 0.837
B (ppm) 2.521 1.315 2.948 2.311 2.083 1.366 1.902 1.363
Total N (%) 0.105 0.003 0.105 0.033 0.105 0.003 0.079 0.009
A Biochar Field Trial and Demonstration Project in Eureka, Nevada Page 13 of 21 The Effect of Different Biochar Amounts on Plant Biomass Production, Plant Tissue Nutrient Content, Water Holding Capacity
Table 4: Average Nutrient Content of Dry Reclamation Seed Mix Biomass from Two Harvests Combined
(“Sterr.” is the Standard Error of the Mean) Nutrient 0g Sterr. 5g Sterr. 10g Sterr. 20g Sterr.
P (%) 0.013 0.001 0.006 0.002 0.005 0.001 0.007 0.002
Ca (%) 0.091 0.042 0.046 0.026 0.038 0.018 0.055 0.030
K (%) 0.113 0.005 0.065 0.009 0.056 0.003 0.077 0.019
Mg (%) 0.030 0.009 0.014 0.005 0.011 0.003 0.015 0.006
Na (%) 0.002 0.000 0.001 0.000 0.001 0.000 0.001 0.000
S (%) 0.014 0.002 0.007 0.002 0.006 0.001 0.008 0.003
Fe (ppm) 2.985 0.075 6.701 5.219 1.105 0.191 1.307 0.340
Zn (ppm) 2.733 0.089 1.049 0.033 0.873 0.030 1.174 0.053
Cu (ppm) 0.631 0.121 0.260 0.008 0.194 0.019 0.284 0.045
Mn (ppm) 7.628 0.148 2.837 0.195 2.554 0.184 3.111 0.194
B (ppm) 2.962 0.564 1.086 0.203 0.924 0.002 1.306 0.144
Total N (%) 0.137 0.021 0.069 0.019 0.063 0.014 0.079 0.025
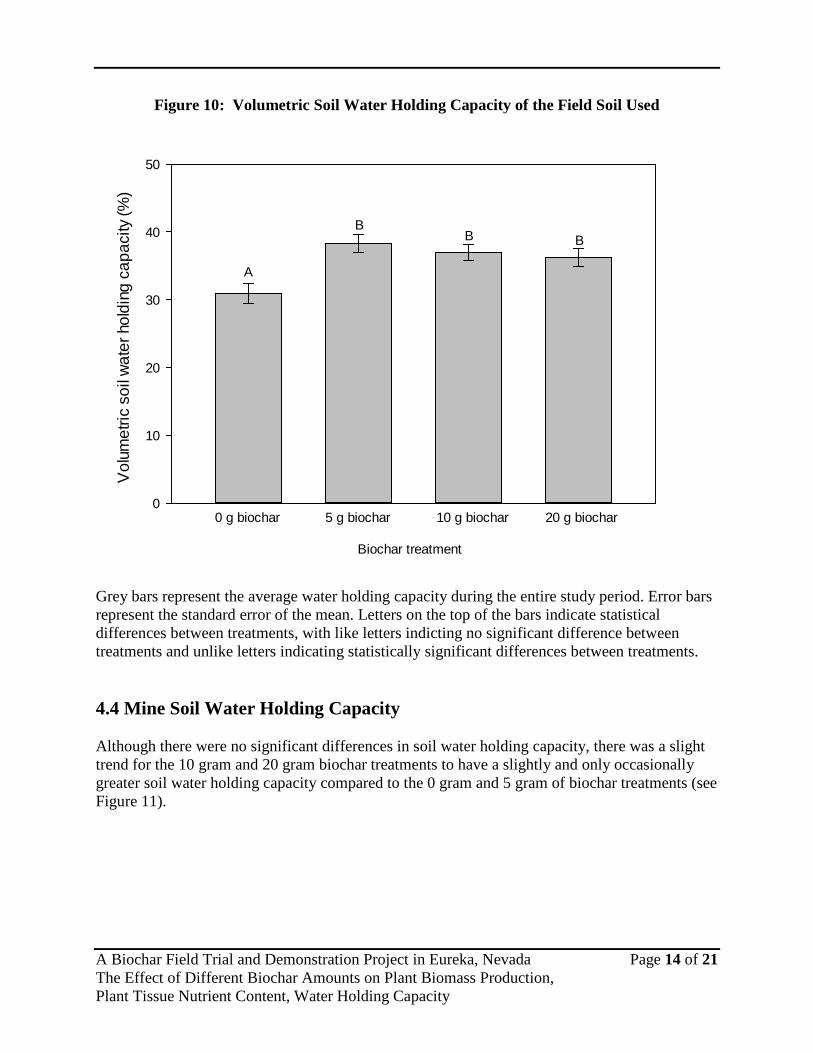
4.3 Volumetric Soil Water Content (Measured in Field Soil Pots Containing Alfalfa) Volumetric soil water content was greater in the 5 gram, 10 gram and 20 gram of biochar treatments as compared to the 0 gram of biochar treatment (see Figure 10). On average the 5 gram, 10 gram and 20 gram of biochar treatments had a 6.3 percent greater volumetric soil water content than the 0 gram of biochar treatment.
A Biochar Field Trial and Demonstration Project in Eureka, Nevada Page 14 of 21 The Effect of Different Biochar Amounts on Plant Biomass Production, Plant Tissue Nutrient Content, Water Holding Capacity
Figure 10: Volumetric Soil Water Holding Capacity of the Field Soil Used
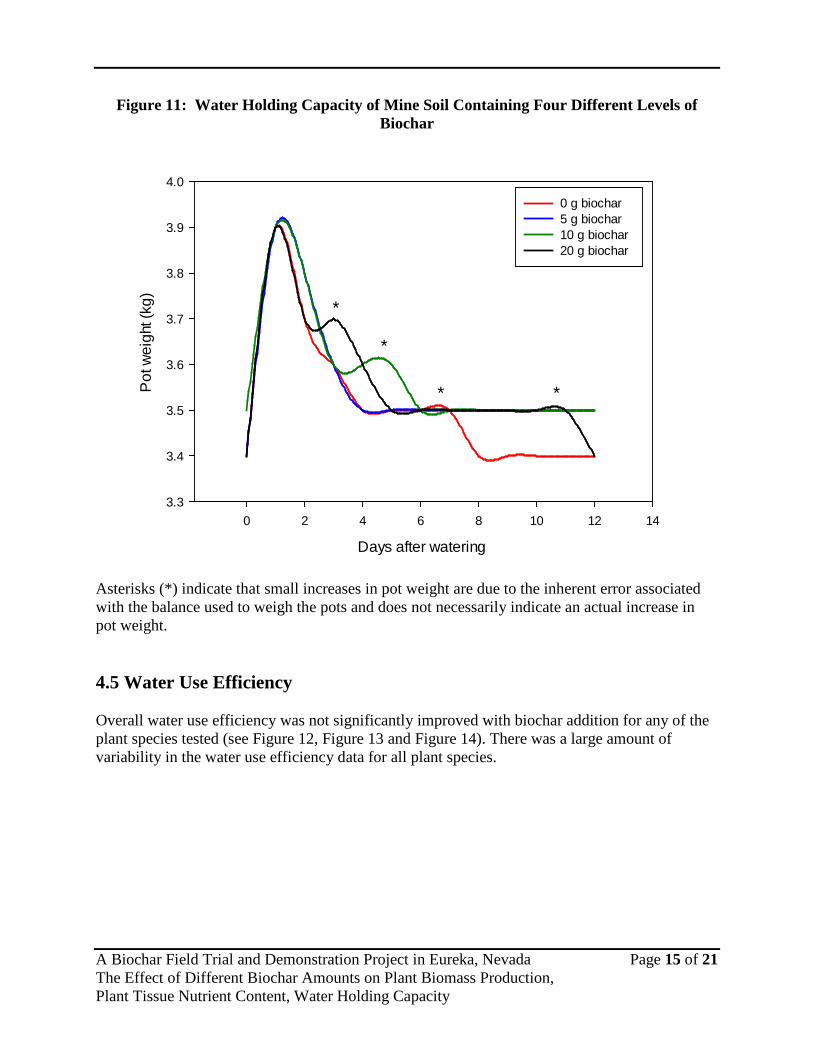
Grey bars represent the average water holding capacity during the entire study period. Error bars represent the standard error of the mean. Letters on the top of the bars indicate statistical differences between treatments, with like letters indicting no significant difference between treatments and unlike letters indicating statistically significant differences between treatments. 4.4 Mine Soil Water Holding Capacity Although there were no significant differences in soil water holding capacity, there was a slight trend for the 10 gram and 20 gram biochar treatments to have a slightly and only occasionally greater soil water holding capacity compared to the 0 gram and 5 gram of biochar treatments (see Figure 11).
Vol
umet
ric s
oil w
ater
hol
ding
cap
acity
(%)
0
10
20
30
40
50
A
BB B
Biochar treatment
0 g biochar 5 g biochar 10 g biochar 20 g biochar
A Biochar Field Trial and Demonstration Project in Eureka, Nevada Page 15 of 21 The Effect of Different Biochar Amounts on Plant Biomass Production, Plant Tissue Nutrient Content, Water Holding Capacity
Figure 11: Water Holding Capacity of Mine Soil Containing Four Different Levels of Biochar
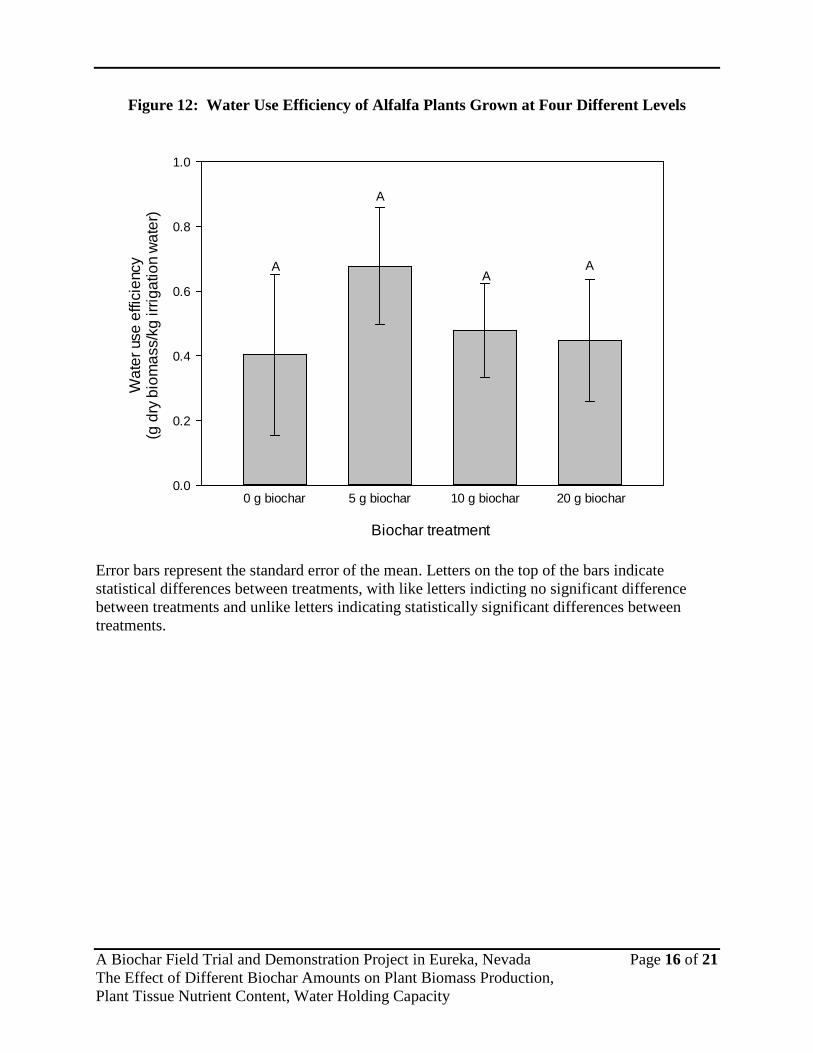
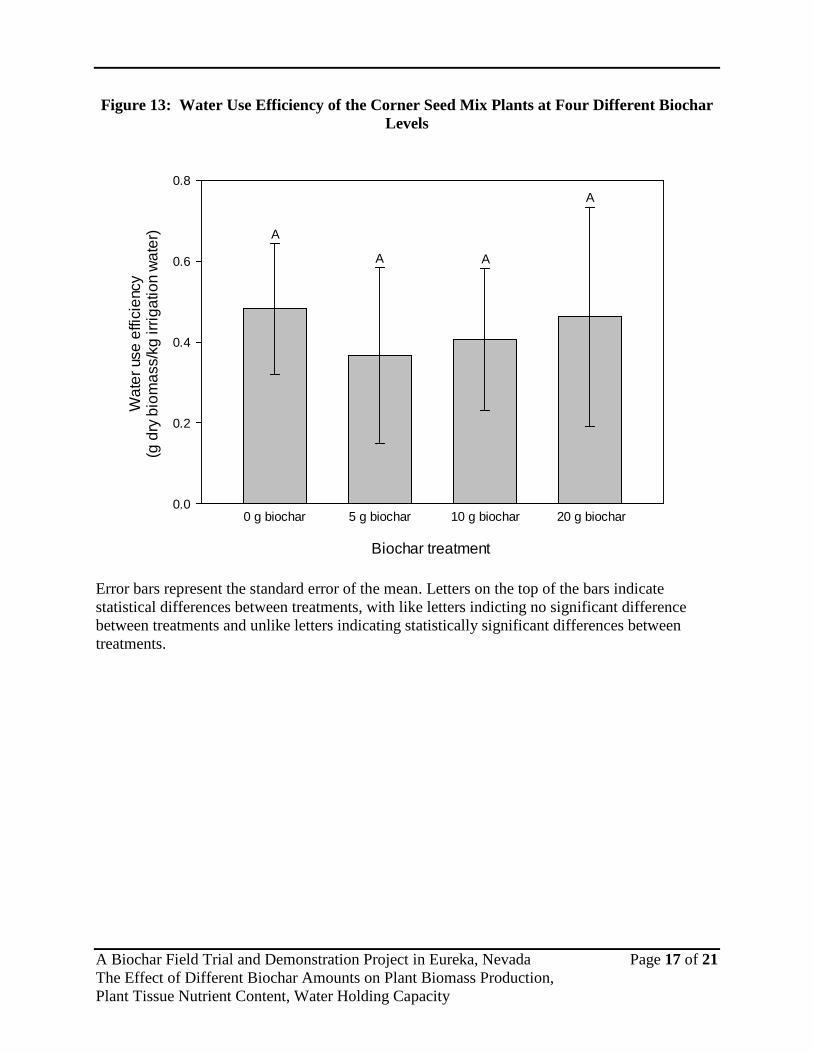
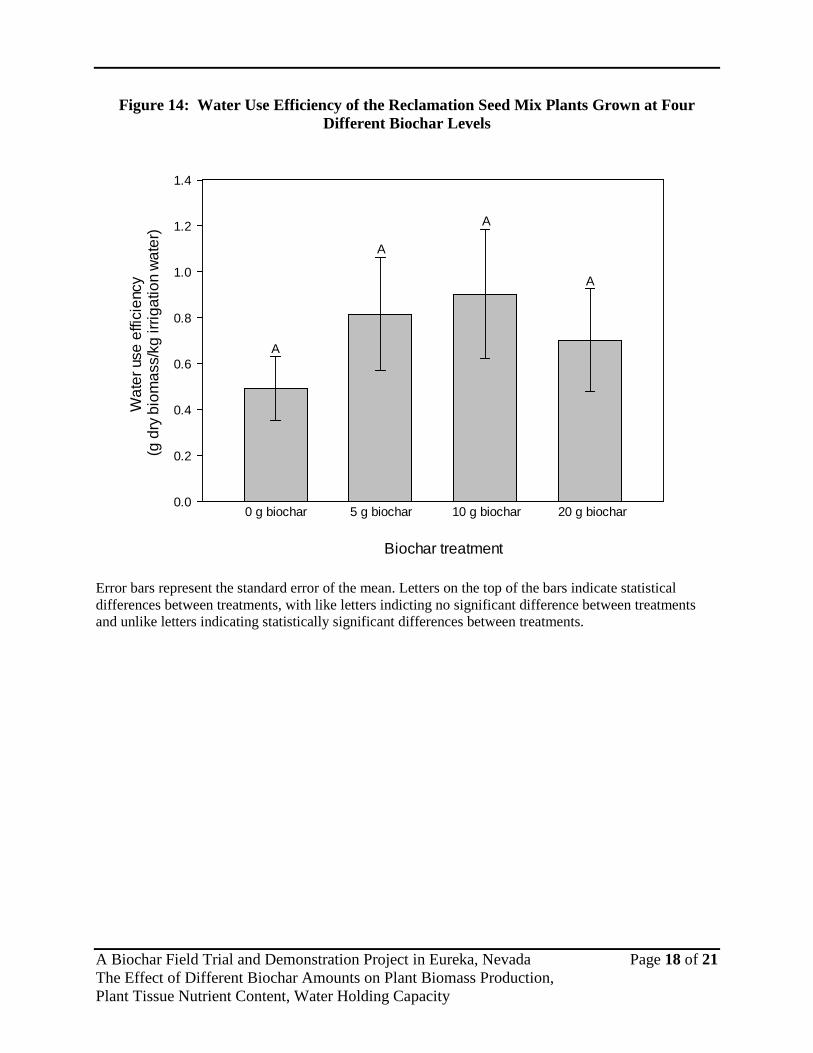
Asterisks (*) indicate that small increases in pot weight are due to the inherent error associated with the balance used to weigh the pots and does not necessarily indicate an actual increase in pot weight. 4.5 Water Use Efficiency Overall water use efficiency was not significantly improved with biochar addition for any of the plant species tested (see Figure 12, Figure 13 and Figure 14). There was a large amount of variability in the water use efficiency data for all plant species.
Days after watering
0 2 4 6 8 10 12 14
Pot
wei
ght (
kg)
3.3
3.4
3.5
3.6
3.7
3.8
3.9
4.0
0 g biochar5 g biochar 10 g biochar 20 g biochar
*
*
* *
A Biochar Field Trial and Demonstration Project in Eureka, Nevada Page 16 of 21 The Effect of Different Biochar Amounts on Plant Biomass Production, Plant Tissue Nutrient Content, Water Holding Capacity
Figure 12: Water Use Efficiency of Alfalfa Plants Grown at Four Different Levels
Error bars represent the standard error of the mean. Letters on the top of the bars indicate statistical differences between treatments, with like letters indicting no significant difference between treatments and unlike letters indicating statistically significant differences between treatments.
Biochar treatment
Wat
er u
se e
ffici
ency
(g d
ry b
iom
ass/
kg ir
rigat
ion
wat
er)
0.0
0.2
0.4
0.6
0.8
1.0
A
A
AA
0 g biochar 5 g biochar 10 g biochar 20 g biochar
A Biochar Field Trial and Demonstration Project in Eureka, Nevada Page 17 of 21 The Effect of Different Biochar Amounts on Plant Biomass Production, Plant Tissue Nutrient Content, Water Holding Capacity
Figure 13: Water Use Efficiency of the Corner Seed Mix Plants at Four Different Biochar Levels
Error bars represent the standard error of the mean. Letters on the top of the bars indicate statistical differences between treatments, with like letters indicting no significant difference between treatments and unlike letters indicating statistically significant differences between treatments.
Wat
er u
se e
ffici
ency
(g d
ry b
iom
ass/
kg ir
rigat
ion
wat
er)
0.0
0.2
0.4
0.6
0.8
Biochar treatment
0 g biochar 5 g biochar 10 g biochar 20 g biochar
A
A A
A
A Biochar Field Trial and Demonstration Project in Eureka, Nevada Page 18 of 21 The Effect of Different Biochar Amounts on Plant Biomass Production, Plant Tissue Nutrient Content, Water Holding Capacity
Figure 14: Water Use Efficiency of the Reclamation Seed Mix Plants Grown at Four Different Biochar Levels
Error bars represent the standard error of the mean. Letters on the top of the bars indicate statistical differences between treatments, with like letters indicting no significant difference between treatments and unlike letters indicating statistically significant differences between treatments.
Wat
er u
se e
ffici
ency
(g
dry
bio
mas
s/kg
irrig
atio
n w
ater
)
0.0
0.2
0.4
0.6
0.8
1.0
1.2
1.4
0 g biochar 5 g biochar 10 g biochar 20 g biochar
Biochar treatment
A
A
A
A
A Biochar Field Trial and Demonstration Project in Eureka, Nevada Page 19 of 21 The Effect of Different Biochar Amounts on Plant Biomass Production, Plant Tissue Nutrient Content, Water Holding Capacity
5.0 Results and Discussion A basic summary of the results of the soil and plant growth studies is presented in this section. 5.1 Summary Biochar had no effect on plant biomass production from the alfalfa and corner seed mix plants. There was, however, a significant increase in plant biomass production from the reclamation seed mix plants grown in the 5 gram and 10 gram of biochar. It is possible that the soil characteristics (e.g., organic matter and soil structure) of the mine soil in combination with the biochar had a positive effect on plant biomass production. The field soil was a heavy and very dense soil that may have prevented any effects of biochar addition. Additionally, it is possible that the types of plant species present in the reclamation seed mix were more responsive to biochar addition, although it is unclear at this time what plant characteristics would have made the reclamation plant species more responsive to biochar than the corner seed mix plants. Biochar had no effect on plant nutrient content and water use efficiency for all plant species used in this study. There is some indication that biochar can have a positive effect on improving soil water holding capacity. The results indicate that there was a slight increase in soil water holding capacity for the field soil. Soil moisture holding capacity results from the mine soil are less clear than the field soil, but still there was an indication that biochar might have a positive impact on soil water holding capacity in this soil as well. Although these results are not entirely conclusive, these positive results are encouraging and lead to further questions about how to significantly improve soil water holding capacity using biochar. Some areas that could be investigated further are: 1) using biochar of different particle sizes, and 2) specific placement of biochar in the soil rather than completely mixing the biochar in the soil. The particle size of biochar used in this study was relatively large and may have acted more like small rocks and therefore increasing the soil pore size and decreasing soil water holding capacity to a certain extent. It is possible that by decreasing the biochar particle size, soil water holding capacity could be significantly improved by creating a greater surface area for water to interact with and therefore potentially increasing the water holding capacity. Specific placement of biochar in the soil may also help to improve soil water holding capacity by creating localized zones of biochar that can act as “reservoirs” that hold onto water and allow roots to grow into these zones to get needed water. In this current study, large particle sized biochar was used and mixed thoroughly with the soil. This was done because it was the most likely way that the biochar would be processed and applied to the soil; however, now that it is known that this particle size and mixing methods showed marginally significant effects on soil

A Biochar Field Trial and Demonstration Project in Eureka, Nevada Page 20 of 21 The Effect of Different Biochar Amounts on Plant Biomass Production, Plant Tissue Nutrient Content, Water Holding Capacity
water holding capacity, it is logical to further investigate the effects of different biochar particle sizes and application methods. In addition to investigating biochar particle size and placement in the soil, it would be beneficial to investigate different watering treatments. It is possible that irrigating the soil with the maximum amount of water for crop growth (using alfalfa as the standard and irrigating with approximately 3.5 acre feet of water) did not allow the biochar to fully have an effect on soil water holding capacity. It is possible that if biochar has any positive water holding capacity properties that they might not be apparent until there is a water deficit situation.
A Biochar Field Trial and Demonstration Project in Eureka, Nevada Page 21 of 21 The Effect of Different Biochar Amounts on Plant Biomass Production, Plant Tissue Nutrient Content, Water Holding Capacity
References Beesley, L., and N. Dickinson (2011) Carbon and trace element fluxes in the pore water of an
urban soil following greenwaste compost, woody and biochar amendments, inoculated with the earthworm Lumbricus terrestris. Soil Biology and Biochemistry, 43, 188-196.
Laird, D.A. (2008) The charcoal vision: a winewinewin scenario for simultaneously producing
bioenergy, permanently sequestering carbon, while improving soil and water quality. Agronomy Journal, 100, 178-181.
Lehmann, J.; A handful of carbon (2001). Nature, 447, 143-144.
Lehmann, J., J. Gaunt, M. Rondon (2006) Bio-char sequestration in terrestrial ecosystems - a review. Mitigation and Adaptation Strategies for Global Change, 11, 403-427.
Lehmann, J., M.C. Rillig, J. Thies, C.A. Masiello, and W.C. Hockaday (2011) Biochar effects on
soil biota - A review. Soil Biology and Biochemistry, 43, 1812-1836.
Liang, B., J. Lehmann, D. Solomon, J. Kinyangi, J. Grossman, B. O’Neill, J.O. Skjemstad, J. Thies, F.J. Luizão, J. Petersen, and E.G. Neves (2006) Black carbon increases cation exchange capacity in soils. Soil Science Society of America Journal, 70, 1719-1730.
Major, J., J. Lehmann, M. Rondon, and C. Goodale (2010) Fate of soil-applied black carbon:
downward migration, leaching and soil respiration. Global Change Biology, 16, 1366-1379.
Sohi, S., E. Krull, E. Lopez-Capel, and R. Bol (2010) A review of biochar and its use and
function in soil. Advances in Agronomy, 105, 47-82. Steiner, C., B. Glaser, W.G. Teixeira, J. Lehmann, W.E.H. Blum, and W. Zech (2008) Nitrogen
retention and plant uptake on a highly weathered central Amazonian Ferralsol amended with compost and charcoal. Journal of Plant Nutrition and Soil Science, 171, 893-899.
Van Zwieten, L., S. Kimber, S. Morris, K.Y. Chan, A. Downie, J. Rust, S. Joseph, and A. Cowie
(2010) Effects of biochar from slow pyrolysis of papermill waste on agronomic performance and soil fertility. Plant and Soil, 327, 235-246.