Embed Size (px)
Citation preview
NOAA Technical Memorandum NMFS-AFSC-37
A Bioenergetics Model of Walleye Pollock(Theragra chalcogramma) in the EasternBering Sea: Structure and Documentation
byT. W. Buckley and P. A. Livingston
U.S. DEPARTMENT OF COMMERCENational Oceanic and Atmospheric Administration
National Marine Fisheries ServiceAlaska fisheries Science Center
April 1994
NOAA Technical Memorandum NMFS
The National Marine Fisheries Service’s Alaska Fisheries Science Centeruses the NOAA Technical Memorandum series to issue informal scientificand technical publications when complete formal review and editorialprocessing are not appropriate or feasible. Documents within this seriesreflect sound professional work and may be referenced in the formalscientific and technical literature.
The NMFS-AFSC Technical Memorandum series of the Alaska FisheriesScience Center continues the NMFS-F/NWC series established in 1970 bythe Northwest Fisheries Center. The new NMFS-NWFSC series will be usedby the Northwest Fisheries Science Center.
This document should be cited as follows:
Buckley, T. W., and P. A. Livingston. 1994. A bioenergetics modelof walleye pollock (Theragra chalcogramma) in the eastern BeringSea: Structure and documentation. U.S. Dep. Commer., NOAA Tech.Memo. NMFS-AFSC-37, 55 p.
Reference in this document to trade names does not imply endorsement bythe National Marine Fisheries Service, NOAA.
NOAA Technical Memorandum NMFS-AFSC-37
A Bioenergetics Model ofWalleye Pollock (Theragra chalcogramma)
in the Eastern Bering Sea:Structure and Documentation
byT. W. Buckley1 and P. A. Livingston2
1
Fisheries Research InstituteSchool of Fisheries WH-10University of Washington
Seattle, WA 98195
2
Alaska Fisheries Science Center7600 Sand Point Way N.E., BIN C- 15700
Seattle, WA 98115-0070
U.S. DEPARTMENT OF COMMERCERonald H. Brown, Secretary
National Oceanic and Atmospheric AdministrationD. James Baker, Under Secretary and Administrator
National Marine Fisheries ServiceRolland A. Schmitten, Assistant Administrator for Fisheries
April 1994

This document is available to the public through:
National Technical Information Service U.S. Department of Commerce 5285 Port Royal Road Springfield, VA 22161
www.ntis.gov

Notice to Users of this Document
This document is being made available in .PDF format for the convenience of users; however, the accuracy and correctness of the document can only be certified as was presented in the original hard copy format.

iii
ABSTRACT
The need for developing a bioenergetics model for walleye
pollock in the eastern Bering Sea has been previously established.
The Fish Bioenergetics Model 2'of Hewett and Johnson was adapted
to walleye pollock. Appropriate submodels for consumption,
respiration, egestion, and excretion were selected and
parameterized. Seasonal aspects of growth, reproduction, caloric
density, and diet composition of walleye pollock are described, as
well as the seasonal water temperature and the caloric density of
walleye pollock prey. The synthesis of published and unpublished
data required for parameter estimates and seasonal descriptions is
documented and discussed for each aspect of the bioenergetics
model.

V
CONTENTS
Page
Abstract . . . . . . . . . . . . . . . .
Introduction . . . . . . . . . . . . . .
The Bioenergetics Model . . . . . . . . .
. .
. .
. .
Bioenergetic Submodels and Parameters .
Consumption . . . . . . . .
Respiration . . . . . . . .
Egestion and Excretion . .
Seasonal Characteristics . . . .
Growth . . . . . . . . . . .
Predator Caloric Density . .
Reproduction . . . . . . . .
Temperature Regime . . . . .
Prey Caloric Density . . . .
Diet Composition . . . . . .
Conclusions . . . . . . . . . . . .
Acknowledgments . . . . . . . . . .
Citations . . . . . . . . . . . . . .
Appendix A. Qlo versus slope . . . . .
. .
. .
. .
. .
. .
. .
: *
. .
. .
. .
. .
. .
. .
. .
. .
. .
. .
. .
. .
. .
. .
. .
. .
. .
. .
. .
. . . .
. . . . .
. . . . .
.
. .
. .
Appendix B. Growth, walleye pollock caloric density,temperature, prey caloric density, and,diet composition data . . . . . . . . . .
Appendix C. Corrected calculations of energy lossesdue to spawning by walleye pollock . . .
.
. .
. .
. .
. .
iii
1
2
3
3
6
12
13
16
20
21
24
25
28
29
32
33
41
45
53


INTRODUCTION
Walleye pollock (Theragra chalcogramma) support the world's
largest single-species fishery and comprise 67% of the total
groundfish biomass in the eastern Bering Sea (Wespestad 1993).
Cannibalism by adult walleye pollock has been identified as the
major source of predation mortality for juvenile walleye pollock
in the eastern Bering Sea (Livingston et al. 1986, Livingston
1991, Livingston et al. 1993).
Estimates of predation mortality exerted by adult walleye
pollock on economically important species in the eastern Bering
Sea are based on estimates of daily ration (Dwyer et al. 1987,
Livingston 1991, Livingston et al., 1993). Gastric evacuation
models and observed stomach fullness have been used to estimate
seasonal daily ration by size (Dwyer et al. 1987), but these are
biased low (Livingston et al. 1986, Dwyer et al. 1987).
Livingston (1991) estimates more realistic daily rations by size
based on observed annual weight gain and a generalized food
conversion efficiency for fish. However, these estimates do not
incorporate seasonal differences, and they could be improved by
applying a bioenergetics model
variation in water temperature
(Livingston 1991).
that accounts for seasonal
and prey energy content
Developing a bioenergetics model for walleye pollock in the
eastern Bering Sea required a synthesis of information on
physiological processes and how they are affected by age and the
environment. The focus of our paper was to document and justify
the submodels, parameters,, and seasonal aspects of this
2
bioenergetics model. To facilitate future improvements to this
model, we describe in detail the methods used to calculate the
parameters and to approximate the seasonal patterns that
influence walleye pollock consumption in the eastern Bering Sea.
We also discuss some of the potential biases that may be
introduced by our methods and assumptions.
THE BIOENERGETICS MODEL
Bioenergetics models can be used to predict growth from a
specified feeding regime, or 'to predict consumption from
specified growth patterns. The Hewett and Johnson (1992) "Fish
Bioenergetics Model 2" (an improved and updated version of their
earlier generalized bioenergetics model of individual fish
growth) was parameterized for walleye pollock in the eastern
Bering Sea to predict daily consumption for walleye pollock.
Bioenergetics models are based on a balanced energy equation
which states that energy in the consumed food must be used for
respiration, reproduction, or growth; or be egested or excreted.
The basic unit of this model's daily accounting of energy input
and output is the calorie, which is translated to and from
weight-dependent processes using the caloric density (calories
per gram wet-weight, or cal * 9-1) of the predator and the prey.
Applying the Hewett and Johnson (19.92) bioenergetics model
to walleye pollock requires choosing submodels and estimating
parameters for consumption, respiration, egestion and excretion.
Incorporating seasonal variation in our model is made posible by
3
including seasonal patterns in reproduction, growth, diet
composition, predator and prey caloric densities, and water
temperature.
Bioenergetic Submodels and Parameters
Justification for submodel selection and derivation of
parameters for the consumption, respiration, egestion, and
excretion submodels are explained in this section. These weight-
and temperature-dependent processes are generally assumed to be
physiological constants for a species over time and among
populations (Hewett and Johnson 1992). Some of the following
descriptions of submodels and parameters used in the
bioenergetics model are paraphrased from Hewett and Johnson
(1992). Their manual is very complete, but in the course of
parameterizing their generalized model for walleye pollock, we
felt that a
noted a few
literature.
Consumption
few parameters needed clarification. In addition, we
inconsistencies and errors in the walleye pollock
Consumption (C), in "grams-prey- * 'grams-predator' * day-1",
is described by the general equation;
c = cmax * P * f(T),
where Cmax is the maximum specific feeding rate (in g * g-1 * d-1),
f(T) is the water temperature (ºC) dependence function of the
specific feeding rate, and P is the proportion of the maximum
specific feeding rate that is achieved by the predator. In the
model, Cmax is an allometric function of-the form'
cmax = CA * WcB,
where CA is the intercept (for a 1g fish at 0ºC), CB is the
weight dependence coefficient, and W is the predator weight in
grams
There is a choice of three equations for the form of
temperature dependence in the consumption submodel. We chose
consumption model Equation 1,
where CQ is the water temperature dependence coefficient. This
is a simple exponential function and is only appropriate when the
water temperatures are below "optimum" (the temperature at which
consumption is highest) or stressful levels. For walleye
pollock, the optimum temperature for consumption is notknown,
but is probably greater than 7.8ºC because maximum consumption
increases from 3º to 7.8ºC for 30 to 60 g walleye pollock (Smith
et al. 1986). The average seasonal temperature regime for
walleye pollock in the Bering Sea does not exceed 5ºC (Chen 1983,
Dwyer, et al. 1987), which appears to be well below the optimum
temperature for consumption. Consumption model Equation 2 is
recommended for warm-water species, and consumption model
Equation 3 requires more information than is currently available
5
on the changes in maximum consumption at higher temperatures, so
these two equations were not selected.
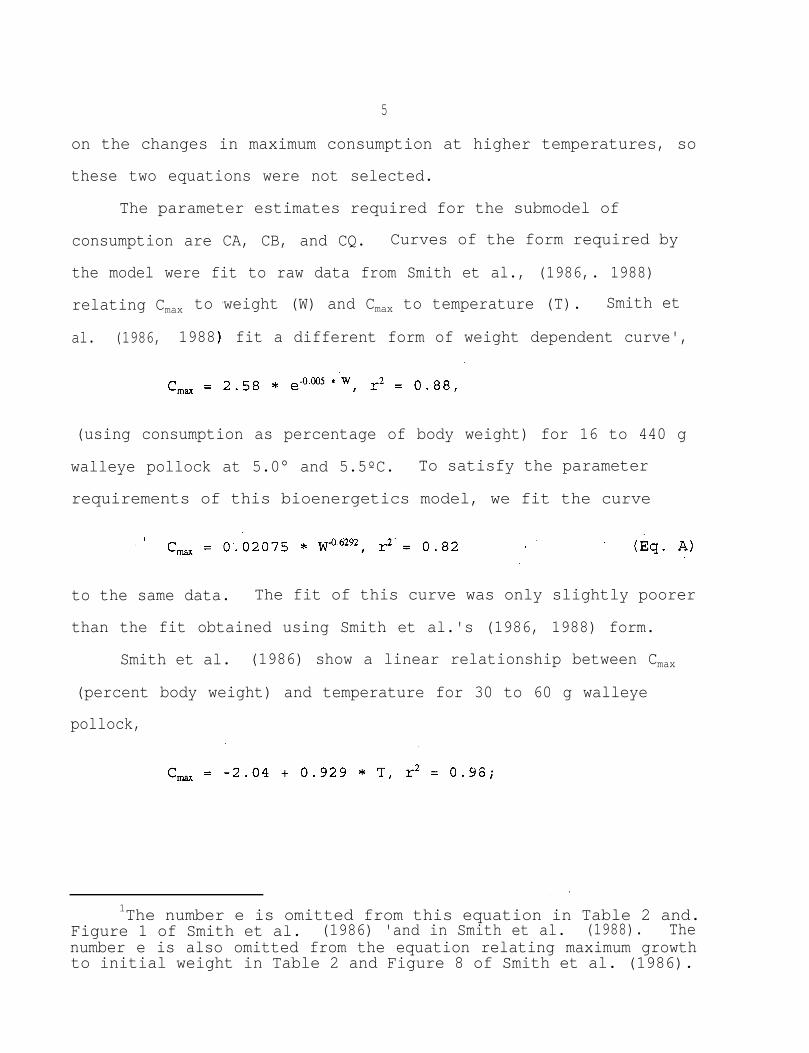
The parameter estimates required for the submodel of
consumption are CA, CB, and CQ. Curves of the form required by
the model were fit to raw data from Smith et al., (1986,. 1988)
relating Cmax to weight (W) and Cmax to temperature (T). Smith et
al. (1986, 1988) fit a different form of weight dependent curve',
(using consumption as percentage of body weight) for 16 to 440 g
walleye pollock at 5.0° and 5.5ºC. To satisfy the parameter
requirements of this bioenergetics model, we fit the curve
to the same data. The fit of this curve was only slightly poorer
than the fit obtained using Smith et al.'s (1986, 1988) form.
Smith et al. (1986) show a linear relationship between Cmax
(percent body weight) and temperature for 30 to 60 g walleye
pollock,
1The number e is omitted from this equation in Table 2 and.Figure 1 of Smith et al. (1986) 'and in Smith et al. (1988). Thenumber e is also omitted from the equation relating maximum growthto initial weight in Table 2 and Figure 8 of Smith et al. (1986).
6
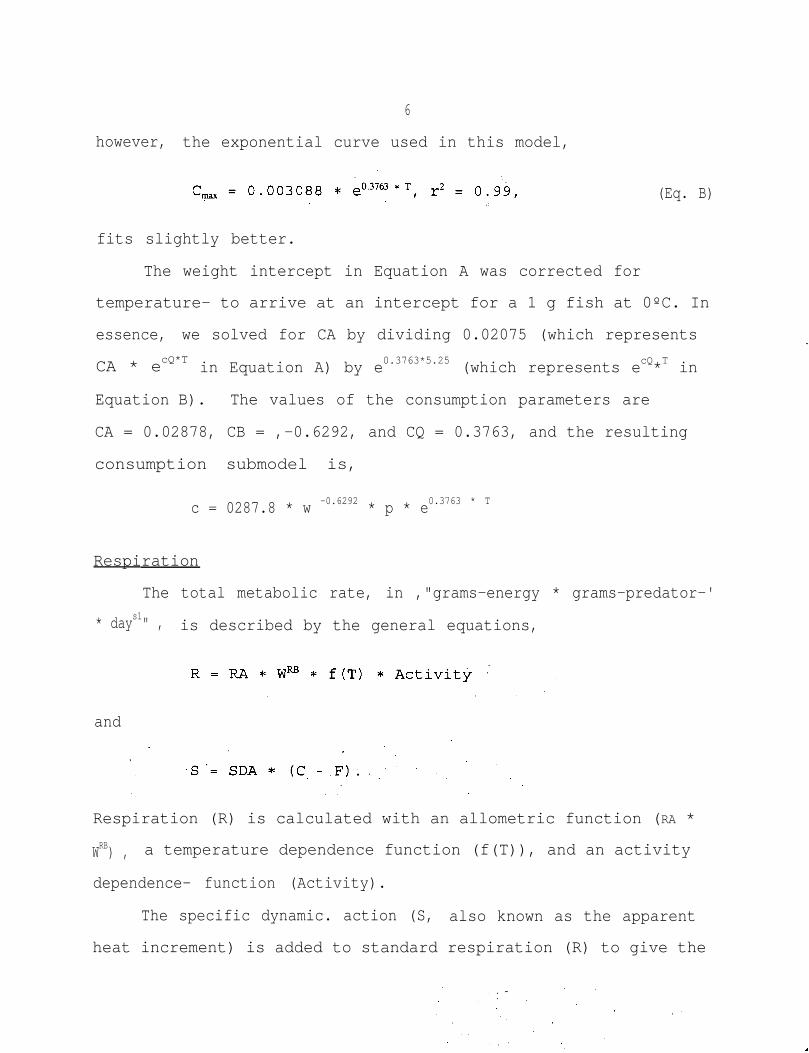
however, the exponential curve used in this model,
(Eq. B)
fits slightly better.
The weight intercept in Equation A was corrected for
temperature- to arrive at an intercept for a 1 g fish at 0ºC. In
essence, we solved for CA by dividing 0.02075 (which represents
CA * ecQ*T in Equation A) by e0.3763*5.25 (which represents ecQ*T in
Equation B). The values of the consumption parameters are
CA = 0.02878, CB = ,-0.6292, and CQ = 0.3763, and the resulting
consumption submodel is,
c = 0287.8 * w -0.6292 * p * e0.3763 * T
Respiration
The total metabolic rate, in ,"grams-energy * grams-predator-'
* days1" , is described by the general equations,
and
Respiration (R) is calculated with an allometric function (RA *
WRB) , a temperature dependence function (f(T)), and an activity
dependence- function (Activity).
The specific dynamic. action (S, also known as the apparent
heat increment) is added to standard respiration (R) to give the
7
total respiration. Specific dynamic action can be described as
the increase in standard respiration caused by digesting and
assimilating prey into usable energy or tissue. It is expressed
as a
C is
(see
proportion (SDA) of the digested food energy (C - F), where
the total consumption and F is the amount egested as feces
Egestion and Excretion section below). Harris (1985)
calculated the specific dynamic action to be 10% of the consumed
energy and he estimated the digested food energy to be 80% of the
consumed energy. Therefore,- the specific dynamic action is 12.5%
of the digested food energy, and SDA = 0.125.
The respiration allometric function (RA * WRB) describes the
weight (W) dependence of respiration where RA is the intercept
(for a 1 g fish at the temperature causing-the highest
respiration), measured in "grams-O2 * grams-predator" * day-'",
and RB is the weight dependence coefficient.
There is a choice of two equation sets to describe the
temperature dependence function in the respiration submodel.
Respiration model Equation Set 2 was chosen for walleye pollock
because respiration model Equation Set 1 requires information
about the dependence of the metabolism on swimming-speed, which
is not available for walleye pollock. The respiration model
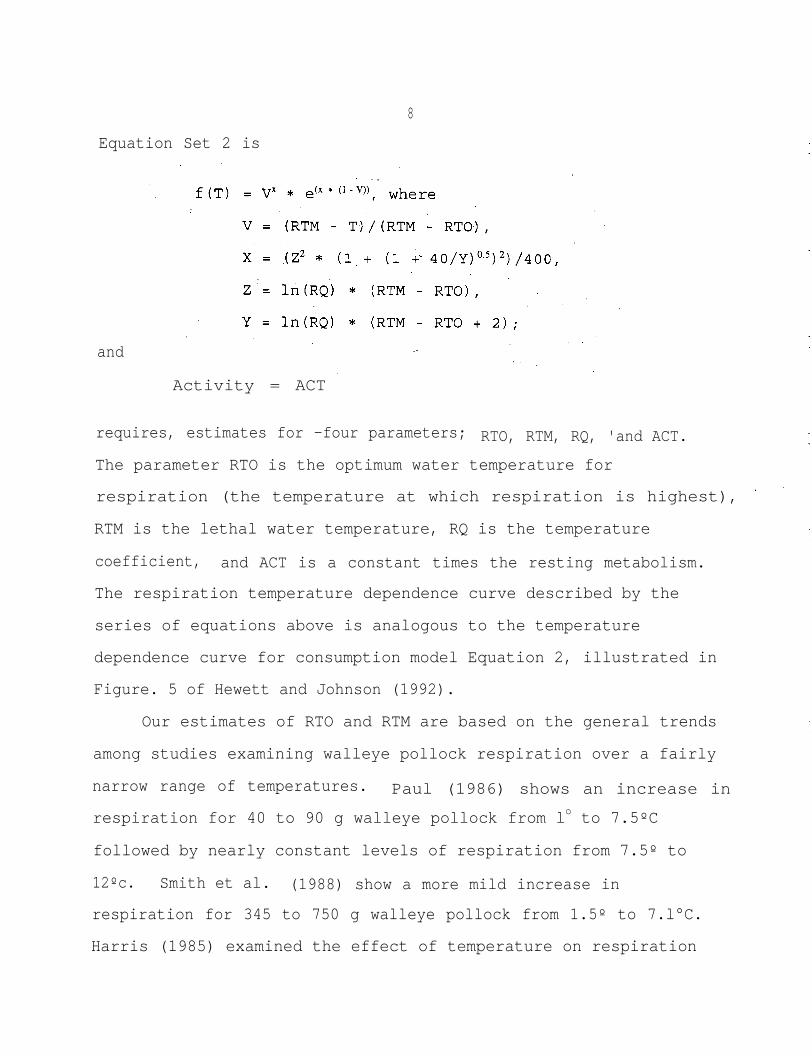
8
Equation Set 2 is
and
Activity = ACT
requires, estimates for -four parameters; RTO, RTM, RQ, 'and ACT.
The parameter RTO is the optimum water temperature for
respiration (the temperature at which respiration is highest),
RTM is the lethal water temperature, RQ is the temperature
coefficient, and ACT is a constant times the resting metabolism.
The respiration temperature dependence curve described by the
series of equations above is analogous to the temperature
dependence curve for consumption model Equation 2, illustrated in
Figure. 5 of Hewett and Johnson (1992).
Our estimates of RTO and RTM are based on the general trends
among studies examining walleye pollock respiration over a fairly
narrow range of temperatures. Paul (1986) shows an increase in
respiration for 40 to 90 g walleye pollock from lo to 7.5ºC
followed by nearly constant levels of respiration from 7.5º to
12ºc. Smith et al. (1988) show a more mild increase in
respiration for 345 to 750 g walleye pollock from 1.5º to 7.l°C.
Harris (1985) examined the effect of temperature on respiration
9
for 50 to 250 g walleye pollock and, although his data are biased
high (Harris 1985), he found that the respiration increased more
rapidly with temperature between 6º and 10°C than between 3º and
6ºC. The temperature which yields the highest respiration (RTO)
is likely to be between 7.5º and 10°C, therefore RTO is set at
9ºc. The lethal temperature for walleye pollock is greater than
15ºC (Yoshida and Sakurai 1984), and RTM is set at 16ºC. Lacking
further information, we make the assumption that RTO and RTM are
the same for all walleye pollock 2 years of age or older.
The respiration temperature coefficient, RQ, is not clearly
described in Hewett and Johnson (1992), but they say the
analogous parameter in consumption model Equation 2, CQ,
"approxrmates a Qlo for the rate at which the function increases
over relatively low temperatures." Respiration equation set 2
was first used by Kitchell et al. (1977) and they describe RQ as
the slope for temperature dependence of standard respiration or
approximately the Qlo for respiration. A Qlo is the increase in a
rate associated with a 10°C increase in temperature (Paul 1986)
and is defined mathematically as
where rate, is the rate at a temperature (T1) and rate, is the
rate at a higher temperature (T2) (Harris 1985). A Qlo is
independent of the units used to measure a rate, but the slope
for temperature dependence is not (Appendix A). For walleye
pollock, the parameter RQ is estimated by the Qlo of respiration-
10
temperature relationships reported in the literature, and the
parameters RA and RB are estimated using the respiration rates
converted from "1-0, * g-' * h-'I' in the literature to "g-O,'* g-' *
d-1 II in the model using "24 hr * d-l", "1~ 1 * l,OOO,OOO pl-'" and
"1.429 g-02 * (l-02)-l/
Paul (1986) found the linear increase in respiration for 40
to 90 g walleye pollock to be
R(g-02 * g-l * d-l) = 0.000433 + 0.000273 * T, r2 = 0.98
between lo and 7.5ºC with a Qlo of 6.04. Smith et al. (1988)
found the increase in respiration for 345 to 750 g walleye
pollock to be
R(g-0, * gI * d-l) = 0.000681 + 0.000053 * T, r2 = 0.999
between 1.6º and 7.1°C with a Qlo of 1.8. Harris (1985) found
intermediate respiration Qlo values for intermediate-sized walleye
pollock. The RQ values determined for walleye pollock decrease
with increasing' size, therefore the RQ (weight) values input into
the model approximately correspond to weight ranges as follows,:
RQ(<100 g) = 6.04; RQ (100-299 g) = 4.5; RQ(300-400 g) = 3.0;.and
RQ(>400 g) = 1.8.
The parameters RA and RB are derived from the allometric
relationship defined by the equation'
for 6 to 750 g walleye pollock at 5.5ºC (Smith et al. 1988).
11
In respiration model Equation Set 2 the specific standard
metabolism, RA, should be in terms of a 1 g fish at the optimum
temperature for respiration (RTO =.9ºC), and the change in
metabolism with the 3.5ºC difference in temperature will be
greater for smaller walleye pollock. Using the slopes of
respiration with temperature given by Paul (1986; walleye pollock
cl00 g) and Smith et al. (1988; walleye pollock >400 g), and
intermediate slopes for walleye pollock (100-299 g and
300-400 g), the values for RA that correspond to approximate size
ranges are calculated by
RA(<lOO g) = 0.005933 t 0.000273 * 3.5;
RA(lOO-299 g) = 0.005933 t 0.000200 * 3.5;
RA(300-400 g) = 0.005933 + 0.000127 * 3.5; and
RA(>400 g) = 0.005933 + 0.000053 * 3.5
with RA (<100 g) = 0.0069, RA(lOO-299 g) = 0.0066, RA(300-400 g) =
0.0063, and RA(>400 g) = 0.0061. The weight dependence
coefficient, RB, is -0.26.
The activity multiplier, ACT, depends on the average level
of active respiration above the level described by the other
parts of the respiration submodel. A resting, non-feeding level
of respiration is described by the above parameters, and the
respiration of active, feeding walleye pollock is about double
the resting, non-feeding level (Smith et al. 1988). Smith et al.
(1988) calculated the metabolic rate of walleye pollock fed a
maintenance ration in aquaria to be 1.55 times higher than
resting, non-feeding levels. If walleye pollock respiration in
12
the Bering Sea is 2 times the resting, non-feeding levels; and
specific dynamic action accounts for respiration that is 1.55
times resting, non-feeding levels, then the activity multiplier,
ACT', is 2/1.55 which equals 1.3. This is generally in agreement
with Johnston and Battram (1993) who' found that the elevation of
respiration above resting,. non-feeding levels appears to be
caused primarily by specific dynamic action.
Using the weight-specific parameters for walleye pollock
greater than 400 g as an example, the equations for the
respiration submodel are
where
'and
S = 0.125 * (C - F).
Egestion and Excretion
There is a choice of three equation sets to describe the
egestion of feces and excretion of nitrogenous waste, and we
chose equation set 1. Egestion and excretion equation sets 2 and
3 incorporate water temperature and consumption to describe these
13
processes. Bartell et al. (1986) conclude that this is
unnecessarily complex when computing growth or consumption.
Egestion (F) and excretion (U) are modelled is constant
proportions in "grams-waste * grams-predator-1' * day-1" in equation
set 1, as
F = F A * C
and
U = UA * (C - F),
where FA is the fraction of consumed 'food (C) that is egested and
UA is the fraction of the digested food energy that is excreted.
Harris (1985) estimates that 20% of the food consumed by walleye
'pollock is egested (based
Harris et al. (1986)
11% for ammonia-excreting
on Winberg 1956), so FA = 0.2.
suggest using a nitrogen correction of
predators that feed on walleye pollock.
The nitrogen correction is based on the energy released during
the combustion of nitrogenous compounds to N2 that cannot be
obtained when these compounds are metabolized to NH, or urea
(Harris et al. 1986). The 11% nitrogen correction is represented
in the excretion parameter, and UA = 0.11.
Seasonal Characteristics
Seasonal patterns in individual growth, spawning, caloric
density, diet composition, and frequented temperatures have been
observed for walleye pollock. Many of these seasonal patterns
appear to differ substantially between the northwest and
southeast areas of the eastern Bering Sea shelf (Fig. l), as -do
the oceanographic conditions (Smith 1981).
Seasons in the bioenergetics model are based primarily on
observed seasonal growth and caloric density patterns. When
estimating consumption from observed growth of an individual, the
model must calculate the amount of calories needed to get from
the total body calories at the beginning of the time period to
the total body calories at the end of the time period.
Therefore, it is important to specify at least those points that
are near observed minima and maxima of annual weight and caloric
density patterns. The model has been set up with four equal
seasons. with the model year beginning on 15 March:
The seasonal patterns used in our model, and how they are
established,- are explained for each seasonal characteristic
below. Generally, these patterns are based on long-term averages
and are meant to represent the seasonal conditions experienced by
an average walleye pollock.- Individual and interannual
differences can be explored by changing the seasonal
characteristics used in the model. To aid in this, we discuss
how the behavior of walleye pollock may influence the seasonal

Figure 1. --Map showing the southeast (SE) and northwest (NW) areas of the eastern BeringSea shelf and the 200 m isobath.
16
patterns in the data, and identify some of the potential biases
introduced by our assumptions about the data. In addition, some
comments are provided that may be helpful to users of the Hewett
and Johnson (1992) bioenergetics model and we attempt to correct
a few of the errors that we found in the literature.
Growth
Growth of walleye pollock is given to the model in "grams"
for the beginning and ending weight of each time period for an
individual. Seasonal variations in walleye pollock growth were
proposed by Maeda (1972) and investigated by Chen (1983). Chen's
(1983) results indicate that the monthly weight increment in the
"feeding season" (June-September) was greater than the weight
increment in the "transitional season" (October-May). Seasonal
differences in growth (with negative growth in some areas and
seasons) were found in length-at-age data from 1976 through 1983
by Lynde et al. (1986). They concluded that the observed pattern
could be due to seasonal migration and length-dependent swimming
speed of the migrating' walleye pollock.
The growth rate of walleye pollock inhabiting the southeast
shelf of the eastern Bering Sea is faster than that of walleye
pollock inhabiting the northwest shelf (Lynde et al. 1986,
Hinckley 1987). The seasonal growth patterns of walleye pollock
from these two areas were examined using monthly weight-at-age
17
data from 1981 through 1990, provided by Vidar Wespestad (pers.
commun.2). The-variance of the monthly weight-at-age data is
high for each year, as it, is in other studies (Chen 1983), and a
consistent seasonal trend in the growth among years is unclear.
The weighted mean of the monthly weight-at-age was calculated for
all years combined. For March, June, September and December, the
mean was calculated using monthly weight-at-age data for these
and their respective preceding and following months (e.g., the
mean for March was calculated using weighted means of the monthly
weight-at-age data from February, March, and April),. An area-
specific seasonal pattern of growth emerged for the northwest and
southeast areas of the eastern Bering Sea shelf (Fig. 2) that is
consistent with the seasonal observations by Chen (1983) and with
the areal differences found by Lynde et al. (1986) and Hinckley
(1987). The general seasonal pattern is visible by age 2, but it
breaks down in these data at ages 8 and 10 in the northwest and
southeast areas respectively. This is apparently due to low
sample sizes and increased measurement error for older walleye
pollock.
It is likely that seasonality in the growth of walleye
pollock exists based on the seasonality in condition factor
(Harris et al. 1986) and feeding rates (Dwyer et al. 1987, Maeda
1972), but the potential influence of seasonal and lifetime
movement patterns should be considered. Lynde et al. (1986)
2Alaska Fisheries Science Center, 7600 Sand Point Way N.E., BINC15700, Seattle, WA 98115-0070, U.S.A., March 1993.
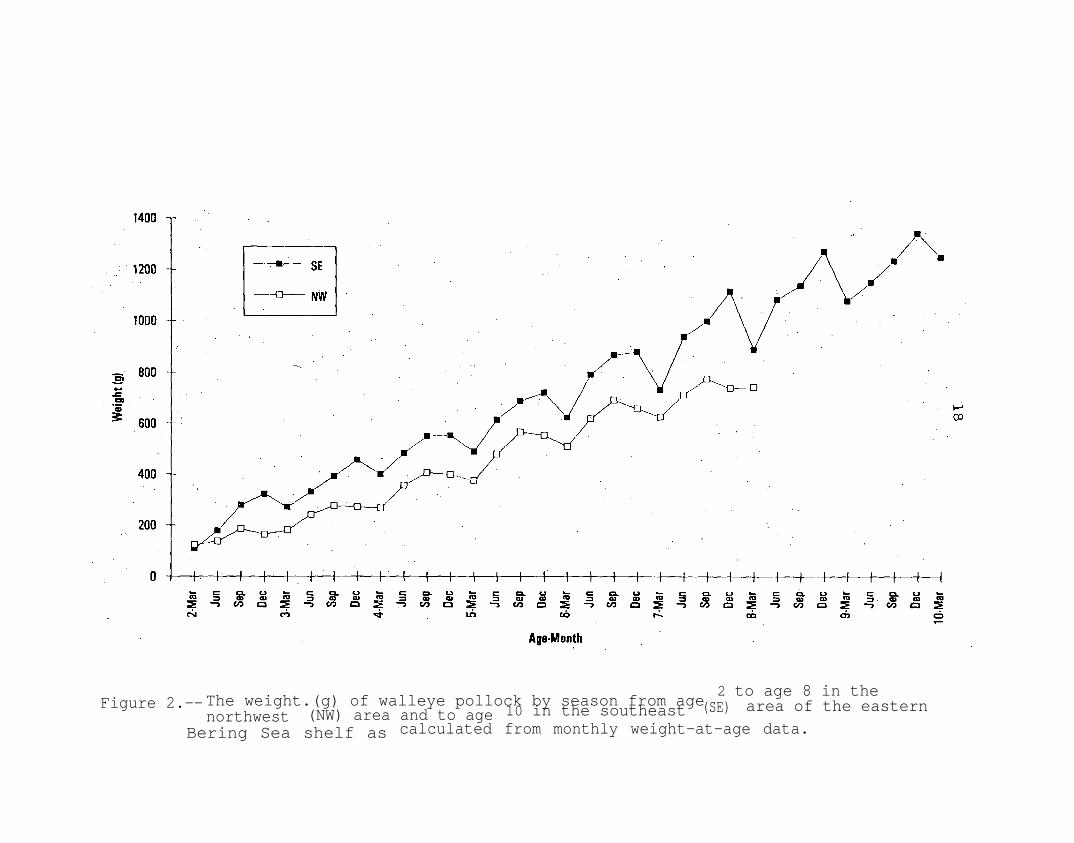
Figure 2.--The weight.(g) of walleye pollock by season from age2 to age 8 in the
northwest (NW) area and to age 10 in the southeast (SE) area of the eastern
Bering Sea shelf as calculated from monthly weight-at-age data.
describe how seasonal on- and off-continental shelf migrations,
stratified by size, can affect the observed size-at-age in areas
with migrating fish. It is likely that the apparent extremely
negative winter growth in the southeast area is the result of
slower growing walleye pollock immigrating from the Aleutian
Basin in the spring (Lynde et al. 1986), and we think it may be
more conservative to assume there is no winter weight loss in the
southeast area.
While seasonal movements may have a large effect on the
apparent growth pattern, long-term movements can also have some
influence. A general southeastward movement (or dispersal) with
age was inferred from the spatial distribution of walleye pollock
by age over the eastern Bering Sea shelf (Pierre Dawson, pers.
commun. 3 ) . The growth curve for walleye pollock in the southeast
area will be biased low as smaller size-at-age fish immigrate
from the northwest area. In addition, if this general movement
is size-dependent with larger size-at-age fish moving faster,
then the growth curve for walleye pollock in the northwest area
will be biased low as well.
It may be impossible to determine the degree of influence
that movement patterns, size-dependent movement rates/and
spawning losses (see Reproduction section below) have on the
actual seasonal growth pattern of walleye pollock. In the model,
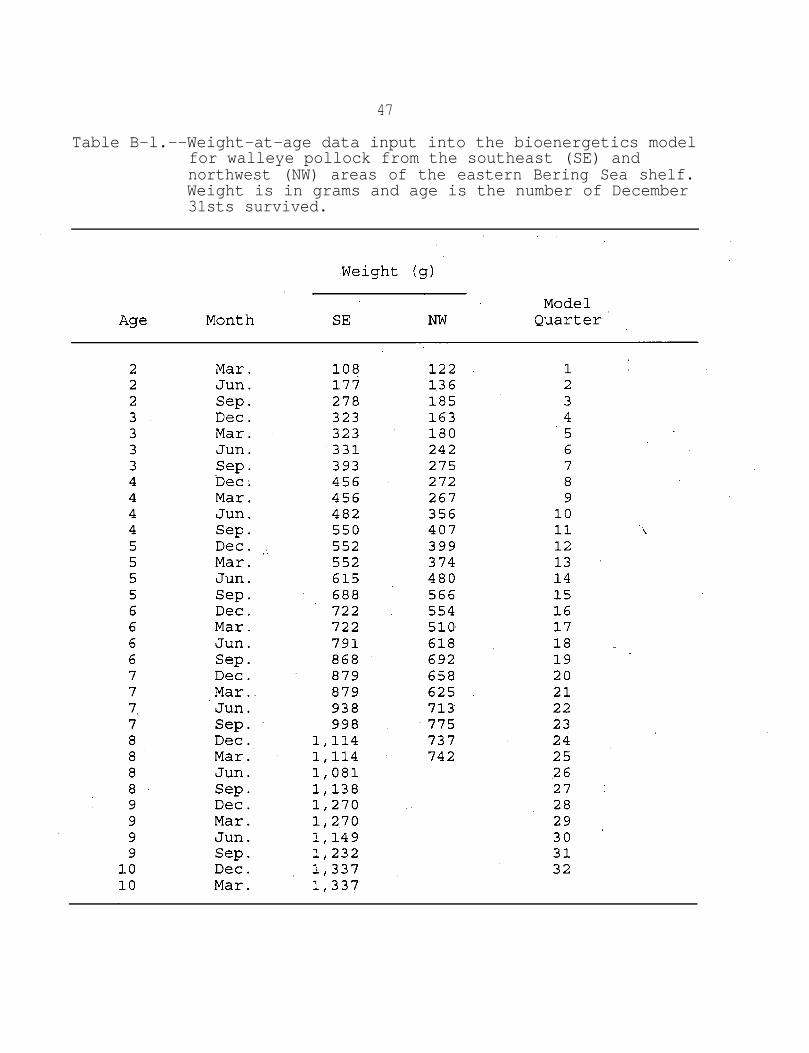
the weights in Appendix Table B-l can be input as the beginning
3A1aska Fisheries Science Center, 7600 Sand Point Way N.E., BINC15700, Seattle, WA 98115-0070, U.S.A., June 1993.
2 0
and ending weights for each season. This seasonal pattern of,
growth is in general agreement with seasonal patterns in
frequency of empty stomachs (Dwyer et al. 1987); in mean stomach
weight (Dwyer et al. 1987), in condition factor (Chen 1983) and
in caloric density (Harris et al. 1986) of walleye pollock, and
these may all be related to prey availability (Cooney 1981). A
reasonable but unlikely lower bound on the seasonality of growth
may be to assume that growth is constant among seasons (however,
fluctuations in caloric density will retain some of the
seasonality in the model).. This assumption will- generally cause'
the consumption to be underestimated in seasons of high growth
and overestimated in seasons of low or negative growth:
. 'Predator Caloric Density
The caloric density (using wet weight) of the predator, in
"calories * grams-predator'", can be modelled as a linear
function of body weight or input as a seasonal function for each
age class. The caloric density (using- dry weight) of juvenile
walleye pollock has been shown to vary seasonally, and to a
lesser extent, vary with body size, (Harris et al. 1986). Several
sources of data on the caloric density of walleye pollock (using
wet weight) from different areas were examined and a seasonal
pattern emerged (Appendix Table B-2). Although the data are
limited, the seasonal pattern. appeared to be somewhat independent
of body size for walleye pollock, age 2 and older. T h e r e f o r e ,
seasonal caloric density changes were input into the model, but
weight-dependent change's in caloric density were not.
21
The seasonal pattern for the caloric density of walleye
pollock is given as a low of 950 cal * g-1 on 15 March (day 1 in
the model year) and a high of 1,400 cal * g-1 on 15 September (day
185 in the model year). All intermediate values are calculated
by linear interpolation
section below).
The energy content
in the model (see Prey Caloric Density
of organisms is measured in several
different units in the literature and most conversions to cal *
g-1 (wet weight) are easily obtainable. The following conversions
may be useful in some instances: 1 cal = 4.1868 absolute joules
(J), and 1 British thermal unit (Btu) = 251.996 cal = 1055.07 J.
In addition, the caloric density, or heat of combustion, is
commonly expressed in "cal * g-1", "J * g-'" and "Btu * lb-1" , and 1
cal * g-l = 1.8 Btu * lb-1.
Reproduction
Energy lost to reproduction is modelled as a fraction of
weight (or total body energy) lost on a given day, beginning at a
given year of life. Spawning dates of 1 April (day 17) on the
southeast shelf (Smith 1981, Hinckley 1987) and 15 July (day 123)
on the northwest shelf (Hinckley 1987) were set in the model.
The age at first spawning was set at 4 years (Wespestad 1993).
Although the spawning loss is modelled as a l-day event,
walleye pollock have a protracted spawning period (about 4 to 6
weeks) during which they apparently do not feed (Smith 1981).
However, when the total spawning energy loss is known, the
average daily ration for the time period will be very similar
22
whether the total energy loss of spawning is modelled as a l-day
loss of energy or a protracted loss of energy (Hewett and Johnson
1992 ). 1
The energy lost during the spawning event, including any
starvation that may occur, is about 25.2% of the total body
energy (Smith et al. 1988)4. This is composed of a 14.35% weight
loss from the pre-spawning weight accompanied by a reduction in
caloric density. We assumed that the weight loss due to spawning
was included in the quarterly weight-at-age data (see Growth
section above). We made an additional assumption that the
reduction in caloric density resulting from spawning was not
represented in the seasonal predator -caloric density file; known
post-spawning caloric densities were omitted from the calculated
averages (see Predator Caloric Density section above).
The measurement of energy losses due to spawning were
conducted in the Gulf of Alaska (Smith et al. 1988.) where the
walleye pollock spawn at about the same time as in the 'southeast
area of the eastern Bering Sea shelf (Hinckley 1987, Smith et al.
1988), and they appear to follow a similar seasonal caloric
density pattern (Appendix Table B-2). Therefore, the spawning
loss parameter was first, calculated for walleye pollock on the
southeast shelf-. The total energy loss is 25.2% and we assumed
that 14.35% was accounted for by lost weight, so the remaining
10.85% must be accounted for by the spawning loss parameter.
4Due to calculation errors, this paper concludes that about 46%of the body energy is lost during spawning. The' correctcalculation of their published data is presented in Appendix C.
23
This 10.85% of the pre-spawning, total body energy divided by the
remaining body weight (85.65%) yields the proportion of the
remaining body energy (0.127) that is lost. Hence, the spawning
loss parameter was set at 0.127 for walleye pollock on the
southeast shelf.
The weight-fecundity relationship appears to be similar in
the southeast and northwest shelf areas (Hinckley 1987).
Therefore, the weight-specific energy loss that resulted in the
southeast area due to spawning,
was applied in the northwest area to correct for differences in
the specified seasonal caloric density on the day of spawning,
and the spawning loss parameter for the northwest shelf was set
at 0.101.
Different values of the spawning loss parametermay be used
under alternative assumptions. If we assume the total spawning
energy loss is already represented, then the spawning loss
parameter would be set at 0.0. If we assume none of the spawning
energy loss is represented, then the spawning loss would be set
at 0.252. The spawning loss values of 0.127 and 0.101 for
walleye pollock on the southeast and northwest shelf are
intermediate of these two extreme possibilities.-
2 4
Under- or overestimation of the spawning losses may result
respectively in under- or overestimation of the consumption by
walleye pollock. Setting the first year of spawning at age 4 may
underestimate the average energy loss during the spawning season
for age-3 walleye pollock, especially on the southeast shelf, and
overestimate the average energy loss for age-4 walleye pollock on
the northwest shelf. Smith (1981) found 50% of walleye pollock
males and females to be sexually mature at 31 cm (about 206 g)
and 34 cm (about 275 g), respectively. The first spawning season
when these sizes are attained, on average, is at age-3 in the
southeast and age 4 in the northwest areas of the eastern Bering
Sea shelf (see Growth section above) .
The effect that the weight' loss due to spawning has on the
weight-at-age data can only be estimated, and it may cause some
bias in the observed seasonal growth, and therefore the predicted
seasonal consumption. 'The' observed growth during the season
preceding a weight estimate reduced by spawning. may be biased low
and the observed growth-during the season following a weight
estimate reduced by spawning may be biased high.
Temperature Regime
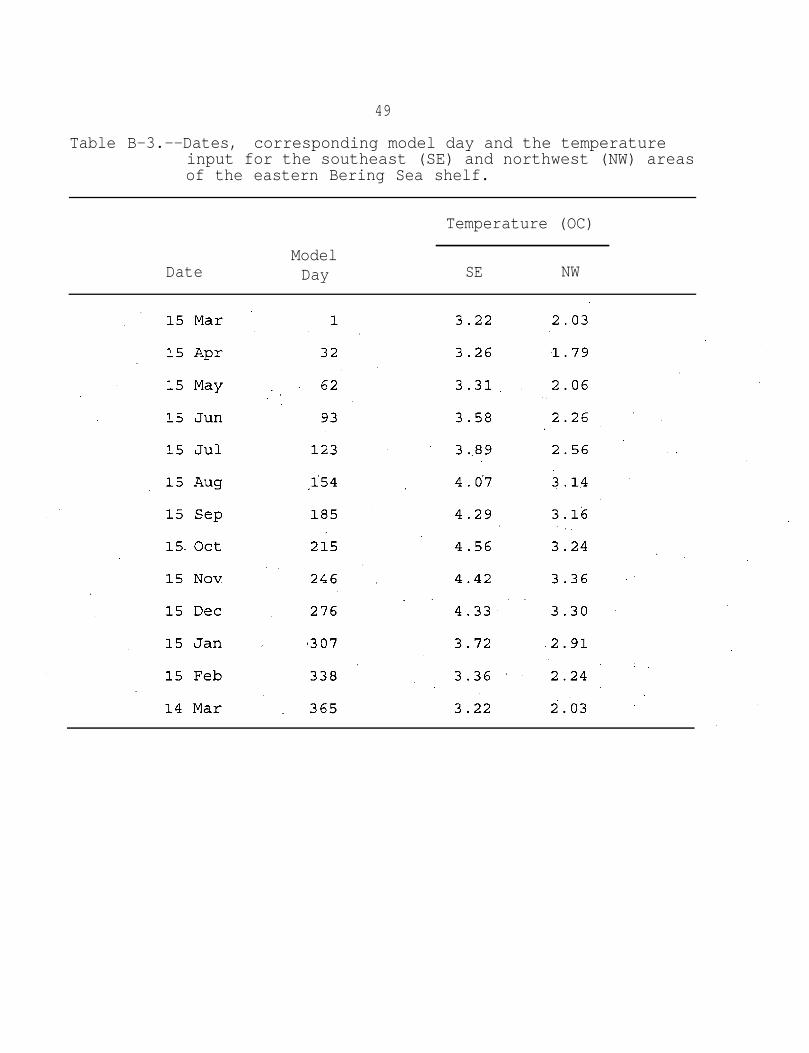
Seasonal temperature (ºC) changes were input by specifying
temperatures on chosen days. The specified temperatures
(Appendix Table B-3) were based on observed mean bottom
temperatures for 1953 through 1982 (Ingraham 1983) in areas where
walleye pollock are-the most common (Wilson and Armistead 1991,
Bakkala et al. 1992) 'in the eastern Bering Sea. The daily
25
temperatures between the days where temperatures are specified in
the input file are interpolated by the model (Fig. 3).
Although sea surface temperature and bottom temperature data
are available for much of the-Bering Sea shelf throughout the
year, the degree of behavioral thermoregulation in walleye
pollock is unknown. The temperatures given in Appendix Table B-3
are similar to what larger juveniles and adult walleye pollock
are believed to "prefer" in the eastern Bering Sea (Chen 1983).
The model
temperature."
occurs and the
also requires input of a "maintenance
This is the temperature below which zero growth
predator consumes food at a rate equal to its
energy expenditure each day. This temperature must be, set above
the above input temperatures to have any effect on the model's
output. The maintenance temperature will be set at O.O°C and
will have no effect on the model because the temperature regime
that we input into the model never drops below 1.5ºC.
Prey Caloric Density
Model inputs of caloric densities of the prey (up to 10 prey
categories in the model), in "calories * grams-prey-'", were
seasonally varied. The seasonal changes in caloric density for
the 10 prey categories (Fig. 4 and Appendix Table B-4) were
estimated from published and unpublished literature (Davis 1993)
with an emphasis on values determined for Bering Sea samples
(Harris 1985), as well as estimates based upon the trophic level
of the prey category. The seasonal trend in caloric density for
the prey categories of walleye pollock, other Gadidae and other
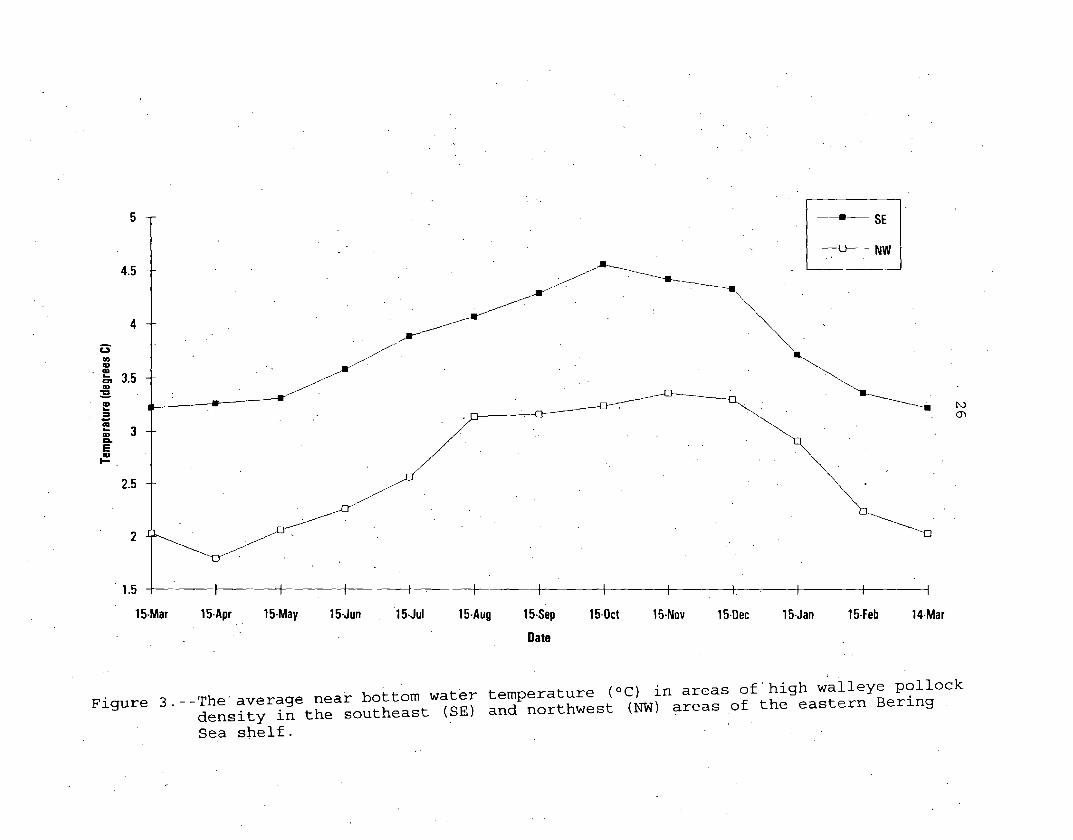
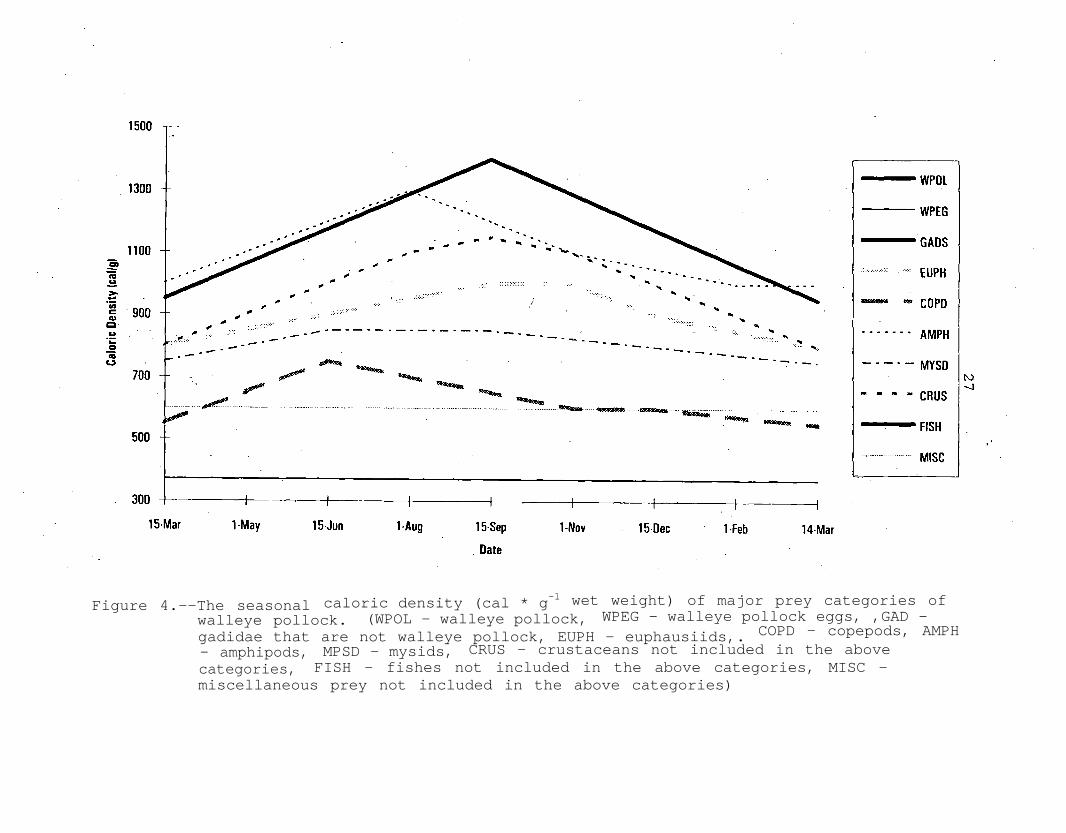
Figure 4.--The seasonal caloric density (cal * g-1 wet weight) of major prey categories ofwalleye pollock. (WPOL - walleye pollock, WPEG - walleye pollock eggs, ,GAD -gadidae that are not walleye pollock, EUPH - euphausiids,. COPD - copepods, AMPH
- amphipods, MPSD - mysids, CRUS - crustaceans not included in the abovecategories, FISH - fishes not included in the above categories, MISC -miscellaneous prey not included in the above categories)
28
fish was taken from the caloric density of predator walleye
pollock. No distinction was made between the southeast and
northwest shelf areas in the timing or magnitude of changes in
the caloric densities, however differences probably do exist.
-The model interpolates the caloric density between days
where it is specified in the prey caloric density input file.
However, the overall caloric density of the diet on a given day
is dependent on the prey composition, therefore large changes in
the caloric density of the diet can occur if the compositionof
the diet changes.
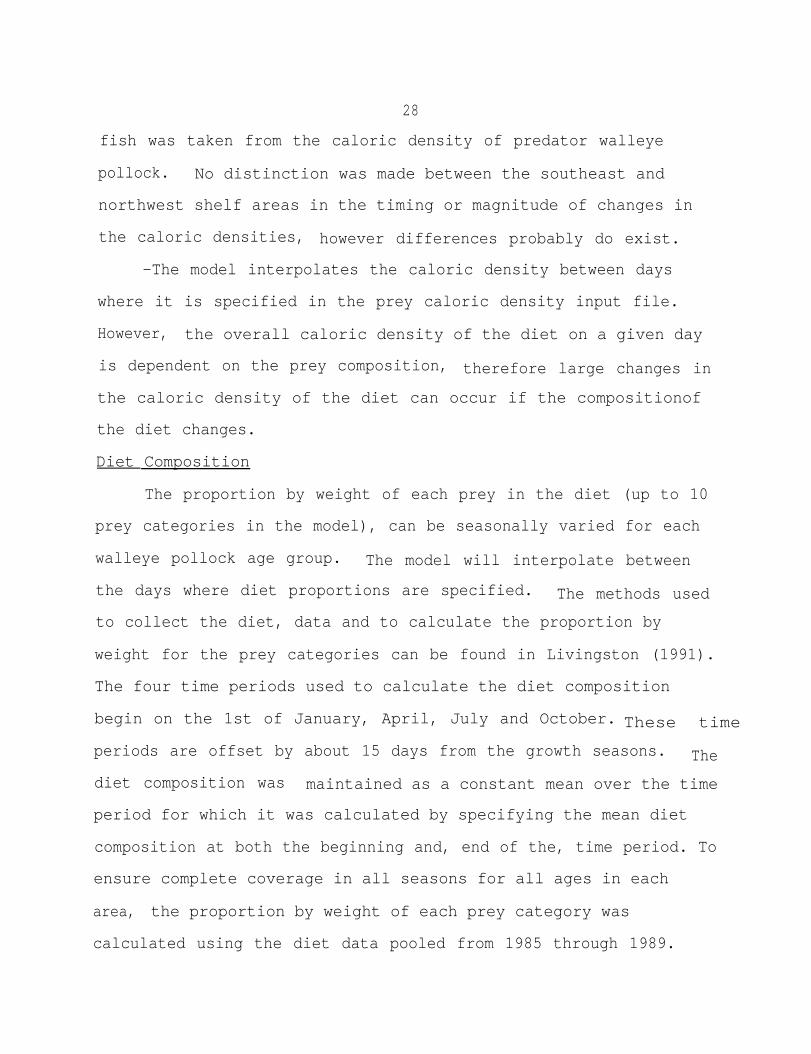
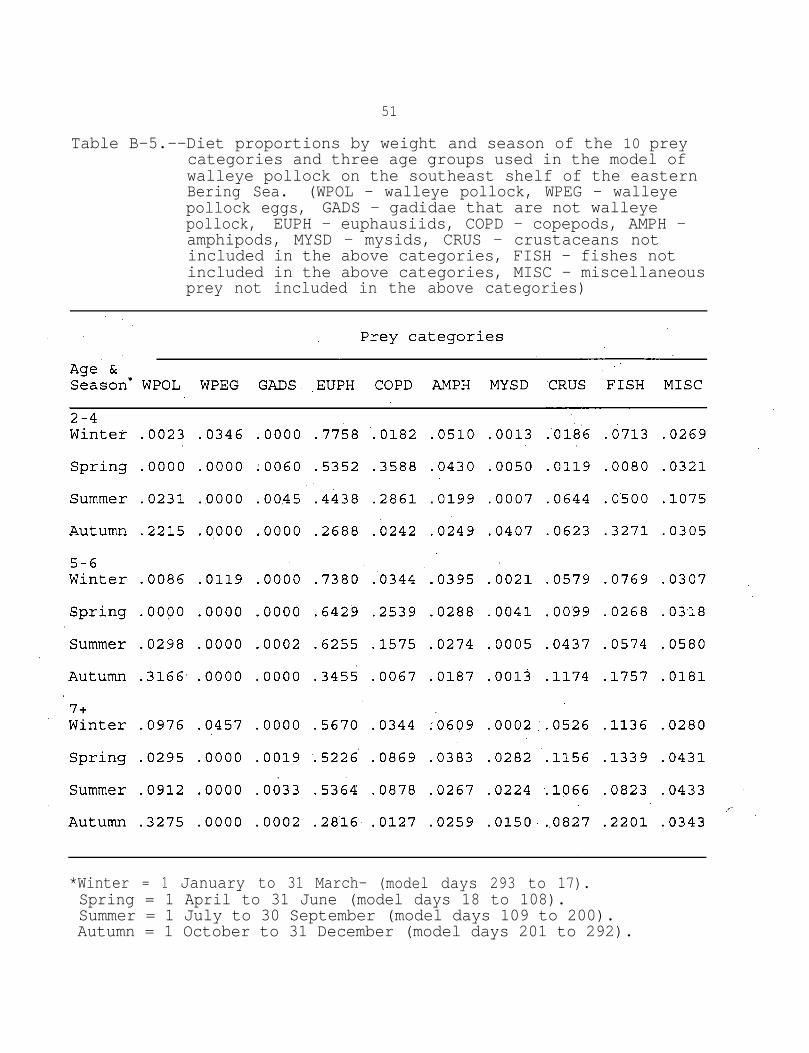
Diet Composition
The proportion by weight of each prey in the diet (up to 10
prey categories in the model), can be seasonally varied for each
walleye pollock age group. The model will interpolate between
the days where diet proportions are specified. The methods used
to collect the diet, data and to calculate the proportion by
weight for the prey categories can be found in Livingston (1991).
The four time periods used to calculate the diet composition
begin on the 1st of January, April, July and October. These time
periods are offset by about 15 days from the growth seasons. The
diet composition was maintained as a constant mean over the time
period for which it was calculated by specifying the mean diet
composition at both the beginning and, end of the, time period. To
ensure complete coverage in all seasons for all ages in each
area, the proportion by weight of each prey category was
calculated using the diet data pooled from 1985 through 1989.
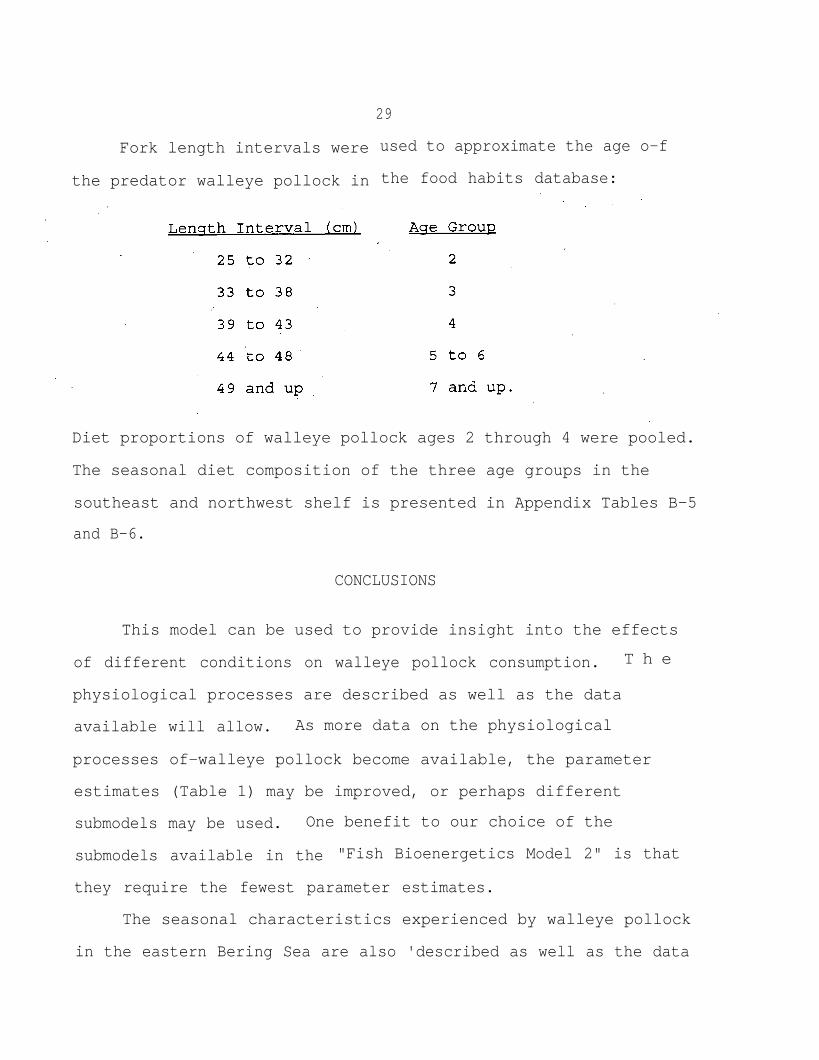
Fork length intervals were
the predator walleye pollock in
29
used to approximate the age o-f
the food habits database:
Diet proportions of walleye pollock ages 2 through 4 were pooled.
The seasonal diet composition of the three age groups in the
southeast and northwest shelf is presented in Appendix Tables B-5
and B-6.
CONCLUSIONS
This model can be used to provide insight into the effects
of different conditions on walleye pollock consumption. T h e
physiological processes are described as well as the data
available will allow. As more data on the physiological
processes of-walleye pollock become available, the parameter
estimates (Table 1) may be improved, or perhaps different
submodels may be used. One benefit to our choice of the
submodels available in the "Fish Bioenergetics Model 2" is that
they require the fewest parameter estimates.
The seasonal characteristics experienced by walleye pollock
in the eastern Bering Sea are also 'described as well as the data
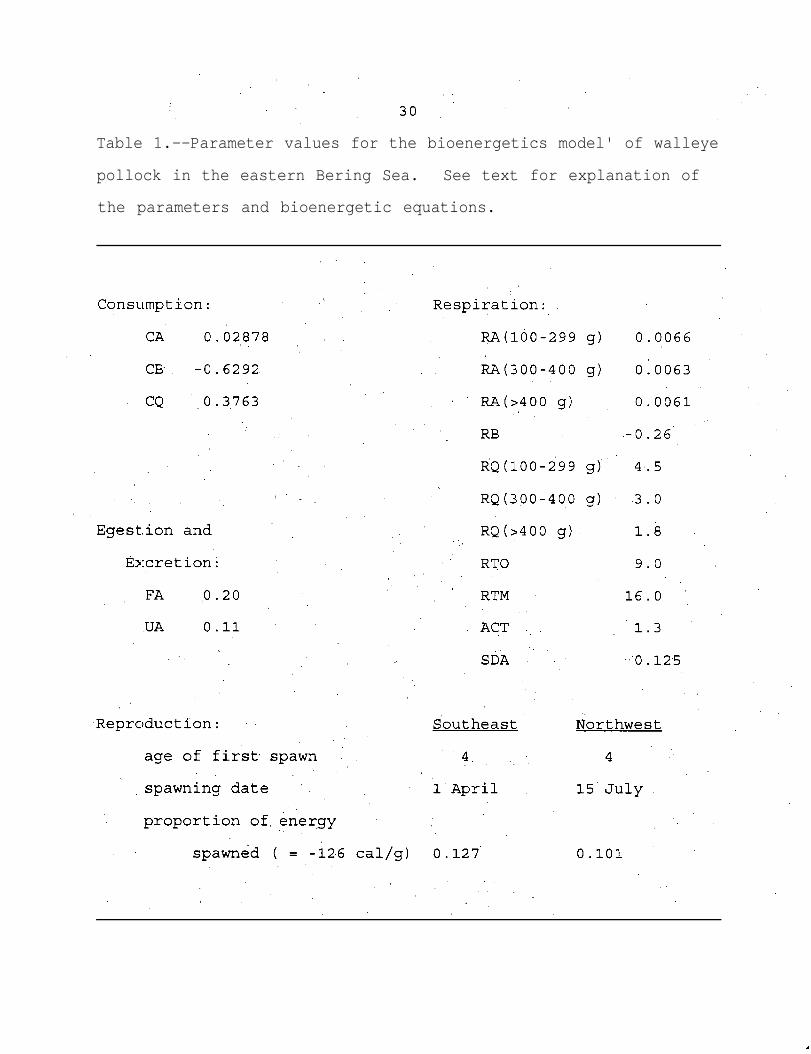
Table 1.--Parameter values for the bioenergetics model' of walleye
pollock in the eastern Bering Sea. See text for explanation of
the parameters and bioenergetic equations.
31
will presently allow. The seasonal patterns observed for many of
these characteristics must be considered in terms of the behavior
of walleye pollock and also in terms of interactions between the
characteristics. As we have discussed, some of the observed
seasonal characteristics may be somewhat biased, and thus
estimates of consumption generated by the bioenergetics model may
be somewhat biased. However, we feel that the bioenergetics
model, in its present form, will allow us to make relatively good
seasonal estimates of daily rations for walleye pollock in 'the
eastern Bering Sea.
32
ACKNOWLEDGMENTS
We are grateful to A.J. Paul for digging up and sharing raw
data that substantially improves our confidence in some of the
parameter estimates: Nancy Davis provided helpful comments on an
early draft of this paper, and later versions were thoughtfully
reviewed by Sarah Hinckley, Vidar Wespestad, and Richard Brodeur.
CITATIONS
Bakkala, R.G., W.A. Karp, G.F. Walters, T. Sasaki, M.T. Wilson,
T.M. Sample, A.M. Shimada, D. Adams, and C.E. Armistead.
1992. Distribution, abundance, and biological
characteristics of groundfish in the eastern Bering Sea
based on results of U.S.-Japan bottom trawl and midwater
surveys during-June-September 1988. U.S. Dep. Commer., NOAA
Tech. Memo. NMFS F/NWC-213, 362p.
Bartell, S.M., J.E. Breck, and R.H. Gardner. 1986. Individual
parameter perturbation and error analysis of fish
bioenergetics models. Can. J. Fish. Aquat. Sci. 43:160-168.
Chen, L.F. 1983. The effects of water temperature on the
seasonal distribution and growth of walleye pollock,
Theragra chalcosramma (Pallas), in the southeast Bering Sea.
M.S. Thesis, Univ. Alaska, Fairbanks, 92p.
Cooney;R.T. 1981. Bering Sea zooplankton and micronekton
communities with emphasis on annual production. In: D.W.
Hood and J.A. Calder (eds.), The Eastern Bering Sea Shelf:'
Oceanography and Resources, 2:947-74. Univ. Washington
Press, Seattle, Washington.
34
Davis, N.D. 1993. Caloric content of oceanic zooplankton and
fishes. for studies of salmonid food habits and their
ecologically related species. (NPAFC DOC.) FRI-UW-9312.
Fisheries Research Institute, Univ. Washington,- Seattle.
10p.
Dwyer, D.A., K.M: Bailey, and P.A. Livingston. 1987. Feeding
habits and daily ration of walleye pollock (Therasra
chalcosramma) in the eastern Bering Sea, with special
reference to cannibalism. Can. J. Fish. Aquat. Sci.
4 4 : 1 9 7 2 - 1 9 8 4 .
Harris, R.K. 1985. Body composition (carbon, nitrogen and
calories) and energetics of immature walleye pollock,
Theragra chalcogramma (Pallas), in the southeast Bering Sea.
M.S. Thesis, Univ. Alaska, Fairbanks, 116p.
Harris, R.K., T. Nishiyama, and A.J. Paul. 1986. Carbon,
nitrogen and caloric content of eggs, larvae, and juveniles
of the walleye. pollock, Theragra chalcogramma. J. Fish
Biol. 2 9 : 8 7 - 9 8 .
Hewett, S.W., and B.L. Johnson. 1 9 9 2 . Fish Bioenergetics Model
2, an upgrade of "A Generalized Bioenergetics Model of Fish
Growth for Microcomputers." Univ: Wisconsin, Sea Grant
Tech. Rep. No. WIS-SG-92-250, 79p.
35
Hinckley, S. 1987. The reproductive biology of walleye pollock,
Theragra chalcogramma, in the Bering Sea, with reference to
spawning stock structure. Fish. Bull., U.S. 85:481-498.
Ingraham, W.J., Jr. 1983. Temperature anomalies in the eastern
Bering Sea 1953-82 for the Dynumes 24 x 24 ecosystem model
grid. NWAFC Processed Rep. 83-21, 348p. Alaska Fish. Sci.
Cent., Natl. Mar. Fish. Serv., NOAA, 7600 Sand Point Way
NE., BIN C15700, Seattle, WA 98115-0070.
Johnston, I.A., and J. Battram. 1993. Feeding energetics and
metabolism in demersal fish species from Antarctic,
temperate and tropical environments. Mar. Biol. 115:7-14.
Kitchell, J.F., D.J. Stewart, and D. Weininger. 1977.
Applications of .a bioenergetics model to yellow perch (Perca
flavescens) and walleye (Stizostedion vitreum vitreum). J.
Fish. Res. Board Can. 34:1922-1935.
Livingston, P.A. 1991. Groundfish food habits and predation on
commercially important species in the eastern Bering Sea
from 1984 to 1986. U.S. Dep. Commer., NOAA Tech. Memo. NMFS
F/NWC-207, 240p.
36
Livingston, P.A., D.A. Dwyer, D.L. Wencker, M-S. Yang, and G.M.
Lang. 1986. Trophic interactions of key fish species in
the eastern Bering Sea. Int. N. Pac. Fish. Comm. Bull.
47:49-65.
Livingston, P.A., A. Ward, G.M. Lang', and M-S. Yang. 1993.
Groundfish food habits and predation on commercially
important prey species in the eastern Bering Sea- from 1987
to 1989. U.S. Dep. Commer., NOAA Tech. 'Memo. NMFS-AFSC-11,
192p.
Lynde, C.M., M.V.H. Lynde and R.C. Francis. 1986. Regional and
temporal, differences in growth of walleye pollock (Theragra
chalcogramma) in the eastern Bering Sea and Aleutian basin
with implications for
10, 48p. Alaska Fish
NOAA, 7600 Sand Point
98115-0070.
management. NWAFC Processed Rep. 86-
sci. Cent., Natl. Mar. Fish. Serv.,
Way NE., BIN C15700, Seattle, WA
Maeda, T. 1972. Fishing grounds of Alaska pollock. B ull. Jap.
Soc. Sci. Fish. 38:362-711
Miller, L.K. 1978. Energetics of the northern, fur seal in
relation to climate and food resources of the Bering Sea.
U.S. Marine Mammal Comm. Rep. MMC-75/08, 27p. (Available
from Natl. Tech. Inf. Serv., Springfield, VA,, as PB-275296.)
37
Paul, A.J. 1986. Respiration of juvenile pollock, Theragra
chalcogramma (Pallas) , relative to body size and
temperature.' J; Exp. Mar.. Biol. 'Ecol. 97:287-293.
Perez, M.A. 1994. ,-Calorimetry measurements of energy value of
some Alaskan fishes and squids. U.S. Dep. Commer., NOAA
Tech. Memo. NMFS-AFSC-32, 32p.
Smith, G.B. 1981. The biology of walleye pollock. In: D.W.
Hood and J.A. Calder (eds.), The Eastern Bering Sea Shelf:
Oceanography and Resources, 1:527-551. Univ. Washington
Press, Seattle, Washington.
Smith, R.L., A.J. Paul, and J.M. Paul. 1986. Effect of food
intake and temperature on growth and conversion efficiency
of juvenile walleye pollock (Theragra chalcogramma
(Pallas)): A laboratory study. J. Cons. int. Explor. Mer
42:241-253.
Smith, R.L., A.J. Paul, and J.M. Paul. 1988. Aspects of
energetics of adult walleye pollock, Theragra chalcogramma
(Pallas), from Alaska. J. Fish Biol. 33:445-454.
Smith, R.L., J.M. Paul, and A.J. Paul. 1989. Gastric evacuation,
in walleye pollock, Theragra chalcogramma. "Can. J. Fish.
Aquat. Sci. 46:489-93.
38
Steimle, F.W., Jr., and R.J. Terranova. 1985. Energy
equivalents of marine organisms from the continental shelf
of the temperate northwest Atlantic. J. Northwest Atl.
Fish. Sci. 6:117-124.
Stewart, D.J., D. Weininger, D.V. Rottiers, and T.A. Edsall.
1983. An energetics model for lake trout, Salvelinus
namaycush: Application to the Lake Michigan population.
Can. J. Fish. Aquat. Sci. 40:681-698.
Tyler, A.V. 1973. Caloric values of some North Atlantic
invertebrates. Mar. Biol. 1 9 : 2 5 8 - 2 6 1 .
Wespestad, V.G. 1993. The status of Bering Sea pollock and the
effect of the "Donut Hole" fishery. Fisheries 18:18-24..
Wilson, M.T., and C.E. Armistead.: 1991. 1989 bottom trawl
survey of the eastern Bering Sea continental shelf. U.S.
Dep. Commer., NOAA Tech. Memo. NMFS F/NWC-212, 212p.
Winberg G.G. 1956. Rate of metabolism and food requirements, of
fishes. Belorussian State Univ; Minsk. Fish. Res. Board
Can. Transl. Ser. 194, 239p.

39
Yoshida, H., and Y. Sakurai. 1984. Relationship between food
consumption and growth of adult walleye pollock Therasra
chalcosramma in captivity. Bull. Jap. Soc. Sci. Fish.
50:763-769.

THIS PAGE INTENTIONALLY LEFT BLANK

THIS PAGE INTENTIONALLY LEFT BLANK

APPENDIX A
Qlo versus Slope

THIS PAGE INTENTIONALLY LEFT BLANK
43
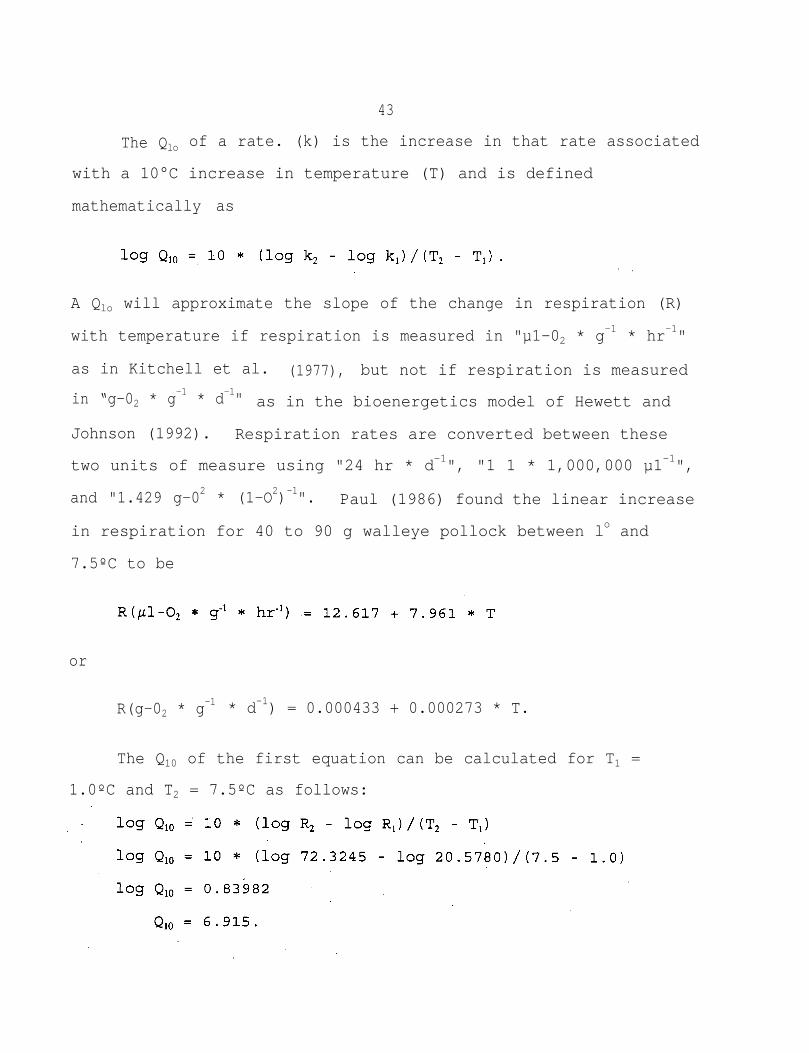
The Qlo of a rate. (k) is the increase in that rate associated
with a 10°C increase in temperature (T) and is defined
mathematically as
A Qlo will approximate the slope of the change in respiration (R)
with temperature if respiration is measured in "µ1-02 * g-1 * hr-1"
as in Kitchell et al. (1977), but not if respiration is measured
in “g-02 * g-1 * d-l" as in the bioenergetics model of Hewett and
Johnson (1992). Respiration rates are converted between these
two units of measure using "24 hr * d-1", "1 1 * 1,000,000 µ1-1",
and "1.429 g-02 * (1-O2)-1". Paul (1986) found the linear increase
in respiration for 40 to 90 g walleye pollock between lo and
7.5ºC to be
or
R(g-02 * g-1 * d-1) = 0.000433 + 0.000273 * T.
The Q10 of the first equation can be calculated for T1 =
1.0ºC and T2 = 7.5ºC as follows:
44
The slope of the first equation (7.961) approximately equals the
Qlo (6. 915) .
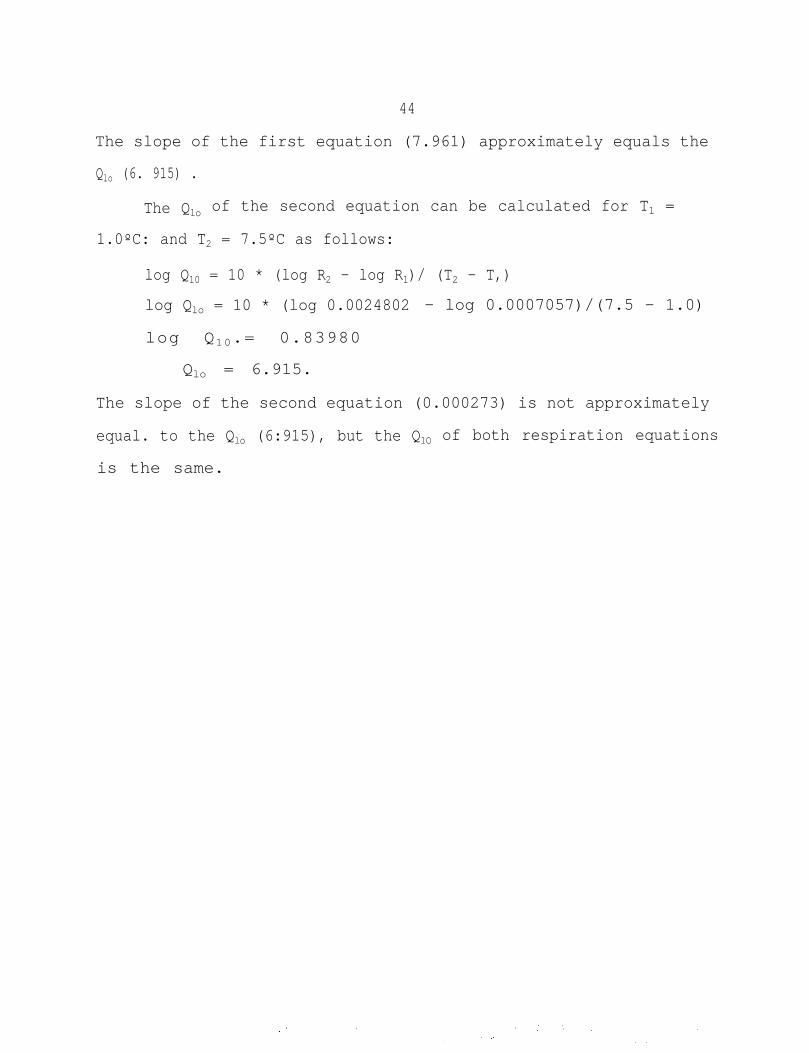
The Qlo of the second equation can be calculated for T1 =
1.0ºC: and T2 = 7.5ºC as follows:
log Q10 = 10 * (log R2 - log R1)/ (T2 - T,)
log Qlo = 10 * (log 0.0024802 - log 0.0007057)/(7.5 - 1.0)
log Q10.= 0.83980
Qlo = 6.915.
The slope of the second equation (0.000273) is not approximately
equal. to the Qlo (6:915), but the Q1O of both respiration equations
is the same.
APPENDIX B
Growth, walleye pollock caloric density,
temperature, prey caloric density, and
diet composition data.

THIS PAGE INTENTIONALLY LEFT BLANK
47
Table B-l.--Weight-at-age data input into the bioenergetics modelfor walleye pollock from the southeast (SE) andnorthwest (NW) areas of the eastern Bering Sea shelf.Weight is in grams and age is the number of December31sts survived.

48
Table B-2.--Caloric density values (cal * g-1 wet weight) ofwalleye pollock. Monthly averages omit known post-spawning samples (lb). BS = Bering Sea samples.
Month
49
Table B-3.--Dates, corresponding model day and the temperatureinput for the southeast (SE) and northwest (NW) areasof the eastern Bering Sea shelf.
Temperature (OC)
DateModelDay SE NW
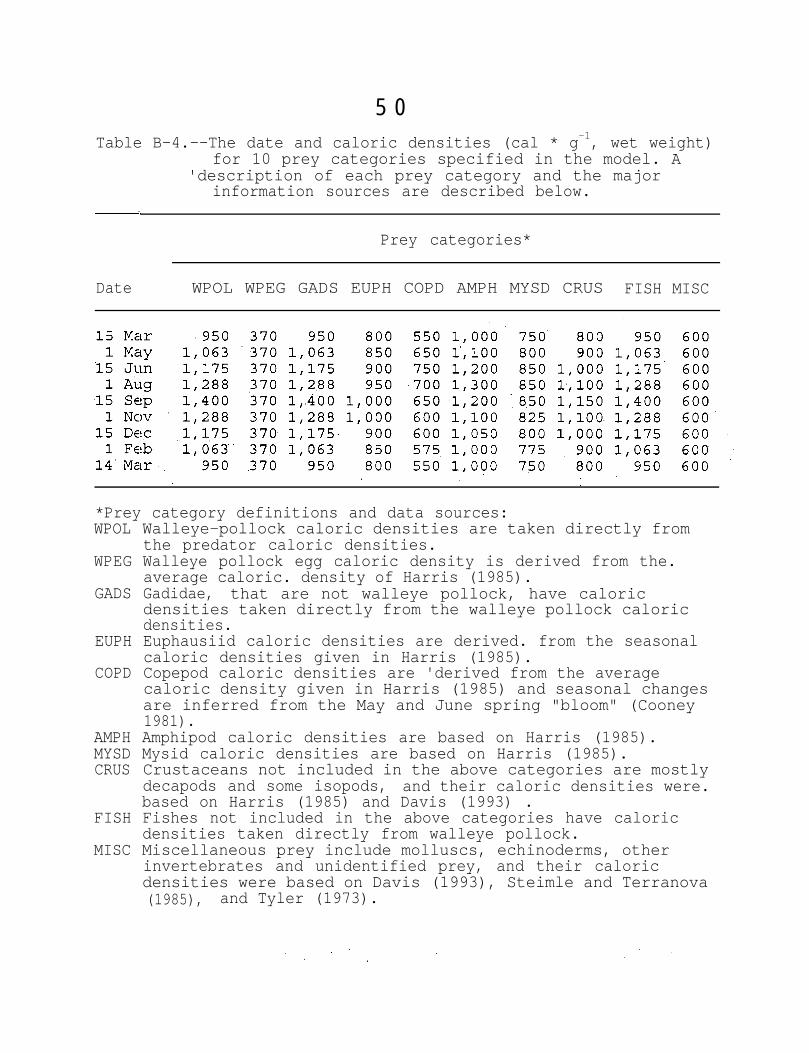
5 0Table B-4.--The date and caloric densities (cal * g-1, wet weight)
for 10 prey categories specified in the model. A'description of each prey category and the major
information sources are described below.
Prey categories*
Date WPOL WPEG GADS EUPH COPD AMPH MYSD CRUS FISH MISC
*Prey category definitions and data sources:WPOL
WPEG
GADS
EUPH
COPD
AMPHMYSDCRUS
FISH
MISC
Walleye-pollock caloric densities are taken directly fromthe predator caloric densities.Walleye pollock egg caloric density is derived from the.average caloric. density of Harris (1985).Gadidae, that are not walleye pollock, have caloricdensities taken directly from the walleye pollock caloricdensities.Euphausiid caloric densities are derived. from the seasonalcaloric densities given in Harris (1985).Copepod caloric densities are 'derived from the averagecaloric density given in Harris (1985) and seasonal changesare inferred from the May and June spring "bloom" (Cooney1981).Amphipod caloric densities are based on Harris (1985).Mysid caloric densities are based on Harris (1985).Crustaceans not included in the above categories are mostlydecapods and some isopods, and their caloric densities were.based on Harris (1985) and Davis (1993) .Fishes not included in the above categories have caloricdensities taken directly from walleye pollock.Miscellaneous prey include molluscs, echinoderms, otherinvertebrates and unidentified prey, and their caloricdensities were based on Davis (1993), Steimle and Terranova(1985), and Tyler (1973).
51
Table B-5.--Diet proportions by weight and season of the 10 preycategories and three age groups used in the model ofwalleye pollock on the southeast shelf of the easternBering Sea. (WPOL - walleye pollock, WPEG - walleyepollock eggs, GADS - gadidae that are not walleyepollock, EUPH - euphausiids, COPD - copepods, AMPH -amphipods, MYSD - mysids, CRUS - crustaceans notincluded in the above categories, FISH - fishes notincluded in the above categories, MISC - miscellaneousprey not included in the above categories)
*Winter = 1 January to 31 March- (model days 293 to 17).Spring = 1 April to 31 June (model days 18 to 108).Summer = 1 July to 30 September (model days 109 to 200).Autumn = 1 October to 31 December (model days 201 to 292).
52
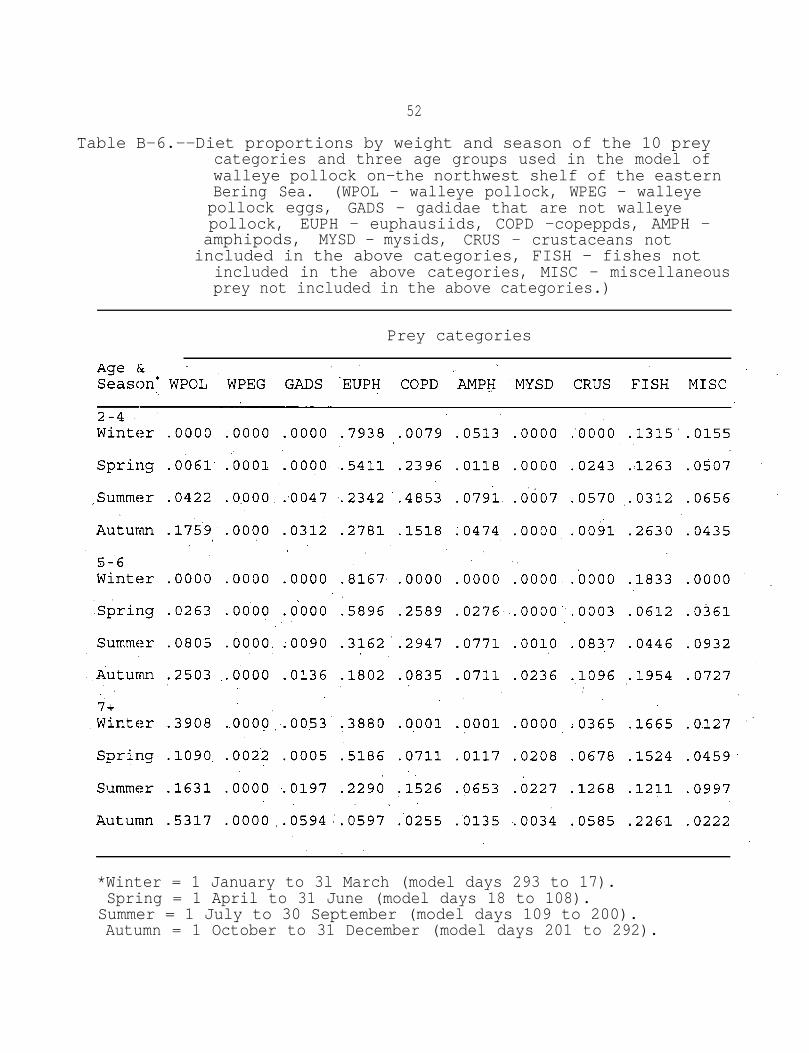
Table B-6.--Diet proportions by weight and season of the 10 preycategories and three age groups used in the model ofwalleye pollock on-the northwest shelf of the easternBering Sea. (WPOL - walleye pollock, WPEG - walleyepollock eggs, GADS - gadidae that are not walleyepollock, EUPH - euphausiids, COPD -copeppds, AMPH -amphipods, MYSD - mysids, CRUS - crustaceans notincluded in the above categories, FISH - fishes not
included in the above categories, MISC - miscellaneousprey not included in the above categories.)
Prey categories
*Winter = 1 January to 3l March (model days 293 to 17).Spring = 1 April to 31 June (model days 18 to 108).
Summer = 1 July to 30 September (model days 109 to 200).Autumn = 1 October to 31 December (model days 201 to 292).
APPENDIX C
Corrected calculations of energy losses
due to spawning by walleye pollock.

THIS PAGE INTENTIONALLY LEFT BLANK
55
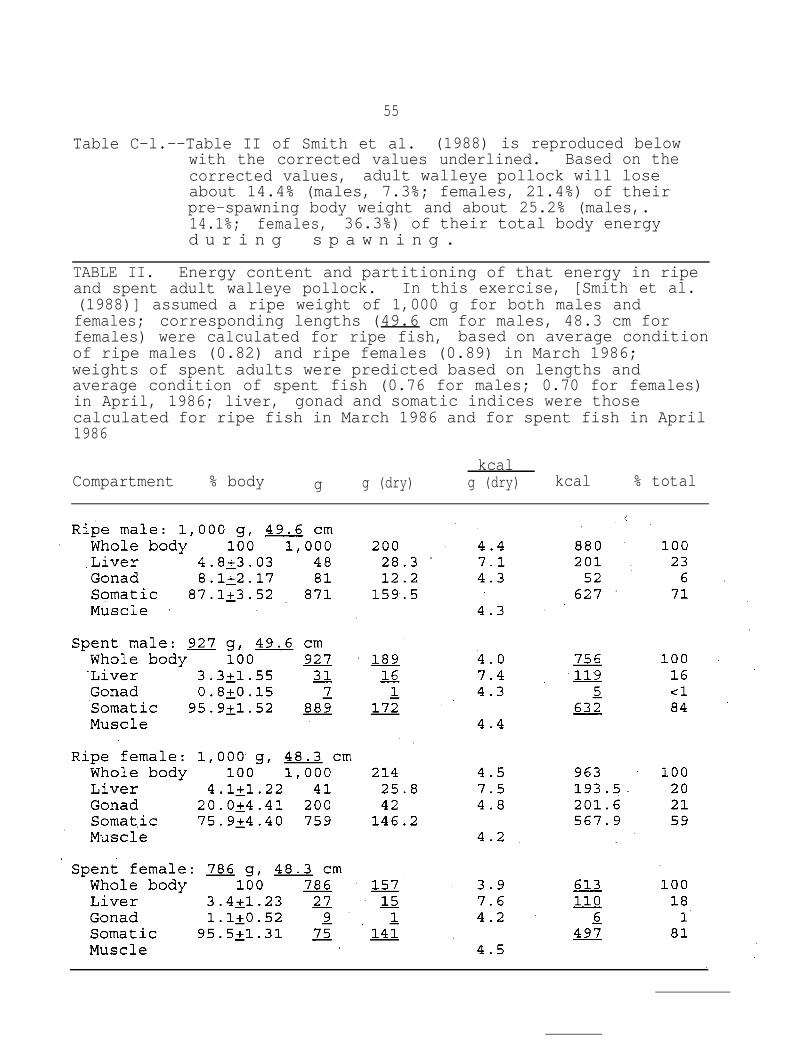
Table C-l.--Table II of Smith et al. (1988) is reproduced belowwith the corrected values underlined. Based on thecorrected values, adult walleye pollock will loseabout 14.4% (males, 7.3%; females, 21.4%) of theirpre-spawning body weight and about 25.2% (males,.14.1%; females, 36.3%) of their total body energyd u r i n g s p a w n i n g .
TABLE II. Energy content and partitioning of that energy in ripeand spent adult walleye pollock. In this exercise, [Smith et al.(1988)] assumed a ripe weight of 1,000 g for both males andfemales; corresponding lengths (49.6 cm for males, 48.3 cm forfemales) were calculated for ripe fish, based on average conditionof ripe males (0.82) and ripe females (0.89) in March 1986;weights of spent adults were predicted based on lengths andaverage condition of spent fish (0.76 for males; 0.70 for females)in April, 1986; liver, gonad and somatic indices were thosecalculated for ripe fish in March 1986 and for spent fish in April1986
kcalCompartment % body g g (dry) g (dry) kcal % total
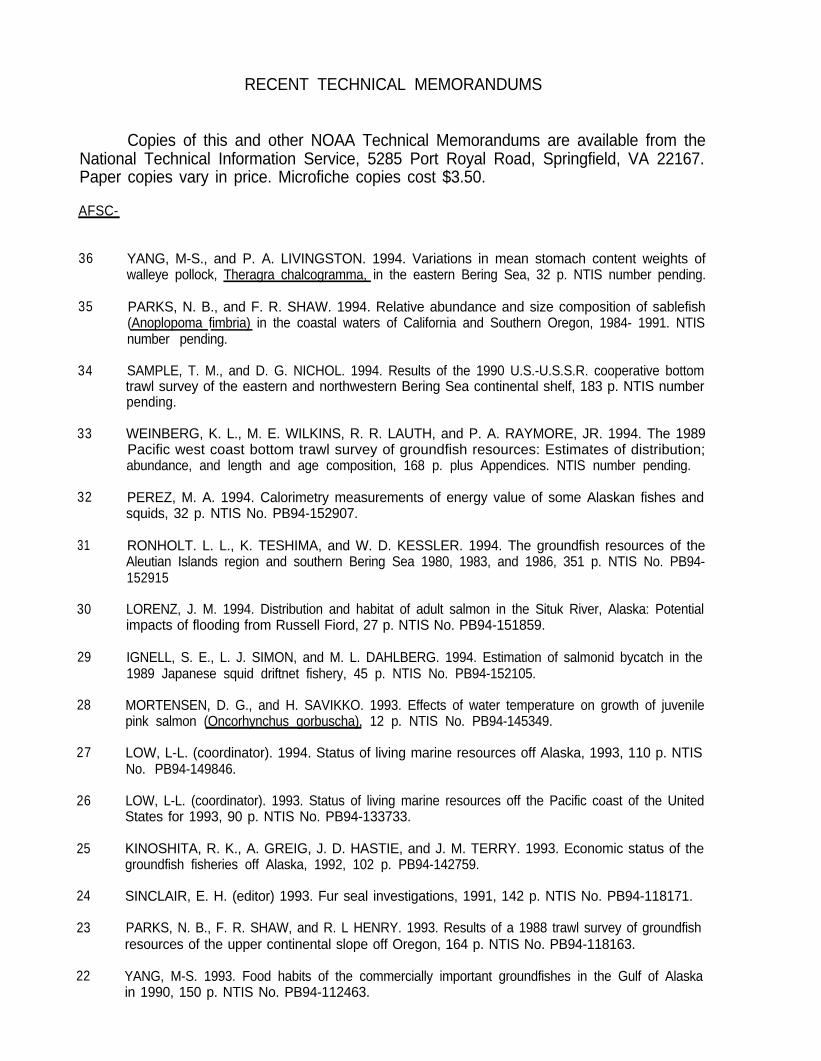
RECENT TECHNICAL MEMORANDUMS
Copies of this and other NOAA Technical Memorandums are available from theNational Technical Information Service, 5285 Port Royal Road, Springfield, VA 22167.Paper copies vary in price. Microfiche copies cost $3.50.
AFSC-
36
35
34
33
32
31
30
29
28
27
26
25
24
23
22
YANG, M-S., and P. A. LIVINGSTON. 1994. Variations in mean stomach content weights ofwalleye pollock, Theragra chalcogramma, in the eastern Bering Sea, 32 p. NTIS number pending.
PARKS, N. B., and F. R. SHAW. 1994. Relative abundance and size composition of sablefish(Anoplopoma fimbria) in the coastal waters of California and Southern Oregon, 1984- 1991. NTISnumber pending.
SAMPLE, T. M., and D. G. NICHOL. 1994. Results of the 1990 U.S.-U.S.S.R. cooperative bottomtrawl survey of the eastern and northwestern Bering Sea continental shelf, 183 p. NTIS numberpending.
WEINBERG, K. L., M. E. WILKINS, R. R. LAUTH, and P. A. RAYMORE, JR. 1994. The 1989Pacific west coast bottom trawl survey of groundfish resources: Estimates of distribution;abundance, and length and age composition, 168 p. plus Appendices. NTIS number pending.
PEREZ, M. A. 1994. Calorimetry measurements of energy value of some Alaskan fishes andsquids, 32 p. NTIS No. PB94-152907.
RONHOLT. L. L., K. TESHIMA, and W. D. KESSLER. 1994. The groundfish resources of theAleutian Islands region and southern Bering Sea 1980, 1983, and 1986, 351 p. NTIS No. PB94-152915
LORENZ, J. M. 1994. Distribution and habitat of adult salmon in the Situk River, Alaska: Potentialimpacts of flooding from Russell Fiord, 27 p. NTIS No. PB94-151859.
IGNELL, S. E., L. J. SIMON, and M. L. DAHLBERG. 1994. Estimation of salmonid bycatch in the1989 Japanese squid driftnet fishery, 45 p. NTIS No. PB94-152105.
MORTENSEN, D. G., and H. SAVIKKO. 1993. Effects of water temperature on growth of juvenilepink salmon (Oncorhynchus gorbuscha), 12 p. NTIS No. PB94-145349.
LOW, L-L. (coordinator). 1994. Status of living marine resources off Alaska, 1993, 110 p. NTISNo. PB94-149846.
LOW, L-L. (coordinator). 1993. Status of living marine resources off the Pacific coast of the UnitedStates for 1993, 90 p. NTIS No. PB94-133733.
KINOSHITA, R. K., A. GREIG, J. D. HASTIE, and J. M. TERRY. 1993. Economic status of thegroundfish fisheries off Alaska, 1992, 102 p. PB94-142759.
SINCLAIR, E. H. (editor) 1993. Fur seal investigations, 1991, 142 p. NTIS No. PB94-118171.
PARKS, N. B., F. R. SHAW, and R. L HENRY. 1993. Results of a 1988 trawl survey of groundfishresources of the upper continental slope off Oregon, 164 p. NTIS No. PB94-118163.
YANG, M-S. 1993. Food habits of the commercially important groundfishes in the Gulf of Alaskain 1990, 150 p. NTIS No. PB94-112463.