Embed Size (px)
Citation preview
A BIPARTITE NETWORK APPROACH TO INFERRING INTERACTIONSBETWEEN ENVIRONMENTAL EXPOSURES AND HUMAN DISEASES
CHRISTIAN DARABOS, EMILY D. GRUSSING, MARIA E. CRICCO,
KENZIE A. CLARK, JASON H. MOORE
Institute for the Quantitative Biomedical Sciences, The Geisel School of Medicine at Dartmouth College,Lebanon, NH 03756, U.S.A.
E-mail: [email protected]
Environmental exposure is a key factor of understanding health and diseases. Beyond genetic propen-sities, many disorders are, in part, caused by human interaction with harmful substances in the water,the soil, or the air. Limited data is available on a disease or substance basis. However, we compile aglobal repository from literature surveys matching environmental chemical substances exposure withhuman disorders. We build a bipartite network linking 60 substances to over 150 disease phenotypes.We quantitatively and qualitatively analyze the network and its projections as simple networks. Weidentify mercury, lead and cadmium as associated with the largest number of disorders. Symmetri-cally, we show that breast cancer, harm to the fetus and non-Hodgkin’s lymphoma are associatedwith the most environmental chemicals. We conduct statistical analysis of how vertices with sim-ilar characteristics form the network interactions. This dyadicity and heterophilicity measures thetendencies of vertices with similar properties to either connect to one-another. We study the dyadicdistribution of the substance classes in the networks show that, for instance, tobacco smoke com-pounds, parabens and heavy metals tend to be connected, which hint at common disease causingfactors, whereas fungicides and phytoestrogens do not. We build an exposure network at the systemslevel. The information gathered in this study is meant to be complementary to the genome and helpus understand complex diseases, their commonalities, their causes, and how to prevent and treatthem.
Keywords: Exposure; Complex Diseases; Substances; Bipartite Network; Dyadicity; Heterophilicity;Human Phenotype Network.
1. Introduction
The environment in which we live undeniably affects our health. Prolonged exposure to chem-ical substances present in water, soil or in the air directly impact our food sources, and arepassed along to humans through ingestion or inhalation where they are the cause of manydiseases and severe health issues.1 Locally limited studies of specific chemical compounds arebecoming common, linking tobacco smoke to cardiovascular and respiratory diseases, and as-bestos dust to several types of cancer. However, in the same way these complex diseases arebelieved to be the result of multiple non-linear genetic interactions, one can speculate thatthey can also be caused by long-term exposure to multiple environmental factors.
Human phenotypes, including physical traits, diseases and behaviors, have been success-fully linked through their shared biology and thoroughly studied using mathematical andstatistical analyses of the networks they form.2,3 Indeed, networks offer a comprehensive ar-ray of solid analytical tools while at the same time offering an intuitive representation ofinteractions.4
The exposome5 encompasses all human environmental exposures and complements thegenome for predicting disorders in “exposed” people. Starting with a systems biology approach,
combining exposome and network models,6 we propose to integrate the global interactionsbetween environmental exposure and human phenotypes and diseases. This bird’s eye viewof the associations between human diseases and chemical compounds will help us establishrelationships at the system’s level – across disorder classes and our environment. While thereare many resources available to map diseases to the human genome, such as the NationalHuman Genome Research Institute GWAS Catalog7 or the National Center for BiotechnologyInformation’s database of Genotypes and Phenotypes (dbGaP, http://www.ncbi.nlm.nih.gov/gap), there is no equivalent initiative to aggregate and freely offer known environmentalexposure data. Using the Centers for Disease Control and Prevention’s (CDC) National Reporton Human Exposure to Environmental Chemicals, a subset of the whole exposome, we haveestablished causal interaction data through a thorough survey of the specialized literature. Weuse the resulting data to build the human phenotype network (HPN) based on causal effects ofenvironmental chemical exposure. Notable predecessors to this study were limited to a singledisease,8 occupational exposure and diseases,9 infancy,10 or focused on health disparities indifferent populations.11
We analyze the networks both in quantitative and qualitative terms; identifying mostrepresented diseases, chemical substances, and most significant interactions among them andoffering clinical and biomedical interpretation. Beyond the substances themselves, we statisti-cally determine the chemical families or groups most responsible for diseases and how disordersand chemicals tend to cluster with those caused by some groups, but not others.
2. Methods
This section describes the steps necessary to compile the exposure data, starting from a list ofenvironmental chemical substances and relating them to diseases and phenotypes. Then, wedetail the method used to build the relationship network that will allow us to run a completearray of quantitative and qualitative analyses on the substance-to-disease relationship. Finally,we formally describe a method to study the global connection propensities of chemicals anddisorders with respect to the associated substance classification group.
2.1. Exposure Data
Environmental exposure data, and information on the diseases that they cause have not, tothe best of our knowledge, been aggregated in publicly accessible sources. To establish causaleffects at a global level, we use the CDC’s Fourth National Report on Human Exposureto Environmental Chemicals (http://www.cdc.gov/exposurereport/), including its subse-quent updated tables, and the NHGRI GWAS Catalog, accessed on 05/06/2014. The formercontains chemical substances, classified in families or groups that have been surveyed in theAmerican population. We extract 60 chemicals in 11 groups, found in the environment, thatform a plausible list of substances potentially harmful to our health. Table 1 recapitulates thegroups and number of chemical substances in each.
For each chemical substance we perform a meticulous PubMed and Google Scholar man-ual literature survey and compile a list of the diseases and traits that it has been shown to(negatively) impact. Causal association between a chemical substance and a disease is based
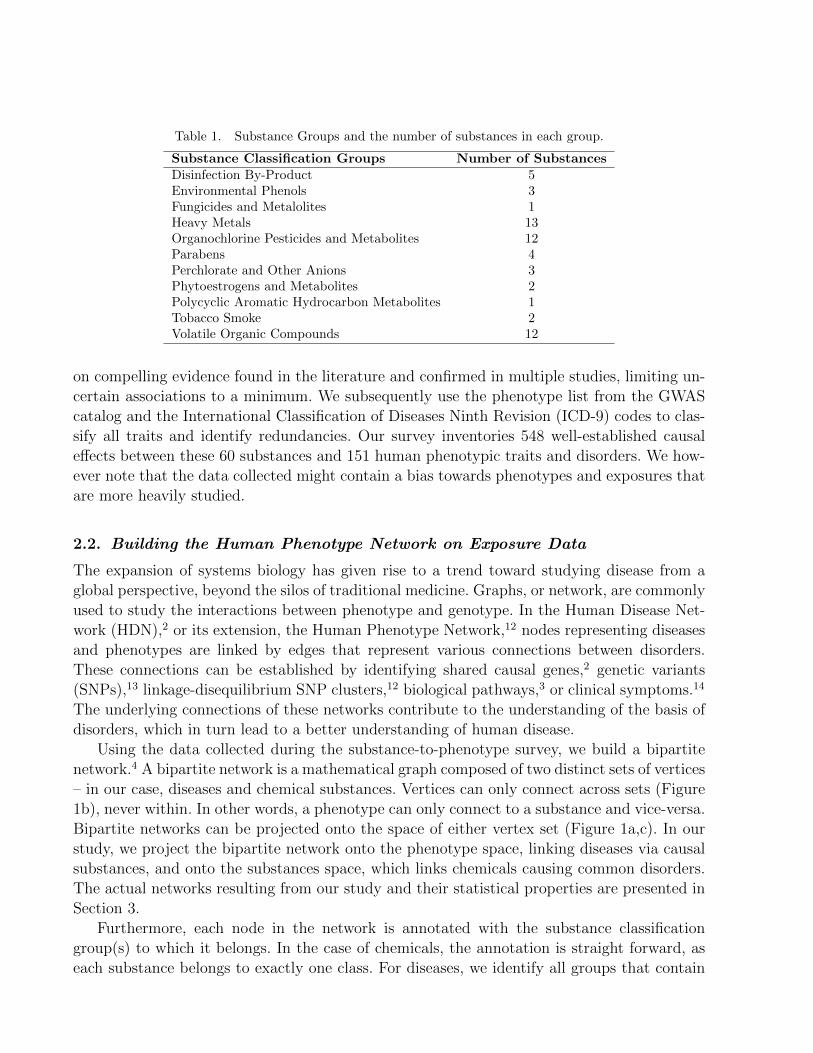
Table 1. Substance Groups and the number of substances in each group.
Substance Classification Groups Number of SubstancesDisinfection By-Product 5Environmental Phenols 3Fungicides and Metalolites 1Heavy Metals 13Organochlorine Pesticides and Metabolites 12Parabens 4Perchlorate and Other Anions 3Phytoestrogens and Metabolites 2Polycyclic Aromatic Hydrocarbon Metabolites 1Tobacco Smoke 2Volatile Organic Compounds 12
on compelling evidence found in the literature and confirmed in multiple studies, limiting un-certain associations to a minimum. We subsequently use the phenotype list from the GWAScatalog and the International Classification of Diseases Ninth Revision (ICD-9) codes to clas-sify all traits and identify redundancies. Our survey inventories 548 well-established causaleffects between these 60 substances and 151 human phenotypic traits and disorders. We how-ever note that the data collected might contain a bias towards phenotypes and exposures thatare more heavily studied.
2.2. Building the Human Phenotype Network on Exposure Data
The expansion of systems biology has given rise to a trend toward studying disease from aglobal perspective, beyond the silos of traditional medicine. Graphs, or network, are commonlyused to study the interactions between phenotype and genotype. In the Human Disease Net-work (HDN),2 or its extension, the Human Phenotype Network,12 nodes representing diseasesand phenotypes are linked by edges that represent various connections between disorders.These connections can be established by identifying shared causal genes,2 genetic variants(SNPs),13 linkage-disequilibrium SNP clusters,12 biological pathways,3 or clinical symptoms.14
The underlying connections of these networks contribute to the understanding of the basis ofdisorders, which in turn lead to a better understanding of human disease.
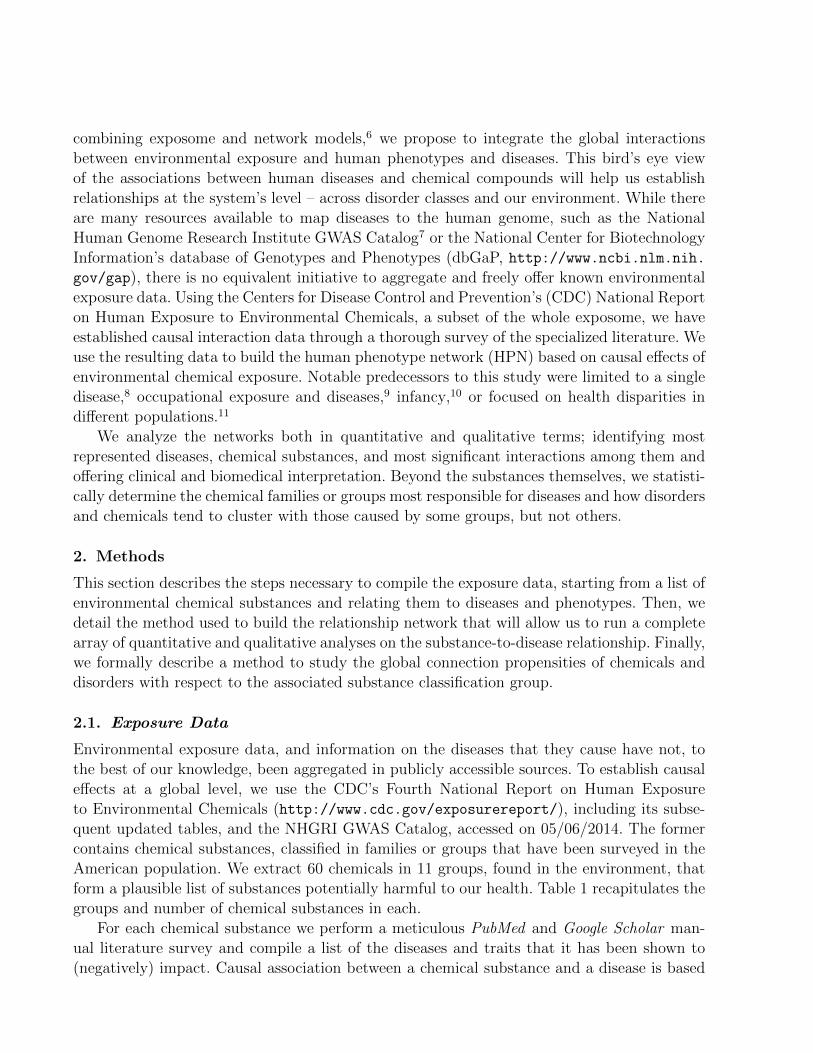
Using the data collected during the substance-to-phenotype survey, we build a bipartitenetwork.4 A bipartite network is a mathematical graph composed of two distinct sets of vertices– in our case, diseases and chemical substances. Vertices can only connect across sets (Figure1b), never within. In other words, a phenotype can only connect to a substance and vice-versa.Bipartite networks can be projected onto the space of either vertex set (Figure 1a,c). In ourstudy, we project the bipartite network onto the phenotype space, linking diseases via causalsubstances, and onto the substances space, which links chemicals causing common disorders.The actual networks resulting from our study and their statistical properties are presented inSection 3.
Furthermore, each node in the network is annotated with the substance classificationgroup(s) to which it belongs. In the case of chemicals, the annotation is straight forward, aseach substance belongs to exactly one class. For diseases, we identify all groups that contain
V
IV
I
II
III
A
B
C
D
E
A
B
C
DE
IV
I
II
III
V
(a) (b) (c)
Fig. 1. Schematic representation of a Bipartite Network (b) and its projection in the space of either vertexset (a) and (c).
at least one causal substance. Additionally, we identify the “majority class” which representsthe class most represented within the list of associated chemicals. The majority class is onlyused for coloring the network nodes in Section 3.
Assessing the Distribution of Vertex Characteristics within a Network
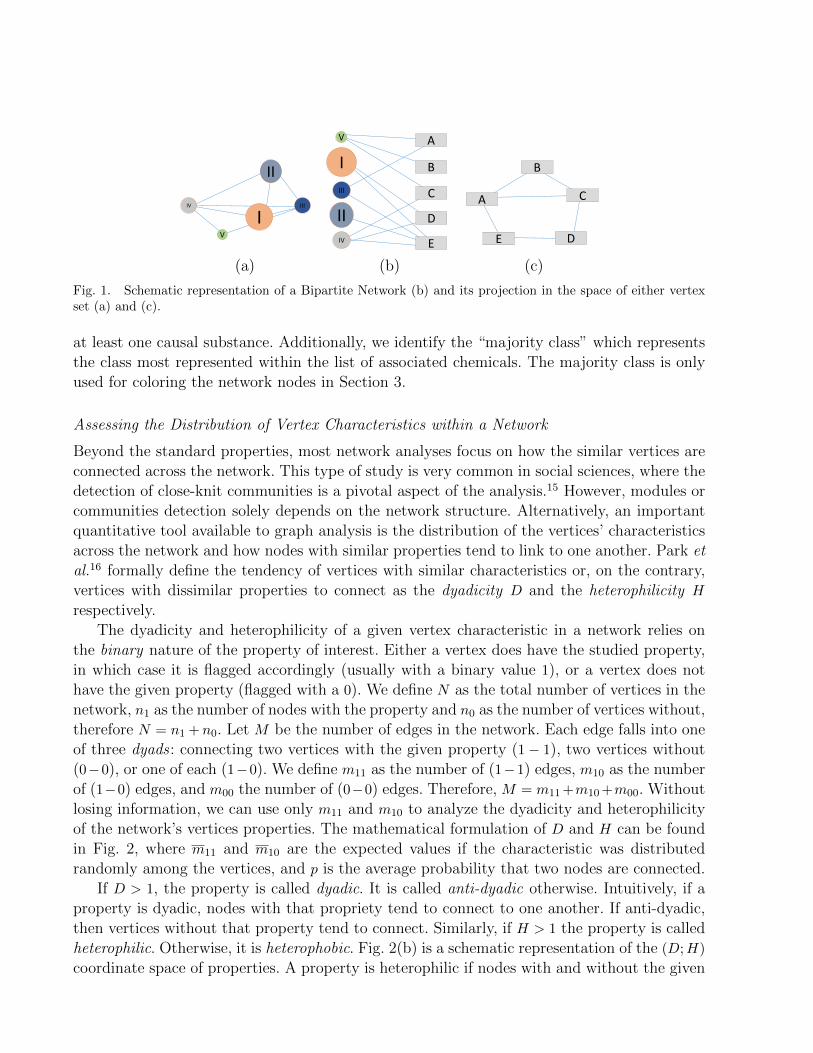
Beyond the standard properties, most network analyses focus on how the similar vertices areconnected across the network. This type of study is very common in social sciences, where thedetection of close-knit communities is a pivotal aspect of the analysis.15 However, modules orcommunities detection solely depends on the network structure. Alternatively, an importantquantitative tool available to graph analysis is the distribution of the vertices’ characteristicsacross the network and how nodes with similar properties tend to link to one another. Park etal.16 formally define the tendency of vertices with similar characteristics or, on the contrary,vertices with dissimilar properties to connect as the dyadicity D and the heterophilicity H
respectively.The dyadicity and heterophilicity of a given vertex characteristic in a network relies on
the binary nature of the property of interest. Either a vertex does have the studied property,in which case it is flagged accordingly (usually with a binary value 1), or a vertex does nothave the given property (flagged with a 0). We define N as the total number of vertices in thenetwork, n1 as the number of nodes with the property and n0 as the number of vertices without,therefore N = n1 + n0. Let M be the number of edges in the network. Each edge falls into oneof three dyads : connecting two vertices with the given property (1 − 1), two vertices without(0−0), or one of each (1−0). We define m11 as the number of (1−1) edges, m10 as the numberof (1−0) edges, and m00 the number of (0−0) edges. Therefore, M = m11+m10+m00. Withoutlosing information, we can use only m11 and m10 to analyze the dyadicity and heterophilicityof the network’s vertices properties. The mathematical formulation of D and H can be foundin Fig. 2, where m11 and m10 are the expected values if the characteristic was distributedrandomly among the vertices, and p is the average probability that two nodes are connected.
If D > 1, the property is called dyadic. It is called anti-dyadic otherwise. Intuitively, if aproperty is dyadic, nodes with that propriety tend to connect to one another. If anti-dyadic,then vertices without that property tend to connect. Similarly, if H > 1 the property is calledheterophilic. Otherwise, it is heterophobic. Fig. 2(b) is a schematic representation of the (D;H)
coordinate space of properties. A property is heterophilic if nodes with and without the given

D ≡ m11
m11,
where m11 =
(n1
2
)× p = n1(n1−1)
2 p
and p ≡ 2MN(N−1) ,
H ≡ m10
m10
where m10 =
(n1
1
)(n0
1
)× p
= n1(N − n1)p
0"
0.5"
1"
1.5"
2"
0" 0.5" 1" 1.5" 2"
heteroph
ilicity"
dyadicity"
dyadic
anti-
heterophilicheterophobic
dyadic(a) (b)
Fig. 2. Dyadicity and Heterophilicity. (a) mathematical definition and (b) schematic representation.
property tend to connect and heterophobic otherwise. The fact that a vertex characteristic canbe dyadic and heterophilic (or anti-dyadic and heterophobic) at the same time is somewhatcounter-intuitive. This is because D and H are defined as a statistically significant deviationof m11 (m10) from its expected value m11 (or m10 respectively).
The binary properties can be virtually any attribute of the vertex to which the value isBoolean (either “yes” or “no”). In our study, we focus on the tendencies of nodes (phenotypeor substance) associated with or within a certain substance class to connect to other membersof that class. Results of this study are shown in the next section.
3. Results
In this section we present the bipartite network and both its projections, including a quanti-tative overview of the networks and degree distributions. Furthermore, we look into the mostconnected (hubs) in each network and into the strongest interactions within the projections toidentify the highest risk factors and phenotype(s) at risk as well as the strongest connectionsbetween phenotypes.
3.1. Bipartite Network and Projections: Quantitative Study
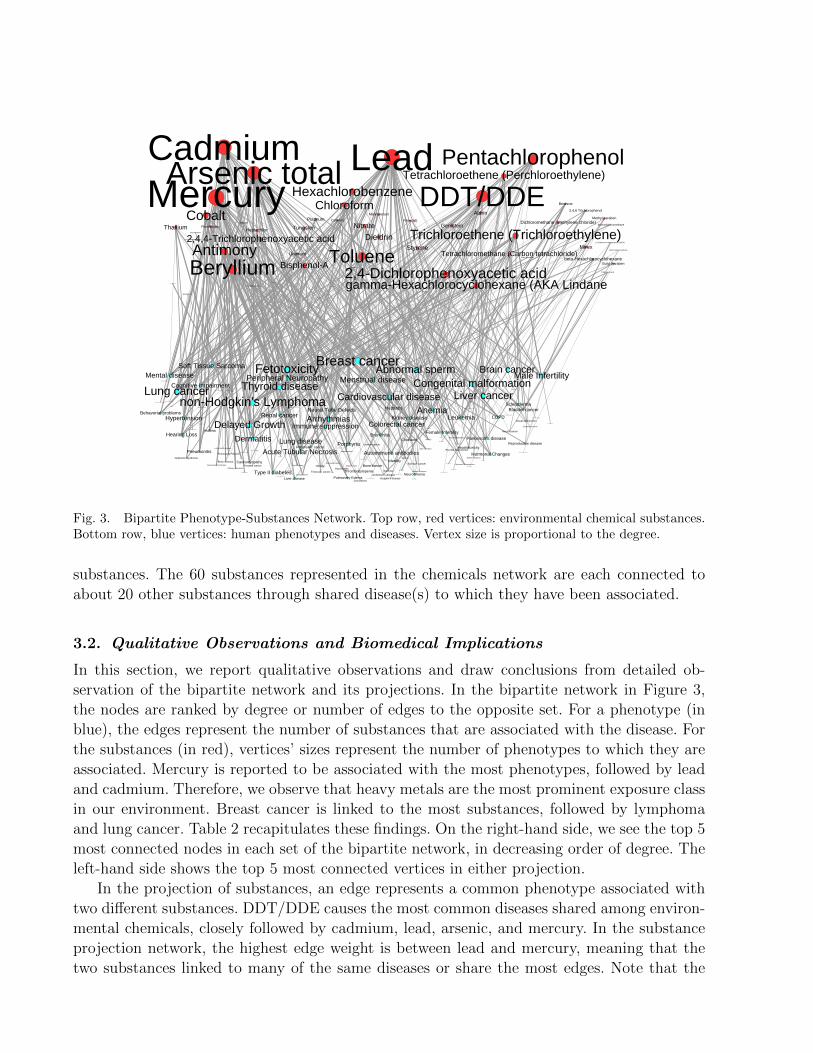
The bipartite network is made of two distinct sets of vertices, the chemical substances and thediseases, resulting from the methods described in Section 2. This graph, represented in Fig.3, is composed of 60 chemical substances (top row, red vertices) responsible for 151 humandisorders (bottom row, light blue vertices), linked by 548 “causal-effect” edges. The node sizesare proportional to the vertex’s degree, i.e. the number of connections to the opposite set ofvertices.
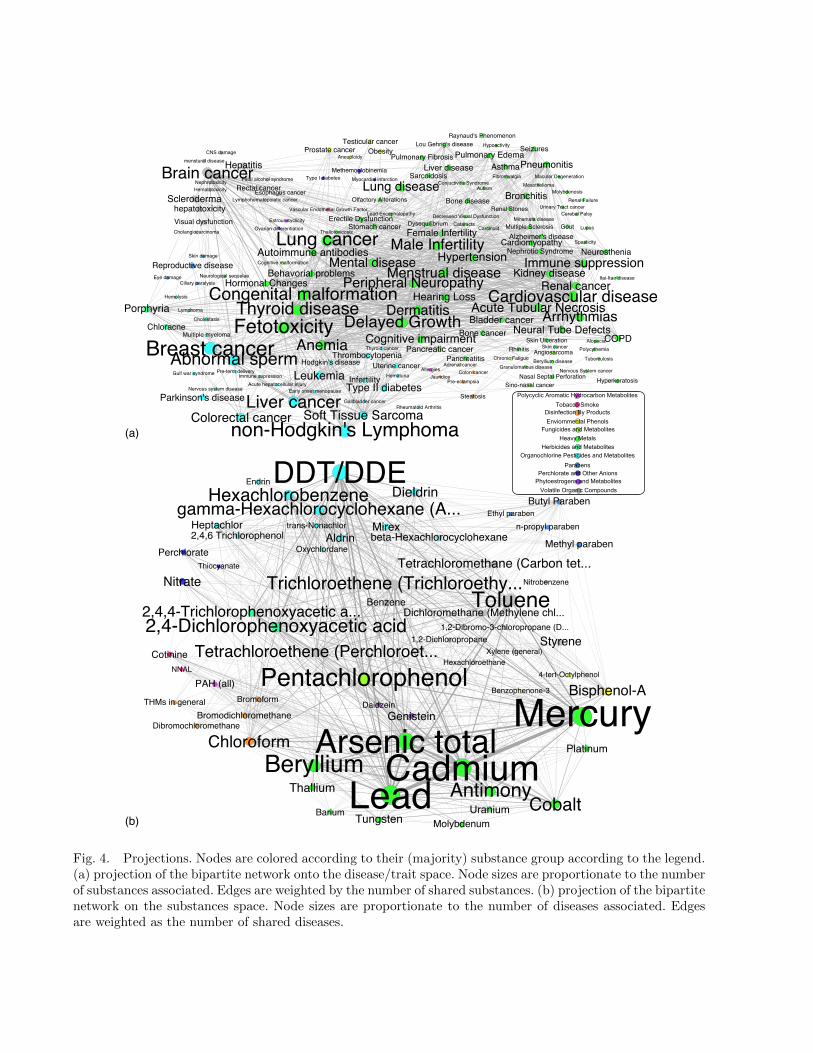
The “mono-partite” networks resulting from the projections in either vertex space arepictured in Fig. 4. Nodes are color coded according to their (majority) substance class. Thephenotype network has 151 nodes and is very densely connected (average degree of 40+), whereeach edge signifies that the two endpoint diseases are associated with one or more common
Hormonal Changes
Methemoglobinemia
Sino-nasal cancer
DDT/DDE
Steatosis
Bromodichloromethane
Uranium
Granulomatous disease
Estrous cyclicity
Genistein
Nephrotic Syndrome
Mercury
Bisphenol-A
Olfactory Alterations
Cardiovascular diseaseMolybdenosis
Neurological sequelae
Benzene
Male InfertilityAbnormal sperm
Immune suppression
Conjuctivitis SyndromePeripheral Neuropathy
Nasal Septal Perforation
Cataracts
hepatotoxicity
Immune supression
Mirex
Delayed Growth
Spasticity
Perchlorate
Mesothelioma
Itai-Itae disease
Rectal cancer
Jaundice
Acute hepatocellular injury
Ciliary paralysis
Thrombocytopenia
Barium
Infertility
Platinum
Asthma
Lead
CNS damage
Xylene (general)
Porphyria
Colorectal cancer
Raynaud's Phenomenon
Alopecia
Type II diabetes
2,4,4-Trichlorophenoxyacetic acid
Hypoactivity
2,4,6 Trichlorophenol
Lymphoma
Menstrual disease
2,4-Dichlorophenoxyacetic acid
Hypertension
Urinary Tract cancer
Myocardial infarction
Fibromyalgia Liver cancer
Lead Encephalopathy
BronchitisHemolysis
1,2-Dichloropropane
Renal Failure
Skin damage
Styrene
Behavorial problems
Ethyl paraben
Endrin
Toluene
Leukemia
Acute Tubular NecrosisPancreatic cancer
Renal cancer
Hodgkin's disease
Daidzein
Scleroderma
Trichloroethene (Trichloroethylene)
Liver disease
Tungsten
Pre-term delivery
Skin cancer
Alzheimer's disease
Hematuria
Angiosarcoma
Lupus
Prostate cancer
PAH (all)
Hepatitis
Skin Ulceration
Hematotoxicity
Renal Stones
trans-Nonachlor
Kidney disease
Molybdenum
Reproductive disease
Polycythemia
Bromoform
Nervous System cancer
Lung cancer
Multiple myeloma
Stomach cancer
Arsenic total
Testicular cancer
Neural Tube Defects
Eye damage
Uterine cancer
menstural disease
Parkinson's disease
Nephrotoxicity
Seizures
Autoimmune antibodies
Antimony
NNAL
Minamata disease
Lymphohematopoietic cancer
Cerebal Palsy
Tetrachloroethene (Perchloroethylene)
Hexachlorobenzene
Fetotoxicity
Hearing Loss
Beryllium disease
Dieldrin
Soft Tissue Sarcoma
Bone disease
Tuberculosis
Chloracne
Tetrachloromethane (Carbon tetrachloride)
n-propyl paraben
Anemia
Lou Gehrig's disease
Bladder cancer
Cholestasis
Allergies
Thyroid disease
Pneumonitis Nervous system disease
Visual dysfunction
Aldrin
Pancreatitis
Pulmonary Fibrosis
Dibromochloromethane
Rhinitis
Gallbladder cancer
Heptachlor
Vascular Endothelial Growth Factor
Cognitive malformation
Multiple Sclerosis
Cardiomyopathy
Adrenal cancer
Cognitive impairment
Arrhythmias
Thallotoxicosis
Ovarian differentiation
Pulmonary Edema
Cholangiocarcinoma
beta-Hexachlorocyclohexane
Nitrobenzene
Decreased Visual Dysfunction
ChloroformMethyl paraben
Oxychlordane
Sarcoidosis
Thallium NitrateCobalt
Brain cancer
Autism
Fetal alcohol syndrome
Thyroid cancer
Hexachloroethane
Aneuploidy
Beryllium4-tert-Octylphenol
Thiocyanate
Carcinoid
Rheumatoid Arthritis
Mental disease
non-Hodgkin's Lymphoma
1,2-Dibromo-3-chloropropane (DBCP)
Benzophenone-3
Early onset menopause
Obesity
Colon cancer
Lung diseaseHyperkeratosis
Gout
Gulf war syndrome
Esophagus cancer
Pentachlorophenol
Neurosthenia
Erectile Dysfunction
Type I diabetes
THMs in general
Dysequilibrium
Breast cancer
Pre-eclampsia
Female Infertility
Butyl Paraben
Congenital malformationMacular Degeneration
Chronic Fatigue
Cotinine
gamma-Hexachlorocyclohexane (AKA Lindane
Dermatitis
Bone cancer
Cadmium
COPD
Dichloromethane (Methylene chloride)
Fig. 3. Bipartite Phenotype-Substances Network. Top row, red vertices: environmental chemical substances.Bottom row, blue vertices: human phenotypes and diseases. Vertex size is proportional to the degree.
substances. The 60 substances represented in the chemicals network are each connected toabout 20 other substances through shared disease(s) to which they have been associated.
3.2. Qualitative Observations and Biomedical Implications
In this section, we report qualitative observations and draw conclusions from detailed ob-servation of the bipartite network and its projections. In the bipartite network in Figure 3,the nodes are ranked by degree or number of edges to the opposite set. For a phenotype (inblue), the edges represent the number of substances that are associated with the disease. Forthe substances (in red), vertices’ sizes represent the number of phenotypes to which they areassociated. Mercury is reported to be associated with the most phenotypes, followed by leadand cadmium. Therefore, we observe that heavy metals are the most prominent exposure classin our environment. Breast cancer is linked to the most substances, followed by lymphomaand lung cancer. Table 2 recapitulates these findings. On the right-hand side, we see the top 5most connected nodes in each set of the bipartite network, in decreasing order of degree. Theleft-hand side shows the top 5 most connected vertices in either projection.
In the projection of substances, an edge represents a common phenotype associated withtwo different substances. DDT/DDE causes the most common diseases shared among environ-mental chemicals, closely followed by cadmium, lead, arsenic, and mercury. In the substanceprojection network, the highest edge weight is between lead and mercury, meaning that thetwo substances linked to many of the same diseases or share the most edges. Note that the
Cataracts
Conjuctivitis Syndrome
Peripheral Neuropathy
Vascular Endothelial Growth Factor
Estrous cyclicity
Pre-term delivery
Bone cancer
Dermatitis
CNS damage
Breast cancer
Cardiovascular disease
Hypertension
Lupus
Multiple myeloma
Bronchitis
Pre-eclampsia
Gout
Acute hepatocellular injury
Female InfertilityLung cancerThallotoxicosis
Pulmonary Edema
Cardiomyopathy
Angiosarcoma
Hormonal Changes
COPD
Itai-Itae disease
AsthmaAneuploidy
Multiple Sclerosis
Neurological sequelae
Leukemia
Rheumatoid Arthritis
HyperkeratosisGulf war syndrome
Arrhythmias
Methemoglobinemia
Nephrotic Syndrome
Liver disease
Delayed Growth
Cognitive malformation
Hearing Loss
Sino-nasal cancer
Eye damage
Colorectal cancer
Lead Encephalopathy
Adrenal cancer
Esophagus cancer
Fetal alcohol syndrome
Menstrual disease
Skin cancer
Myocardial infarction
Chronic FatiguePancreatic cancer Rhinitis
Gallbladder cancer
Granulomatous disease
Immune suppression
Abnormal spermColon cancer
Fetotoxicity
Skin damage
Testicular cancer
menstural disease
Brain cancer
Chloracne
Hepatitis
Autoimmune antibodies
Acute Tubular Necrosis
Olfactory Alterations
Neural Tube Defects
Lung diseaseNephrotoxicity
Reproductive disease
Parkinson's disease
non-Hodgkin's Lymphoma
Visual dysfunction
Allergies
Anemia
Nasal Septal Perforation
Renal Failure
Type I diabetes
Dysequilibrium
Behavorial problems
Macular Degeneration
Tuberculosis
Seizures
Alopecia
Pulmonary Fibrosis
Erectile Dysfunction
Raynaud's Phenomenon
Thrombocytopenia
Molybdenosis
Cognitive impairment
hepatotoxicity
Prostate cancer
Cholestasis
Skin Ulceration
Sarcoidosis
Infertility
Spasticity
Bladder cancer
Jaundice
Hypoactivity
Fibromyalgia
Porphyria
Cholangiocarcinoma
Lymphohematopoietic cancer
Kidney disease
Nervous system disease
Uterine cancer
Hematotoxicity
Renal cancer
Mental disease
Congenital malformation
Scleroderma
Thyroid disease
Polycythemia
Ovarian differentiation
Ciliary paralysis
Pancreatitis
Lou Gehrig's disease
Rectal cancer
Alzheimer's diseaseMale Infertility
Lymphoma
Thyroid cancer
Minamata disease
Liver cancer Steatosis
Carcinoid
Immune supression
Neurosthenia
Stomach cancer
Renal Stones
Early onset menopause
Autism
Hematuria
Soft Tissue Sarcoma
Bone disease
Hemolysis
Cerebal Palsy
Mesothelioma
Urinary Tract cancer
Obesity
Pneumonitis
Nervous System cancer
Decreased Visual Dysfunction
Hodgkin's disease
Type II diabetes
Beryllium disease
Bromoform
Hexachloroethane
Tetrachloromethane (Carbon tet...
Dibromochloromethane
Arsenic total
2,4,4-Trichlorophenoxyacetic a...Benzene
Bromodichloromethane
4-tert-Octylphenol
Mercury
n-propyl paraben
PAH (all)
Methyl paraben
Dieldrin
Cotinine
Bisphenol-A
Uranium
Ethyl paraben
Benzophenone-3
Xylene (general)
BariumMolybdenum
gamma-Hexachlorocyclohexane (A...
1,2-Dichloropropane
Chloroform
Tungsten
Aldrin
Dichloromethane (Methylene chl...
Nitrate
Platinum
Cobalt
2,4-Dichlorophenoxyacetic acid
Hexachlorobenzene
AntimonyCadmium
Lead
beta-Hexachlorocyclohexane
Toluene
Tetrachloroethene (Perchloroet...
Beryllium
Genistein
Thallium
NNAL
PerchlorateThiocyanate
Styrene
Trichloroethene (Trichloroethy...
Daidzein
Endrin
1,2-Dibromo-3-chloropropane (D...
DDT/DDEMirex
Nitrobenzene
Oxychlordane
trans-Nonachlor
THMs in general
Heptachlor
Butyl Paraben
Pentachlorophenol
2,4,6 Trichlorophenol
)XQJLFLGHV�DQG�0HWDEROLWHV
2UJDQRFKORULQH�3HVWLFLGHV�DQG�0HWDEROLWHV
9RODWLOH�2UJDQLF�&RPSRXQGV
'LVLQIHFWLRQ�%\�3URGXFWV7REDFFR�6PRNH
+HUELFLGHV�DQG�0HWDEROLWHV
3RO\F\FOLF�$URPDWLF�+\GURFDUERQ�0HWDEROLWHV
3K\WRHVWURJHQV�DQG�0HWDEROLWHV
+HDY\�0HWDOV
3DUDEHQV
(QYLRUQPHQWDO�3KHQROV
3HUFKORUDWH�DQG�2WKHU�$QLRQV
(a)
(b)
Fig. 4. Projections. Nodes are colored according to their (majority) substance group according to the legend.(a) projection of the bipartite network onto the disease/trait space. Node sizes are proportionate to the numberof substances associated. Edges are weighted by the number of shared substances. (b) projection of the bipartitenetwork on the substances space. Node sizes are proportionate to the number of diseases associated. Edgesare weighted as the number of shared diseases.
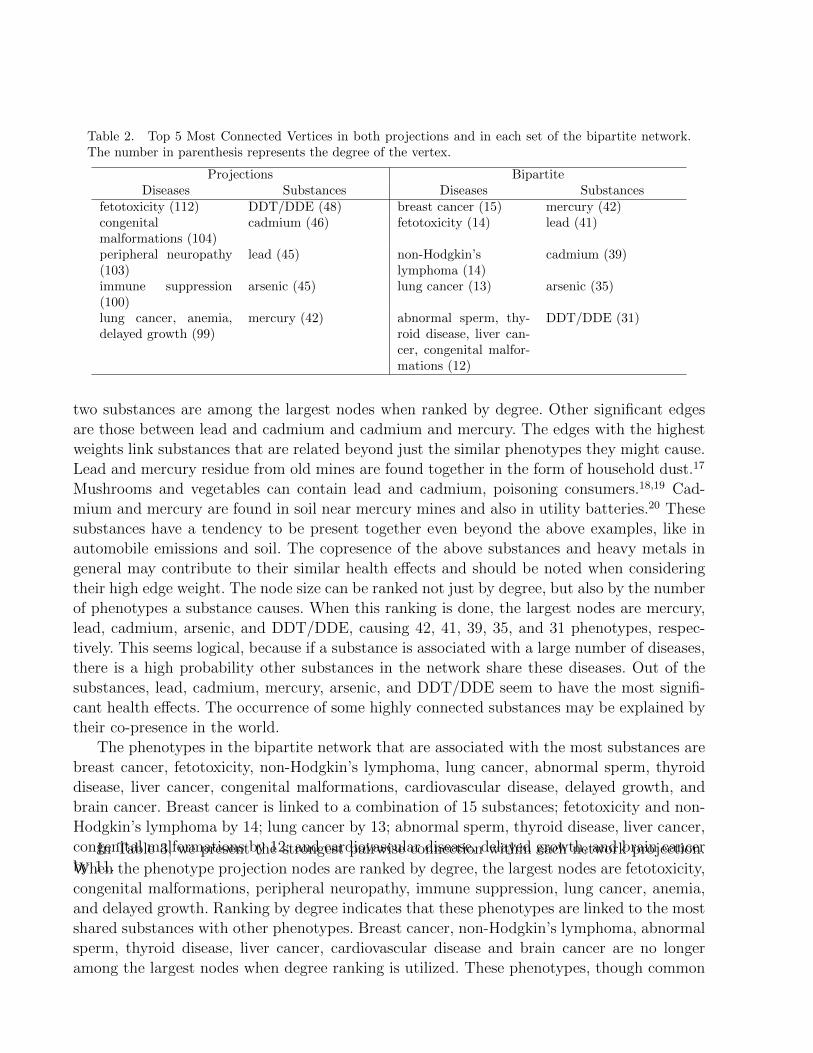
Table 2. Top 5 Most Connected Vertices in both projections and in each set of the bipartite network.The number in parenthesis represents the degree of the vertex.
Projections BipartiteDiseases Substances Diseases Substances
fetotoxicity (112) DDT/DDE (48) breast cancer (15) mercury (42)congenitalmalformations (104)
cadmium (46) fetotoxicity (14) lead (41)
peripheral neuropathy(103)
lead (45) non-Hodgkin’slymphoma (14)
cadmium (39)
immune suppression(100)
arsenic (45) lung cancer (13) arsenic (35)
lung cancer, anemia,delayed growth (99)
mercury (42) abnormal sperm, thy-roid disease, liver can-cer, congenital malfor-mations (12)
DDT/DDE (31)
two substances are among the largest nodes when ranked by degree. Other significant edgesare those between lead and cadmium and cadmium and mercury. The edges with the highestweights link substances that are related beyond just the similar phenotypes they might cause.Lead and mercury residue from old mines are found together in the form of household dust.17
Mushrooms and vegetables can contain lead and cadmium, poisoning consumers.18,19 Cad-mium and mercury are found in soil near mercury mines and also in utility batteries.20 Thesesubstances have a tendency to be present together even beyond the above examples, like inautomobile emissions and soil. The copresence of the above substances and heavy metals ingeneral may contribute to their similar health effects and should be noted when consideringtheir high edge weight. The node size can be ranked not just by degree, but also by the numberof phenotypes a substance causes. When this ranking is done, the largest nodes are mercury,lead, cadmium, arsenic, and DDT/DDE, causing 42, 41, 39, 35, and 31 phenotypes, respec-tively. This seems logical, because if a substance is associated with a large number of diseases,there is a high probability other substances in the network share these diseases. Out of thesubstances, lead, cadmium, mercury, arsenic, and DDT/DDE seem to have the most signifi-cant health effects. The occurrence of some highly connected substances may be explained bytheir co-presence in the world.
The phenotypes in the bipartite network that are associated with the most substances arebreast cancer, fetotoxicity, non-Hodgkin’s lymphoma, lung cancer, abnormal sperm, thyroiddisease, liver cancer, congenital malformations, cardiovascular disease, delayed growth, andbrain cancer. Breast cancer is linked to a combination of 15 substances; fetotoxicity and non-Hodgkin’s lymphoma by 14; lung cancer by 13; abnormal sperm, thyroid disease, liver cancer,congenital malformations by 12; and cardiovascular disease, delayed growth, and brain cancerby 11.
In Table 3, we present the strongest pairwise connection within each network projection.When the phenotype projection nodes are ranked by degree, the largest nodes are fetotoxicity,congenital malformations, peripheral neuropathy, immune suppression, lung cancer, anemia,and delayed growth. Ranking by degree indicates that these phenotypes are linked to the mostshared substances with other phenotypes. Breast cancer, non-Hodgkin’s lymphoma, abnormalsperm, thyroid disease, liver cancer, cardiovascular disease and brain cancer are no longeramong the largest nodes when degree ranking is utilized. These phenotypes, though common
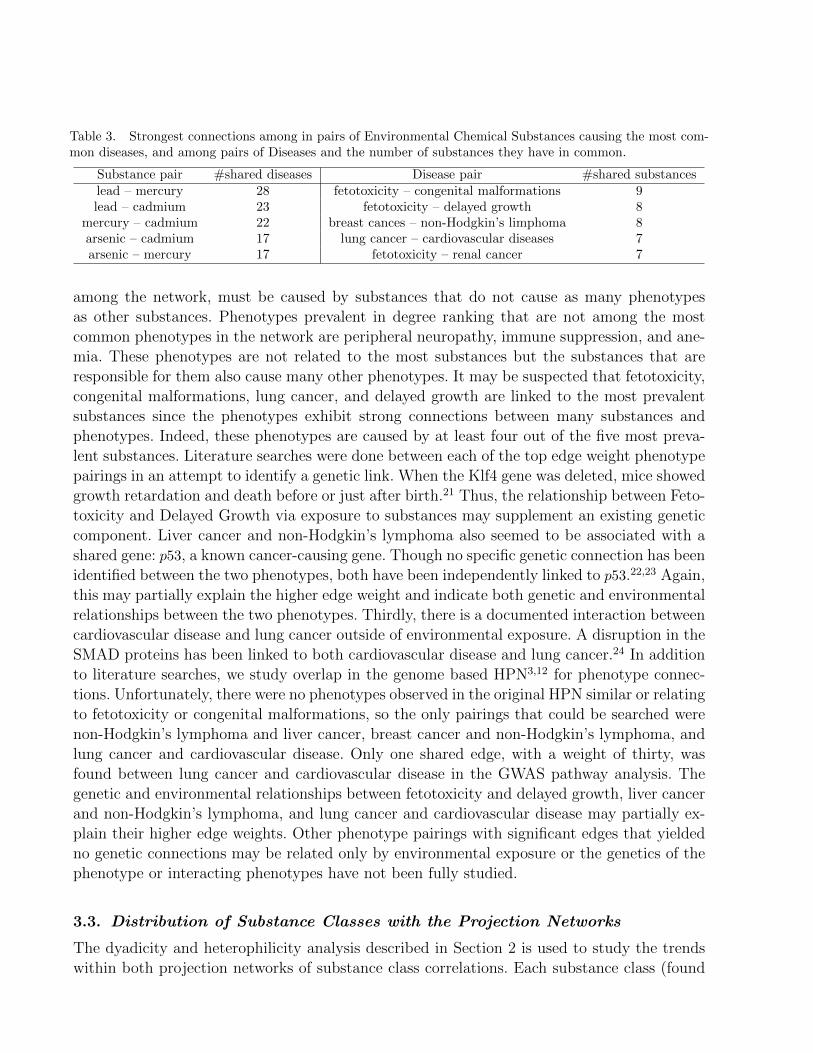
Table 3. Strongest connections among in pairs of Environmental Chemical Substances causing the most com-mon diseases, and among pairs of Diseases and the number of substances they have in common.
Substance pair #shared diseases Disease pair #shared substanceslead – mercury 28 fetotoxicity – congenital malformations 9lead – cadmium 23 fetotoxicity – delayed growth 8
mercury – cadmium 22 breast cances – non-Hodgkin’s limphoma 8arsenic – cadmium 17 lung cancer – cardiovascular diseases 7arsenic – mercury 17 fetotoxicity – renal cancer 7
among the network, must be caused by substances that do not cause as many phenotypesas other substances. Phenotypes prevalent in degree ranking that are not among the mostcommon phenotypes in the network are peripheral neuropathy, immune suppression, and ane-mia. These phenotypes are not related to the most substances but the substances that areresponsible for them also cause many other phenotypes. It may be suspected that fetotoxicity,congenital malformations, lung cancer, and delayed growth are linked to the most prevalentsubstances since the phenotypes exhibit strong connections between many substances andphenotypes. Indeed, these phenotypes are caused by at least four out of the five most preva-lent substances. Literature searches were done between each of the top edge weight phenotypepairings in an attempt to identify a genetic link. When the Klf4 gene was deleted, mice showedgrowth retardation and death before or just after birth.21 Thus, the relationship between Feto-toxicity and Delayed Growth via exposure to substances may supplement an existing geneticcomponent. Liver cancer and non-Hodgkin’s lymphoma also seemed to be associated with ashared gene: p53, a known cancer-causing gene. Though no specific genetic connection has beenidentified between the two phenotypes, both have been independently linked to p53.22,23 Again,this may partially explain the higher edge weight and indicate both genetic and environmentalrelationships between the two phenotypes. Thirdly, there is a documented interaction betweencardiovascular disease and lung cancer outside of environmental exposure. A disruption in theSMAD proteins has been linked to both cardiovascular disease and lung cancer.24 In additionto literature searches, we study overlap in the genome based HPN3,12 for phenotype connec-tions. Unfortunately, there were no phenotypes observed in the original HPN similar or relatingto fetotoxicity or congenital malformations, so the only pairings that could be searched werenon-Hodgkin’s lymphoma and liver cancer, breast cancer and non-Hodgkin’s lymphoma, andlung cancer and cardiovascular disease. Only one shared edge, with a weight of thirty, wasfound between lung cancer and cardiovascular disease in the GWAS pathway analysis. Thegenetic and environmental relationships between fetotoxicity and delayed growth, liver cancerand non-Hodgkin’s lymphoma, and lung cancer and cardiovascular disease may partially ex-plain their higher edge weights. Other phenotype pairings with significant edges that yieldedno genetic connections may be related only by environmental exposure or the genetics of thephenotype or interacting phenotypes have not been fully studied.
3.3. Distribution of Substance Classes with the Projection Networks
The dyadicity and heterophilicity analysis described in Section 2 is used to study the trendswithin both projection networks of substance class correlations. Each substance class (found
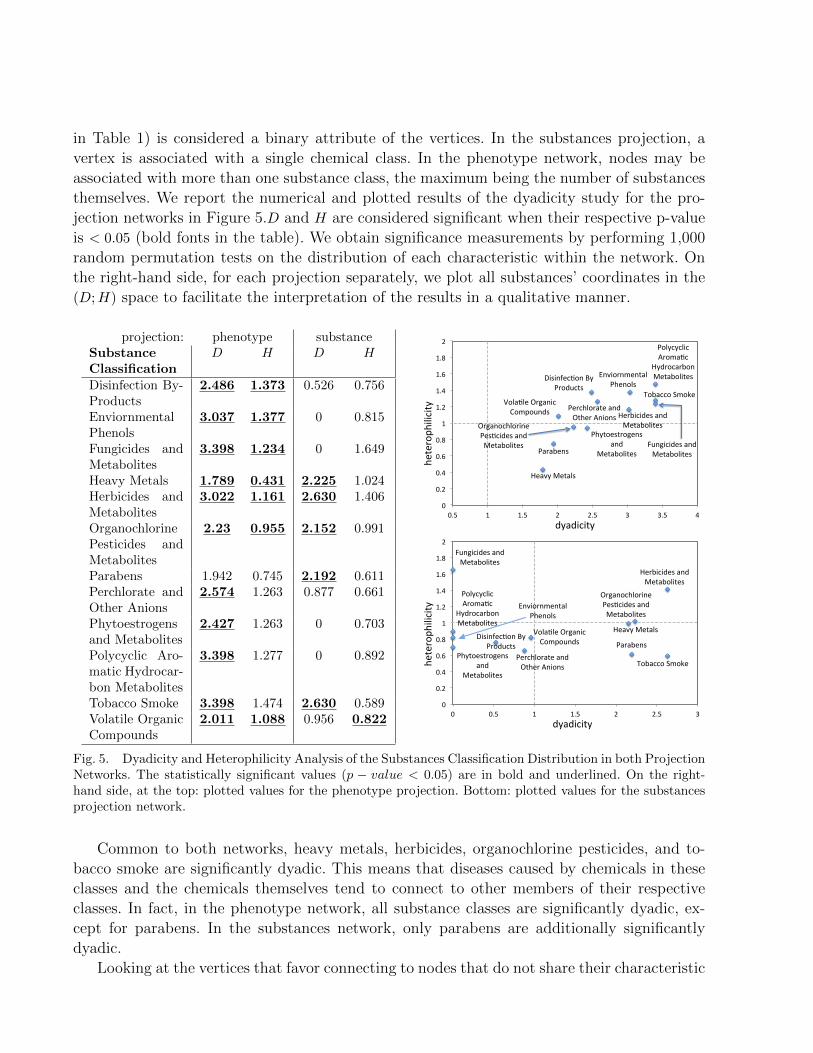
in Table 1) is considered a binary attribute of the vertices. In the substances projection, avertex is associated with a single chemical class. In the phenotype network, nodes may beassociated with more than one substance class, the maximum being the number of substancesthemselves. We report the numerical and plotted results of the dyadicity study for the pro-jection networks in Figure 5.D and H are considered significant when their respective p-valueis < 0.05 (bold fonts in the table). We obtain significance measurements by performing 1,000random permutation tests on the distribution of each characteristic within the network. Onthe right-hand side, for each projection separately, we plot all substances’ coordinates in the(D;H) space to facilitate the interpretation of the results in a qualitative manner.
projection: phenotype substanceSubstanceClassification
D H D H
Disinfection By-Products
2.486 1.373 0.526 0.756
EnviornmentalPhenols
3.037 1.377 0 0.815
Fungicides andMetabolites
3.398 1.234 0 1.649
Heavy Metals 1.789 0.431 2.225 1.024Herbicides andMetabolites
3.022 1.161 2.630 1.406
OrganochlorinePesticides andMetabolites
2.23 0.955 2.152 0.991
Parabens 1.942 0.745 2.192 0.611Perchlorate andOther Anions
2.574 1.263 0.877 0.661
Phytoestrogensand Metabolites
2.427 1.263 0 0.703
Polycyclic Aro-matic Hydrocar-bon Metabolites
3.398 1.277 0 0.892
Tobacco Smoke 3.398 1.474 2.630 0.589Volatile OrganicCompounds
2.011 1.088 0.956 0.822
Disinfec(on By Products
Enviornmental Phenols
Fungicides and Metabolites
Heavy Metals
Herbicides and Metabolites Organochlorine
Pes(cides and Metabolites
Parabens
Perchlorate and Other Anions
Phytoestrogens and
Metabolites
Polycyclic Aroma(c
Hydrocarbon Metabolites
Tobacco Smoke Vola(le Organic Compounds
0
0.2
0.4
0.6
0.8
1
1.2
1.4
1.6
1.8
2
0.5 1 1.5 2 2.5 3 3.5 4
heteroph
ilicity
dyadicity
Disinfec(on*By*Products*
Enviornmental*Phenols*
Fungicides*and*Metabolites*
Heavy*Metals*
Herbicides*and*Metabolites*
Organochlorine*Pes(cides*and*Metabolites*
Parabens*Perchlorate*and*Other*Anions*
Phytoestrogens*and*
Metabolites*
Polycyclic*Aroma(c*
Hydrocarbon*Metabolites*
Tobacco*Smoke*
Vola(le*Organic*Compounds*
0*
0.2*
0.4*
0.6*
0.8*
1*
1.2*
1.4*
1.6*
1.8*
2*
0* 0.5* 1* 1.5* 2* 2.5* 3*
heteroph
ilicity*
dyadicity*
Fig. 5. Dyadicity and Heterophilicity Analysis of the Substances Classification Distribution in both ProjectionNetworks. The statistically significant values (p − value < 0.05) are in bold and underlined. On the right-hand side, at the top: plotted values for the phenotype projection. Bottom: plotted values for the substancesprojection network.
Common to both networks, heavy metals, herbicides, organochlorine pesticides, and to-bacco smoke are significantly dyadic. This means that diseases caused by chemicals in theseclasses and the chemicals themselves tend to connect to other members of their respectiveclasses. In fact, in the phenotype network, all substance classes are significantly dyadic, ex-cept for parabens. In the substances network, only parabens are additionally significantlydyadic.
Looking at the vertices that favor connecting to nodes that do not share their characteristic
common to both networks, only volatile organic compounds have significant values. However,in the phenotype network, those nodes are heterophilic, whereas they are heterophobic in thesubstance network. In the phenotype network, disinfectants, phenols, fungicides, herbicidesare all also significantly heterophobic. Heavy metals and pesticides are heterophobic.
From a clinical viewpoint, the dyadicity analysis tells us that diseases caused by dyadicclasses, i.e. tobacco smoke and phenols tend to connect through their substances. In the pheno-type network, there are no anti-dyadic classes. In the substances network, we see that tobaccosmoke and herbicides are dyadic, and their group members (substances) tend to cause thesame diseases. However, herbicides are also heterophilic, and are responsible for diseases be-longing to different classes. Organochlorines and heavy metals are neither heterophilic norheterophobic, but dyadic, causing the same subset of diseases. At the other end of the spec-trum, fungicides are highly heterophilic, taking part in causing diseases in many differentgroups. Volatile organic compounds are the most neutral substances.
4. Conclusions & Future Work
Environmental exposure data are part of most recent GWAS. They are however limited tothe disease of interest and centered around factors possibly impacting that particular disease.In this work, we take a global approach, conducting an in-depth literature search to identifychemical substances present in the environment and their possible adverse effects on our health.The result is the Human Phenotype Network, based on common causal substances. Breastcancer and injury to the fetus are the most connected phenotypes in the network, makingthem the most susceptible to environmental chemicals, namely the heavy metals: mercury,lead and cadmium. These are in turn the environmental substances associated with the mostdiseases. Moreover, the substance-class dyadicity analysis of both projected networks revealsthat all substance classes in the phenotype network are dyadic, and tend to connect to similarclasses. However, only about half of them are also heterophilic, also connecting to differentsubstance families.
The information gathered in this study is meant to be complementary to the genome inhelping us understand complex diseases, their commonalities, their causes, and how to preventand treat them. The current work is limited by the availability of reliable exposure data linkedto human diseases.
We are planning on extending this work in several directions. First, we will add geograph-ical information into the model, as most of the environmental chemical substances are limitedin their physical locations. Secondly, it would be interesting, though challenging due to thelack of available data, to segregate the diseases by ethnic background. Finally, we will mergethe chemical-substance based HPN to the genetic HPN,25 analyzing the overlap and differ-ences. Combined, this new global HPN has the potential to inform us on both genetic andenvironmental causes of a large array of common and complex disease.
Acknowledgments
Financial supported by NIH grants R01 EY022300, LM009012, LM010098, AI59694.
References
1. A. A. Rooney, A. L. Boyles, M. S. Wolfe, J. R. Bucher and K. A. Thayer, Environ Health Perspect122, 711 (Jul 2014).
2. K.-I. Goh, M. E. Cusick, D. Valle, B. Childs, M. Vidal and A.-L. Barabasi, Proceedings of theNational Academy of Sciences 104, 8685 (2007).
3. C. Darabos, M. J. White, B. E. Graham, D. N. Leung, S. Williams and J. H. Moore, BioDataMin 7, p. 1 (Jan 2014).
4. M. Newman, Networks: An Introduction (Oxford University Press, Inc., New York, NY, USA,2010).
5. C. P. Wild, Cancer Epidemiol Biomarkers Prev 14, 1847 (Aug 2005).6. J. D. Pleil and L. S. Sheldon, Biomarkers 16, 99 (2011), PMID: 21138393.7. D. Welter, J. MacArthur, J. Morales, T. Burdett, P. Hall, H. Junkins, A. Klemm, P. Flicek,
T. Manolio, L. Hindorff and H. Parkinson, Nucleic Acids Res 42, D1001 (Jan 2014).8. C. J. Patel, J. Bhattacharya and A. J. Butte, PLoS ONE 5, p. e10746 (05 2010).9. L. Faisandier, V. Bonneterre, R. De Gaudemaris and D. J. Bicout, J Biomed Inform 44, 545
(Aug 2011).10. M. Vrijheid, R. Slama, O. Robinson, L. Chatzi, M. Coen, P. van den Hazel, C. Thomsen,
J. Wright, T. J. Athersuch, N. Avellana, X. Basagana, C. Brochot, L. Bucchini, M. Busta-mante, A. Carracedo, M. Casas, X. Estivill, L. Fairley, D. van Gent, J. R. Gonzalez, B. Granum,R. Grazuleviciene, K. B. Gutzkow, J. Julvez, H. C. Keun, M. Kogevinas, R. R. C. McEachan,H. M. Meltzer, E. Sabido, P. E. Schwarze, V. Siroux, J. Sunyer, E. J. Want, F. Zeman and M. J.Nieuwenhuijsen, Environ Health Perspect 122, 535 (Jun 2014).
11. P. Juarez, J Health Care Poor Underserved 24, 114 (Feb 2013).12. C. Darabos, K. Desai, R. Cowper-Sallari, M. Giacobini, B. Graham, M. Lupien and J. Moore,
Inferring human phenotype networks from genome-wide genetic associations, in EvolutionaryComputation, Machine Learning and Data Mining in Bioinformatics, eds. L. Vanneschi, W. Bushand M. Giacobini, Lecture Notes in Computer Science, Vol. 7833 (Springer Berlin Heidelberg,2013) pp. 23–34.
13. H. Li, Y. Lee, J. L. Chen, E. Rebman, J. Li and Y. A. Lussier, Journal of the American MedicalInformatics Association : JAMIA 19, 295 (January 2012).
14. X. Zhou, J. Menche, A.-L. Barabasi and A. Sharma, Nat Commun 5 (06 2014).15. D. J. Watts and S. H. Strogatz, Nature 393, 440 (1998).16. J. Park and A.-L. Barabasi, Proceedings of the National Academy of Sciences 104, 17916 (2007).17. E. I. Hamilton, Sci Total Environ 249, 171 (Apr 2000).18. M. A. Rahman, M. M. Rahman, S. M. Reichman, R. P. Lim and R. Naidu, Ecotoxicol Environ
Saf 100, 53 (Feb 2014).19. S. A. S. Petkovsek and B. Pokorny, Sci Total Environ 443, 944 (Jan 2013).20. M. Vahter, S. A. Counter, G. Laurell, L. H. Buchanan, F. Ortega, A. Schutz and S. Skerfving,
Int Arch Occup Environ Health 70, 282 (1997).21. T. Yoshida, Q. Gan, A. S. Franke, R. Ho, J. Zhang, Y. E. Chen, M. Hayashi, M. W. Majesky,
A. V. Somlyo and G. K. Owens, J Biol Chem 285, 21175 (Jul 2010).22. Y. Chen, Z. Xiang, H. Li, N. Yang and H. Zhang, J Tongji Med Univ 19, 27 (1999).23. R. Said, Y. Ye, D. S. Hong, F. Janku, S. Fu, A. Naing, J. J. Wheler, R. Kurzrock, C. Thomas,
G. A. Palmer, K. R. Hess, K. Aldape and A. M. Tsimberidou, Oncotarget 5, 3871 (Jun 2014).24. M. Witkowska and P. Smolewski, Postepy Hig Med Dosw (Online) 68, 301 (2014).25. C. Darabos, M. White, B. Graham, D. Leung, S. Williams and J. Moore, BioData Mining 7,
p. 1 (2014).


![[ACM-ICPC] Bipartite Matching](https://img.pdfslide.net/doc/110x75/555603e0d8b42a3f168b4834/acm-icpc-bipartite-matching.jpg)