Embed Size (px)
Citation preview
Chapter 2A Brief History of Thermal Comfort:From Effective Temperature to AdaptiveThermal Comfort
Abstract The study of Thermal Comfort was born in the early decades of thetwentieth century, with the studies of Gagge AP to resolve particular problems dueto stressful situations in the workplace. The period after the war and in the sev-enties, with Fanger PO and other researchers marked the study as a real discipline.This chapter is a brief history of the discipline that studies Thermal Comfort.
Keywords History of comfort � Comfort � Architecture � Gagge and Fanger �Thermal sensation � Adaptive Thermal Comfort
2.1 The Discipline of Comfort
The discipline of well-being (or Comfort), Thermal Comfort, and the same conceptof a comfortable environment, was born in the twentieth century, when it becamepossible to control—directly—the microclimate of the indoor environment: houses,vehicles, etc.
In previous centuries indoor comfort conditions were controlled by adaptiveprocesses related to behaviour and clothing, in addition to the use of fireplaces orstoves to control the temperature. Not being able to act on the comfort of the rooms,it was not useful to study the parameters that could influence on comfort. Inaddition to studying comfort it was necessary to model the building as an opensystem and apply the laws of thermodynamics, a discipline born in the second halfof the nineteenth century.
In the twentieth century the architectural theories (Mouvement modern,Functionalism, Bauhaus, Le Corbusier with Le Modulor, De Stijl, CIAM,International Style, etc.) and technical manuals, put man at the centre, as an indi-vidual with a physical dimension, founded an interest in the design and constructionof residential buildings.
Thanks to heating systems and air conditioning like those invented by WillisCarrier, it becomes possible for the individual to adjust the characteristics of theirown indoor environments, and consequently to demand the best indoor comfortconditions.
© Springer International Publishing Switzerland 2015K. Fabbri, Indoor Thermal Comfort Perception,DOI 10.1007/978-3-319-18651-1_2
7
The history of comfort came as other inventions, in the military, when it becamenecessary to ensure that the military could continue to work on ships and airplaneseven in environments with high temperatures.
Comfort is the result of the interaction of physical exchanges, physiological,psychological, social and cultural rights, it depends on the architecture, the clothing,the eating habits and the climate.
The history of the discipline that deals with studying comfort, especiallyThermal Comfort is recent. Before beginning to describe the tools, the physicaldimensions and indexes to evaluate comfort, a brief history of the Thermal Comfortis given: a first embodiment of physical-physiological, up to a greater level ofdetail, the Adaptive Thermal Comfort, and the study of Thermal Comfort forspecific types of subjects such as in the case of children, and also the evaluation ofperceptual cognitive aspects, the subject of this book.
2.2 The Beginnings A.P. Gagge and the MilitaryRequirements
In 1936 A. Pharo Gagge (1908–1993) of J.B. Pierce Laboratory of Hygiene of NewHave Connecticut, in the article “The linearity criterion as applied to partitionalcalorimetry” (Gagge 1936), in which, by processing the experimental data on therelationship of the human body and environment, shows the expression of the firstprinciple of thermodynamics for the human body. The model consists of two nodes:the “core”, or inside of the human body that produces energy through the metabolicactivity and the mechanical work (muscles), and the “skin” that exchange energyand matter outward. Gagge was not the only one in the thirties, to deal with theseissues (Bedford 1936), but was the first dedicated to find an application of theprinciples of thermodynamics to energy exchanges between man and hisenvironment.
The “Two node model” proposed by Gagge provides that the sum of the thermalexchanges due to metabolic activity, the body’s energy, evaporation, radiation andconduction are zero.
In this way, writes the Human Body Heat Balance, where the variation of theaccumulated heat of the body to keep its temperature at 37 °C is given by the sumof the metabolic energy, (as measured by oxygen consumed) of the dispersions dueto the evaporation and the sweat, the energy flow through body boundary by:conduction, conventions and thermal radiation.
The JB Pierce Laboratory was founded in 1933, adjacent to the medical school atYale University, with a mission to promote research to increase the knowledge andthe advancement of human health and comfort. The will to establish such aninstitution is due to the “John B. Pierce Foundation”, founded in 1924, as a result ofthe legacy of John Bartlett Pierce (1844–1917) businessman and founder of the“American Radiator Company”, with the purpose of promoting research, education,
8 2 A Brief History of Thermal Comfort: From Effective Temperature …
technical and scientific work in the field of heating ventilation and health care, toincrease the knowledge to improve the health and comfort of men and their homes.
John B. Pierce was born in 1824 and began his career in a shop selling stoves inBuffalo. In 1892 he founded a factory for the production of boilers, heating systemsand radiators, which was successful and became one of the most importantindustries of heating systems in the United States. In 1917, following his death,having no children, he left a fund of more than a million dollars to friends andemployees, who decided to establish a foundation and then the institute, in memoryof J.B. Pierce.
The experience of J.B. Pierce, like T.A. Edison or W.H. Carrier, highlights whatis the link between the industrial and entrepreneurial activities and the activities ofresearch, particularly in the United States.
Space heating is related to the health of the population, both these issuesincluded the business of J.B. Pierce and his philanthropic interests, which led to thefoundation of J.B. Pierce Laboratories. In this laboratory, since the thirties of thetwentieth century, with the pioneer works of (Winslow et al. 1937) were defined thephysical and physiological principles to understand and measure the thermalexchanges between body and human environments.
The research in this area continues along two lines:
– An inherent thermodynamic study of the physiological processes, continuing thefirst approaches of the studies of von Helmholtzz,
– While the other focuses on the relationship between the human body and theenvironment, and the indices of well-being, that depend on physical factors, andphysiological behaviour.
The biophysicist Gagge AP was born in 1908 in Columbus, Ohio, and, aftergraduating in physics at the University of Virginia, obtained a doctorate in physicsin 1933 at Yale where he worked with the J.B. Pierce Laboratory. Here the conceptsof thermodynamics were applied to physiology, through a series of experimentswhich measured the behaviour of the human body. In 1936 the article was pub-lished (Gagge 1936) which elaborates the “Two node model” temperature controlsystem, the equation of heat balance of the human body.
In the years of World War II working in the medical aviation laboratories in theWright Patterson Air Force, where he developed the equipment to ensure respira-tion to an altitude of 43,000 ft for airline pilots, and continued to work with aviationup to 1963.
The studies of Gagge AP helped define the field of study of the energyexchanges between the human body and the environment, the applications of whichhave repercussions in the field of health and safety in the workplace, in the military,in space exploration and in the design of buildings.
In the seventies of the twentieth century, the Danish physiologist Povl OleFanger (1934–2006), following a series of experiments and tests that allowed himto define the indexes of comfort and well-being, revised the equation of the“two-node model”, setting equal to zero the variation of the amount of energy
2.2 The Beginnings A.P. Gagge and the Military Requirements 9
necessary to the human body at 37 °C, and expresses energy exchanges of thehuman body with a double equation.
In severe cold or hot workplace environments how can you evaluate if theconditions are due to discomfort or abnormal working conditions, as long as theyare tolerable?
On these issues, we began to carry out the first study in the twenties of thetwentieth century, in the United States and the United Kingdom. The first studies oncomfort were developed, based on empirical rules, and by researchers Houghten FCand Yagloglou CP who simulated different conditions in the laboratories of ASHVEPittsburg research laboratories (American Society of Heating and VentilatingEngineers) to locate the comfort zone.
In 1923 the article “Determination of the comfort zone” was published in thejournal of ASHVE (Houghten and Yagloglou 1923a, b) and the study “Determininglines of equal comfort” was published, again in 1923 (Houghten and Yaglou 1923b)in which lines of comfort were proposed, on the psychrometric chart (or ASHRAE)of the moist air, which corresponds to the empirical index called “EffectiveTemperature (ET)”, corresponding to the correspondence between the temperatureof the real environment and the temperature of a notional environment in whichthere is no temperature difference between the ambient air and that of the walls,there are no currents of air and the relative humidity corresponds to 100 %.
In summary, the equivalent temperature of an environment corresponds to thesame temperature there would be in an environment where the temperature isuniform, the air is stationary and the moisture content corresponds to 100 %, andtherefore the human body can not exchange energy with the environment. The logicis that of an analogy between the variables of an environment and any conditions ofa standard environment, for example the actual temperature of an environmentwhich is at 22 °C with relative humidity of 50 % and air speed of 0.2 m/s, is equalto the temperature that the subject would receive in an environment where therelative humidity is equal to 100 % and the air is stationary, which corresponds tothe actual temperature of about 19.6 °C. (Houghten and Yagloglou 1953).
The equation does not take into account the variables linked to the person, and insubsequent studies ASHVE by means of experimental tests, in 1932, following thestudies of researchers Vernon H.M. and Warner and C.G. “The influence of thehumidity of the air on capacity of work at high temperature” (Vernon and Warner1932) it was decided to include the air velocity in the diagrams of wellness.
The analytical study was elaborated in the hygiene laboratory of the J.B. PierceInstitute, by A.P. Gagge and others in 1971, with the article “An effective tem-perature scale based on a simple model of human physiological regulatoryresponse” (Gagge et al. 1971) which introduces the “Effective Temperature Scale”which takes into account the clothing, activity and radiation exchange, expressedthrough a series of nomograms.
In the seventies there were several studies on comfort (Rohles and Levins 1971;Rohles and Johnson 1972; Givoni and Pandolf 1973; Gagge and Nishi 1976) and inthe eighties (Bell 1981; Collins and Hoinville 1980).
10 2 A Brief History of Thermal Comfort: From Effective Temperature …
The actual temperature is an index based on the empirical basis of an analogybetween the real environment and the standard environment, among these in 1957as a result of the studies in the US military centres, Yaglou and Minard, in “Controlof heat causalities at military training center “(Yaglou and Minard 1957) developedthe Wet Bulb Globe temperature (WBGT) an indicator that combines the effect oftemperature, relative humidity, heat exchange by radiation and solar radiation, andis used to determine the extent of exposure to heat conditions.
Along the same lines were introduced other temperature indicators for “extreme”climatic conditions in any case different from the standard conditions of the envi-ronments and buildings in climatic condition temperatures.
These include the Equatorial Comfort Index (ECI) comfort index equator,developed in 1959, based on 393 observations, from Webb CG in “An analysis ofsome observation of thermal comfort in an equatorial climate” (Webb 1959) thatcorresponds to the response of a subject perfectly acclimatized in the equatorialclimatic conditions, and the Tropical summer Index (IST) developed in the eightiesby the Central Building Research Institute Roorkee (India) to evaluate the welfareconditions in countries where the relative humidity is greater than 50 %.
2.3 The Revolution of Povl Ole Fanger: Evaluatingthe Thermal Sensation
The sixties and seventies of the twentieth century are fertile with studies on thesubject, and in addition to the studies of the Pierce Laboratory by Gagge and otherAmerican scholars who focused on the indices of thermal stress and the approach toengineering, probably derived from the role ASHRAE had and the air-conditionedbuilding in the United States.
In parallel grew a European approach to the problem, in which focused on theevaluation of the “feel-good”. The first to set the research in this direction was PovlOle Fanger (1934–2006), physiologist of the Technical University of Denmark, thecapostipide on the study of the welfare of confined spaces. Fanger focused on therelationship between the physical parameters of an environment and the physio-logical parameters of people, and the perception of wellbeing expressed by thepeople themselves.
The research began in the sixties of the twentieth century at the Laboratory ofHeating and Air Conditioning of the Technical University of Denmark and also atthe Institute for Environmental Research at Kansas State University. After 5 yearsof study Fanger published, in 1967, the article “Calculation of Thermal Comfort:Introduction of a basic comfort equation” (Fanger 1967) which proposes a ratingscale of perceived sense of wellbeing.
Following successive trials and research in 1970 he published the book“Thermal Comfort” (Fanger 1970), which defines the contents of a new discipline:the study of the condition of comfort and well-being in indoor environments.
2.2 The Beginnings A.P. Gagge and the Military Requirements 11
The conceptual leap introduced by Fanger, compared to previous studies, is inthe introduction of the rating/judgment scale from the people themselves. Based onthe feedback and the votes of thermal sensation expressed by people, Fangerelaborates an equation that relates the physical physiological environmentalparameters, and indexes of thermal sensation.
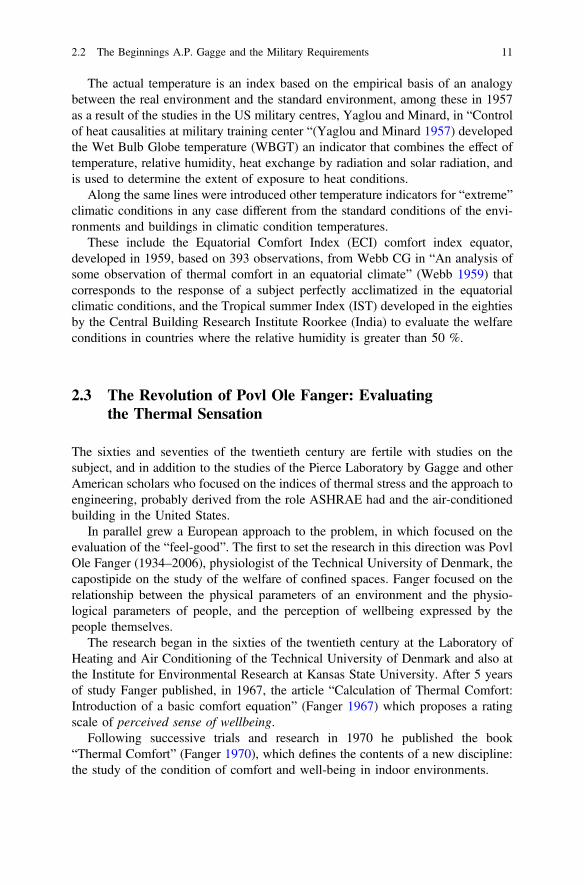
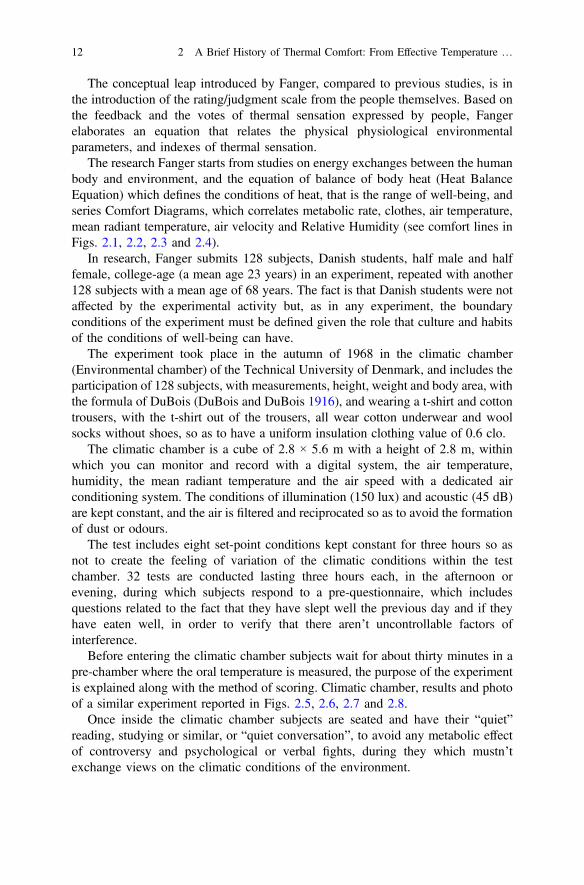
The research Fanger starts from studies on energy exchanges between the humanbody and environment, and the equation of balance of body heat (Heat BalanceEquation) which defines the conditions of heat, that is the range of well-being, andseries Comfort Diagrams, which correlates metabolic rate, clothes, air temperature,mean radiant temperature, air velocity and Relative Humidity (see comfort lines inFigs. 2.1, 2.2, 2.3 and 2.4).
In research, Fanger submits 128 subjects, Danish students, half male and halffemale, college-age (a mean age 23 years) in an experiment, repeated with another128 subjects with a mean age of 68 years. The fact is that Danish students were notaffected by the experimental activity but, as in any experiment, the boundaryconditions of the experiment must be defined given the role that culture and habitsof the conditions of well-being can have.
The experiment took place in the autumn of 1968 in the climatic chamber(Environmental chamber) of the Technical University of Denmark, and includes theparticipation of 128 subjects, with measurements, height, weight and body area, withthe formula of DuBois (DuBois and DuBois 1916), and wearing a t-shirt and cottontrousers, with the t-shirt out of the trousers, all wear cotton underwear and woolsocks without shoes, so as to have a uniform insulation clothing value of 0.6 clo.
The climatic chamber is a cube of 2.8 × 5.6 m with a height of 2.8 m, withinwhich you can monitor and record with a digital system, the air temperature,humidity, the mean radiant temperature and the air speed with a dedicated airconditioning system. The conditions of illumination (150 lux) and acoustic (45 dB)are kept constant, and the air is filtered and reciprocated so as to avoid the formationof dust or odours.
The test includes eight set-point conditions kept constant for three hours so asnot to create the feeling of variation of the climatic conditions within the testchamber. 32 tests are conducted lasting three hours each, in the afternoon orevening, during which subjects respond to a pre-questionnaire, which includesquestions related to the fact that they have slept well the previous day and if theyhave eaten well, in order to verify that there aren’t uncontrollable factors ofinterference.
Before entering the climatic chamber subjects wait for about thirty minutes in apre-chamber where the oral temperature is measured, the purpose of the experimentis explained along with the method of scoring. Climatic chamber, results and photoof a similar experiment reported in Figs. 2.5, 2.6, 2.7 and 2.8.
Once inside the climatic chamber subjects are seated and have their “quiet”reading, studying or similar, or “quiet conversation”, to avoid any metabolic effectof controversy and psychological or verbal fights, during they which mustn’texchange views on the climatic conditions of the environment.
12 2 A Brief History of Thermal Comfort: From Effective Temperature …
Fig. 2.1 Comfort Lines(ambient temperature vs. wetbulb temperature with relativeair velocity as parameter) forperson withLIGHT CLOTHING(Icl = 0.5 cl, fcl = 1.1) at threedifferent activity levels(Fanger 1970)
2.3 The Revolution of Povl Ole Fanger: Evaluating the Thermal Sensation 13
Fig. 2.2 Comfort Lines(ambient temperature vs. wetbulb temperature with relativeair velocity as parameter) forperson withHEAVY CLOTHING(Icl = 1.5 cl, fcl = 1.2) at threedifferent activity levels(Fanger 1970)
14 2 A Brief History of Thermal Comfort: From Effective Temperature …
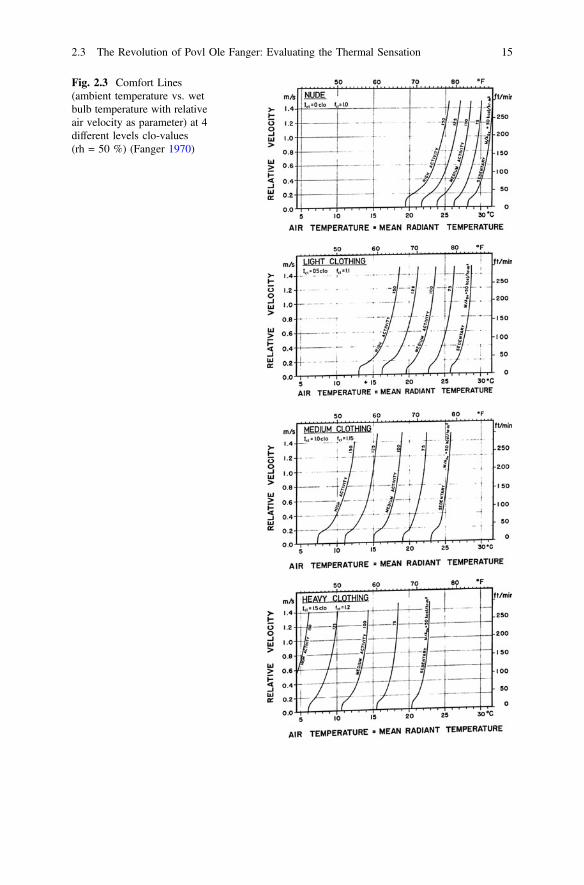
Fig. 2.3 Comfort Lines(ambient temperature vs. wetbulb temperature with relativeair velocity as parameter) at 4different levels clo-values(rh = 50 %) (Fanger 1970)
2.3 The Revolution of Povl Ole Fanger: Evaluating the Thermal Sensation 15
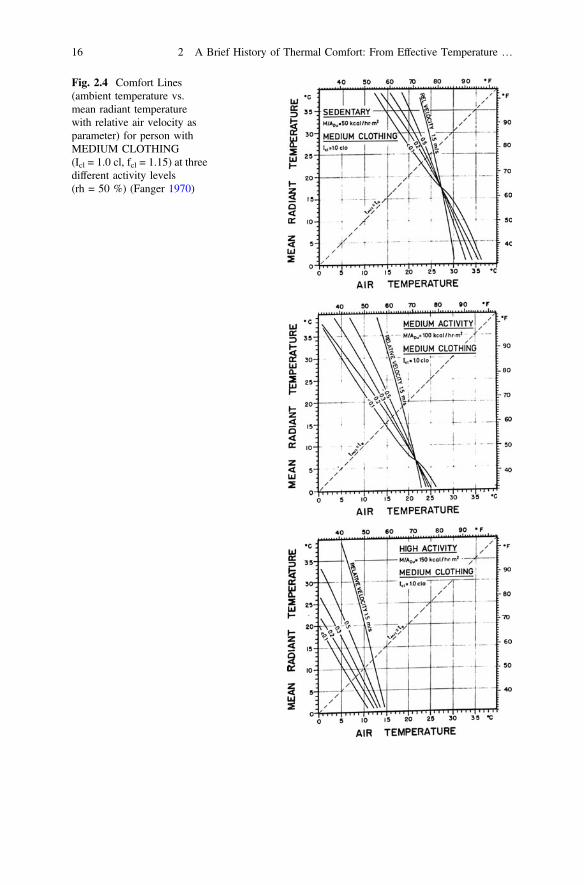
Fig. 2.4 Comfort Lines(ambient temperature vs.mean radiant temperaturewith relative air velocity asparameter) for person withMEDIUM CLOTHING(Icl = 1.0 cl, fcl = 1.15) at threedifferent activity levels(rh = 50 %) (Fanger 1970)
16 2 A Brief History of Thermal Comfort: From Effective Temperature …
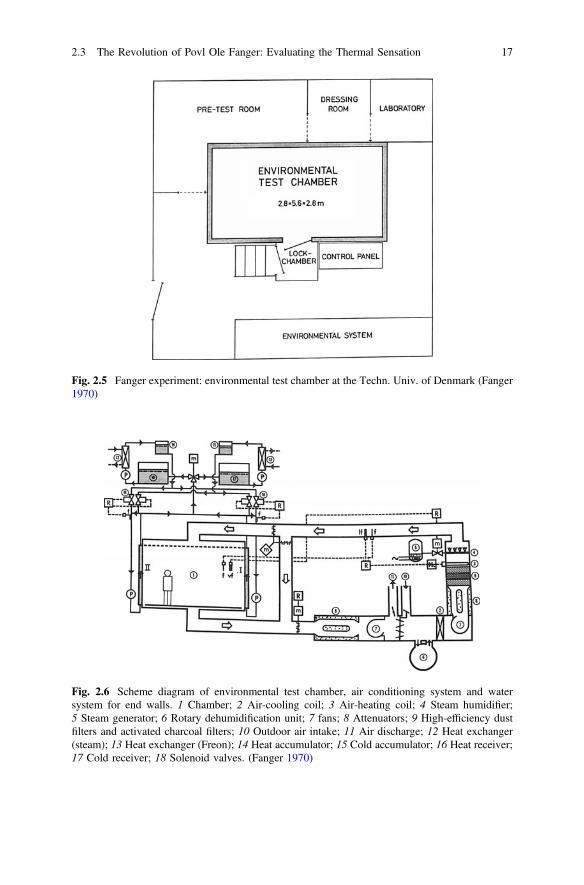
Fig. 2.5 Fanger experiment: environmental test chamber at the Techn. Univ. of Denmark (Fanger1970)
Fig. 2.6 Scheme diagram of environmental test chamber, air conditioning system and watersystem for end walls. 1 Chamber; 2 Air-cooling coil; 3 Air-heating coil; 4 Steam humidifier;5 Steam generator; 6 Rotary dehumidification unit; 7 fans; 8 Attenuators; 9 High-efficiency dustfilters and activated charcoal filters; 10 Outdoor air intake; 11 Air discharge; 12 Heat exchanger(steam); 13 Heat exchanger (Freon); 14 Heat accumulator; 15 Cold accumulator; 16 Heat receiver;17 Cold receiver; 18 Solenoid valves. (Fanger 1970)
2.3 The Revolution of Povl Ole Fanger: Evaluating the Thermal Sensation 17
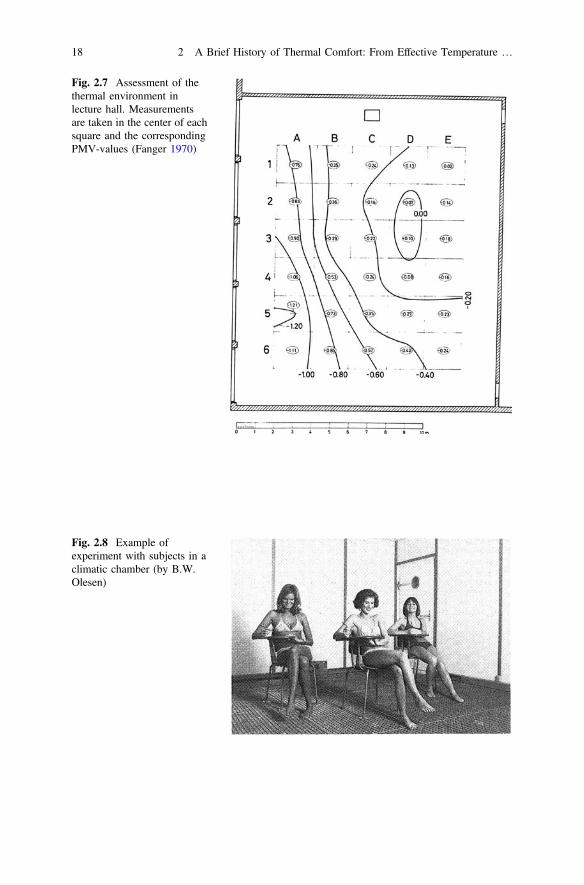
Fig. 2.7 Assessment of thethermal environment inlecture hall. Measurementsare taken in the center of eachsquare and the correspondingPMV-values (Fanger 1970)
Fig. 2.8 Example ofexperiment with subjects in aclimatic chamber (by B.W.Olesen)
18 2 A Brief History of Thermal Comfort: From Effective Temperature …
After about half-hour they are asked to complete the questionnaire giving a scoreto the ambient weather conditions: cold, cool, slightly cool, neutral, slightly warm,warm, hot.
The scoring is repeated every half hour for a total of six scores for the subject.The subjects are weighed in sitting position before the first vote and after the sixthvote with a precision balance so as to determine the weight loss due to evaporation,during the test they may drink but not to eat, and the amount of drinks is measured.After the sixth questionnaire a score on the temperature that the subject feelscomfortable in the experiment, to which subjects respond more or less indicatingthe same value.
In the experimentation Fanger aims to eliminate any factors that might disturbthe evaluation scale of judgment, or at least to evaluate their impact, and it isinteresting, as well as the evaluation of a parameter with many variables, what is thesense of comfort, that can be measured once the criteria and the assessment scaleare determined. At the end of the test a questionnaire is completed on dietary habits,sleep and the menstrual cycle, so as to identify any abnormalities or factors that mayhave influenced the test.
The same Fanger presents a series of considerations about the geographicallocation, the equation for calculating the predicted mean score on the well-being ofan environment is valid for people who live in temperate climates, as there are nosignificant variations between the different age groups, except that older people andwomen prefer slightly warmer environments, although this difference is irrelevant,as they are not being investigated, but children.
The comfort index introduced by Fanger is the Predicted Mean Vote (PMV) thatallows you to express the score that a person gives to an environment, from themeasurement of the physical parameters of the environment: air temperature, meanradiant temperature, air speed and humidity, and from the metabolic rate andclothing of the subject itself.
The index allows you to find an area of well-being bounded by the values of thephysical parameters of the environment, which can also be reported on theASHRAE Psychrometric Chart, within which the environment is considered interms of comfort. The practical use enables you to define the conditions forset-point of the environments and the variables of the heating systems in buildingsfor collective use, such as cinemas, theaters, hospitals, shopping centers, etc.
The PMV expresses the opinion of the people, but does not assess what is theacceptability of the conditions of comfort, even under conditions in which the scoreis positive, for example with a value of PMV equal to—0.3 (a little “slightly cold”with respect to the neutral feeling) it was not able to assess whether it is a conditionin which the majority of people consider as an acceptable condition.
Following these considerations Fanger proposes an index for the evaluation ofthe conditions of non-comfort (or discomfort) to an environment, expressed as aPredicted Percentage of Dissatisfied (PPD). The PPD index expresses the per-centage of people in those conditions of metabolism, clothing and physicalparameters of the environment, expressing, however, a negative judgment, in fact
2.3 The Revolution of Povl Ole Fanger: Evaluating the Thermal Sensation 19
complain; even when an environment is assessed by most people as neutral, it isbelieved that there are however 5 % of people who consider this condition asunsatisfactory.
In the case of a room where there are 20 people, even if you are in conditions ofcomfort “neutral”, at least one person will complain because it is either too hot ortoo cold, consider that this is what happens in the compartment of a train or in thewaiting room of a doctor to confirm, at least empirically, this report.
The PPD-PMV Diagram allows you to check what percentage of people aredissatisfied (PPD) to vary the judgment on the feeling of comfort PMV, which inturn depends always on the same physical parameters of the environment, relativehumidity, air speed and temperature and mean radiant, metabolism and changingroom. Varying the PMV to the extreme conditions, “very cold” or “very hot”,increase, according to a logarithmic law, or exponentially, the percentage of peoplewho declare themselves as dissatisfied.
The dissatisfaction of the microclimate of an environment is expressed withother indicators, indices of stress and indices of local discomfort, due tonon-uniformity of the parameters in the environments, also considering the HeatStress Indices (Epstein and Moran 2006).
The Index of Thermal Stress (ITS) was introduced by Israeli architect BaruchGivoni (1932–present), a graduate of the Faculty of Architecture at the Institute ofTechnology in Israel, who then who specialized with a Master and Doctorate inHygiene and Public Health at the School of Medicine of the University of Jerusalem(1963) that in the study “Estimation of the effect of climate on man: developing anew thermal index” (Givoni 1963) then took up in the book “Man, climate andarchitecture” in 1969 (Givoni 1969), which expresses the amount of heat transferredfrom the human body through perspiration to maintain a given condition of com-fort. When the index is high this means that the body gives more thermal energythan is normally required (under stress) to stay in conditions of well-being.
The text of Baruch Givoni in 1969, followed another crucial work in thearchitecture and construction industry, the book by architect Victor Olgyay(1910–1970) “Design with Climate” of 1963 (Olgyay 1963) that constitutes thecornerstone of architecture called “bioclimatic”. Olgyay studies the relationshipbetween the architectural form of the buildings and the related climate, albeit in anempirical way in the exchange of energy that the building has with the context.
From these two books, and the book by Edward Mazria “The Passive SolarEnergy Book” of 1979 (Mazria 1979), develops that part of the architectural design,solar architecture, passive architecture (or passive buildings), green architecture,bioclimatic architecture.
Other indicators of discomfort are introduced, in the sixties, by Tennenbaum inthe article “The physiological significance of the cumulative discomfort index” of1961 (Tennenbaum et al. 1961; Sohar et al. 1962) and other research centres inwhich students of the same Fanger, such as Bjarne Olesen Wilkens (1947–present),an engineer from the Technical University of Denmark continuing the approach ofthe master, studied indexes of local discomfort and air quality, the sector which isnow active.
20 2 A Brief History of Thermal Comfort: From Effective Temperature …
The indices of local discomfort depend on the uneven distribution of environ-mental parameters, in Tennenbaum et al. (1961) in confined spaces such as homes,hospital or hotel rooms, schools and buildings in general, but also trains, planes andautomobiles. The causes of discomfort can be due to the temperature differencebetween the floor and the ceiling, the said radial asymmetry and leads to anon-homogeneous distribution of the surface temperature of the skin between theankle and head, and the uncomfortable feeling of having hot/cold in the head, also inthis case it is possible to express a percentage of dissatisfied in relation to the differencein temperature between the ankles and the head, for example if the difference isbetween 5° and 8 °C to at least half of the subjects you declare as dissatisfied.
First studies and the evolution brought by Fanger PO in the discipline, thescientific literature has deepened the physiological basis of comfort, human bodyand human dynamic thermoregulatory system, thermal comfort models and tech-niques, several studies on adaptive approach, how resumed in review paper vanHoff (2008), Djongyang et al. (2010), Frontczak and Wargocki (2011), and Mishraand Ramgopal (2013).
2.4 The Last Frontier: The Adaptive Thermal Comfort
The last frontier in the study of Thermal Comfort is the study of the AdaptiveThermal Comfort (Olesen and Parsons 2002; Brager and de Dear 1998; Schweikeret al. 2012; Humphreys and Hancock 2007; Halawa and van Hoof 2012), an ap-approach that takes into account the variations that the individual shall, in any case,even in a condition of neutral PMV, to feel in comfortable condition. This approachtakes into account the dynamic variation of environmental conditions internal andexternal, and the individual.
The other field of study concerns the extension of the entities and individuals,not only adult men and women, healthy, but also sick, the elderly, children, and notonly the psychic, but also with the cognitive information and results that can beuseful for the design.
This book is a contribution in this direction.
References
Bedford T (1936) The warmth factor in comfort at work: a physiological study of heating andventilation. Industrial Health Research Board No 76, HMSO, London
Bell PA (1981) Physiological, comfort, performance, and social effects of heat stress. J Soc Issues37:71–94
Brager GS, de Dear R (1998) Thermal adaptation in the built environment: a literature review.Energy Build 27:83–96
Collins KJ, Hoinville E (1980) Temperature requirements in old age. Build Serv Eng Res Technol1(4):165–172
2.3 The Revolution of Povl Ole Fanger: Evaluating the Thermal Sensation 21
Djongyang N, Tchinda R, Njomo D (2010) Thermal comfort: a review paper. Renew SustainEnergy Rev 14:626–2640
Du Bois D, Du Bois EU (1916) Tenth paper a formula to estimate the approximate surface are ifheight and weigh be known. Arch Intern Med 17(6–2):863–871
Epstein Y, Moran DS (2006) Thermal comfort and the heat stress indices. Ind Health 44:388–398Fanger PO (1967) Calculations of thermal comfort: introduction of a basic comfort equation.
ASHRAE Trans 73:1–4Fanger PO (1970) Thermal comfort-analysis and applications in environmental engineering.
Danish Technical Press, CopenhagenFrontczak M, Wargocki M (2011) Literature survey on how different factors influence human
comfort in indoor environments. Build Environ 46:922–937Gagge AP (1936) The linearity criterion as applied to partitional calorimetry. Am J Physiol
31:656–668Gagge AP, Nishi Y (1976) Physical indices of the thermal environment. ASHRAE J 18:47–51Gagge AP, Stolwijk JAJ, Nishi Y (1971) An effective temperature scale based on a simple model
of human physiological regulatory response. ASHRAE Trans 77:247–262 (part. 1)Givoni B (1963) Te effect of climate on man: development of a new thermal index. Research
report to UNESCO, Building Research Station, Technion, HaifaGivoni B (1969) Man, climate and architecture. Elsevier Publishing Company Limited, New YorkGivoni B, Pandolf RR (1973) Predicting heart rate responseto work, environment and clothing.
J Appl Physiol 34:201–204Halawa E, van Hoof J (2012) The adaptive approach to thermal comfort: a critical overview.
Energy Build 51:101–110Houghten FC, Yagloglou CP (1923a) Determination of the comfort zone, ASHVE Trans 29Houghten FC, Yaglou CP (1923b) Determining equal comfort lines. J Am Soc Heat Vent Engrs
29:165–76Houghten FC, Yagloglou CP (1953) Determining lines of equal comfort. Trans Am Soc Heating
Ventilating Eng 29:165–176Humphreys MA, Hancock M (2007) Do people like to feel ‘neutral’? Exploring the variation of
the desired thermal sensation on he ASHRAE scale. Energy Build 39:867–874Mazria E (1979) Passive solar energy book. Rodale Press, EmmausMishra AK, Ramgopal M (2013) Field studies on human thermal comfort—an overview. Build
Environ 64:94–106Olesen BW, Parsons KC (2002) Introduction to thermal comfort standards and to the proposed
new versione of EN ISO 7730. Energy Build 34:537–548Olgyay V (1963) Design with climate: bioclimatic approach to architectural regionalism. Princeton
University Press, PrincetonRohles F, Johnson MA (1972) Thermal comfort in the elderly. ASHRAE Trans 78:131–137 (Part I)Rohles FJ, Levins R (1971) The nature of thermal comfort for sedentary man. ASHRAE Trans
77:239–246Schweiker M, Brasche S, Bischof W, Hawighorst M, Voss K, Wagner A (2012) Development and
validation of a methodology to challenge the adaptive comfort model. Build Environ 49:336–347
Sohar E, Tennenbaum DJ, Robinson N (1962) A comparison of the cumulative discomfort index(Cum DI) and cumulative effective temperature (Cum ET), as obtained by meteorological data.In: Tromp SW (ed) Biometeorology. Pergamon Press, Oxford, pp 395–400
Tennenbaum J, Sohar E, Adar R, Gilat T (1961) The physiologial significance of the cumulativediscomfort index. Harefuah 60:315–319
van Hoff J (2008) Forty years of Fanger’s model of thermal comfort: comfort for all ? Indoor Air18:182–201
Vernon HM, Warner CG (1932) The influence of the humidity of the air on capacity for work athigh temperatures. J Hyg (Lond) 32(3):431–463
Webb CG (1959) An analysis of some observation of thermal comfort in an equatorial climate.Brit J Ind Med 16(4):297–310
22 2 A Brief History of Thermal Comfort: From Effective Temperature …

Winslow C-EA, Herrington LP, Gagge AP (1937) Physiological reaction of the human body tovarious atmospheric humidities. contribution n.° 16 from the John B.Pierce Laboratory ofHygiene, New Haven, pp 288–299
Yaglou CP, Minard D (1957) Control of heat causalities at military training center. Am Med AssArch Ind Hlt 16:302–316
References 23

http://www.springer.com/978-3-319-18650-4


![Effect of Humidity on Thermal Comfort in the …Thermal comfort is a state of mind which describes the satisfaction toward the indoor thermal environment [1] [2]. Air dry bulb temperature,](https://img.pdfslide.net/doc/110x75/5e6e3bf4f1efc940fd5ba08d/effect-of-humidity-on-thermal-comfort-in-the-thermal-comfort-is-a-state-of-mind.jpg)