Embed Size (px)
Citation preview

1
A Brief Introduction to Systems Biology: Gene Regulatory Networks
Rajat K. De
Machine Intelligence Unit, Indian Statistical Institute203 B. T. Road Kolkata 700108email id: [email protected]

Informatics related to various molecules: Bioinformatics
• Genome project proving information on structures of genes
• Structures of proteins
• Mapping functional annotation
• Expression levels of genes
2
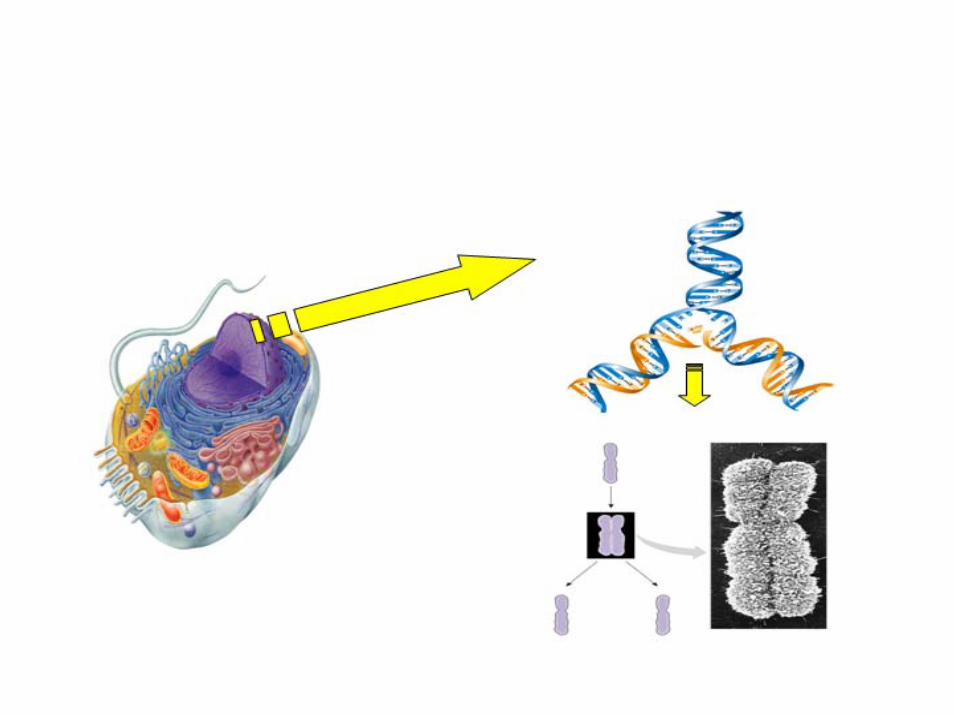

Central dogma
© Garland Science, Molecular Biology of The Cell, 4th Edition

No use of isolated Information/Individual
December 2, 2010 5

Information processing
• Activity of a living system is based on– Information stored within the system– Information processing mechanism within the systemSystem components must be dynamic in natureMust exist some sort of interactions among the
system components and environment
• Knowledge about an organism = Information + Information processing mechanism
December 2, 2010 6

Cell: A huge information processing system!
• Information contained in genes in the form of relative positions of nucleotides
• Basic mechanisms for information processing include– Gene regulation
– Metabolism
– Signal Transduction
– Protein binding
December 2, 2010 7

Cellular information processing:Interactions among cellular components
Gene regulation ◦ (Indirect) interactions among genesMetabolism◦ Interactions among metabolites, enzymesSignal Transduction◦ Interactions among various proteins and other small moleculesProtein binding◦ Interactions among proteins◦ Gene regulatory networks and metabolic pathwaysPathway‐pathway interactions◦ Gene regulatory networks and metabolic pathways◦ Cross‐talk among pathways
December 2, 2010 8

Gene regulation
December 2, 2010 9

A hypothetical gene regulatory network

Metabolic pathways/networks
December 2, 2010 11

Signal transduction pathways
December 2, 2010 12

Protein interaction networks
December 2, 2010 13

Pathway‐Pathway interactions
14December 2, 2010

Interaction among cells
December 2, 2010 15

Whole organism = complex network
December 2, 2010 16

Systems Biology
• First described in 1999 by Leroy Hood, President and co‐founder of the Institute for System Biology, Seattle.
• Systems Biology: The study of the interactions underlying complex biological processes as integrated systems of many interacting components.
17

Objectives
• Unlike bioinformatics which focuses on individual molecules, such as sequence of nucleotide acids and amino acids, systems biology focuses on systems that are composed of molecular components and their interactions.
18
Within this context,
Understanding of structure of the system, such biochemical pathways, cellular interactions.
Understanding of dynamics of the system, both quantitative and qualitative analysis as well as construction of theory/model with powerful prediction capability.
Understanding of control methods of the system .
Understanding of design methods of the system under the framework, called synthetic biology.
Both structure of the system and components plays indispensable role.

Systems Biology involves:
1. Collection of large sets of experimental data related to a system.
2. Proposing mathematical models that can account for at least some significant aspects of the collected data set.
3. Providing in silico solution of the mathematical equations to obtain numerical predictions.
4. Assessment of the quality of the model by comparing numerical simulations with the experimental data.
5. Generation of some novel hypothesis which can be validated through experimental laboratories.
19Continued…

Underlying issues/constraints
20

Approach for solving a problem in systems biology: Four key parameters(Kitano (2002), Science)
• System structure: networks of gene interactions, biochemical pathways
• System dynamics: behavior of a system over time under various conditions, e.g., time series microarray gene expression data for gene regulatory networks
• Control method: minimizing malfunctions and providing potential therapeutic targets for treatment of disease
• Design method: strategies to modify and construct biological systems having desired properties
December 2, 2010 21

An example
December 2, 2010 22

23

Gene Regulatory Networks
Tasks involved:
• Reverse engineering– Based on biological information, e.g., gene expression, known experimental results etc.
• Analysis of a gene regulatory networks– Finding an optimal pathway, testing robustness etc.
– Effect of gene expression/regulation on other pathways

Reverse engineering gene regulatory networks
• Expressed genes produce mRNA through transcription.
• mRNAs form proteins through translation.
• Protein is bound on the promoter region of a gene to make it expressed or repressed.
• This leads to a dependence of expression of a gene on binding protein, and thereby expression of other genes.

Temporal gene expression pattern
• For a particular tissue, every gene is not expressed, only a subset of them expressed.
• Due to an external influence, some genes become differentially expressed.
• Gene expression values over time exhibits a pattern.
• The objective is to find this temporal pattern.

Approaches for Reverse Engineering Gene Regulatory Networks
• Kinetic equations: based on differential equations involving rate parameters
• Boolean: state of a gene either ‘ON’ or ‘OFF’
• Bayesian networks: based on statistical method
• Circuit: interpreting genetic control system as a circuit similar to electrical one
• Artificial neural networks: considering gene interactions as weight matrix

Kinetic model(Yeung et. Al. Proc. National Academy of Sciences, 2002)
• Assumption: Dynamics of gene expression profile follows linear differential equation, i.e.,
dX/dt = WX• X = nxm gene expression matrix,
where n = #genes, m = #time points• W = nxn gene interaction matrix,
wij = influence of gene j on gene iwij > 0 → gene j activates gene iwij < 0 → gene j represses gene iwij = 0 → no interaction

Kinetic model contd…
• Using existence theorem of singular value decomposition,
X’ = UDV’
U = mxm unitary matrix, V = nxn unitary matrix
D = mxn diagonal matrix with diagonal elements being singular values of X in decreasing order
• W = (dX/dt)UD1V’, D1 = mxn diagonal matrix with diagonal elements being reciprocal of corresponding elements of D
• SparseW: Using L1 minimization

Boolean Modelingof Genetic Regulatory Networks
• Each mRNA or protein is represented by a node of a network,
• The interactions between them are encoded as directed edges
• The state of each node is 1 or 0, according as the corresponding substance is present or not. The states of the nodes can change in time.
• Choose a time interval or length of a unit timestep that is larger or equal to the duration of all transcription and translation processes
• Next state of node i is determined by a Boolean function of its state and the states of those nodes that that have edges incident on it.

Methodology Based on Perceptron Model
• Kim et. al., Genomics, vol. 67, pp. 201‐209, 2000
• Linear model
• Using time series data
• Based on Perceptron model and backpropagation training
• Confirmed some known interactions and found some additional ones

Hybridization of Artificial Neural Networks and Genetic Algorithms
• Keedwell and Narayanan, IEEE/ACM Trans. On Computational Biology and Bioinformatics, vol. 2, pp. 231‐242, 2005.
• Using time series gene expression data
• Artificial neural networks for estimation
• Genetic algorithms for optimization
• Tested on various time series gene expression data set including yeast cell cycle data

Based on Recurrent Networks
• D.’haeseleer et. al., Bioinformatics, vol. 16, pp. 707‐726, 2000.• Measuring rate of change in gene expression• Using recurrent networks• Input: all regulatory genes, input from kainate level, constant
bias term, tissue specific differences in regulation• Sigmoid transfer function, proportional decay term• Backprogation through time algorithm• Pruning• Connectivity matrix giving the interactions

Based on Two Feedforward Networks
• Vohradsky, FASEB J., vol. 15, pp. 846‐854, 2001.
• Using time series gene expression data
• Using Two feedforward networks: one corresponding to transcription and the other for translation

Recurrent Analog Neural Networks
• Mjolsness et. al., Journal of Theoretical Biology, vol. 152, pp. 429‐453, 1991.
• Considered ordinary differential equations for rate of change in gene expression in terms of sigmoid function of connectivity matrix and expression values
• Connectivity matrix determined through training the neural network• Gene regulation considered as a combination of cis‐acting regulation by
extended promoter of a gene through transcription complex, and trans‐acting regulation by transcription factor products of other genes
• For cis‐acting, one neural network, for trans‐acting other neural network

Flux Balance Analysis (FBA)
A constraint‐based approach.
Assumption‐ steady state of the system.
Based on‐ principle of conservation of mass in a network.
Utilizes‐ stoichiometric matrix and biologically relevant objective function, such as, maximization of biomass production or minimization of nutrient utilization, on the premise that selection pressures during evolution guide systems towards optimality.
Identifies‐ optimal reaction flux distribution.
S.v =0
The objective function‐
36
∑==
s
1jcv z
Continued…

FBA contd…
37 (Raman and Nagasuma, Briefings in Bioinformatics (2009))

Input reaction
databasefrom reaction node edge incidence
Compute the
matrix
Generate flowvectors constraint
Formulate new
objective functionFormulate new
Minimize objective functionusing gradient descent
techniqueregulatory pathway Generate the optimal
Analysis of gene regulatory pathways: Determining optimal regulatory pathways
(Das, Mukhopadhyay, De, PLoS One, 2010)

• Data generation
g denote the expression levels of the genes in the network and f denote the vector of non-linear functionsRate equations indicating the change of expression levels of the genes over time is
dg/dt = f(g, u)where u is the set of transcriptional perturbationsFor small perturbations the non linear system can be approximated by a linear set of equations
dg/dt = BvAt steady state
Bv ≈ 0We generate p number of random numbers aj , j = 1, 2, . . . , p and a vector
until certain inequality constraint on v is satisfied for all its components
∑=
=p
jbjjvav
1

• Formulation of a new constraint
All the TFs that are not shown in a system may not be expressed at the required level so that the corresponding target genes may not be expressed / inhibited fully
This leads to variation in the concentration of other TFs and hence another constraint can be defined as
B.(C.v) = 0where C is an n × n diagonal matrix whose diagonal elements are the components of the vector c. That is, if C = [γij ]n×n, then γij = δijci, where δij is the Kronecker delta
Thus the optimization problem of determining a gene regulatory pathway yielding maximum expression of the target gene B starting from the initial gene A, reduces to a maximization problem, where z is maximized with respect to c, subject to satisfying the above constraint along with the inequality constraints

• Estimation of weighting coefficients ci
The reformulated objective function isy = 1/z + ΛT .(B.(C.v))
that needs to be minimized with respect to the weighting factors ci for all iThe term Λ = [1, 2, . . . , m]T is the regularizing parameter
ci’s are generated through random values in [0, 1]ci’s are then modified iteratively by the new learning algorithm incorporating modulus of the second order derivative, where the amount of modification for ci in each iteration is defined as
∆ci = −η ∂y / ∂ci
Thus the modified value of ci is given byci(t + 1) = ci(t) + Δci, ∀i, t = 0, 1, 2, . . .
ci (t + 1) is the value of ci at iteration (t + 1), which is computed based on the ci-value at iteration t
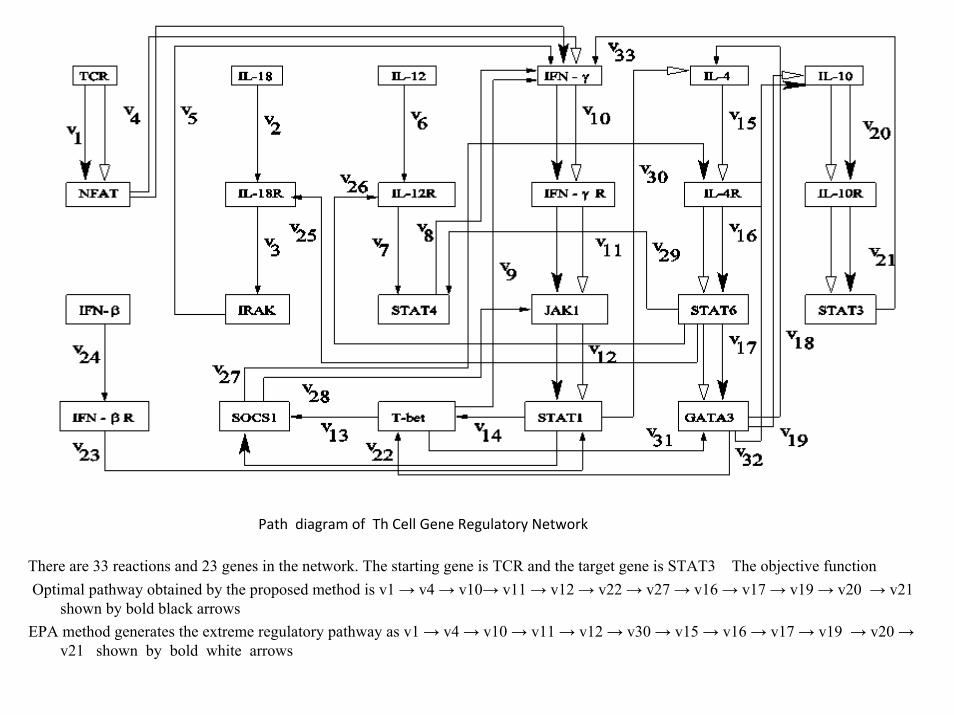
Path diagram of Th Cell Gene Regulatory Network
There are 33 reactions and 23 genes in the network. The starting gene is TCR and the target gene is STAT3 The objective functionOptimal pathway obtained by the proposed method is v1 → v4 → v10→ v11 → v12 → v22 → v27 → v16 → v17 → v19 → v20 → v21
shown by bold black arrowsEPA method generates the extreme regulatory pathway as v1 → v4 → v10 → v11 → v12 → v30 → v15 → v16 → v17 → v19 → v20 →
v21 shown by bold white arrows

43