Embed Size (px)
Citation preview

PNNL-20023
Prepared for the U.S. Department of Energy under Contract DE-AC05-76RL01830
A Brief Review of Filtration Studies for Waste Treatment at the Hanford Site Richard C. Daniel Rick W. Shimskey Philip P. Schonewill Reid A. Peterson December 2010

DISCLAIMER This report was prepared as an account of work sponsored by an agency of the United States Government. Neither the United States Government nor any agency thereof, nor Battelle Memorial Institute, nor any of their employees, makes any warranty, express or implied, or assumes any legal liability or responsibility for the accuracy, completeness, or usefulness of any information, apparatus, product, or process disclosed, or represents that its use would not infringe privately owned rights. Reference herein to any specific commercial product, process, or service by trade name, trademark, manufacturer, or otherwise does not necessarily constitute or imply its endorsement, recommendation, or favoring by the United States Government or any agency thereof, or Battelle Memorial Institute. The views and opinions of authors expressed herein do not necessarily state or reflect those of the United States Government or any agency thereof. PACIFIC NORTHWEST NATIONAL LABORATORY operated by BATTELLE for the UNITED STATES DEPARTMENT OF ENERGY under Contract DE-AC05-76RL01830
Printed in the United States of America
Available to DOE and DOE contractors from the Office of Scientific and Technical Information,
P.O. Box 62, Oak Ridge, TN 37831-0062; ph: (865) 576-8401 fax: (865) 576 5728
email: [email protected]
Available to the public from the National Technical Information Service, U.S. Department of Commerce, 5285 Port Royal Rd., Springfield, VA 22161
ph: (800) 553-6847 fax: (703) 605-6900
email: [email protected] online ordering: http://www.ntis.gov/ordering.htm

PNNL-20023
A Brief Review of Filtration Studies for Waste Treatment at the Hanford Site Richard C. Daniel Rick W. Shimskey Philip P. Schonewill Reid A. Peterson December 2010 Prepared for the U.S. Department of Energy under Contract DE-AC05-76RL01830 Pacific Northwest National Laboratory Richland, Washington 99352


iii
Summary
This document completes the requirements of Milestone 1-2, PNNL Draft Literature Review, discussed in the scope of work outlined in the EM-31 Support Project task plan WP-2.3.6-2010-1. The focus of task WP-2.3.6 is to improve the U.S. Department of Energy’s (DOE’s) understanding of filtration operations for high-level waste (HLW) to enhance filtration and cleaning efficiencies, thereby increasing process throughput and reducing the sodium demand (through acid neutralization). Developing the processes for fulfilling the cleaning/backpulsing requirements will result in more efficient operations for both the Hanford Tank Waste Treatment and Immobilization Plant (WTP) and the Savannah River Site (SRS), thereby increasing throughput by limiting cleaning cycles.
The purpose of this document is to summarize Pacific Northwest National Laboratory’s (PNNL’s) literature review of historical filtration testing at the laboratory and of testing found in peer-reviewed journals. Eventually, the contents of this document will be merged with a literature review by SRS to produce a summary report for DOE of the results of previous filtration testing at the laboratories and the types of testing that still need to be completed to address the questions about improved filtration performance at WTP and SRS. To this end, this report presents 1) a review of the current state of crossflow filtration knowledge available in the peer-reviewed literature, 2) a detailed review of PNNL-related filtration studies specific to the Hanford site, and 3) an overview of current waste filtration models developed by PNNL and suggested avenues for future model development.
This extensive review provides a starting point to help achieve the ultimate goal of the current project, which is to identify technologies such as modifications to the process (e.g., reconfiguration of the filter geometry or changes to operational techniques) or the use of physical property modifiers that increase the sustainability of the filter process. Overall, two avenues of future model development are recommended: 1) determination of long-term filtration dynamics of actual waste and waste simulant slurries and 2) evaluation of the impact of solution chemistry on the rate of filtration and filter fouling. A better understanding of these long-term fouling dynamics and solution chemistry effects will help in developing better predictive models and improved process optimization.


v
Acronyms
AFM atomic force microscopy
AV axial velocity
BNI Bechtel National, Inc.
BSA bovine serum albumin
CEOP cake enhanced osmotic pressure
CUF cell unit filter
DOE U.S. Department of Energy
DVO direct visual observation
EFRT External Flowsheet Review Team
FEM finite element method
HLW high-level waste
IW inhibited water (a solution of 0.01 M NaOH or 0.01 M NaOH/0.01 M NaNO3)
MF microfiltration
MWCO molecular weight cut off
PEG polyethylene glycol
PEP Pretreatment Engineering Platform
PNNL Pacific Northwest National Laboratory
PTGC trade name for a polysulfone membrane marketed by the Millipore Corp.
PTP Pretreatment Plant
PUREX plutonium-uranium extraction
REDOX reduction oxidation
RO reverse osmosis
SEM scanning electron microscopy
SRS Savannah River Site
TMP transmembrane pressure
TRU transuranics
UDS undissolved solids
UF ultrafiltration
UTMP uniform transmembrane pressure
WTP Hanford Tank Waste Treatment and Immobilization Plant


vii
Contents
Summary ............................................................................................................................................... iii
Acronyms .............................................................................................................................................. v
1.0 Introduction .................................................................................................................................. 1.1
2.0 Background ................................................................................................................................... 2.1
2.1 Types of Filtration ................................................................................................................ 2.2
2.2 Typical Operating Modes for Filtration ............................................................................... 2.2
3.0 Fouling of Filter Elements by Particulate Suspensions— A Brief Summary of Current Peer-Reviewed Literature ............................................................................................................. 3.1
3.1 The Impact of Time, Process Operating Conditions, and Properties of the Suspension ...... 3.2
3.2 The Impact of Particle-Particle and Particle-Membrane Interactions .................................. 3.10
4.0 Summary of WTP-Related Filtration Studies at PNNL................................................................ 4.1
5.0 Recent Filtration Modeling for Hanford Tank Wastes and Suggestions for Improvements ........ 5.1
5.1 PNNL Efforts to Model Flux Time Dependence ................................................................. 5.1
5.2 PNNL Efforts to Model Filter Flux Concentration Dependence .......................................... 5.7
5.3 Limitations of Current Waste Filter Models and Recommendations for Future Model Development ........................................................................................................................ 5.8
6.0 Concluding Remarks .................................................................................................................... 6.1
7.0 References .................................................................................................................................... 7.1
Appendix A: Index of Articles Examined by the Literature Review .................................................... A.1
Figures
2.1. Dead-End and Crossflow Filtration Configurations .................................................................... 2.3
3.1. Typical Filter Flux Variation with Slurry Solids Concentration Observed for WTP Waste Slurries and Waste Slurry Simulants ........................................................................................... 3.10
4.1. Schematic of Bench-Scale Cross-Flow Filtration System Used in Recent Testing by PNNL .... 4.1
5.1. Comparison of the Generalized (composite) Particle-Size Distribution of Hanford Tank Wastes to the Estimated Pore Size Opening Range for Mott Grade 0.1 Sintered Stainless Steel Filter Media ......................................................................................................................... 5.2
5.2. Fit of 36-Hour Filter Flux Data Using the Combined Fouling Filtration Model ......................... 5.6
5.3. Impact of Increasing Backpulse Frequency on Average Filter Flux ........................................... 5.7

viii
Tables
2.1. Summary of Membrane Pore Size and Target Retained Species for the Three Filtration Classifications .............................................................................................................................. 2.2
4.1. Wastes Filtered in PNNL Studies ................................................................................................ 4.2
4.2. Cross-Flow Filtration Simulant Studies Conducted at PNNL ..................................................... 4.3
4.3. Waste Groups Tested at PNNL as Part of EFRT Response Plan ................................................. 4.4
5.1. Model Parameters for a 36-Hour Filtration Test .......................................................................... 5.5

1.1
1.0 Introduction
This document completes the requirements of Milestone 1-2, PNNL Draft Literature Review, discussed in the scope of work outlined in the EM-31 Support Project task plan WP-2.3.6-2010-1. The focus of task WP-2.3.6 is to improve the U.S. Department of Energy’s (DOE’s) understanding of filtration operations for high-level waste (HLW) to enhance filtration and cleaning efficiencies, thereby increasing process throughput and reducing the sodium demand (through acid neutralization). Developing the processes for fulfilling the cleaning/backpulsing requirements will produce much more efficient operations for both the Hanford Tank Waste Treatment and Immobilization Plant (WTP) and the Savannah River Site (SRS), thereby significantly increasing throughput by limiting cleaning cycles. The scope of task WP-2.3.6 is to develop the understanding of filter fouling to allow developing this cleaning/backpulsing strategy.
The overall approach to this task is:
Review previous crossflow testing performed at Pacific Northwest National Laboratory (PNNL) and peer review journals to establish directions for testing activities for this task.
Develop a predictive model that reflects the important physical mechanisms of fouling and cleaning for use in determining effective filter cleaning strategies for a variety of feeds.
Develop simulants that can result in significant irreversible fouling, but also are representative of the types of materials that are present in HLW.
Test these simulants in bench-scale equipment to identify the cleaning requirements for these feeds.
Develop a cleaning strategy to optimize throughput while minimizing added Na.
Validate the model and operational strategy with actual waste samples as appropriate.
As listed above, the first objective of the filtration task is to review the state of the art in crossflow filtration. To satisfy this objective, this document summarizes PNNL’s literature review of historical filtration testing at the laboratory and of testing found in peer-reviewed journals. Eventually, the contents of this document will be merged with a literature review by SRS to produce a summary report for DOE of the results of previous filtration testing at the laboratories and the types of testing that still need to be completed to address the questions about improved filtration performance at WTP and SRS.


2.1
2.0 Background
WTP will use crossflow filtration to assist in waste remediation and vitrification efforts that involve the dewatering, chemical leaching, and washing of waste material retrieved from underground tank storage at the Hanford Site in Richland, Washington. Sustained waste filtration operations and waste throughput at WTP are expected to be challenged by fouling of the filter elements during waste operations.
The fouling dynamics of the crossflow filters employed for WTP are not completely understood. This lack of understanding derives from the complex nature of the waste feeds, with waste feeds for each tank (or small tank groupings) typically having a unique chemical composition and physical properties. Even for a given waste storage tank, the waste feed is heterogeneous in both chemical constituents (which include both insoluble mineral phases, precipitated salts, and a ~1- to 10-M concentration of dissolved species) and particle size (~0.2 μm to 300 μm). Finally, understanding WTP filtration fouling dynamics is further complicated by the numerous processes that the waste feed will be subjected to (including as-received dewatering, dewatered feed caustic leaching, post-leach washing, etc.), which fundamentally alters both waste chemistry and particle size.
Planned maintenance activities to restore filter performance include both backpulsing of (i.e., flow reversal through) the filters and acid cleaning operations. Despite having the means to restore filter performance, the rate of waste rate filtration is expected to limit the rate of waste vitrification at WTP. Additionally, the long-term impact of processes such as filter backpulsing on filter performance is not well understood. Previous assessments of engineering-scale, WTP filtration operations indicate that backpulsing provides only temporary improvement in filter flux and that multiple backpulses may cause long-term degradation of filter performance (Daniel et al. 2010a).
To help overcome the challenges associated with filtration at WTP, numerous studies have been performed to understand how wastes from specific Hanford tanks or groupings of tanks affected filter performance, yielding a partial knowledge of how crossflow filters planned for use at WTP foul. In one such study, post-caustic leach dewatering of waste was studied; the test results were cause for concern because the dewatering process took significantly longer than planned because of an unexpected and significant loss of filter performance (i.e., relative to that measured in bench-scale studies, see Daniel et al. 2010a). Should similar conditions exist in the full-scale process, then waste throughput will be significant hindered, and the timeline for and costs associated with completing remediation of the Hanford site will be significantly extended beyond current estimates.
The goal of the current report is to provide a summary of the current understanding of waste fouling dynamics and filter performance. It will provide a review of previous waste filtration studies performed at PNNL (for the Hanford Site). In addition to these site-specific filtration studies, a brief review of the current state-of-knowledge regarding crossflow filtration and fouling dynamics in the general literature will be provided. This extensive literature review will provide a starting point to help achieve the ultimate goal of the current project, which is to identify technologies such as modifications to the process (e.g., reconfiguration of the filter geometry or changes to operational techniques) or the use of physical property modifiers that increase the sustainability of the filter process.

2.2
This report presents the literature review in three separate sections following a brief overview of filtration (given in the latter parts of Section 2.0). Section 3.0 provides a review of the current understanding and modeling approach presented for crossflow filtration (and related areas of study) in the literature dealing with separations science and technology. Section 4.0 deals exclusively with studies of Hanford Site waste feeds and their filtration performance. Finally, Section 5.0 provides an overview of recent model development at PNNL and provides recommendations for future model development focus areas.
2.1 Types of Filtration
As it is applied in this review, liquid filtration involves separating both soluble and insoluble species from a liquid stream by using a solid membrane. Separation is accomplished by bringing a solution, sol, or slurry into contact with a filter medium (membrane) and forcing the flow of the liquid through the membrane by applying a pressure gradient across the membrane. As the liquid passes into or through the membrane, the filter retains (or sieves) a fraction of the solid and dissolved species.
Filtration operations are classified in terms of the type and size of species retained by the filter membrane. Three broad classifications are reverse osmosis (RO), ultrafiltration (UF), and microfiltration (MF):
RO membranes target low-molecular-weight salt species for retention.
UF membranes typically target the retention of high-molecular-weight salts, macromolecules, and colloidal materials.
MF membranes are employed to separate colloids and larger particulate materials.
A summary of the membrane pore size and target applications of each type of filtration operation is provided by Baker et al. (1991) and summarized in Table 2.1. Table 2.1. Summary of Membrane Pore Size and Target Retained Species for the Three Filtration
Classifications (Baker et al. 1991)
Filter Classification Membrane Pore Size Target Retained Species RO 0.5 to 20 nm dissolved microsolutes (e.g., salts) UF 2 to 100 nm dissolved macromolecules (e.g., proteins) MF 0.1 to 10 m suspended particulates, bacteria, large colloids
2.2 Typical Operating Modes for Filtration
Filtration operations can use dead-end of crossflow filtration configurations. The two configurations differ in the direction of bulk slurry/solution flow relative to the surface of the filter. The two configurations, applied to the filtration of slurry, are shown in Figure 2.1. In dead-end filtration, slurry flow is normal to the filter membrane. Solids retained by the membrane stay on the membrane surface, forming a filter cake that grows proportionally to the volume filtered. The build-up of solids increases the resistance to permeate flow with time. To counteract the build-up of solids cake and to maintain constant permeate flow, increasing energy (or applied transmembrane pressure [TMP]) is required for dead-end filtration. In crossflow filtration, slurry flow is tangential to the filter membrane. Like dead-end

2.3
filtration, solids retained by the filter can remain on the filter surface; however, cake build-up is limited by the flow of slurry against the filter membrane, which can re-entrain solids and limit the growth of filter cake. Under certain operational conditions, it is possible to prevent the formation of a filter cake entirely (Bacchin et al. 2006).
Figure 2.1. Dead-End and Crossflow Filtration Configurations
Filtration can be performed in constant pressure or contact flux modes. In constant pressure operations, the TMP is maintained as a constant, and the flux declines with time as the filter membrane is fouled with solids. For constant flux operations, the TMP is manipulated in an attempt to maintain a constant permeate production rate. As the filter fouls with retained material, the TMP must be increased to maintain permeate flux.
WTP plant operations intend to use crossflow filtration for waste solid/liquid separations. WTP operations will process waste slurries that contain colloidal particles, non-colloidal (>1 m) particles, and dissolved solutes. Selecting crossflow geometry minimizes the build-up of solids on the surface of the filter elements and the fouling of those filter elements. Additionally, filtration operations shall employ sintered stainless steel filters fabricated by the Mott Corporation (Farmington, CT) with a filter grade of 0.1. Relative to Hanford tank waste slurries, which exhibit a broad particle-size speciation that is expected to range from ~0.2 to ~300 m (Wells et al. 2007), the filter media have an estimated pore size of 1 to 3 m (based on isopropanol bubble point, scanning electron microscopy [SEM] images, and filter flux data provided by the manufacturer) (Rubow and Jha 1999).1
Based on these specifications, WTP waste operations are best classified as microfiltration. To understand and improve the sustainability of waste treatment operations at the WTP, a general understanding of fouling in crossflow filtration is necessary. In the following section, an overview of current research on filter fouling (with an emphasis on fouling of filter membranes by suspensions of particulates) is provided. This overview will be followed by reviews of actual waste and waste simulant filtration studies performed at the Hanford Site and Savannah River Site.
1 Owsiany M. 2007. “Mott HyPulse LSX Data Summary – 24590-MOTT-FDP02.” Mott Corporation,
Farmington, Connecticut.
slurry flow
permeate flow
solidscake
cakebuildswithtime
dead-end filtration
permeate flow
permeate flow
slurryflow
slurryflow
solidscake
crossflowlimits cake
growth
crossflow filtration
A B


3.1
3.0 Fouling of Filter Elements by Particulate Suspensions— A Brief Summary of Current Peer-Reviewed Literature
In either dead-end or cross-flow filtration operations, a particulate suspension, slurry, or sludge is fed from a mixing tank or reservoir to the filter element. A pressure differential (TMP) is applied across the filter membrane to effect solid-liquid separation. This differential drives a portion of the suspension through the membrane, which retains either a fraction or all of the suspended solids and which can also retain macromolecules or dissolved salts (depending on the type of filter medium employed for the separation). Nominally, a complete separation of the solids is effected such that the liquid that exits the other side of the membrane (i.e., permeate) is completely free of solids. In crossflow applications, the retenate can be recirculated to the mixing or continued forward to other unit operations.
As solids are brought to the filter surface, they can interact with the filter membrane and/or solids already in contact with the filter membrane. Fouling of the filter elements can be considered as resulting from interactions or a build-up of solids at the membrane that yield a reduction in filter flux. Flux reduction is typically referenced against a clean water (or suspending phase) flux and is a transient process that proceeds begins once TMP is applied (or even before TMP is applied if there is specific adsorption of solids on the membrane).
Fouling of filter elements during filtration processes is a complex phenomenon that depends on:
Time—Filter fouling is a transient process that can occur after start-up of filtration activities or after a change in the process operating conditions.
Process Operating Conditions—Process variables, such as TMP and crossflow axial velocity (AV), directly impact the rate at which solids are brought into contact with and how fast they can be removed from the surface. Likewise, the geometry of the filter element (tube, plate, etc.) and flow (dead-end versus crossflow) can also influence fouling.
Properties of the Suspension—The properties of the suspension, including concentration, particle-size distribution, particle-shape distribution, suspending phase viscosity, centrifuged solids concentration, etc., all play a role in determining the resistance to flow through the membrane and the nature of particle-membrane interactions.
Forces Governing Particle-Particle Interactions—The surface potential of the particles, the pH and ionic strength of the suspending medium, and the specific adsorption of ions and macromolecules can impact the structure of particles and particle aggregates that approach and contact the filter membrane.
Forces Governing Particle-Membrane Interactions—As with particle-particle interactions, the surface potential of the filter medium and how it varies with the chemistry of the suspending phase (pH, ionic strength, and availability of species with an affinity for the membrane surface) can impact particle-membrane interactions, yielding particle repulsion from (or attraction to) the membrane surface.
The number of properties and operational parameters impacting the rate of flux decline from fouling is significant and complicates modeling of the fouling process. Additionally, modeling of filter fouling is further complicated by the fact that the properties and interactions listed above are interdependent. For
3.2
example, the particle-size distribution is determined not only by the chemistry of the suspending phase (pH and ionic strength), but by particle concentration, which can impact the rate at which agglomerates form under changing conditions, and by AV, which determines the shear forces acting on particle agglomerates and which can disrupt the agglomerates. Likewise, particle-membrane and particle-particle interactions are both tied to the suspending phase chemistry. Any changes made to the suspending phase pH or ionic strength can impact both the surface potential of the membrane and particles alike.
In the following subsections, the impact of the properties and operational conditions outlined above on fouling of filter elements is discussed.
3.1 The Impact of Time, Process Operating Conditions, and Properties of the Suspension
The consequence of fouling is an increase in the resistance to membrane permeation, leading to a decline in filter flux. Basic mechanisms by which flux decline occurs include pore blocking or constriction and cake formation and growth (Hermia 1981):
pore or complete blocking, where a particle rests on top of a pore opening, completely restricting flow through that pore (here the number of pores is large relative to the number of particles)
standard blocking, where the deposition of a particle on top of the pore restricts (or constricts) flow partially through that pore
intermediate blocking, where multiple particles interact and block flow through membrane pores (this is similar to pore blocking, but here the number of particles is similar to or larger than the number of pores)
cake formation, where many particles form a coherent layer that completely covers the filter surface.
Filter fouling is often discussed solely in terms of these mechanisms; however, the following processes can also yield a reduction in filter flux: 1) solute adsorption, 2) particle deposition or precipitation within the membrane, sometimes called depth fouling, 3) maturation or change in the structure of the cake, and 4) the development of a concentration polarization layer (see, for example, Michaels 1968, Belfort et al. 1994, Song 1998). Concentration polarization retards the flux when low-molecular-weight dissolved salts are retained and build-up at the filter surface (Belfort et al. 1994); the osmotic pressure generated by the transmembrane salt concentration gradient counteracts the applied TMP.
The overall magnitude of filter flux decline can be significant. For dead-end filtration, the models derived for the four basic mechanisms described above yield a flux that diminishes to zero at infinite time (Hermia 1981). This is a consequence of the fact that in dead-end filtration, solids remain at the surface yielding 1) an eventual blockage of all pores by particles and/or 2) a solids cake that grows indefinitely. For cross flow filtration, a steady-state, non-zero flux exists (Song 1998). This is a consequence of the backtransport of solids away from the surface induced by crossflow. Depending on the operational parameters of the system and the properties of the suspension, crossflow filtration can be operated at equilibrium flux rates similar to the clean water flux (Bacchin et al. 2006) or can be as low as 5 to 10% of the initial flux at the start of filtration operations (Christensen et al. 2009). As further discussed in
3.3
Christensen, the lowest steady state fluxes typically occur for dispersions with particles in the colloidal size range (i.e., 10 nm to 1 μm) (Sethi and Wiesner 1997, Ripperger and Altmann 2002).
As stated previously, fouling (flux decline) can occur by several different mechanisms. Hermia (1981) has provided a generalized equation for flux decline that summarizes filtration by the four basic blocking laws discussed previously:
(3.1)
where t is time, V is the filtrate volume, k is the capture constant, and n is the blocking index. This equation can also be expressed in terms of the filter flux J:
(3.2)
where AF is the filter area. The blocking index n defines the nature of the blocking law. Pore blocking, standard depth fouling, intermediate blocking, and cake formation correspond to n = 2, 1.5, 1, and 0, respectively. These blocking laws are only readily applicable to dead-end filtration (Song 1998) as they do not capture the mechanisms for the backtransport of particulates from the membrane and a non-zero ultimate flux. As such, the blocking laws posed by Equations (3.1) and (3.2) are not adequate when expressing crossflow filter dynamics. Song (1998) outlines three stages of flux decline with the filtration time typically observed for crossflow ultra- or micro-filtration:
Stage 1—involves a rapid decrease in flux from the clean water (or suspending phase) flux
Stage 2—involves a gradual flux decline over time
Stage 3—is flux steady-state (i.e., a constant flux).
According to Song (1998), Stage 2 is observed in all crossflow filtration processes; however, Stages 1 and 3 may not be observed, depending on length of filtration operations and frequency of observation. In particular, Song states that achievement of Stage 3 may take significant time at high TMPs and/or low slurry particle concentrations. Song’s assertion that Stage 2 is always observed may not be entirely accurate when considered in terms of crossflow filtration processes that avoid filter fouling altogether by operating under the critical flux for fouling (discussed later, see Bacchin et al. 2006).
The transient stages of flux evolution typically result from a combination of pore blocking/constriction and cake formation. That being stated, cake formation is considered to be the dominant form of filter resistance and filter fouling (Ripperger and Altmann 2002, Christensen et al. 2009) and is the focus of many filter fouling and flux evolution studies. The applicability of this assertion to the broad range of filtration encountered in the literature is not clear, as a recent study by Sondhi et al. (2000) found that models for both pore blocking and cake formation had to be considered when trying to model the fouling of alumina membranes of varying pore size (0.2 to 5 m) during filtration of a Cr(OH)3 suspension. In particular, Sonhdi et al. found that agreement between model predictions and experimental results for fouling on the smaller pore size membranes could only be achieved by combining the three fouling mechanisms (pore blocking, pore constriction, and cake formation). On the other hand, pore blocking was observed to be the dominant mechanism on the 5.0-m pore membrane. Pore blocking is

3.4
also observed to dominate at low particle deposition concentrations in cases were particle and pore size are roughly matched (Kosvinstev et al. 2002).
Despite the inconsistencies found for the relative importance of pore blocking/constriction and cake formation, cake formation and growth can still significantly impact many filtration processes, especially those at high particle concentrations encountered in thickening processes (Holdich et al. 1996, Cumming et al. 1999) and high-solids concentration operations encountered in select engineering-scale tests of WTP operations (Daniel et al. 2010a, Kurath et al. 2009).
For dead-end filtration, cake growth results from the forced convection of particles to the filter surface. Here, the cake thickness grows in proportion to the volume of permeate filtered, and the relationship between volume, cake thickness, and time is described by the solution of either Equation (3.1) or (3.2) with n = 0. For a slurry composed of a broad range of particle sizes, the filter cake formed by dead-end filtration contains a representative range of particle sizes (assuming no stratification in the fluid above the filter cake). In crossflow filtration, the growth of the filter cake again results from the forced convection of particles to the filter surface; however, the growth of the filter cake is limited by the backtransport of solids away from the surface by backtransport. A decline of filter flux in crossflow applications can still occur during crossflow filtration, even after the cake has reached its “equilibrium thickness,” through the process of cake maturation/densification (Yuan and Kilduff 2010). As pointed out in the review of Belfort et al. (1994), cake growth is ultimately self-limiting because it constricts the flow channel, increasing the AV in the cake-free region, which in-turn increases the driving force for the erosion of the filter cake.
Particles from the filter surface are backtransported in both laminar and turbulent axial flow velocities. Modes of backtransport of colloids away from the surface include (Belfort et al. 1994):
Brownian Diffusion—(laminar flow) strongest for very small particles (less than a micron)
Shear-Induced Hydrodynamic Diffusion—(laminar flow) dominates for small particles (from 1 m up to ~30 to 40 m)
Inertial Lift—(laminar flow) is most important for larger particles (greater than ~30 to 40 m)
Turbulent Dispersivity—operates in turbulent flow.
Diffusion modes of backtransport in crossflow filtration are well known and form the basis for the well-known concentration polarization model (Blatt et al. 1970, Porter 1972): ln / (3.3)
where JSS is the steady-state filter flux, c and cg are the bulk and gel concentration of the suspension, respectively, and K is the mass transfer coefficient. As described in Porter (1972), the mass transfer coefficient is defined by the diffusivity, D, of the solute/colloid and the thickness, , of the fluid over which the concentration gradient exists (i.e., the boundary layer separating the membrane surface and bulk flow) such that:
(3.4)
3.5
Equation (3.4) can be expressed using more easily available terms by eliminating this boundary layer thickness, . Porter (1972) states that this is done by “The Graetz or Leveque solutions for convective heat transfer in laminar flow channels, suitably modified for mass transfer.” This yields:
0.816/
(3.5)
where is the shear rate at the wall, and L is the length of the filter element. For tubular filters of diameter d and with an AV of U, the shear rate equals 8 ⁄ . Equation (3.5) is valid only for laminar flow. For turbulent flow, the appropriate relationship is:
0.023. .
. . (3.6)
where dh is the hydraulic diameter (which is simply d for tubular filters), and is the kinematic viscosity. For solutes, the diffusion coefficient D is associated with the molecular diffusivity, whereas for colloids, the diffusion is treated as Brownian diffusion. The Stokes-Einstein relationship defines the Brownian diffusion coefficient:
(3.7)
where kB is the Boltzman constant, is the suspending phase viscosity, and dp is the particle diameter. This equation describes the motion of sphere through a fluid at low Reynolds numbers (i.e., quiescent conditions). For turbulent conditions, it may be more appropriate to associate colloid diffusivity with the turbulent dispersivity, , given by (Taylor 1954):
0.026 2⁄ (3.8)
As outlined in the review by Belfort et al. (1994), significant attention has been given to the backtransport of colloidal suspensions in laminar flow. Experimental studies by Porter (1972) indicate that the backtransport of colloids is much faster than predicted by Brownian diffusion, or in physical terms, the filter flux observed experimentally for colloid suspensions in crossflow microfiltration is higher than predicted by Equations (3.3) through (3.5) and (3.7). This phenomenon, termed the “flux paradox” (Green and Belfort 1980) or “flux anomaly” (Welsch et al. 1995), has been related to both hydrodynamic and eletrokinetic effects. With respect to hydrodynamic effects, mechanisms for inertial lift (Green and Belfort 1980) and shear induced lift (Zydney and Coulton 1986) have both been proposed to explain the higher than expected filter flux for colloid suspensions. The inertial lift mechanism is described in Green and Belfort (1980); the backtransport of colloids from the surface is captured through a lift velocity, vL, such that fouling occurs when vL is greater than the permeate flux J driving the particles to the filter wall. According to Green and Belfort, the lift velocity has been confirmed both theoretically and empirically and shows the following functionality:
∝ (3.9)

3.6
Derived expressions for vL also account for the effects of particle size and fluid viscosity. Expressions for filtration where backtransport is governed by shear-induced lift have been developed by Zydney and Coulton (1986). Backtransport is modeled using an effective shear lift diffusivity, DS, measured by Eckstein et al. (1977) for particle volume fractions ranging from 0.2 to 0.45: 0.075 (3.10)
The equations for backtransport, as presented above, apply in predicting the steady-state filter flux. The inclusion of backtransport mechanisms in non-steady-state flux presents a more difficult modeling problem. Kim and Digiano (2009) present an overview of modeling efforts and provide a generalized particle differential equation for concentration polarization and solute/particle transport in the polarization layer. For plate filtration, it is:
(3.11)
Here t is time, x is the axis that points in the axial direction (parallel to the direction of crossflow), and y is the axis normal to the filter surface. The concept of Brownian diffusion and shear-induced diffusion can be incorporated by substitution of the appropriate diffusivity. Likewise, turbulent dispersion could be incorporated by replacing the diffusion coefficient with the turbulent dispersivity, . Inertial lift (and even the particle settling velocity, w) can be incorporated by modifying Equation (3.11) to:
(3.12)
Equations (3.11) and (3.12) may be solved by using Darcy’s Law to represent the filter cake. According to Belfort et al. (1994) and Kim and Digiano (2009), the growth of the filter cake is given by:
(3.13)
where is the filter cake thickness, and and c are the volume fractions of particles in the bulk suspension and cake, respectively. Equations (3.11) to (3.13) represent one approach to modeling flux decline in crossflow filtration. Other approaches have been developed and used to describe crossflow filter flux dynamics. One example is Hajipour et al. (2010), where finite element modeling is used to solve the momentum conservation equations to model microfiltration of non-alcoholic beer through alumina membranes with a pore size of 0.45 m. Song (1998) focuses on the dynamics of cake formation and models fouling via the evolution of cake thickness along the length of the filter element.
The backtransport mechanisms captured by Equations (3.5) through (3.12) are all based in fluid hydrodynamics and diffusion. None of these equations capture the impact of electrokinetic effects on flux, which include particle-particle interactions and particle-membrane interactions arising from the surface potential. The impact of surface charge on filtration will be discussed in later sections of this review. For now, it will be noted that a number of studies have been performed that incorporate the influence of surface potential on filtration. These include Huismann et al. (1998), Huismann et al. (1999a), McDonogh et al. (1989), Welsch et al. (1995), Kim and Zydney (2005), and Kim and Zydney (2006).
3.7
As can be inferred from Equations (3.5) through (3.10), the rate of backtransport of particles from the filter surface increases with increasing AV U (or shear rate at the membrane surface). It is possible to operate at AVs at which a cake layer does not form at the membrane surface. In this situation, particles convected to the surface by filter medium permeate (i.e., by the flux J) are removed from the surface immediately by backtransport. Likewise, the rate of particle deposition on the surface can be lowered (by reducing TMP) to the point where even moderate AVs keep the surface free of foulants. These situations are characterized by what is termed either the “critical TMP” or, more often, “critical flux” for filter fouling. A review of critical flux is given by Bacchin et al. (2006), where the critical flux is defined as “either the flux at which the TMP starts to deviate from the pure water line (the strong form of critical flux) or as the first permeate flux for which irreversible fouling appears on the membrane surface.” Below the critical flux, the filter permeate rate is equal to the clean “water” (or suspending phase) flux if there is no rapid fouling of the filter during start-up (or adsorption of other species to the filter element that impede flux). A number of studies employ the critical flux, rather than steady-state flux, as a reference flux for the study of filtration parameters (such as crossflow velocity, slurry particle size, or eletrokinetic effects). Examples include Chellappah et al. (2008), Chong et al. (2008), Kim and Zydney (2006), and Huisman et al. (1999b). As stated above, critical flux is related to conditions that lead to the incipient deposition of particles on the filter surface. Davis and Leighton (1987) and Davis and Sherwood (1990) postulated that particle deposition occurs at some critical distance, xcr, from the entrance to the filter element. Chellappah et al. (2008) provide a solution for xcr when back transport from the surface is governed by shear-induced diffusion (see Equation 3.10):
1.25 10 (3.14)
where w is the shear stress at the wall (membrane), and Jw is the clean-water permeate flux. The critical flux, Jcrit, can then be solved by setting the critical distance to the filter length, L, such that:
.
(3.15)
The existence of critical flux is of interest for filter fouling studies because it represents a mode of operating filters sustainably. While the bulk of the work has involved micro- and ultra-filtration media, the critical flux has recently been demonstrated on reverse osmosis media (Chong et al. 2008). Operation below or at critical filter flux avoids entirely the formation of a filter cake on the surface of the filter element, potentially eliminating the need for process cleaning strategies like backpulsing. These are discussed in the next paragraph.
Because the filter cake rests on the surface of the filter, it is exposed to the axial flow and is susceptible to disruption by reduction in the TMP (the driving force for flow through the filter) and backpulsing/backflushing, which is the flow of liquid from the permeate side back into the suspension side affected by reversal of the TMP. The frequency of backpulsing/backflushing and duration of each pulse depends on the filter application. Sondhi et al. (2000) define 1) backpulsing as a TMP reversal occurring every few seconds or less where the duration of the pulse is less than 1 second and 2) backflushing as flow reversal “occurring for a few seconds every several minutes.” In contrast, “backpulsing” planned for the WTP does not correspond well to either definition for backpulsing or backflushing. In engineering-scale operations of WTP filtration processes, backpulse intervals (i.e., the time between each backpulse event) were typically much longer than 1 hour, and the duration of each

3.8
pulse was 1 to 2 minutes long (see Appendix A of Kurath et al. 2009). Although different studies apply different backpulse intervals and durations, the results of backpulsing are the same—disruption of the filter cake yields an increase in filter flux. The frequent short-duration backpulses employed in the study of Sondhi et al. (2000) maintained a much higher flux relative to non-backpulsed operations. Likewise, backpulsing yielded temporary improvements in filter flux for the engineering-scale filtration studies of WTP operations (Kurath et al. 2009). Of course, backpulsing incurs a loss of permeate production periods over the backpulse duration and the direct loss of the permeate that is returned to the suspension to facilitate cake disruption. In one of two backpulsing studies in Kurath et al. (2009), the improvement in flux offsets the loss of permeate incurred by the backpulsing sequences; however, related studies suggest that frequent and repeated disruption of the cake may cause irreversible loss of flux (possibly as a result of depth fouling of the filter) when handling waste slurries (Daniel et al. 2010a).
The cake structure depends on the operational conditions of the crossflow filtration process. In particular, cakes formed from slurries with a broad range of particle sizes are typically enriched in the fraction of small particles (Ould-Dris et al. 2000). This results from the fact that the mechanisms of particle backtransport from the surface typically favor larger particles, such that the cake becomes enriched in small particles, particularly as crossflow velocity (or AV) is increased (Jiao and Sharma 1994). Additionally, cake layers formed in crossflow filtration may be heterogeneous; that is, the cake layer that forms near the surface of the filter shows a representative mixture of particle sizes (relative to the bulk slurry), while the cake layer adjacent to fluid flow shows a higher concentration of fines (Ripperger and Altmann 2002, Jiao and Sharma 1994).
Not only is the cake structure subject to AV (crossflow), but it is also subject to the TMP through cake compressibility. Cakes may be considered either incompressible or compressible. For incompressible cakes, permeate flux is directly proportional to the applied TMP. In contrast, compressible cakes show a diminishing return in filter flux with applied TMP. For compressible cake systems, there is a TMP beyond which increases in TMP do not yield increases in flux. The flux associated with this pressure is called the “limiting flux,” and it is used as a unique characteristic flux in many filtration studies (e.g., Huisman et al. 1999a, McDonogh et al. 1989, Welsch et al. 1995). Compressible cakes can show irreversible or reversible compressibility. In particular, cakes formed from aggregated inorganic particles can compress as the increased TMP (and drag force from forced convection through the cake) as the particles rearrange and pack more densely (Madeline et al. 2007). Compressibility observed in cakes formed by inorganic particles is typically considered irreversible (McCarthy et al. 2002). Cakes formed by cellular materials show reversible cake compression; as shown recently by Christensen et al. (2009), the reversible compression of cellular materials can be reproduced by attaching a water-swellable polymeric coating to hard sphere particles.
The formation and growth of a coherent cake layer can be inferred from the filter flux. Indeed, the simplest method for studying the impact of the filter cake is by comparing the clean water flux before filtration, after filtration, and after cleaning of the filters (see Ognier et al. 2002, Choi et al. 2004). The weakness of cake inferences from flux is that they do not allow direct observation of cake thickness or morphology. Post-filtration imaging of filter cakes by SEM has been used to study cake thickness (see Lamminen et al. 2006), and while this technique provides significant insight on cake thickness, SEM can occur only after the filtration experiment is complete. Furthermore, imaging requires preparing the specimen, which may alter the cake. Cake formation (and other events, like particle migration along the filter) can be made using direct visual observation (DVO), which requires a filtration cell modified for installing an imaging camera. A recent example is Knutsen and Davis (2006), where the deposition and

3.9
migration of particles on a filter surface are imaged using DVO. More advanced in situ measurement techniques are available (depending on the system). Hughes et al. (2006) employed two-photon femtosecond optical imaging that was near infrared and non-linear to monitor cake formation during the filtration of washed fluorophore-labeled yeast suspensions through through Millipore, 0.22-m, mixed-cellulose, ester membranes. Filter coverage and cake thickness at various concentrations were measured using this method. The studies listed above do not cover the full range of imaging techniques and studies. A review of cake imaging techniques by Chen et al. (2004) provides additional information on this topic.
As indicated above, flux is strongly dependent on the particle concentration of the suspension or slurry. Filter flux is observed to decline with increases in particle concentration; Belfort et al. (1994) describes five periods of filtration that are identified with increasing particle concentration and time.
1. Fast internal sorption of macromolecules—this corresponds to macromolecule sorption directly on the filter during the very early stages of filtration.
2. Build-up of first sublayer—this describes the initial deposition of particles on the filter.
3. Build-up of multisublayers—this is a continuation of particle deposition on the filter.
4. Densification of sublayers—this refers to rearrangement of pre-existing layers of deposited particles.
5. Increase in bulk viscosity—this refers to flux loss from the increase in viscous effects corresponding to increases in the bulk concentration of particles (and potentially non-Newtonian slurry rheology).
Studies of WTP wastes have identified two concentration regimes that appear to correspond to regimes 2 and 3 identified above. Figure 3.1 shows the typical dependence observed during the dewatering operation of Hanford tank waste and waste simulants. For dilute slurries in turbulent flow, the filter resistance is relatively constant and characterized by the resistance of the porous filter element (Rm) such that:
∆
(3.16)
where Pm is the TMP. For filtration in this regime, the transmembrane and permeate viscosity are the controlling operational parameters, and decline in filter flux appears to be associated with fouling of the membrane. At the higher slurry solids concentrations that occur during washing and dewatering operations, the filter cake resistance plays a more significant role in determining filter flux. Transition from the membrane to cake-controlled filtrations are marked by a dewatering knee, which is a discontinuity in the rate of filter flux decline. Filter flux in the cake controlled region declines rapidly with concentration and, based on previous studies, appears to behave in accordance with the concentration polarization model (Equation 3.3). Based on Equation (3.3), the slurry can only be concentrated (dewatered) to the gel concentration cg, at which point the filter flux J is zero. In physical terms, the gel concentration corresponds to a filter cake that fills the entire cross-section of the filter element diameter or gap. A recent PNNL study has associated the gel concentration observed in the dewatering of waste slurry and waste slurry simulants with the centrifuged solids concentration (Peterson et al. 2007). In actual waste filtration operations, divergence from the gel polarization concentration has been observed as the concentration approaches the limiting gel concentration (Daniel et al. 2010a, Billing et al. 2009). This divergence has been attributed to the difficulties in pumping the high-concentration, waste simulant slurry.

3.10
Figure 3.1. Typical Filter Flux Variation with Slurry Solids Concentration Observed for WTP Waste Slurries and Waste Slurry Simulants
The discussion on the preceding pages deals primarily with hydrodynamic mechanisms. Equally important to filter flux and filter fouling dynamics are particle-particle and particle-membrane interactions, which are governed by surface potential and adsorption of specific ions. The impact of surface potential on filter operations is discussed in the following section.
3.2 The Impact of Particle-Particle and Particle-Membrane Interactions
The influence of surface potential in governing particle-particle and particle-surface interactions is discussed in most introductory texts to colloid and interface science. Surface potential interactions are governed by pH, ionic strength, specific adsorption, or ions (among other things). For the case of dead-end and crossflow filtration, particles can interact with other particles that reside in the bulk slurry/suspension, on the surface of the filter, or in the filter cake. Particle-surface interactions occur between the particles being filtered and the filter medium itself. A number of studies, both theoretical and experimental, have sought to elucidate how particle-particle interactions and particle-membrane interactions affect the filter flux, filter fouling, and filter cleaning efficiency. These studies examine transient flux decline, limiting flux, critical flux, and steady-state flux as a function of particle zeta potential, membrane zeta potential, suspending phase pH, suspending phase ionic strength, and the chemistry of salts dissolved in the suspending phase. In the following pages, a brief review of these studies is given with the aim of providing a high-level view of the importance of surface potential in filtration.
Filter Flux, J
ln(c)
membrane‐limited flux
m
m
R
PJ
gccKJ ln
gel‐limited flux
membrane‐resistance‐controlled filtration region
dewatering knee
filter cake‐resistance‐controlled filtration region
ln(cg)
3.11
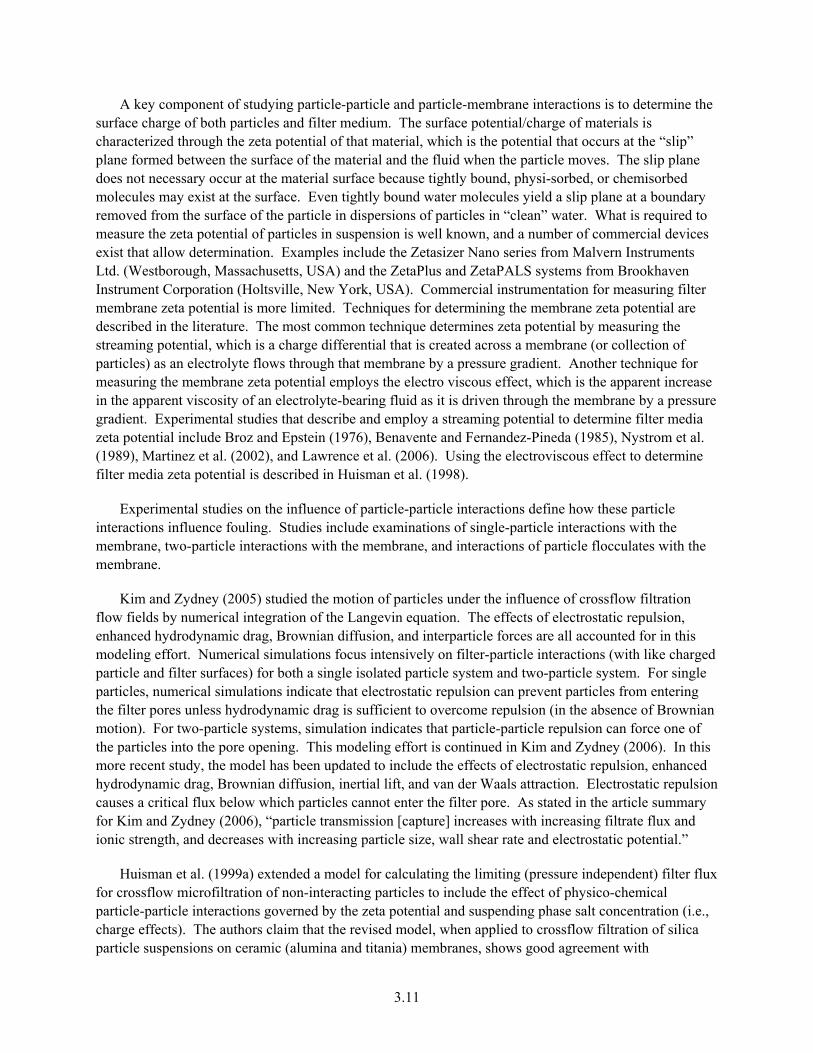
A key component of studying particle-particle and particle-membrane interactions is to determine the surface charge of both particles and filter medium. The surface potential/charge of materials is characterized through the zeta potential of that material, which is the potential that occurs at the “slip” plane formed between the surface of the material and the fluid when the particle moves. The slip plane does not necessary occur at the material surface because tightly bound, physi-sorbed, or chemisorbed molecules may exist at the surface. Even tightly bound water molecules yield a slip plane at a boundary removed from the surface of the particle in dispersions of particles in “clean” water. What is required to measure the zeta potential of particles in suspension is well known, and a number of commercial devices exist that allow determination. Examples include the Zetasizer Nano series from Malvern Instruments Ltd. (Westborough, Massachusetts, USA) and the ZetaPlus and ZetaPALS systems from Brookhaven Instrument Corporation (Holtsville, New York, USA). Commercial instrumentation for measuring filter membrane zeta potential is more limited. Techniques for determining the membrane zeta potential are described in the literature. The most common technique determines zeta potential by measuring the streaming potential, which is a charge differential that is created across a membrane (or collection of particles) as an electrolyte flows through that membrane by a pressure gradient. Another technique for measuring the membrane zeta potential employs the electro viscous effect, which is the apparent increase in the apparent viscosity of an electrolyte-bearing fluid as it is driven through the membrane by a pressure gradient. Experimental studies that describe and employ a streaming potential to determine filter media zeta potential include Broz and Epstein (1976), Benavente and Fernandez-Pineda (1985), Nystrom et al. (1989), Martinez et al. (2002), and Lawrence et al. (2006). Using the electroviscous effect to determine filter media zeta potential is described in Huisman et al. (1998).
Experimental studies on the influence of particle-particle interactions define how these particle interactions influence fouling. Studies include examinations of single-particle interactions with the membrane, two-particle interactions with the membrane, and interactions of particle flocculates with the membrane.
Kim and Zydney (2005) studied the motion of particles under the influence of crossflow filtration flow fields by numerical integration of the Langevin equation. The effects of electrostatic repulsion, enhanced hydrodynamic drag, Brownian diffusion, and interparticle forces are all accounted for in this modeling effort. Numerical simulations focus intensively on filter-particle interactions (with like charged particle and filter surfaces) for both a single isolated particle system and two-particle system. For single particles, numerical simulations indicate that electrostatic repulsion can prevent particles from entering the filter pores unless hydrodynamic drag is sufficient to overcome repulsion (in the absence of Brownian motion). For two-particle systems, simulation indicates that particle-particle repulsion can force one of the particles into the pore opening. This modeling effort is continued in Kim and Zydney (2006). In this more recent study, the model has been updated to include the effects of electrostatic repulsion, enhanced hydrodynamic drag, Brownian diffusion, inertial lift, and van der Waals attraction. Electrostatic repulsion causes a critical flux below which particles cannot enter the filter pore. As stated in the article summary for Kim and Zydney (2006), “particle transmission [capture] increases with increasing filtrate flux and ionic strength, and decreases with increasing particle size, wall shear rate and electrostatic potential.”
Huisman et al. (1999a) extended a model for calculating the limiting (pressure independent) filter flux for crossflow microfiltration of non-interacting particles to include the effect of physico-chemical particle-particle interactions governed by the zeta potential and suspending phase salt concentration (i.e., charge effects). The authors claim that the revised model, when applied to crossflow filtration of silica particle suspensions on ceramic (alumina and titania) membranes, shows good agreement with

3.12
experimental data and captures the influence of wall shear stress, membrane length, particle size, and particle concentration, but quantitatively underpredicted the impact of the particle surface potential on flux.
McDonogh et al. (1989) presented limiting (pressure independent) fluxes for the filtration of a colloidal silica suspension on a Millipore PTGC0LC05 (likely a PTGC(2) series polysulfone disk with an MW cutoff of 10,000 Da) membrane. The experimentally observed enhanced back transport of particles (the “flux paradox” described in preceding sections) from the membrane, which is attributed to colloidal charge interactions in the film (concentration polarization) layer for particles less than 1 m in size. The concentration polarization model is modified to account for these interactions, and the authors claim good experimental agreement between measured flux results and the modified model for silica particles ranging in size from 0.01 to 0.2 m. The model is further refined in Welsch et al. (1995). In this study, the model of McDonogh et al. (1989) is extended such that previous limiting assumptions are eliminated. This model is then applied to experimental results of the filtration of silica colloids on totally rejecting Millipore PTGC polysulphone membranes (molecular weight cut off [MWCO] = 10,000 Da) to explain the charge dependence of pressure-independent flux. The extended model is capable of predicting the variation in flux with particle size (at high particle charges) and variation in flux with particle charge. A key phenomenon that is explained by the refined model is that the pressure-independent flux “passes through a minimum both as the charge of the particles increases, for constant particle size, and as the particle size increases, for constant particle charge” (Welsch et al. 1995).
Kim et al. (2001) presented an indirect study of particle-particle surface charges. Here, flocculation is used to improve filter flux in crossflow filtrations of yeast suspensions undergoing microfiltration. Flocculation increases the average particle size of the suspension, preventing fouling of the filter membrane by small cellular debris. Before undergoing crossflow filtration using hollow fiber modules from A/G Technology Corporation (0.2-m nominal pore size), suspensions of baker’s yeast were flocculated with various flocculants (six cationic flocculants, one nonionic flocculent, and one anionic flocculent). Adding flocculants improves permeate flux. The optimum flocculent concentration to maximize flocculation was identified. Mixing conditions also impacted the degree of flocculation (and permeate flux improvement).
Chellappah et al. (2008) presented another flocculation study. This study examined the increase in critical flux (i.e., the flux below which no fouling occurs) observed in crossflow microfiltration of bentonite suspensions upon addition of flocculent. Wyoming bentonite was flocculated with a polyacrylamide flocculent (Magnafloc 10) in dilute aqueous CaCl2 solutions. Filtration was performed on a zirconia filter media with a 0.2-m pore opening. Like previous studies examining steady-state or limiting (pressure independent flux), flocculent addition was demonstrated to increase flux (in this cake-limiting flux). An increase in critical flux is most pronounced for strongly agglomerated systems and least pronounced for weakly agglomerated systems.
In the study of Huisman et al. (1999b), the impact of membrane zeta potential on the critical flux (i.e., the flux above which for fouling occurs) when filtering a suspension of silica particles on ceramic membranes of three different materials (titania, zirconia, and alumina) was investigated. Two different solution pHs were examined. Neither the zeta potential of the membrane nor that of the particles
(2) PTGC refers to a series of polysulphone membranes marketed by the Millipore Corp.

3.13
influenced the observed critical flux; however, the critical flux was observed to increase with increasing wall shear stress (i.e., at higher axial velocities) and decrease with increasing particle concentration.
Huisman et al. (2000) presented a study of the influence of protein-protein and protein-membrane interactions on the crossflow ultrafiltration of bovine serum albumin (BSA) on polymeric membranes with pore sizes ranging from 2 to 15 nm. Measurements were performed at different pH to study protein-membrane charge effects. Filter fouling during the initial stages of filtration were found to be governed by membrane-protein interactions. Fouling during the later stages of filtration (i.e., after significant fouling) were governed by protein-protein interactions. Atomic force microscopy (AFM) was used to study the structure of the protein fouling layer. Below the protein iso-electric point, open protein structures were observed, and they corresponded to high observed filter flux conditions.
In Smidova et al. (2004), crossflow microfiltration of two china clay suspensions (with mean particle sizes of 3.5 and 1.5 m) on ZrO2 membranes (mean pore size 0.2 m) was used to study the influence of particle shape, zeta potential, and particle size (and their variation with pH and ionic strength) on filter flux. The zeta potential was found to have a significant impact because the permeate flux doubled near the isoelectric point. The increase is attributed to particle aggregation, which resulted in a more open cake structure.
Zhao et al. (2005a) studied the crossflow microfiltration of suspensions of TiO2 (particle concentration of 2 g/L, median particle size of 0.5 m) particles with a ceramic filter membrane (alumina, nominal pore size of 0.2 m). The goal of this study was to determine which surface properties, that of the particle or that of the membrane, dominated the filtration behavior. The zeta potential for both particle and membrane were characterized as a function of pH (2 to 10) and ionic strength (0.001 to 0.1 M NaCl). Changes in pH and ionic strength were observed to have a significant impact on filter flux. The flux declined with increasing pH, and the flux increased with increasing ionic strength (at fixed pH). These changes correlated to the dispersivity (or particle size) of the TiO2 suspensions. A lower particle size yielded a lower permeate flux.
The impacts of surface charge are not only limited to filter flux during filtration, but may also impact the effectiveness of mechanical cleaning efforts. In particular, the effectiveness of ultrasonic cleaning to remove polystyrene latex particles deposited on aluminum membranes was studied at different pH and ionic strength values in Lamminen et al. (2006). In this study, it was observed that solution conditions (pH and ionic strength) had a much greater impact on cleaning effectiveness than particle size. The cleaning effectiveness was governed by both particle-particle and particle-membrane interactions. When particle-particle repulsion was low, applying sonic energy caused particles to break off in flocs, resulting in highly effective cleaning (cake disruption). When particle-particle repulsion was high, particles broke off as individual particles, resulting in poor cleaning.
The studies discussed above focus on the impacts of zeta potential, pH, and ionic strength without explicit consideration of the electrolyte species chemistry. However, a number of recent studies highlight the importance of the cation/anion chemistry. Velikovska and Mikulasek (2007) reported a study of the impact of pH, ionic strength, and anion chemistry on the crossflow microfiltration of TiO2 dispersions (~300-nm mean particle size, 5-wt% suspension) filtered through a ceramic (alumina, 91-nm nominal pore size) medium. The results highlight the importance of both membrane and particle surface properties in crossflow microfiltration. The zeta potential of particle and filter medium was characterized in 0.001 and 0.01 M solutions of NaCl, Na2SO4, and Na3PO4. The steady-state filter flux was observed to

3.14
increase with increasing ionic strength (in the presence of electrolytes) and with decreasing pH because of the impact of these properties on the dispersivity of TiO2.
The paper of Waite et al. (1999) studied how hematite flocculation impacts the filtration of hematite (70-nm primary particles) on hydrophilic regenerated cellulose membranes (100 kDa cutoff) during dead-end ultrafiltration. The experiments examined cake and membrane resistance as a function of salt concentration, with KCl, NaCl, and CaCl2. It was found that hematite floc structure plays a crucial role in controlling the permeate flux. Cakes formed from flocs generated by diffusion-limited aggregation exhibit much lower resistance than cakes formed from flocs generated by reaction-limited aggregation. This is because diffusion-limited aggregation results in relatively open structures whereas reaction limited aggregation forms dense flocs.
Zhao et al. (2005b) presented a study of the impact of inorganic salt chemistry on the crossflow microfiltration of TiO2 suspensions (suspension concentration—2 g/L, median particle size 0.5 m) using ceramic membranes (alumina, nominal pore size of 0.2 m). The filter flux was measured as a function of suspending phase pH, ionic strength, and salt species. The uniqueness of the study was in the use of different cations (AlCl3, FeCl3, NH4Cl, and NaCl) and anions (NaCl, Na2SO4, and Na3PO4). Using NH4Cl and NaCl caused an increased flux, which was associated with an increase in the median particle size of the TiO2 (consistent with Zhao et al. 2005a). Adding AlCl3 and FeCl3 reduced the flux. It is speculated that this flux dropped the results from increased membrane resistance, resulting from the specific adsorption of Al3+ and Fe3+ ions onto the filter membrane (causing an increase in membrane zeta potential). Relative to NaCl additions, adding Na2SO4 and Na3PO4 yielded a higher decrease in permeate flux. Again, this is attributed to specific adsorption of anions on the membrane. As such, the study indicates that filter flux is strongly dependent on salt chemistry and how salt addition affects the median dispersion particle size and membrane and particle zeta potential.

4.1
4.0 Summary of WTP-Related Filtration Studies at PNNL
PNNL has performed numerous cross-flow filtration studies to support WTP and the Hanford Site over the last 15 years. These studies are described in a series of formal reports, many of which contain a large amount of filtration data generated using a bench-scale filtration system. A diagram of the most recent incarnation of the bench-scale system is given in Figure 4.1; earlier versions of this system were similar in concept but varied in some of the particulars.
Figure 4.1. Schematic of Bench-Scale Cross-Flow Filtration System Used in Recent Testing by PNNL
In a large number of these studies, filtration tests were performed with actual tank waste or waste composites. The early studies were primarily concerned with demonstrating that wastes from various tanks could be processed successfully with cross-flow filtration, i.e., achieve acceptable permeate production rates.
These proof-of-concept filtration studies typically filtered the waste with a matrix of test conditions. The matrix was constructed by varying both TMP and AV. Generally, the tests were run for a period of 1 hour; occasionally, the test duration was as much as a couple of hours. The amount of solids in the slurry being filtered was low (< 10 wt %), except for a couple of dewatered slurries. Table 4.1 presents the tank wastes studied, the filter used, and the PNNL report where the work is discussed.
4.2
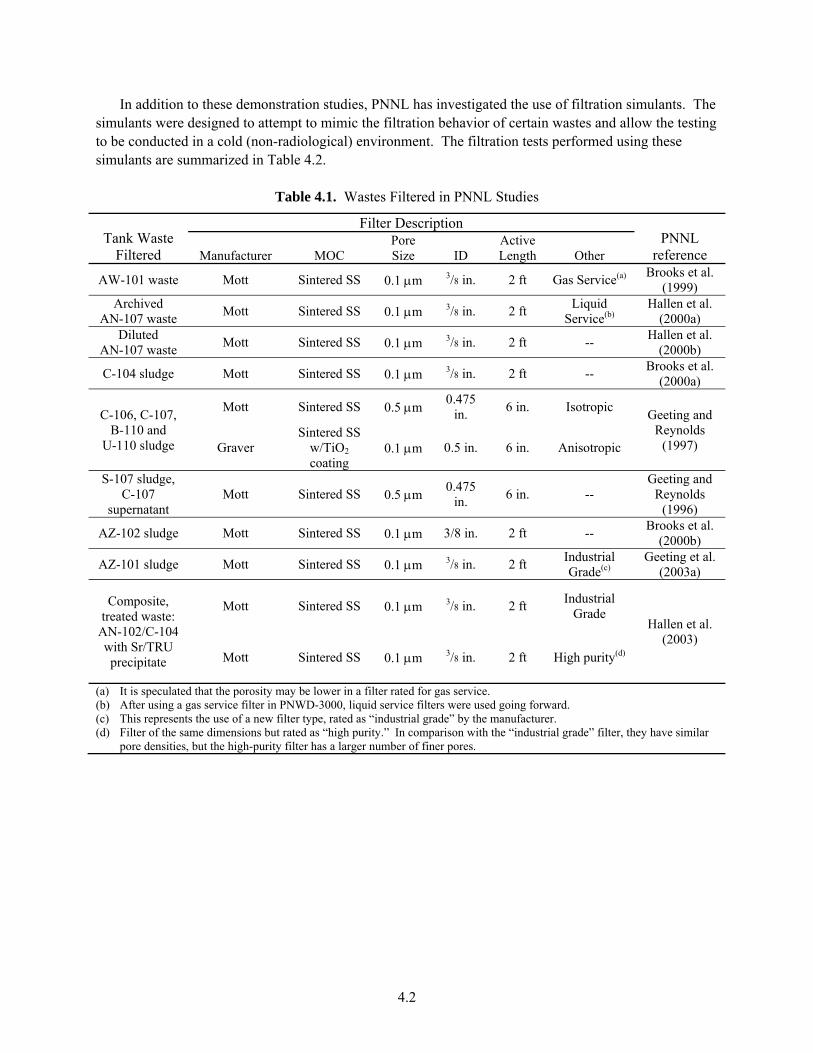
In addition to these demonstration studies, PNNL has investigated the use of filtration simulants. The simulants were designed to attempt to mimic the filtration behavior of certain wastes and allow the testing to be conducted in a cold (non-radiological) environment. The filtration tests performed using these simulants are summarized in Table 4.2.
Table 4.1. Wastes Filtered in PNNL Studies
Tank Waste Filtered
Filter Description PNNL
reference Manufacturer MOC Pore Size ID
Active Length Other
AW-101 waste Mott Sintered SS 0.1 m 3/8 in. 2 ft Gas Service(a) Brooks et al.
(1999) Archived
AN-107 waste Mott Sintered SS 0.1 m 3/8 in. 2 ft
Liquid Service(b)
Hallen et al. (2000a)
Diluted AN-107 waste
Mott Sintered SS 0.1 m 3/8 in. 2 ft -- Hallen et al.
(2000b)
C-104 sludge Mott Sintered SS 0.1 m 3/8 in. 2 ft -- Brooks et al.
(2000a)
C-106, C-107, B-110 and
U-110 sludge
Mott Sintered SS 0.5 m 0.475
in. 6 in. Isotropic
Geeting and Reynolds
(1997) Graver Sintered SS
w/TiO2 coating
0.1 m 0.5 in. 6 in. Anisotropic
S-107 sludge, C-107
supernatant Mott Sintered SS 0.5 m
0.475 in.
6 in. -- Geeting and
Reynolds (1996)
AZ-102 sludge Mott Sintered SS 0.1 m 3/8 in. 2 ft -- Brooks et al.
(2000b)
AZ-101 sludge Mott Sintered SS 0.1 m 3/8 in. 2 ft Industrial Grade(c)
Geeting et al. (2003a)
Composite, treated waste:
AN-102/C-104 with Sr/TRU precipitate
Mott Sintered SS 0.1 m 3/8 in. 2 ft Industrial
Grade Hallen et al.
(2003) Mott Sintered SS 0.1 m 3/8 in. 2 ft High purity(d)
(a) It is speculated that the porosity may be lower in a filter rated for gas service. (b) After using a gas service filter in PNWD-3000, liquid service filters were used going forward. (c) This represents the use of a new filter type, rated as “industrial grade” by the manufacturer. (d) Filter of the same dimensions but rated as “high purity.” In comparison with the “industrial grade” filter, they have similar
pore densities, but the high-purity filter has a larger number of finer pores.

4.3
Table 4.2. Cross-Flow Filtration Simulant Studies Conducted at PNNL
Simulant Filter Description PNNL
referenceManufacturer MOC Pore Size ID Active length Other C-106
simulant Mott Sinter SS 0.5 m 0.475 in. 6 in. — Golcar
et al. (2000) AZ-101/102
simulant Mott Sinter SS 0.5 m 0.475 in. 6 in. —
C-106 simulant
Mott Sintered SS 0.1 m 3/8 in. 2 ft —
Golcar (2002)
Mott Sintered SS 0.5m 0.5 in. 6 in. —
Graver Porous SS
coated w/TiO2 0.1m 0.25 in. 2 ft —
AZ-101/102 simulant
Mott Sintered SS 0.1 m 3/8 in. 2 ft — Mott Sintered SS 0.5m 0.5 in. 6 in. —
AN-102/ C-104 waste
simulant
Mott Sintered SS 0.1 m 3/8 in. 2 ft Industrial
Grade Geeting
et al. (2003b) Mott Sintered SS 0.1 m 3/8 in. 2 ft High purity
PEP Mott Sintered SS 0.1 m 1/2 in. 2 ft — Russel et al.
(2009b)
Following the work described in Table 4.1, a review of the process flow sheet by an External Flowsheet Review Team (EFRT) developed for WTP raised several critical issues that Bechtel National, Inc. (BNI) needed to address. As a part of the response plan to address those EFRT issues, PNNL demonstrated cross-flow filtration across eight waste groups that represented approximately 75% of all the tank waste (see Table 4.3). Also studied in response to EFRT issues was the effect of filter active length and temperature on flux (Daniel et al. 2009), the effect of inert fines on fouling behavior (Russell et al. 2009b), and pilot-scale filtration behavior (Daniel et al. 2010a, Kurath et al. 2009). The pilot-scale filtration behavior was run in parallel with bench-scale filtration to generate a comparison (see Daniel et al. 2010a, Billing et al. 2009).
The testing conducted in response to EFRT issues was fundamentally different than the earlier testing described in Table 4.1. The tests were run for longer periods, and data were collected more frequently using a data acquisition system. Additionally, the slurry was typically filtered at larger solids content (frequently > 10 wt %) and in more diverse chemical environments, e.g., slurry that was leached using caustic or permanganate, slurry that was washed (thereby removing a portion of components dissolved in the supernatant), etc.

4.4
Table 4.3. Waste Groups Tested at PNNL as Part of EFRT Response Plan. The filter used in the testing was the same type as the Mott filter described in Table 4.2 for the Pretreatment Engineering Platform (PEP) simulant.
Group Studied Description PNNL report
Group 1/2 blended waste Bismuth Phosphate sludge/saltcake Lumetta et al. (2009) Group 7 + AY-102 Tributyl Phosphate sludge + AY-102 waste Edwards et al. (2009)
Group 8 Ferrocyanide (FeCN) sludge Fiskum et al. (2009) Group 5 Reduction oxidation (REDOX) sludge
Shimskey et al. (2009a)
Group 6 S—Saltcake Group 5/6 REDOX sludge/S—Saltcake
Group 3/4 Plutonium-uranium extraction (PUREX) cladding
waste/REDOX cladding waste Shimskey et al.
(2009b)
The work at PNNL thus far has established that Hanford tank waste can be adequately processed using the cross-flow filtration technology. It has been used to successfully filter many different waste types at flux rates that are acceptable for throughput requirements in the WTP. However, it is not clear if the flux rates measured in many of these studies were steady-state (or minimum) fluxes. More recent work has demonstrated that permeate flux does not approach a steady-state value after 36 hours or more of filtering. Determining the minimum flux rate is important given the large amount of material that will have to be processed with the filters as the Hanford tanks are treated. The minimum flux will affect other WTP operational considerations, such as frequency of filter cleaning and backpulse strategies.
The steady-state flux when filtering a particular slurry will be governed by the fouling dynamics of the system. Filter fouling has not been studied directly at PNNL; it is frequently discussed anecdotally when discussing results of filtration experiments. During the development of the PEP simulant, attempts were made to introduce inert fine particles into the filtration to deliberately foul the bench-scale filter, but this approach was not successful (see Daniel et al. 2009). Understanding fouling is important because of the wide array of waste types to be processed at the Hanford site. Reliably predicting fouling behavior a priori based on slurry properties would be of value.
The cross-flow filtration studies conducted at PNNL usually ascribe fouling to one of three sources:
1. The evolution of the particle-size distribution during filtering caused by particle break-up or particle complexes becoming de-agglomerated in the presence of a high shear environment. In some instances, this fouling source was suspected in cases when the filter did not initially experience significant flux decay, but over time, the decay worsened.
2. The presence of component(s) that have a surface interaction with the stainless steel filter media. This is most often suspected to be iron compounds, given the effectiveness of oxalic acid cleanings.
3. The formation of a lower permeability cake over time, either by incorporating smaller particles and/or increasing cake thickness. Lower permeability cakes could be formed (but this is not necessitated) because of changes in the particle-size distribution.
Another possible cause that is mentioned in passing in some PNNL work is “subsurface fouling.” This implies some type of pore penetration mechanism that fouls the filter. It is usually surmised to be the cause of fouling when there is otherwise unexplained irreversible fouling observed. Irreversible

4.5
fouling is when the initial clean water flux cannot be recovered even after draining, rinsing, and cleaning the filter.
To this point, PNNL studies have yet to discover how to predict if any of these possible fouling mechanisms will be present in a particular slurry, whether they are mutually exclusive of each other (or not), and how they affect the steady-state value of the permeate flux. Insight into any of these issues would help suggest potential mitigation strategies for slurries that will foul cross-flow filters and decrease the filter flux an unacceptable amount.
The proximate cause of fouling in a filter is closely related to filter cleaning: the cleaning efficacy may depend on knowing how the filter fouled. In the PNNL studies, several cleaning methods have been used with varying degrees of success. To date, oxalic acid has been the most promising cleaning agent because it has always restored the initial filter fluxes. The reason for the effectiveness of oxalic acid is suspected to be its capability to dissolve iron foulants, such as iron oxy-hydroxide. This has yet to be confirmed and is worth further study. This is particularly important when considering that the preferred filter cleaning process in the WTP uses nitric acid. Nitric acid has been demonstrated in the PNNL work to be only sporadically effective at restoring the filter to its pre-test performance.
There is also evidence that the filter itself can play a large role in determining the fouling dynamics of the system. Several different filter types have been used to filter slurries at PNNL, and the data suggest that the pore size, distribution of pores, and pore structure all play a role in how a filter fouls. Unfortunately, filters of several different types have yet to be tested on anything but a waste simulant. Simulants tested at PNNL, to this point, have not fouled as significantly as actual wastes. Comparisons of different filter types in the presence of more aggressive fouling slurries, whether using actual waste or an as-yet-unknown simulant, would be another study that may help in understanding fouling behavior or suggest methods to mitigate fouling.
Taken all together, the PNNL work thus far indicates the following:
Filter fouling occurs, even in the short term; PNNL work hints at long-term flux decay (due to fouling), which has yet to be confirmed.
The precise mechanism(s) by which fouling occurs in Hanford tank waste is not well understood.
The filter can be effectively cleaned using various acids; however, a systematic study of cleaning agents has not been performed. At the time of this writing, filter cleaning is usually performed by trial and error.
The choice of filter geometry, material of construction, pore distribution, etc. is not an inconsequential one, especially as it relates to fouling behavior.


5.1
5.0 Recent Filtration Modeling for Hanford Tank Wastes and Suggestions for Improvements
As discussed in previous sections of this report, fouling of the filter elements with tank waste solids has the potential to significantly impact waste pre-treatment operations because 1) fouling will lower filter throughput and 2) operations that could restore filter performance (such as cleaning and/or filter replacement) are limited by the risk associated with radiological dose exposure. Although the filter performance for each waste feed can be characterized with bench-scale tests, the extent to which these tests can measure filter performance is limited by the high cost of working with radioactive material and by the fact that bench-scale filtration times are typically much shorter than those expected in plant-scale operations. To eliminate the need for extensive tests with actual wastes to determine the rate and degree of fouling and to determine the capability of backpulsing to maintain acceptable throughput, PNNL has developed substitute methods that can be employed to predict (or extrapolate) the rate of flux decline and/or the degree of filter fouling based on limited actual waste filter performance data. Recent PNNL modeling efforts are discussed in the following sections.
5.1 PNNL Efforts to Model Flux Time Dependence
Fouling is a time-dependent process; however, most filtration studies to-date at PNNL are limited to short times (typically 4 to 10 hours) relative to expected WTP operations (greater than ~100 hours). Recent PNNL modeling efforts have been focused on predicting the rate of flux decline from available data and estimating (from extrapolation) at longer times. A recent approach has been developed and is reported in Daniel et al. (2010b). A summary of their model (and relevant background information/justification) is given below.
Filtration operations employed at the WTP will be used to dewater waste slurries from approximately 5-wt% to 20-wt% insoluble solids. Relative to Hanford tank waste slurries, which exhibit a broad particle-size distribution that ranges from ~0.2 to ~300 m, the filter medium (Mott grade 0.1 sintered stainless steel) has an estimated pore size of 1 to 3 m (based on isopropanol bubble point and filter flux data and SEM images provided by the manufacturer). Because of media tortuousity, the stainless steel filters can capture and retain particles well below 1 m with high efficiency. Wells et al. (2007) have developed a generalized estimate of the insoluble-solids, particle-size distribution for Hanford tank wastes from historical particle-size measurement data of select Hanford tank waste types. Particle-size data included in the particle-size distribution estimate provided by Wells et al. (2007) were selected from the data sets that were most self-consistent in terms of the instruments, methods, and measurement conditions used to characterize the size of insoluble waste particles. The presence of relatively small particles in the composite distribution, shown in Figure 5.1, suggests a potential for pore fouling (or pore infiltration) of the filter elements employed at the WTP.
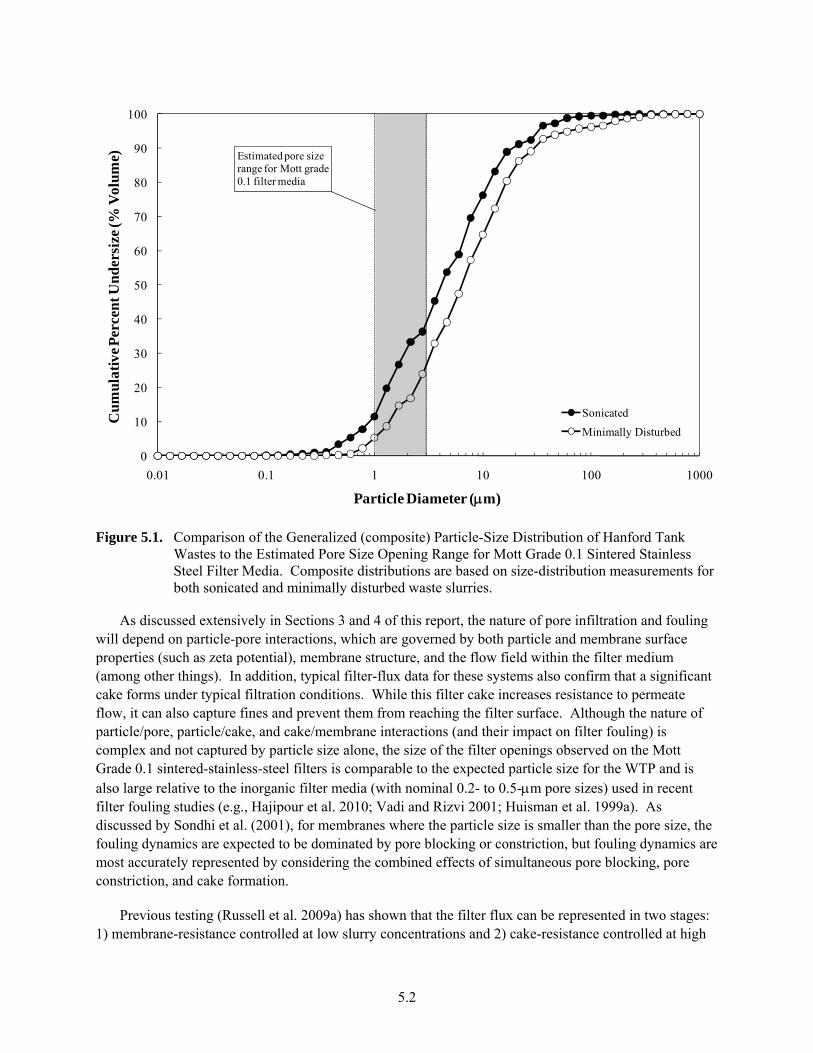
5.2
Figure 5.1. Comparison of the Generalized (composite) Particle-Size Distribution of Hanford Tank Wastes to the Estimated Pore Size Opening Range for Mott Grade 0.1 Sintered Stainless Steel Filter Media. Composite distributions are based on size-distribution measurements for both sonicated and minimally disturbed waste slurries.
As discussed extensively in Sections 3 and 4 of this report, the nature of pore infiltration and fouling will depend on particle-pore interactions, which are governed by both particle and membrane surface properties (such as zeta potential), membrane structure, and the flow field within the filter medium (among other things). In addition, typical filter-flux data for these systems also confirm that a significant cake forms under typical filtration conditions. While this filter cake increases resistance to permeate flow, it can also capture fines and prevent them from reaching the filter surface. Although the nature of particle/pore, particle/cake, and cake/membrane interactions (and their impact on filter fouling) is complex and not captured by particle size alone, the size of the filter openings observed on the Mott Grade 0.1 sintered-stainless-steel filters is comparable to the expected particle size for the WTP and is also large relative to the inorganic filter media (with nominal 0.2- to 0.5-m pore sizes) used in recent filter fouling studies (e.g., Hajipour et al. 2010; Vadi and Rizvi 2001; Huisman et al. 1999a). As discussed by Sondhi et al. (2001), for membranes where the particle size is smaller than the pore size, the fouling dynamics are expected to be dominated by pore blocking or constriction, but fouling dynamics are most accurately represented by considering the combined effects of simultaneous pore blocking, pore constriction, and cake formation.
Previous testing (Russell et al. 2009a) has shown that the filter flux can be represented in two stages: 1) membrane-resistance controlled at low slurry concentrations and 2) cake-resistance controlled at high
0
10
20
30
40
50
60
70
80
90
100
0.01 0.1 1 10 100 1000
Cu
mu
lati
ve P
erce
nt U
nd
ersi
ze (%
Vol
um
e)
Particle Diameter (m)
Sonicated
Minimally Disturbed
Estimated pore size range for Mott grade 0.1 filter media
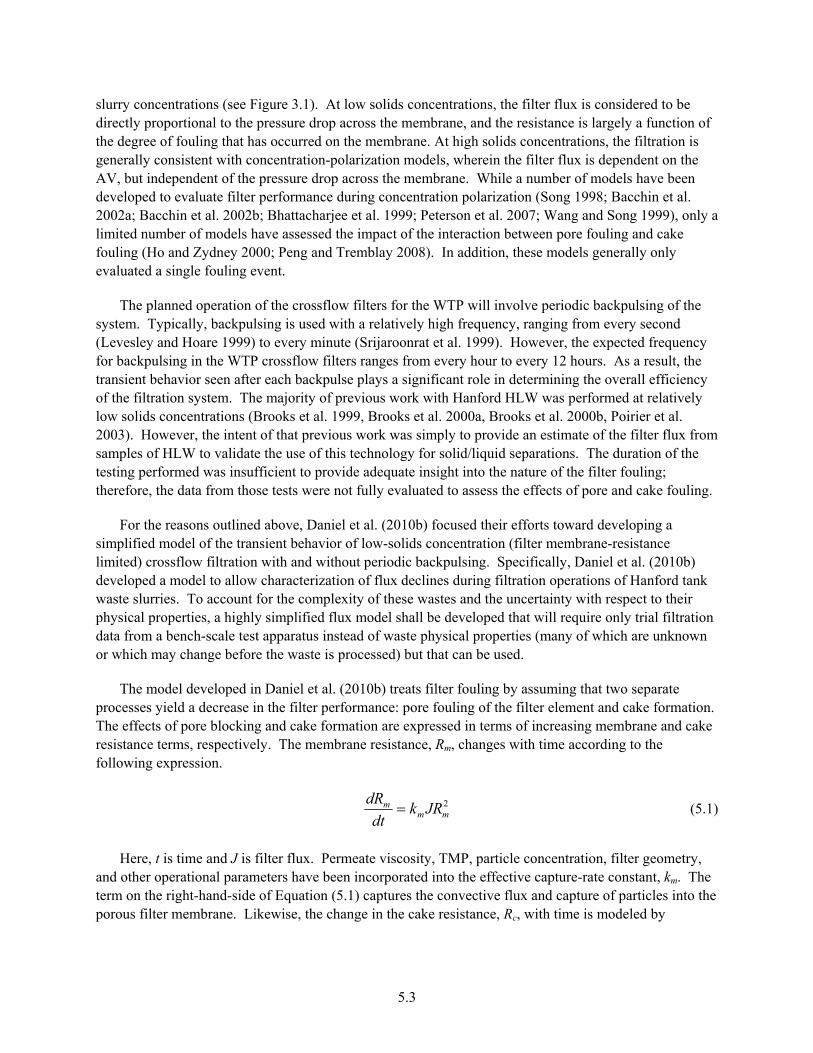
5.3
slurry concentrations (see Figure 3.1). At low solids concentrations, the filter flux is considered to be directly proportional to the pressure drop across the membrane, and the resistance is largely a function of the degree of fouling that has occurred on the membrane. At high solids concentrations, the filtration is generally consistent with concentration-polarization models, wherein the filter flux is dependent on the AV, but independent of the pressure drop across the membrane. While a number of models have been developed to evaluate filter performance during concentration polarization (Song 1998; Bacchin et al. 2002a; Bacchin et al. 2002b; Bhattacharjee et al. 1999; Peterson et al. 2007; Wang and Song 1999), only a limited number of models have assessed the impact of the interaction between pore fouling and cake fouling (Ho and Zydney 2000; Peng and Tremblay 2008). In addition, these models generally only evaluated a single fouling event.
The planned operation of the crossflow filters for the WTP will involve periodic backpulsing of the system. Typically, backpulsing is used with a relatively high frequency, ranging from every second (Levesley and Hoare 1999) to every minute (Srijaroonrat et al. 1999). However, the expected frequency for backpulsing in the WTP crossflow filters ranges from every hour to every 12 hours. As a result, the transient behavior seen after each backpulse plays a significant role in determining the overall efficiency of the filtration system. The majority of previous work with Hanford HLW was performed at relatively low solids concentrations (Brooks et al. 1999, Brooks et al. 2000a, Brooks et al. 2000b, Poirier et al. 2003). However, the intent of that previous work was simply to provide an estimate of the filter flux from samples of HLW to validate the use of this technology for solid/liquid separations. The duration of the testing performed was insufficient to provide adequate insight into the nature of the filter fouling; therefore, the data from those tests were not fully evaluated to assess the effects of pore and cake fouling.
For the reasons outlined above, Daniel et al. (2010b) focused their efforts toward developing a simplified model of the transient behavior of low-solids concentration (filter membrane-resistance limited) crossflow filtration with and without periodic backpulsing. Specifically, Daniel et al. (2010b) developed a model to allow characterization of flux declines during filtration operations of Hanford tank waste slurries. To account for the complexity of these wastes and the uncertainty with respect to their physical properties, a highly simplified flux model shall be developed that will require only trial filtration data from a bench-scale test apparatus instead of waste physical properties (many of which are unknown or which may change before the waste is processed) but that can be used.
The model developed in Daniel et al. (2010b) treats filter fouling by assuming that two separate processes yield a decrease in the filter performance: pore fouling of the filter element and cake formation. The effects of pore blocking and cake formation are expressed in terms of increasing membrane and cake resistance terms, respectively. The membrane resistance, Rm, changes with time according to the following expression.
2mm
m JRkdt
dR (5.1)
Here, t is time and J is filter flux. Permeate viscosity, TMP, particle concentration, filter geometry,
and other operational parameters have been incorporated into the effective capture-rate constant, km. The term on the right-hand-side of Equation (5.1) captures the convective flux and capture of particles into the porous filter membrane. Likewise, the change in the cake resistance, Rc, with time is modeled by
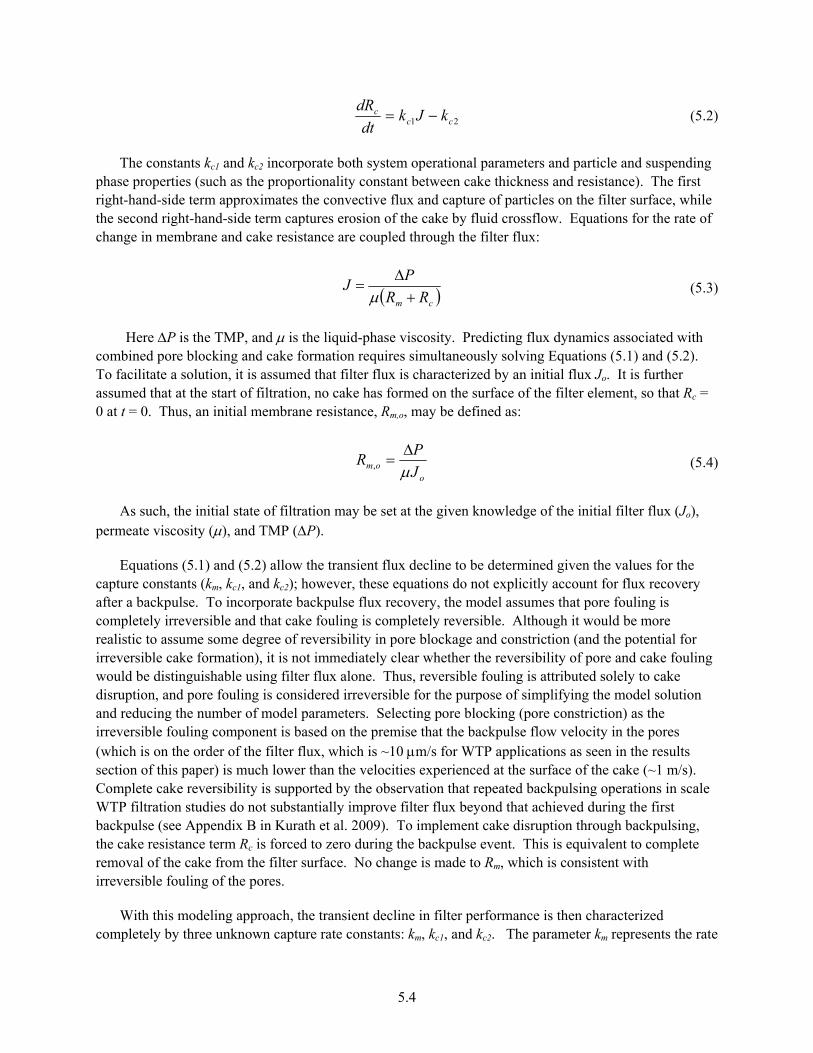
5.4
21 ccc kJk
dt
dR (5.2)
The constants kc1 and kc2 incorporate both system operational parameters and particle and suspending phase properties (such as the proportionality constant between cake thickness and resistance). The first right-hand-side term approximates the convective flux and capture of particles on the filter surface, while the second right-hand-side term captures erosion of the cake by fluid crossflow. Equations for the rate of change in membrane and cake resistance are coupled through the filter flux:
(5.3)
Here P is the TMP, and is the liquid-phase viscosity. Predicting flux dynamics associated with combined pore blocking and cake formation requires simultaneously solving Equations (5.1) and (5.2). To facilitate a solution, it is assumed that filter flux is characterized by an initial flux Jo. It is further assumed that at the start of filtration, no cake has formed on the surface of the filter element, so that Rc = 0 at t = 0. Thus, an initial membrane resistance, Rm,o, may be defined as:
oom J
PR
, (5.4)
As such, the initial state of filtration may be set at the given knowledge of the initial filter flux (Jo), permeate viscosity (), and TMP (P).
Equations (5.1) and (5.2) allow the transient flux decline to be determined given the values for the capture constants (km, kc1, and kc2); however, these equations do not explicitly account for flux recovery after a backpulse. To incorporate backpulse flux recovery, the model assumes that pore fouling is completely irreversible and that cake fouling is completely reversible. Although it would be more realistic to assume some degree of reversibility in pore blockage and constriction (and the potential for irreversible cake formation), it is not immediately clear whether the reversibility of pore and cake fouling would be distinguishable using filter flux alone. Thus, reversible fouling is attributed solely to cake disruption, and pore fouling is considered irreversible for the purpose of simplifying the model solution and reducing the number of model parameters. Selecting pore blocking (pore constriction) as the irreversible fouling component is based on the premise that the backpulse flow velocity in the pores (which is on the order of the filter flux, which is ~10 m/s for WTP applications as seen in the results section of this paper) is much lower than the velocities experienced at the surface of the cake (~1 m/s). Complete cake reversibility is supported by the observation that repeated backpulsing operations in scale WTP filtration studies do not substantially improve filter flux beyond that achieved during the first backpulse (see Appendix B in Kurath et al. 2009). To implement cake disruption through backpulsing, the cake resistance term Rc is forced to zero during the backpulse event. This is equivalent to complete removal of the cake from the filter surface. No change is made to Rm, which is consistent with irreversible fouling of the pores.
With this modeling approach, the transient decline in filter performance is then characterized completely by three unknown capture rate constants: km, kc1, and kc2. The parameter km represents the rate
cm RR
PJ

5.5
of pore blockage that occurs. Thus, the higher the value for km, the faster the irreversible fouling that occurs, and thus the faster the apparent rate of pore blockage. The parameters kc1 and kc2 indicate the rate of increase of cake resistance with flux and the rate of reduction of cake resistance via cake erosion. The ratio of kc1 to kc2 quantifies the extent of reversible fouling that occurs as a result of cake buildup and also is representative of the equilibrium cake resistance. The values for these capture constants are a function of waste properties and operating conditions. They can be determined by fitting filter flux decline for actual waste or waste simulants. Then, these model parameters can be used to extrapolate filter behavior to times longer than available from the current set.
To demonstrate the model’s capability to capture both filter flux decay and flux recover, Daniel et al. (2010b) applied the model to sets of filter flux data for a Hanford tank waste simulant filtered through a single, sintered, stainless steel filter element that is 2 foot long, 1/2-inch inner diameter, and 5/8-inch outside diameter configured in a tube-in-shell geometry. Figure 5.2 shows one such analysis from Daniel et al. (2010b). Here, the model was applied to a 36-hour filtration test performed at a constant slurry solids concentration of 5 wt% (effected by continuously returning all permeate collected back into the slurry). During the first 12-hours, the filter flux was allowed to decay, during the second 12-hours, the filter was backpulsed every 30 minutes to maintain a higher permeate flux, and during the final 12-hours, the filter flux was again allowed to decay. To fit this data, the values for the three capture constants, km, kc1, and kc2, were determined through least squares regression analysis of the combined fouling flux model against the actual measured flux data. The optimized values of km, kc1, and kc2, are shown in the middle of Table 5.1.
Table 5.1. Model Parameters for a 36-Hour Filtration Test
Model Parameters Fixed Parameters
∆P 280,000 Pa µ 0.0026 Pa s ∆P/µ 110,000,000 s-1 Jo 4.2×10⁻⁵ m s-1
Adjustable Parameter Estimates km 3.48×10⁻¹² -- --
kc1 5.65×10¹⁴ m-2
kc2 1.03×10¹⁰ m-1 s-1
Calculated Values
Rm,o 2.5×10¹² m-1
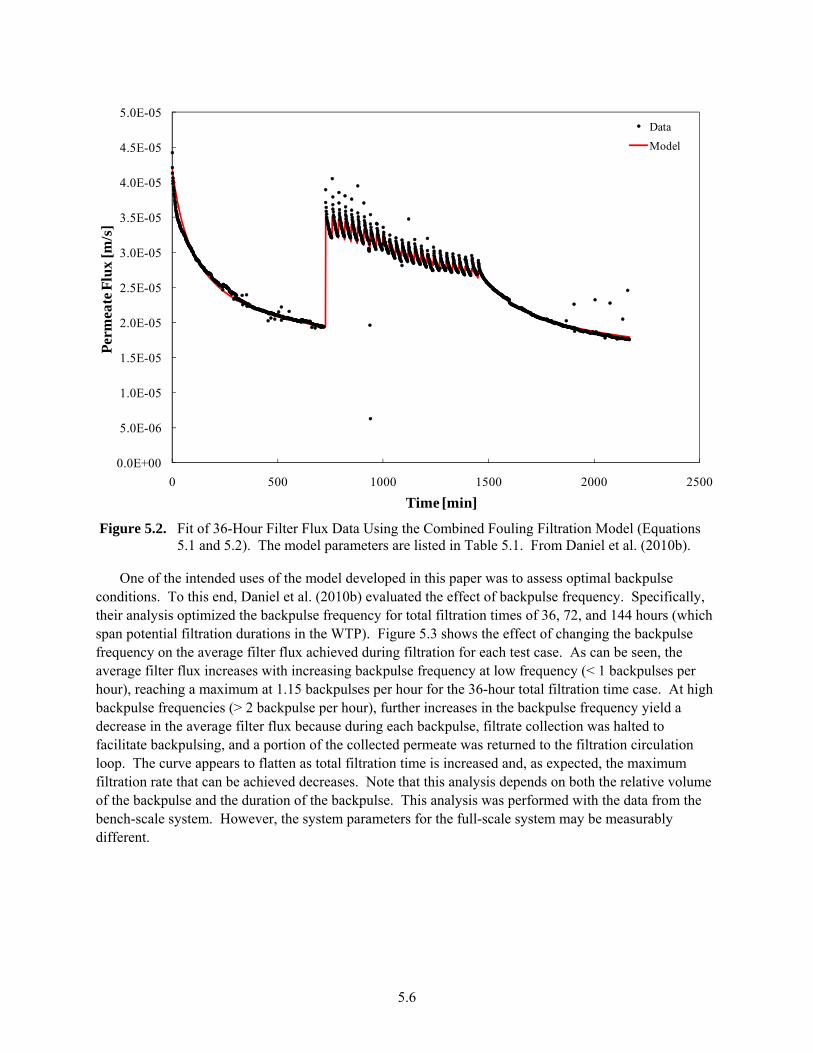
5.6
Figure 5.2. Fit of 36-Hour Filter Flux Data Using the Combined Fouling Filtration Model (Equations
5.1 and 5.2). The model parameters are listed in Table 5.1. From Daniel et al. (2010b).
One of the intended uses of the model developed in this paper was to assess optimal backpulse conditions. To this end, Daniel et al. (2010b) evaluated the effect of backpulse frequency. Specifically, their analysis optimized the backpulse frequency for total filtration times of 36, 72, and 144 hours (which span potential filtration durations in the WTP). Figure 5.3 shows the effect of changing the backpulse frequency on the average filter flux achieved during filtration for each test case. As can be seen, the average filter flux increases with increasing backpulse frequency at low frequency (< 1 backpulses per hour), reaching a maximum at 1.15 backpulses per hour for the 36-hour total filtration time case. At high backpulse frequencies (> 2 backpulse per hour), further increases in the backpulse frequency yield a decrease in the average filter flux because during each backpulse, filtrate collection was halted to facilitate backpulsing, and a portion of the collected permeate was returned to the filtration circulation loop. The curve appears to flatten as total filtration time is increased and, as expected, the maximum filtration rate that can be achieved decreases. Note that this analysis depends on both the relative volume of the backpulse and the duration of the backpulse. This analysis was performed with the data from the bench-scale system. However, the system parameters for the full-scale system may be measurably different.
0.0E+00
5.0E-06
1.0E-05
1.5E-05
2.0E-05
2.5E-05
3.0E-05
3.5E-05
4.0E-05
4.5E-05
5.0E-05
0 500 1000 1500 2000 2500
Per
mea
te F
lux
[m/s
]
Time [min]
Data
Model

5.7
Figure 5.3. Impact of Increasing Backpulse Frequency on Average Filter Flux. From Daniel et al. (2010b).
5.2 PNNL Efforts to Model Filter Flux Concentration Dependence
Because one of the primary functions of WTP filtration systems is to dewater actual waste slurries, models that predict the dependence of filter flux on solids concentration are important. As discussed in previous sections, the dependence of filter performance on increasing slurry solids concentration is broken in to membrane- and cake-resistance limited regions. This basic formulation is shown in Figure 3.1. Filter flux that is limited by membrane resistance occurs at low concentrations and is modeled using the equation:
∆
(5.5)
Here, flux is estimated by evaluating the membrane resistance term, Rm, that best characterizes the filter flux. For predictions of filter flux in the region that is limited by cake resistance, the concentration polarization model is employed such that flux is modeled by: ln / (5.6)
Here, flux may be estimated by finding best fit values for K and cg. Both Equations (5.5) and (5.6) do not include terms to account for the potential time-dependence of filter flux. As such, their use should be nominally restricted to steady-state. It addition, these equations apply to two distinct regions of filtration behavior with no clear boundary defining where each should be used. Geeting et al. (2005) provided the following combined equation based on a resistance in series that would appear to capture both membrane- and cake-limited regions:
5.8
∆
∆′√ ⁄
(5.7)
where k’ is a modified mass transfer coefficient for cake formation and is defined as ′
√ .
The difficulty in applying Equations (5.5) through (5.7) to model actual waste behavior with changes in concentration is that the defining parameters, Rm, K (or k’), and cg, are often unknown. Previous sections have discussed approaches for determining the value for the mass-transfer constant K. One unknown model parameter could be eliminated by estimating Rm for sintered, stainless steel, Mott grade-0.1 filters from measurements of clean water flux. However, the weakness of this approach is that fouling of the membrane will change Rm, making the parameter strongly dependent on filter history and conflicting with the assumption of filtration steady-state assumed in Equations (5.5) to (5.7). As discussed in Section 3 of this report, a recent PNNL study has associated the gel concentration observed in the dewatering of waste slurry and waste slurry simulants with the centrifuged solids concentration (Peterson et al. 2007). In actual waste filtration operations, divergence from the gel polarization concentration has been observed as the concentration approaches the limiting gel concentration (Daniel et al. 2010a, Billing et al. 2009). This divergence has been attributed to the difficulties in pumping the high-concentration, waste simulant slurry.
5.3 Limitations of Current Waste Filter Models and Recommendations for Future Model Development
Developing models to adequately capture and predict the behavior of actual Hanford waste slurries is an ongoing process. Not only is the waste behavior complex, but the waste slurries are also changing over the course of their storage life in the tanks. The major weakness of all filtration models outlined above is that they require analysis against actual waste data to determine “best-fit” model parameters for a given set of filtration conditions (e.g., AV and TMP). While the models allow extrapolation to times and concentrations not tested, they are strictly limited to the operational conditions under which the experimental data they correspond to were collected. Additionally, the progression of mechanisms underlying the models is generally not well understood. For example, Equation (5.7) provides a means for incorporating regions limited by both membrane and cake resistance when attempting to predict how filter flux changes with concentration, yet this equation predicts a smooth transition in flux from membrane- to cake-limited regions. However, experimental dewatering curves for Hanford tank wastes do not show smooth transitions; instead, the transition is abrupt, causing a discontinuity in the slope of the dewatering curve (see Figure 3.1).
A similar example can be made for the predictions of how non-steady-state filter flux decays with time in Daniel et al. (2010b). Specifically, the equations employ two mechanisms, pore blocking and cake formation, that work simultaneously with time over the entire period of filtration. The relative strength of each mechanism is determined by the values of the capture constants km, kc1, and kc2. The immediate difficulty encountered with the model is that cake formation reaches a steady-state while pore fouling can continue to occur indefinitely. Physical intuition suggests that cake formation would tend to arrest fouling of the filter membrane or would at least change the mechanism and rate by which it occurs. Physical data supporting this may be found in Daniel et al. (2010a), with a specific example being a dramatic increase in the rate at which some filter bundles in the PEP engineering-scale tests fouled when subjected to frequent cake disruption. Moreover, indefinite pore fouling suggests a lack of steady-state

5.9
flux, which means that the flux will eventually decline to zero. As stated in Section 3, the main advantage proposed for using the crossflow filter configuration (as opposed to dead-end filtration) is an eventual steady-state in the filter flux. Current waste-simulant filtration tests have not been run for sufficient periods of time to determine the existence of a filtration steady-state, so it is unknown if the lack of a filtration steady-state in the model proposed by Daniel et al. (2010b) accurately reflects the behavior of actual waste slurries.
Overall, the current PNNL models for actual waste filtration are strongly empirical. Application to actual waste data yields a set of model parameters applicable only to the operational parameters test and to the chemistry of the waste slurry employed in testing. These limitations do not allow extrapolation to other operating conditions, such as different TMPs and axial velocities, and do not allow prediction of the filtration of waste throughout the pre-treatment process. As such, it is difficult (if not impossible) to develop or recommended optimized filtration conditions based on known initial waste properties and any current understanding of how the chemical leaching and washing processes will change the waste chemistry. To improve the predictive value of PNNL models, there are two important research areas to study at PNNL:
Study Long-Time Filtration Dynamics—This would 1) help evaluate the existence of filtration steady-state and 2) determine the functionality of long-time filter decay on operational parameters such as AV and TMP. Moreover, it may help define the functionality of existing model coefficients (such as km) with these parameters or allow more refined models to be developed. The overall goal is to better understand particle interactions with the filter to help define the filtration regime. Current studies (which only encompass up to ~10 hours of undisturbed filter time) do not fully define the mechanics by which flux decays. Pore blocking and cake formation are thought to dominate, but observed phenomenon such as the formation of protective cake layers that prevent depth fouling are not explained. A time progression of filtration resistance change is sought, whereby we can better define time-scales for particle-pore interactions, cake growth, and cake maturation.
Evaluate the Impacts of Solution Chemistry on the Filtration Process—As shown by Figure 5.1, the waste contains a submicron fraction of particles that can engage in particle-pore interactions during filtration. Because these particles are colloidal, surface phenomena (such as electrostatic repulsion) can play a significant role in how these particles interact with the filter medium and each other. It is anticipated that changes in solution and particle chemistry during chemical leaching and washing operations at the WTP will fundamentally alter how each of the waste slurries filter because of changes in these surface interactions. It is recommended that the impact of changing solution chemistry on filter performance (both in terms of flux decay during continuous filtration and recovery during backpulsing) be studied to help form predictive models of changing filter performance throughout the pretreatment process. This would help reduce the dependence on studies of actual waste filter performance for each chemical leaching or washing step.
These two research areas will help in developing filtration models that better specify the fouling mechanisms and can estimate how operating conditions and chemistry affect filter performance.


6.1
6.0 Concluding Remarks
The goal of the current report was to provide a summary of the current understanding of waste fouling dynamics and filter performance. To this end, a brief review of the current state-of-knowledge regarding crossflow filtration and fouling dynamics in the general literature has been provided in Section 3.0. In addition to the review of general literature studies, a detailed review of previous waste filtration studies performed at PNNL (for the Hanford Site) was provided in Section 4.0. Finally, the current state of actual development of waste filtration models at PNNL, along with recommendations for future development, has been provided in Section 5.0. This extensive literature review provides a starting point to help achieve the ultimate goal of the current project, which is to identify technologies, such as modifications to the process (e.g., reconfiguration of the filter geometry or changes to operational techniques) or use of physical property modifiers that increase the sustainability of the filter process. Overall, two avenues of future model development are recommended: 1) determine long-term filtration dynamics of actual waste and waste simulant slurries and 2) evaluate the impact of solution chemistry on the rate of filtration and filter fouling. A better understanding of these long-term fouling dynamics and solution chemistry effects will help in developing better predictive models and improved process optimization.

7.1
7.0 References
Bacchin P, M Meireles , and P Aimar. 2002a. “Modeling of filtration: from the polarised layer to deposit formation and compaction.” Desalination 145:139–146.
Bacchin P, D Si-Hassen, V Starov, MJ Clifton, and P Aimar. 2002b. “A unifying model for concentration polarization, gel-layer formation and particle deposition in cross-flow membrane filtration of colloidal suspensions.” Chemical Engineering Science 57:77–91
Bacchin P, P Aimar, and RW Field. 2006. “Critical and sustainable fluxes: Theory, experiments and applications.” Journal of Membrane Science 281:42–69.
Baker RW, EL Cussler, W Eykamp, WJ Koros, RL Riley, and H Strathmann. 1991. Membrane Separation Systems - Recent Developments and Future Directions. Noyes Data Corporation, Park Ridge, New Jersey.
Belfort G, RH Davis, and AL Zydney. 1994. “The behavior of suspensions and macromolecular solutions in crossflow microfiltration.” Journal of Membrane Science 96:1–58.
Benavente J and C Fernandez-Pineda. 1985. “Electrokinetic Phenomena in porous membranes: Determination of phenomenological coefficients and transport numbers.” Journal of Membrane Science 23:121–136.
Bhattacharjee S, AS Kim, and M Elimelech. 1999. “Concentration polarization of interacting solute particles in cross-flow membrane filtration.” Journal of Colloid and Interface Science 212:81–99.
Billing JM, RC Daniel, DE Kurath, and RA Peterson. 2009. Bench-Scale Filtration Testing in Support of the Pretreatment Engineering Platform (PEP). PNNL-18673, Pacific Northwest National Laboratory, Richland, Washington.
Blatt WF, A Dravid, AS Michaels, and L Nelson. 1970. “Solute polarization and cake formation in membrane ultrafiltration: causes, consequences and control techniques.” In: Membrane Science and Technology, J.E. Flinn (Ed.), Plenum Press, New York, New York.
Brooks KP, PR Bredt, GR Golcar, SA Hartley, MW Urie, JM Tingey, KG Rappe, and LK Jagoda. 1999. Ultrafiltration and Characterization of AW-101 Supernatant and Entrained Solids. PNWD-3000, Pacific Northwest National Laboratory, Richland, Washington.
Brooks KP, LK Jagoda, PR Bredt, KG Rappe, GR Golcar, MW Urie, and SA Hartley. 2000a. Characterization, Washing, Leaching, and Filtration of C-104 Sludge. PNWD-3024, Pacific Northwest National Laboratory, Richland, Washington.
Brooks KP, PR Bredt, SK Cooley, GR Golcar, LK Jagoda, KG Rappe and MW Urie. 2000b. Characterization, Washing, Leaching, and Filtration of AZ-102 Sludge. PNWD-3045, Pacific Northwest National Laboratory, Richland, Washington.

7.2
Broz Z and N Epstein. 1976. “Electrokinetic flow through porous media composed of fine cylindrical capillaries.” Journal of Colloid and Interface Science 56(3):605–612.
Chellappah K, ES Tarleton, and RJ Wakeman. 2008. “Effect of flocculation on critical flux during crossflow microfiltration of bentonite suspensions.” Separation Science and Technology 43:29–44.
Chen V, H Li, and AG Fane. 2004. “Non-invasive observation of synthetic membrane processes—a review of methods. Journal of Membrane Science 241:23–44.
Choi H, K Zhang, D Dionysiou, D Oerther, and G Sorial. 2004. “Influence of cross-flow velocity on membrane performance during filtration of biological suspensions.” Journal of Membrane Science 248:189–199.
Chong TH, FS Wong, and AG Fane. 2008. “Implications of critical flux and cake enhanced osmotic pressure (CEOP) on colloidal fouling in reverse osmosis: Experimental observations.” Journal of Membrane Science 314:101–111.
Christensen ML, TB Nielsen, MBO Andersen, and K Keiding. 2009. “Effect of water-swollen organic materials on crossflow filtration performance.” Journal of Membrane Science 333:94–99.
Cumming IW, RG Holdich, and B Ismail. 1999. “Prediction of deposit depth and transmembrane pressure during crossflow microfiltration.” Journal of Membrane Science 154:229–237.
Daniel RC, JM Billing, ML Luna, KJ Cantrell, RA Peterson, ML Bonebrake, RW Shimskey, and LK Jagoda. 2009. Characterization of Filtration Scale-Up Performance. PNNL-18117, Pacific Northwest National Laboratory, Richland, Washington.
Daniel RC, JM Billing, JR Bontha, CF Brown, PW Eslinger, BD Hanson, JL Huckaby, NK Karri, ML Kimura, DE Kurath, and MJ Minette. 2010a. EFRT M-12 Issue Resolution: Comparison of Filter Performance at PEP and CUF Scale. PNNL-18498 Rev 1; WTP-RPT-185 Rev 1, Pacific Northwest National Laboratory, Richland, Washington.
Daniel RC, Billing JM, Russell RL, Shimskey RW, Smith RA, and Peterson RA. 2010b. “Integrated pore blockage-cake filtration model for crossflow filtration.” Accepted for publication in Chemical Engineering Research and Design.
Davis RH and DT Leighton. 1987. “Shear induced transport of a particle layer along a porous wall.” Chemical Engineering Science 42:275–281.
Davis RH and JD Sherwood. 1990. “A similarity solution for steady-state crossflow microfiltration.” Chemical Engineering Science 45:3203–3209.
Eckstein EC, PG Bailey, and AH Shapiro. 1977. “Self-diffusion of particles in shear flow of a suspension.” Journal of Fluid Mechanics 79:191–208.
Edwards MK, JM Billing, DL Blanchard, Jr, EC Buck, AJ Casella, AM Casella, JV Crum, RC Daniel, KE Draper, SK Fiskum, LK Jagoda, ED Jenson, AE Kozelisky, PJ MacFarlan, RA Peterson, RW Shimskey, LA Snow, and RG Swoboda. 2009. Characterization, Leaching, and Filtration Testing for
7.3
Tributyl Phosphate (TBP, Group 7) Actual Waste Sample Composites. PNNL-18119, Pacific Northwest National Laboratory, Richland, Washington.
Fiskum SK, JM Billing, JV Crum, RC Daniel, MK Edwards, RW Shimskey, RA Peterson, PJ MacFarlan, EC Buck, KE Draper, and AE Kozelisky. 2009. Characterization, Leaching, and Filtrations Testing of Ferrocyanide Tank sludge (Group 8) Actual Waste Composite. PNNL-18120, Pacific Northwest National Laboratory, Richland, Washington.
Geeting JGH and BA Reynolds. 1996. Bench-Scale Cross Flow Filtration of Tank S-107 Sludge Slurries and Tank C-107 Supernatant. PNNL-11376, Pacific Northwest National Laboratory, Richland, Washington.
Geeting JGH and BA Reynolds. 1997. Bench-Scale Cross Flow Filtration of Tank C-106, C-107, B-110, and U-110 Sludge Slurries. PNNL-11652, Pacific Northwest National Laboratory, Richland, Washington.
Geeting JGH, RT Hallen, LK Jagoda, AP Poloski, RD Scheele, and DR Weier. 2003a. Filtration, Washing, and Caustic Leaching of Hanford Tank AZ-101 Sludge. PNWD-3206 R1, Pacific Northwest National Laboratory, Richland, Washington.
Geeting JGH, RT Hallen, DR Weier, and CF Wend. 2003b. Filtration of Envelope C Waste Simulant Treated by the Sr/TRU Precipitation Process. PNWD-3258, Pacific Northwest National Laboratory, Richland, Washington.
Geeting JGH, RT Hallen, RA Peterson. 2005. “Optimization of ultrafilter feed conditions using classical filtration models.” Journal of Membrane Science 265:137–141.
Golcar GR. 2002. Performance of Tubular Porous Metal Crossflow Filters. PNWD-3216, Pacific Northwest National Laboratory, Richland, Washington.
Golcar GR, KP Brooks, JG Darab, JM Davis, and LK Jagoda. 2000. Development of Inactive High Level Waste Envelope D Simulants for Scaled Crossflow Filtration Testing. PNWD-3042, Pacific Northwest National Laboratory, Richland, Washington.
Green G and G Belfort. 1980. “Fouling of ultrafiltration membranes: lateral migration and the particle trajectory model.” Desalination 35:129-147.
Hajipour M, M Soltanieh, and M Yazdanshenas. 2010. “Investigation of membrane fouling in cross flow microfiltration of non-alcoholic beer and modeling of tubular membrane flow.” Desalination 251:20–28.
Hallen RT, KP Brooks, and LK Jagoda. 2000a. Demonstration of Entrained Solids and Sr/TRU Removal Processes with Archived AN-107 Waste. PNWD-3033, Pacific Northwest National Laboratory, Richland, Washington.
Hallen RT, PR Bredt, KP Brooks, and LK Jagoda. 2000b. Combined Entrained Solids and Sr/TRU Removal from AN-107 Diluted Feed. PNWD-3035, Pacific Northwest National Laboratory, Richland, Washington.

7.4
Hallen RT, JGH Geeting, DR Jackson, and DR Weier. 2003. Combined entrained solids and Sr/TRU removal from AN-102 waste blended with C-104 sludge pretreatment solutions. PNWD-3264 R1, Pacific Northwest National Laboratory, Richland, Washington.
Hermia J. 1981. “Constant Pressure Blocking Filtration Laws – Application to Power-Law Non-Newtonian Fluids.” Transactions of the Institution of Chemicals Engineers 59(1):183-187.
Ho CC and AL Zydney. 2000. “A combined pore blockage and cake filtration model for protein fouling during microfiltration.” Journal of Colloid and Interface Science 232:389–399.
Holdich RG, IW Cumming, and B Ismail. 1996. “Crossflow microfiltration for mineral suspension thickening and washing.” Minerals Engineering 9(2):243–257.
Hughes D, UK Tirlapur, R Field, and Z Cui. 2006. “In situ 3D characterization of membrane fouling by yeast suspensions using two-photon femtosecond near infrared non-linear optical imaging.” Journal of Membrane Science 280:124–133.
Huisman IH, G Tragardh, C Tragardh, A Pihlajamaki. 1998. “Determining the zeta-potential of ceramic microfiltration membranes using the electroviscous effect.” Journal of Membrane Science 147:187–194.
Huisman IH, G Tragardh, C Tragardh. 1999a. “Particle transport in crossflow microfiltration—II. Effects of particle-particle interactions.” Chemical Engineering Science 54:281–289.
Huisman IH, E Vellenga, G Tragardh, and C Tragardh. 1999b. “The influence of the membrane zeta potential on the critical flux for crossflow microfiltration of particle suspensions.” Journal of Membrane Science 156:153–158.
Huisman IH, P Pradanos, A Hernandez. 2000. “The effect of protein–protein and protein–membrane interactions on membrane fouling in ultrafiltration.” Journal of Membrane Science 179:79–90.
Jiao D and MM Sharma. 1994. “Mechanism of cake buildup in cross-flow filtration of colloidal suspensions.” Journal of Colloid and Interface Science 162:454–462.
Kim J and FA DiGiano. 2009. “Fouling models for low-pressure membrane systems.” Separation and Purification Technology 68:293–304.
Kim M and AL Zydney. 2005. “Particle–particle interactions during normal flow filtration: Model simulations.” Chemical Engineering Science 60:4073–4082.
Kim M and AL Zydney. 2006. “Theoretical analysis of particle trajectories and sieving in a two-dimensional cross-flow filtration system.” Journal of Membrane Science 281:666–675.
Kim JS, S Akeprathumchai, SR Wickramasinghe. 2001. “Flocculation to enhance microfiltration.” Journal of Membrane Science 182:161–172.
Knutsen JS and RH Davis. 2006. “Deposition of foulant particles during tangential flow filtration.” Journal of Membrane Science 271:101–113.

7.5
Kosvintsev S, RG Holdich, IW Cumming, and VM Starov. 2002. “Modeling of dead-end microfiltration with pore blocking and cake formation.” Journal of Membrane Science 208:181–192.
Kurath DE, BD Hanson, MJ Minette, DL Baldwin, BM Rapko, LA Mahoney, PP Schonewill, RC Daniel, PW Eslinger, JL Huckaby, JM Billing, PS Sundar, GB Josephson, JJ Toth, ST Yokuda, EBK Baer, SM Barnes, EC Golovich, SD Rassat, CF Brown, JGH Geeting, GJ Sevigny, AJ Casella, JR Bontha, RL Aaberg, PM Aker, CE Guzman-Leong, ML Kimura, SK Sundaram, RP Pires, BE Wells, and OP Bredt. 2009. Pretreatment Engineering Platform Phase 1 Final Test Report. PNNL-18894; WTP-RPT-197 Rev 0, Pacific Northwest National Laboratory, Richland, Washington.
Lamminen MO, HW Walker, and LK Weavers. 2006. “Effect of Fouling Conditions and Cake Layer Structure on the Ultrasonic Cleaning of Ceramic Membranes.” Separation Science and Technology 41:3569–3584.
Lawrence ND, JM Perera, M Iyer, MW Hickey, and GW Stevens. 2006. “The use of streaming potential measurements to study the fouling and cleaning of ultrafiltration membranes.” Separation and Purification Technology 48:106–112.
Levesley JA and M Hoare. 1999. “The effect of high frequency backflushing on the microfiltration of yeast homogenate suspensions for the recovery of soluble proteins.” Journal of Membrane Science 158:29–39.
Lumetta GJ, EC Buck, RC Daniel, K Draper, MK Edwards, SK Fiskum, RT Hallen, LK Jagoda, ED Jenson, AE Kozelisky, PJ MacFarlan, RA Peterson, RW Shimskey, SI Sinkov, and LA Snow. 2009. Characterization, Leaching, and Filtration Testing for Bismuth Phosphate Sludge (Group 1) and Bismuth Phosphate Saltcake (Group 2) Actual Waste Sample Composites. PNNL-17992, Pacific Northwest National Laboratory, Richland, Washington.
Madeline JB, M Meireles, C Bourgerette, R Botet, R Schweins, and B Cabane. 2007. “Restructuring of colloidal cakes during dewatering.” Langmuir 23:1645–1658.
Martinez F, A Martin, J Malfeito, L Palacio, P Pradanos, F Tejerina, A Hernandez. 2002. “Streaming potential through and on ultrafiltration membranes: Influence of salt retention.” Journal of Membrane Science 206:431–441.
McCarthy AA, PK Walsh, and G Foley. 2002. “Characterising the packing and dead-end filter cake compressibility of the polymorphic yeast Kluyveromyces marxianus var. marxianus NRRLy2415.” Journal of Membrane Science 198:87–94.
McDonogh RM, AG Fane, and CJD Fell. 1989. “Charge effects in the cross-flow filtration of colloids and particulates.” Journal of Membrane Science 43:69–85.
Michaels AS. 1968. “New separation technique for the CPI.” Chemical Engineering Progress 64(12):31ff.
Nystrom M, M Lindstrom, and E Matthiasson. 1989. “Streaming Potential as a Tool in the Characterization of Ultrafiltration Membranes.” Colloids and Surfaces 36:297–312.

7.6
Ognier S, C Wisniewski, and A Grasmick. 2002. “Characterisation and modelling of fouling in membrane bioreactors.” Desalination 146:141–147.
Ould-Dris A, MY Jaffrin, D Si-Hassen, and Y Neggaz. 2000. “Effect of cake thickness and particle polydispersity on prediction of permeate flux in microfiltration of particulate suspensions by a hydrodynamic diffusion model.” Journal of Membrane Science 164:211–227.
Peng H and AY Tremblay. 2008. “Membrane regeneration and filtration modeling in treating oily wastewaters.” Journal of Membrane Science 324:59–66.
Peterson R, J Geeting, and R Daniel. 2007. “Estimation of ultrafilter performance based on characterization data.” Chemical Engineering and Technology 30(8):1050–1054.
Poirier M, P Burket, and J Siler. 2003. Filtration, Washing, and Leaching of a Hanford AY-102/C-106 Sample. WSRC-TR02003-00240, Westinghouse Savannah River Company, South Carolina.
Porter MC. 1972. “Concentration Polarization with Membrane Ultrafiltration.” Industrial and Engineering Chemistry Product Research and Development 11(3):234–248.
Ripperger S and J Altmann. 2002. “Crossflow microfiltration: State of the art.” Separation and Purification Technology 26:19–31.
Rubow KL and S Jha. 1999. “Sintered Metal Microfiltation Media.” Presented at the Seventeenth Annual Membrane Technology/Separations Planning Conference, Newton, Massachusetts.
Russell R, J Billing, H Smith, and R Peterson. 2009a. “Validation of ultrafilter performance model based on systematic simulant evaluation.” Industrial and Engineering Chemistry Research 48(22):10077-10086.
Russell RL, DE Rinehart, JM Billing, HD Smith and RA Peterson. 2009b. Development and Demonstration of Ultrafiltration Simulants. PNL-18090 (WTP-RPT-183, Rev 0), Pacific Northwest National Laboratory, Richland, Washington.
Sethi S and MR Wiesner. 1997. “Modeling of transient permeate flux in cross-flow membrane filtration incorporating multiple particle transport mechanisms.” Journal of Membrane Science 136:191–205.
Shimskey RW, JM Billing, EC Buck, RC Daniel, KE Draper, MK Edwards, JGH Geeting, RT Hallen, ED Jenson, AE Kozelisky, PJ MacFarlan, RA Peterson, LA Snow, and RG Swoboda. 2009a. Filtration and Leach Testing for REDOX Sludge and S-Saltcake Actual Waste Sample Composites. PNNL-17965, Pacific Northwest National Laboratory, Richland, Washington.
Shimskey RW, RC Daniel, AE Kozelisky, JM Billing, K Draper, PJ MacFarlan, EC Buck, MK Edwards, RA Peterson, AJ Casella, RT Hallen, RG Swoboda, and JV Crum. 2009b. Filtration and Leach Testing for PUREX Cladding Sludge and REDOX Cladding Sludge Actual Waste Sample Composites. PNNL-18048, Pacific Northwest National Laboratory, Richland, Washington.
Smidova D, P Mikulasek, RJ Wakeman, and P Velikovska. 2004. “Influence of ionic strength and pH of dispersed systems on microfiltration.” Desalination 163:323-332.

7.7
Sondhi R, YS Lin, and F Alvarez. 2000. “Crossflow filtration of chromium hydroxide suspension by ceramic membranes: fouling and its minimization by backpulsing.” Journal of Membrane Science 174:111–122.
Sondhi R, YS Lin, and F Alvarez. 2000. “Crossflow filtration of chromium hydroxide suspension by ceramic membranes: fouling and its minimization by backpulsing.” Journal of Membrane Science 174: 111–122.
Song L. 1998. “Flux decline in crossflow microfiltration and ultrafiltration: mechanisms and modeling of membrane fouling.” Journal of Membrane Science 139:183–200.
Srijaroonrat P, E Julien, and Y Aurelle. 1999. “Unstable secondary oil/water emulsion treatment using ultrafiltration: fouling control by backflushing.” Journal of Membrane Science 159:11-20.
Taylor G. 1954. “The dispersion of matter in turbulent flow through a pipe.” Proceedings of the Royal Society, Series A 223:446, London, U.K.
Vadi PK and SSH Rizvi. 2001. “Experimental evaluation of a uniform transmembrane pressure crossflow microfiltration unit for the concentration of micellar casein from skim milk.” Journal of Membrane Science 189:69–82.
Velikovsk P and P Mikulasek. 2007. “The influence of Cl-, SO42- and PO4
3- ions on the ζ-potential and microfiltration of titanium dioxide dispersions.” Separation and Purification Technology 58:295–298.
Waite TD, AI Schafer, AG Fane, and A Heuer. 1999. “Colloidal fouling of ultrafiltration membranes: Impact of aggregate structure and size.” Journal of Colloid and Interface Science 212:264–274.
Wang L and L Song. 1999. “Flux decline in crossflow microfiltration and ultrafiltration: experimental verification of fouling dynamics.” Journal of Membrane Science 160:41–50.
Wells BE, MA Knight, EC Buck, RC Daniel, SK Cooley, LA Mahoney, PA Meyer, AP Poloski, JM Tingey, WS Callaway, GA Cooke, ME Johnson, MG Thien, DJ Washenfelder, JJ Davis, MN Hall, G Smith, SL Thomson, and Y Onishi. 2007. Estimate of Hanford Waste Insoluble Solid Particle Size and Density Distribution. PNWD-3824, Battelle—Pacific Northwest Division, Richland, Washington.
Welsch K, RM McDonogh, AG Fane, and CJD Fell. 1995. “Calculation of limiting fluxes in the ultrafiltration of colloids and fine particulates.” Journal of Membrane Science 99:229-239.
Yuan Y and JE Kilduff. 2010. “Effect of colloids on salt transport in crossflow nanofiltration.” Journal of Membrane Science 346:240–249.
Zhao Y, Y Zhang, W Xing, and N Xu. 2005a. “Influences of pH and ionic strength on ceramic microfiltration of TiO2 suspensions.” Desalination 177:59-68.
Zhao Y, W Xing, N Xu, and FS Wong. 2005b. “Effects of inorganic salt on ceramic membrane microfiltration of titanium dioxide suspension.” Journal of Membrane Science 254:81–88.

7.8
Zydney AL and CK Colton. 1986. “A concentration polarization model for the filtrate flux in cross-flow microfiltration of particulate suspensions.” Chemical Engineering Communications 47:1–21.

A.1
Appendix A:
Index of Articles Examined by the Literature Review


A.3
Index of Articles Examined By the Literature Review
PNNL/ Journal File Name/Hyperlink Reference Brief Summary
PNNL BNFL-RPT-002/PNWD-3000
KP Brooks, PR Bredt, GR Golcar, SA Hartley, MW Urie, JM Tingey, KG Rappe, and LK Jagoda. 1999. Ultrafiltration and Characterization of AW-101 Supernatant and Entrained Solids. PNWD-3000, Pacific Northwest National Laboratory, Richland, Washington.
Report summarizes filtration testing performed with cold simulant and actual waste samples from Hanford tank AW-101. The filter used was a Mott 0.1-micron-rated stainless steel cell unit filter (CUF) with a 3/8 inch ID and 2 feet in length. After initial performance checks with an AW-101 cold simulant, a filter testing system with the Mott filter was placed in the hot cells. The testing system performed filtration matrix tests varying TMP and axial velocity (AV) at low undissolved solids (UDS) concentration. The AW-101 waste sample was then concentrated, and further filtration tests were performed afterwards at higher UDS concentrations. The filter was then soaked overnight in 1 M nitric acid, and its clean water flux was verified afterwards.
PNNL BNFL-RPT-026/PNWD-3033
RT Hallen, KP Brooks, and LK Jagoda. 2000a. Demonstration of Entrained Solids and Sr/TRU Removal Processes with Archived AN-107 Waste. PNWD-3033, Pacific Northwest National Laboratory, Richland, Washington.
Report summarizes filtration testing performed on HLW waste samples from Hanford tank AN-107. The filter used was a Mott 0.1–micron-rated stainless steel CUF with a 3/8 inch ID and 2 feet in length. Initial filtration of sample proved difficult with flux below 0.01 GPM/ft2. Slurry was blended with Sr/transuranic (TRU) precipitate, which improved initial flux by tenfold, but saw a 55% decrease in flux over an 8.5-hour period. Clean water flux measurements afterwards should a significant decrease in the flux, indicating fouling and a need for acid cleaning.
PNNL BNFL-RPT-027/PNWD-3035
RT Hallen, PR Bredt, KP Brooks, and LK Jagoda. 2000b. Combined Entrained Solids and Sr/TRU Removal from AN-107 Diluted Feed. PNWD-3035, Pacific Northwest National Laboratory, Richland, Washington.
Report summarizes filtration testing performed on HLW waste samples from Hanford tank AN-107 blended with Sr/TRU precipitates. The filter used was a Mott 0.1-micron-rated stainless steel CUF with a 3/8 inch ID and 2 feet in length. Initial testing was performed with archived samples from previous testing in BNFL-RPT-026. Slurry was more dilute than that in original testing and showed a filter flux decrease from 0.030 to 0.008 GPM/ft2 over 5 hours. Filter was cleaned and new slurry added to the filter skid with a UDS of 1.7 wt% of the Sr/TRU precipitate and AN-107 permeate. Frequent backpulsing was used to maintain filter flux, but the flux still decreased over time. Filter cleaned using 1 M nitric acid with 0.1 M citric acid.
A.3

A.4
Index of Articles Examined By the Literature Review
PNNL/ Journal File Name/Hyperlink Reference Brief Summary
PNNL BNFL-RPT-030/PNWD-3024
KP Brooks, LK Jagoda, PR Bredt, KG Rappe, GR Golcar, MW Urie, and SA Hartley. 2000. Characterization, Washing, Leaching, and Filtration of C-104 Sludge. PNWD-3024, Pacific Northwest National Laboratory, Richland, Washington.
Report summarizes filtration testing performed on HLW waste samples from Hanford tank C-104. The filter used was a Mott 0.1-micron-rated stainless steel CUF with a 3/8 inch ID and 2 feet in length. HLW sample was placed into filtration test system at a UDS of 6.9 wt%, and a filtration test matrix was performed. The slurry was later dewatered to a UDS concentration of 23 wt%, and the test matrix was repeated. Slurry washed with inhibited water (IW), and then caustic leached. IW used to wash slurry afterwards. Cleaned with 1 M nitric acid twice. Decay in flux observed over time throughout testing.
PNNL PNNL-11652 JGH Geeting and BA Reynolds. 1997. Bench-Scale Cross Flow Filtration of Tank C-106, C-107, B-110, and U-110 Sludge Slurries. PNNL-11652, Pacific Northwest National Laboratory, Richland, Washington.
Report summarizes filtration testing performed on HLW waste samples from Hanford tanks C-106, C-107, B-110, and U-110. Two filters were evaluated: 1) 6-in.-long stainless steel 0.5-micron-rated Mott filter with 0.475-in. diameter and 2) 6-in.-long stainless steel 0.1–micron-rated Graver filter with 0.5-in. diameter and a TiO2 coating. Comparisons of the performance of the two filters were done at three different concentrations.
PNNL PNNL-11376 JGH Geeting and BA Reynolds. 1996. Bench-Scale Cross Flow Filtration of Tank S-107 Sludge Slurries and Tank C-107 Supernatant. PNNL-11376, Pacific Northwest National Laboratory, Richland, Washington.
Report summarizes filtration testing performed on HLW waste slurry samples from Hanford tanks S-107 and supernate samples from tank C-107, as well as cold simulants for these wastes. A 6-in.-long stainless steel 0.5-micron-rated Mott filter with 0.475-in. diameter was used for the testing. Fouling rates were evaluated for S-107 slurries at three concentrations (8 wt%, 1.5 wt%, and 0.5 wt%). Fouling rates of real waste samples were the higher than simulants at the lower end of UDS concentrations. Over the course of the testing, a reduction of over 66% was seen for the real waste samples and was the same rate for all concentrations. The simulant at 0.5 wt% was 3 to 5× higher and did not exhibit the same fouling rate. Fouling was also seen on filtering only the C-107 supernate samples. Cleaning with 2-wt% oxalic acid was done, and the improved clean water flux was better than the initial measurements.
A.4

A.5
Index of Articles Examined By the Literature Review
PNNL/ Journal File Name/Hyperlink Reference Brief Summary
PNNL BNFL-RPT-033/PNWD-3042
GR Golcar, KP Brooks, JG Darab, JM Davis, and LK Jagoda. 2000. Development of Inactive High Level Waste Envelope D Simulants for Scaled Crossflow Filtration Testing. PNWD-3042, Pacific Northwest National Laboratory, Richland, Washington.
Report summarizes filtration testing performed on HLW simulant samples for Hanford tanks C-106, AZ-101/102. A 6-in.-long stainless steel 0.5-micron-rated Mott filter with 0.475-in. diameter. The C-106 simulant showed similar initial filter flux behavior to actual waste, but did not foul the filter in a similar fashion. The AZ101/102 simulant had initially higher filter fluxes than the actual waste tests, but fouled at a similar rate to the actual waste.
PNNL BNFL-RPT-038/PNWD-3045
KP Brooks, PR Bredt, SK Cooley, GR Golcar, LK Jagoda, KG Rappe and MW Urie. 2000. Characterization, Washing, Leaching, and Filtration of AZ-102 Sludge. PNWD-3045, Pacific Northwest National Laboratory, Richland, Washington.
Report summarizes filtration testing performed on HLW waste samples from Hanford tank AZ-102. A 2-ft-long stainless steel 0.1–micron-rated Mott filter with 0.375-in. diameter was used. Fouling of the filter was experienced during testing, and cleaning afterwards with 1 M nitric acid did not restore the clean water flux of the filter to the pre-test condition.
PNNL WTP-RPT-019/PNWD-3216
GR Golcar. 2002. Performance of Tubular Porous Metal Crossflow Filters. PNWD-3216, Pacific Northwest National Laboratory, Richland, Washington.
Related to PNWD-3024, the report summarizes filtration testing performed on HLW simulant samples for Hanford tanks C-106 and AZ-101/102. However, the simulant behavior was also compared to a 0.1-micron-rated Mott filter and a 0.1-micron-rated Graver filter with a TiO2 coating. Performance of the filters found that the 0.1-micron filters performed better than the 0.5-micron filters and fouled at a slower rate.
PNNL WTP-RPT-043 Rev1/PNWD-3206 R1
JGH Geeting, RT Hallen, LK Jagoda, AP Poloski, RD Scheele, and DR Weier. 2003a. Filtration, Washing, and Caustic Leaching of Hanford Tank AZ-101 Sludge. PNWD-3206 R1, Pacific Northwest National Laboratory, Richland, Washington.
Report summarizes filtration testing performed on HLW waste samples from Hanford tank AZ-101. A 2-ft-long stainless steel 0.1-micron-rated Mott filter with 0.375-in. diameter was used. Test matrixes varying TMP and AV were performed at varying UDS concentrations, and the slurry was later washed and caustic leached to evaluate filter performance under WTP conditions. A decrease in filter flux during the test was observed. After the slurry was removed, the level of irreversible fouling was evaluated by clean water measurements and with a SrCO3 slurry. Filter later was cleaned with 2 M nitric acid but did not restore filter condition to original clean water flux measurement. However, the SrCO3 slurry filter flux was closer, indicating the sensitivity of clean water flux testing.
A.5

A.6
Index of Articles Examined By the Literature Review
PNNL/ Journal File Name/Hyperlink Reference Brief Summary
PNNL WTP-RPT-044 Rev1/PNWD-3264 R1
RT Hallen, JGH Geeting, DR Jackson, and DR Weier. 2003. Combined entrained solids and Sr/TRU removal from AN-102 waste blended with C-104 sludge pretreatment solutions. PNWD-3264 R1, Pacific Northwest National Laboratory, Richland, Washington.
Report summarizes filtration testing performed on a treated HLW sample blend from Hanford tanks AN-102/C-104 with Sr/TRU precipitate (1.4 wt% UDS, 3.5 cP). Two different grades of stainless steel, 0.1-micron-rated, Mott filter were evaluated: industrial and high-purity. The geometry for both was identical: 2 feet long with 0.375-in. inside diameter. Filter matrix tests of 13 different AVs and TMPs were performed on both filter as well as clean water flux testing before and after. Significant decreases in the overall filter flux that occurred during the matrix tests indicated that fouling was occurring. Comparison of the filter grades showed higher permeability with the industrial grade, but the fouling rate may be higher.
PNNL WTP-RPT-060/PNWD-3258
JGH Geeting, RT Hallen, DR Weier, and CF Wend. 2003. Filtration of Envelope C Waste Simulant Treated by the Sr/TRU Precipitation Process. PNWD-3258, Pacific Northwest National Laboratory, Richland, Washington.
Report summarizes filtration testing performed on a HLW simulant waste sample blend representing Hanford tanks AN-102/C-104. Two different grades of stainless steel 0.1-micron-rated Mott filters were evaluated: industrial and high-purity. The geometry for both was identical: 2 feet long with 0.375-in. inside diameter. Each filter was evaluated for filtration performance at a TMP of 40 psid and an AV of 11 ft/sec at two different UDS concentrations: 0.8 wt% and 2.7 wt%. Fouling was not as great as that found in WTP-RPT-044 and was believed related to the particle-size distribution of the slurry. Unlike the actual waste testing in WTP-RPT-044, the industrial grade performed lower that the high-purity filters. However, a proximate cause for this was not inferred.
A.6

A.7
Index of Articles Examined By the Literature Review
PNNL/ Journal File Name/Hyperlink Reference Brief Summary
PNNL WTP-RPT-166/PNNL-17992
GJ Lumetta, EC Buck, RC Daniel, K Draper, MK Edwards, SK Fiskum, RT Hallen, LK Jagoda, ED Jenson, AE Kozelisky, PJ MacFarlan, RA Peterson, RW Shimskey, SI Sinkov, and LA Snow. 2009. Characterization, Leaching, and Filtration Testing for Bismuth Phosphate Sludge (Group 1) and Bismuth Phosphate Saltcake (Group 2) Actual Waste Sample Composites. PNNL-17992, Pacific Northwest National Laboratory, Richland, Washington.
Report summarizes HLW composites representing bismuth phosphate sludge and bismuth phosphate salt cake wastes. A blend of these wastes was filtered and chemically leached (caustic and oxidatively) to demonstrate the Pretreatment Plant (PTP) operations for this waste type. The filtration was performed using 2-ft-long, 0.1-micron-rated, Mott filter with 0.5-in. inside diameter. Filtration test matrixes were performed throughout the test while dewatering and washing was performed at a TMP of 40 psid and AV of 13 ft/sec. Clean water flux testing was used to evaluate the filter condition before and after the text as well as the effectiveness of 2 M nitric acid as a cleaning solution. Oxalic acid cleaning was also performed at the end of this test as well. Overall, a significant improvement in the clean water flux was measured after the oxalic acid cleaning.
PNNL WTP-RPT-168/PNNL-18117
RC Daniel, JM Billing, ML Luna, KJ Cantrell, RA Peterson, ML Bonebrake, RW Shimskey, and LK Jagoda. 2009. Characterization of Filtration Scale-Up Performance. PNNL-18117, Pacific Northwest National Laboratory, Richland, Washington.
Report evaluated the impacts on filter length and temperature using preliminary simulant being developed for PEP to verify whether temperature corrections used for temperature were correct and whether there were no scaling issues involved by increasing the length of the filters from 2 to 8 feet, which may impact scaling factors for the PTP. Overall, no scaling issues were found by increasing the length, and past temperature correlations for permeate flux were accurate.
PNNL WTP-RPT-169/PNNL-18119
MK Edwards, JM Billing, DL Blanchard, Jr, EC Buck, AJ Casella, AM Casella, JV Crum, RC Daniel, KE Draper, SK Fiskum, LK Jagoda, ED Jenson, AE Kozelisky, PJ MacFarlan, RA Peterson, RW Shimskey, LA Snow, and RG Swoboda. 2009. Characterization, Leaching, and Filtration Testing for Tributyl Phosphate (TBP, Group 7) Actual Waste Sample Composites. PNNL-18119, Pacific Northwest National Laboratory, Richland, Washington.
Report summarizes HLW composites representing tri-butyl phosphate wastes. This waste was blended with an archive sample from HLW tank AY-102 to have enough material to process in the filter skid. The blend was filtered and caustically leached to demonstrate the PTP operations for this waste type. Filtration was performed using 2–ft-long, 0.1-micron-rated Mott filter with 0.5-in. inside diameter. Filtration test matrixes were performed throughout the test while dewatering and washing was performed at a TMP of 40 psid and AV of 13 ft/sec. Clean water flux testing was used to evaluate the filter condition before and after the text, as well as the effectiveness of 2 M nitric acid as a cleaning solution. Oxalic acid cleaning was also performed at the end of this test as well.
A.7

A.8
Index of Articles Examined By the Literature Review
PNNL/ Journal File Name/Hyperlink Reference Brief Summary
PNNL WTP-RPT-170/PNNL-18120
SK Fiskum, JM Billing, JV Crum, RC Daniel, MK Edwards, RW Shimskey, RA Peterson, PJ MacFarlan, EC Buck, KE Draper, and AE Kozelisky. 2009. Characterization, Leaching, and Filtrations Testing of Ferrocyanide Tank sludge (Group 8) Actual Waste Composite. PNNL-18120, Pacific Northwest National Laboratory, Richland, Washington.
Report summarizes HLW composites representing Ferrocyanide wastes. The waste composite was filtered and caustically leached to demonstrate the PTP operations for this waste type. Filtration was performed using 2-ft-long, 0.1-micron-rated Mott filter with 0.5-in. inside diameter. Filtration test matrixes were performed throughout the test while dewatering and washing was performed at a TMP of 40 psid and AV of 13 ft/sec. Clean water flux testing was used to evaluate the filter condition before and after the test as well as the effectiveness of 2 M nitric acid as a cleaning solution. Oxalic acid cleaning was also performed at the end of this test as well.
PNNL WTP-RPT-172/PNNL-17965
RW Shimskey, JM Billing, EC Buck, RC Daniel, KE Draper, MK Edwards, JGH Geeting, RT Hallen, ED Jenson, AE Kozelisky, PJ MacFarlan, RA Peterson, LA Snow, and RG Swoboda. 2009a. Filtration and Leach Testing for REDOX Sludge and S-Saltcake Actual Waste Sample Composites. PNNL-17965, Pacific Northwest National Laboratory, Richland, Washington.
Report summarizes HLW composites representing REDOX sludge and S-Salt Cake wastes. Two composite solutions were tested: a homogenized REDOX Sludge composite sample and a blend of S-Salt Cake mixed with REDOX sludge. The two waste mixtures were individually filtered and chemically leached to demonstrate the PTP operations for this waste type. Filtration was performed using 2–ft-long, 0.1-micron-rated Mott filter with 0.5-in. inside diameter. Filtration test matrixes were performed throughout the test while dewatering and washing was performed at a TMP of 40 psid and AV of 13 ft/sec. Clean water flux testing was used to evaluate the filter condition before and after the text as well as the effectiveness of 2 M nitric acid as a cleaning solution.
PNNL WTP-RPT-181/PNNL-18048
RW Shimskey, RC Daniel, AE Kozelisky, JM Billing, K Draper, PJ MacFarlan, EC Buck, MK Edwards, RA Peterson, AJ Casella, RT Hallen, RG Swoboda, and JV Crum. 2009b. Filtration and Leach Testing for PUREX Cladding Sludge and REDOX Cladding Sludge Actual Waste Sample Composites. PNNL-18048, Pacific Northwest National Laboratory, Richland, Washington.
Report summarizes HLW composites representing PUREX cladding and REDOX cladding wastes. A composite blend of both waste types was filtered and chemically leached to demonstrate the PTP operations for this waste type. Filtration was performed using 2-ft-long, 0.1-micron-rated Mott filter with 0.5-in. inside diameter. Filtration test matrixes were performed throughout the test while dewatering and washing were performed at a TMP of 40 psid and AV of 13 ft/sec. Clean water flux testing was used to evaluate the filter condition before and after the test as well as the effectiveness of 2 M nitric acid as a cleaning solution. Oxalic acid cleaning was also performed at the end of this test as well.
A.8

A.9
Index of Articles Examined By the Literature Review
PNNL/ Journal File Name/Hyperlink Reference Brief Summary
PNNL WTP-RPT-183/PNNL-18090
RL Russell, DE Rinehart, JM Billing, HD Smith and RA Peterson. 2009b. Development and Demonstration of Ultrafiltration Simulants. PNL-18090 (WTP-RPT-183, Rev 0), Pacific Northwest National Laboratory, Richland, Washington.
This report documents the results of the filtration simulant development completed in FY08 for WTP-BNI under the M-12 task. Using a CUF system with a 2-ft-long filter element, simulant evaluation was performed under two test plans, TP-RPP-WTP-469 (Russell, Smith) and TP-RPP-WTP-509 (Daniel and Shimskey). Much of this work was a precursor to support testing for PEP. The following was discussed in this report: 1) High solids filtration performance with simulants 2) Evaluation of filtration screen methods (e.g., centrifugal solids) 3) Fouling impacts from inert fines 4) Blending Simulant Performance Data (boehmite, gibbsite, etc.).
PNNL WTP-RPT-185 Rev 1/PNNL-18498 Rev 1
RC Daniel, JM Billing, JR Bontha, CF Brown, PW Eslinger, BD Hanson, JL Huckaby, NK Karri, ML Kimura, DE Kurath, and MJ Minette. 2010. EFRT M-12 Issue Resolution: Comparison of Filter Performance at PEP and CUF Scale. PNNL-18498 Rev 1; WTP-RPT-185 Rev 1, Pacific Northwest National Laboratory, Richland, Washington.
This report evaluated the parallel testing performed between a bench top filtration system with a 2-ft, 0.1-micron Mott filtration element and the five filtration bundles used at PEP. Overall, the filtration behavior was shown to be scalable between the two systems. However, unusual fouling behavior was observed in the PEP filtration bundles that occurred during back pulsing. While the mechanism was not clear, it was suspected that the reason for the behavior was that the filter bundles were plumbed in series. Also, a comparison of cleaning methods showed that 0.5 M oxalic acid performed better than 2 M nitric acid when using clean water flux measurements as the basis for cleanliness.
A.9

A.10
Index of Articles Examined By the Literature Review
PNNL/ Journal File Name/Hyperlink Reference Brief Summary
PNNL WTP-RPT-197/PNNL-18894
DE Kurath, BD Hanson, MJ Minette, DL Baldwin, BM Rapko, LA Mahoney, PP Schonewill, RC Daniel, PW Eslinger, JL Huckaby, JM Billing, PS Sundar, GB Josephson, JJ Toth, ST Yokuda, EBK Baer, SM Barnes, EC Golovich, SD Rassat, CF Brown, JGH Geeting, GJ Sevigny, AJ Casella, JR Bontha, RL Aaberg, PM Aker, CE Guzman-Leong, ML Kimura, SK Sundaram, RP Pires, BE Wells, and OP Bredt. 2009. Pretreatment Engineering Platform Phase 1 Final Test Report. PNNL-18894; WTP-RPT-197 Rev 0, Pacific Northwest National Laboratory, Richland, Washington.
This is a summary report of all of the testing performed at PEP, including filtration testing results.
PNNL WTP-RPT-203/PNNL-18673
JM Billing, RC Daniel, DE Kurath, and RA Peterson. 2009. Bench-Scale Filtration Testing in Support of the Pretreatment Engineering Platform (PEP). PNNL-18673, Pacific Northwest National Laboratory, Richland, Washington.
This is a summary report of all of the bench-scale filtration testing performed in parallel with PEP.
Journal “Huisman et al (1999) -
membrane zeta potential.pdf”
IH Huisman, E Vellenga, G Tragardh, and C Tragardh. 1999. “The influence of the membrane zeta potential on the critical flux for crossflow microfiltration of particle suspensions.” Journal of Membrane Science 156:153–158.
The impact of the filter membrane zeta potential on the critical (minimum) flux for fouling when filtering a suspension of silica particles on ceramic membranes of three different materials (titania, zirconia, and alumina) was investigated. Two different solution pHs were examined. Neither the zeta potential of the membrane nor that of the particles influenced the observed critical flux; however, the critical flux was observed to increase with increasing wall shear stress (i.e., at higher axial velocities) and decrease with increasing particle concentration.

A.11
Index of Articles Examined By the Literature Review
PNNL/ Journal File Name/Hyperlink Reference Brief Summary
Journal “Huisman et al (1999).pdf” IH Huisman, G Tragardh, and C Tragardh. 1999. “Particle transport in crossflow microfiltration -- II. Effects of particle-particle interactions.” Chemical Engineering Science 54:281–289.
This paper extends a model for calculating limiting (pressure independent) the filter flux for crossflow microfiltration of non-interacting particles to include the effect of physico-chemical particle-particle interactions governed by zeta potential and suspending phase salt concentration (i.e., charge effects). The authors claim that the revised model, when applied to crossflow filtration of silica particle suspensions on ceramic (alumina and titania) membranes, shows good agreement with experimental data and captures the influence of wall shear stress, membrane length, particle size, and particle concentration, but quantitatively underpredicted the impact of the particle surface potential on flux.
Journal “McDonogh et al. (1989).pdf”
RM McDonogh, AG Fane, and CJD Fell. 1989. “Charge effects in the cross-flow filtration of colloids and particulates.” Journal of Membrane Science 43:69–85.
This paper presents limiting (pressure independent) fluxes for the filtration of a colloidal silica suspension on a Millipore PTGC0LC05 (likely a PTGC polysulfone disk with a MW cutoff of 10,000 Da) membrane. The experimentally observed enhanced back transport of particles from the membrane is attributed to colloidal charge interactions in the film layer for particles less than 1 m in size. The film model is modified to account for these interactions, and the authors claim good experimental agreement between measured flux results and the modified model for silica particles ranging in size from 0.01 to 0.2 m.
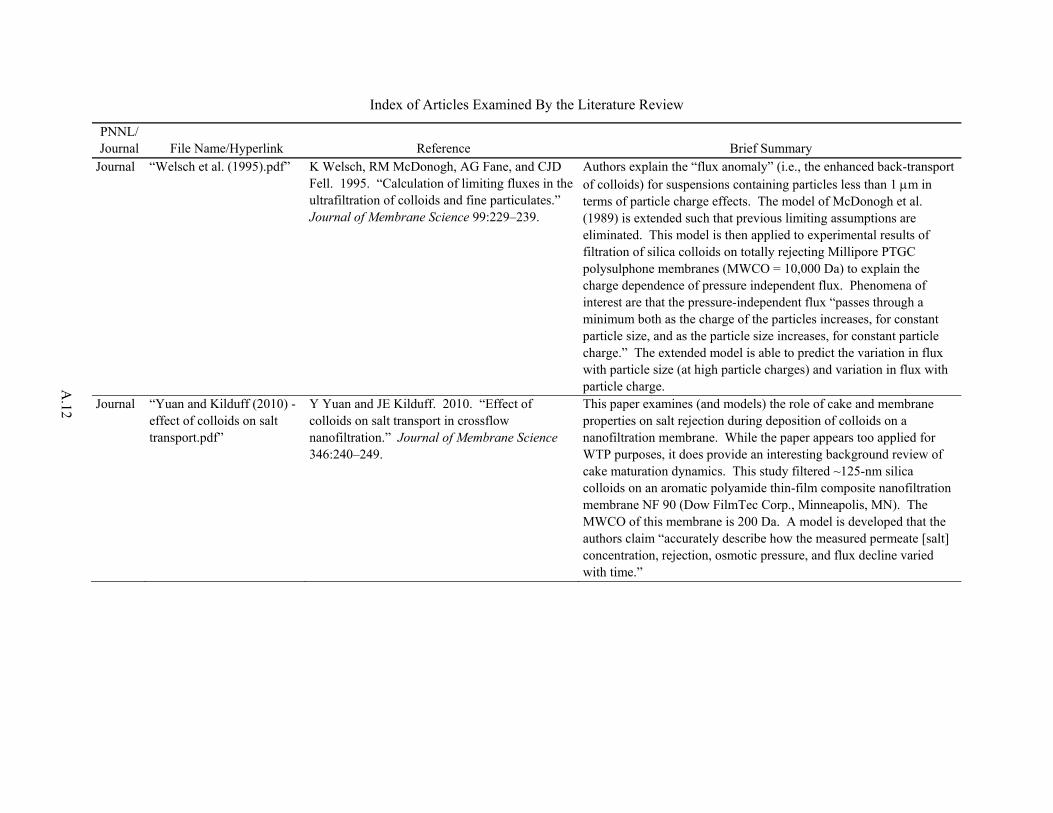
A.12
Index of Articles Examined By the Literature Review
PNNL/ Journal File Name/Hyperlink Reference Brief Summary
Journal “Welsch et al. (1995).pdf” K Welsch, RM McDonogh, AG Fane, and CJD Fell. 1995. “Calculation of limiting fluxes in the ultrafiltration of colloids and fine particulates.” Journal of Membrane Science 99:229–239.
Authors explain the “flux anomaly” (i.e., the enhanced back-transport of colloids) for suspensions containing particles less than 1 m in terms of particle charge effects. The model of McDonogh et al. (1989) is extended such that previous limiting assumptions are eliminated. This model is then applied to experimental results of filtration of silica colloids on totally rejecting Millipore PTGC polysulphone membranes (MWCO = 10,000 Da) to explain the charge dependence of pressure independent flux. Phenomena of interest are that the pressure-independent flux “passes through a minimum both as the charge of the particles increases, for constant particle size, and as the particle size increases, for constant particle charge.” The extended model is able to predict the variation in flux with particle size (at high particle charges) and variation in flux with particle charge.
Journal “Yuan and Kilduff (2010) - effect of colloids on salt transport.pdf”
Y Yuan and JE Kilduff. 2010. “Effect of colloids on salt transport in crossflow nanofiltration.” Journal of Membrane Science 346:240–249.
This paper examines (and models) the role of cake and membrane properties on salt rejection during deposition of colloids on a nanofiltration membrane. While the paper appears too applied for WTP purposes, it does provide an interesting background review of cake maturation dynamics. This study filtered ~125-nm silica colloids on an aromatic polyamide thin-film composite nanofiltration membrane NF 90 (Dow FilmTec Corp., Minneapolis, MN). The MWCO of this membrane is 200 Da. A model is developed that the authors claim “accurately describe how the measured permeate [salt] concentration, rejection, osmotic pressure, and flux decline varied with time.”

A.13
Index of Articles Examined By the Literature Review
PNNL/ Journal File Name/Hyperlink Reference Brief Summary
Journal “Hughes et al (2006).pdf” D Hughes, UK Tirlapur, R Field, and Z Cui. 2006. “In situ 3D characterization of membrane fouling by yeast suspensions using two-photon femtosecond near infrared non-linear optical imaging.” Journal of Membrane Science 280:124–133.
Cake formation in crossflow filtration of yeast suspensions on Millipore 0.22-m mixed cellulose ester membranes was characterized using a novel 3-D in situ imaging technique called two-photon femtosecond near infrared non-linear optical imaging. The morphology and thickness of yeast cakes in microfiltration were characterized with this technique. Dilute feed concentrations yielded an initial patchy monolayer of cells, which ultimately yielded a multilayered cake. High feed concentrations formed multilayer cakes rapidly.
Journal “Christensen et al (2009).pdf”
ML Christensen, TB Nielsen, MBO Andersen, and K Keiding. 2009. “Effect of water-swollen organic materials on crossflow filtration performance.” Journal of Membrane Science 333:94–99.
This paper studies the pressure dependence of steady-state filter flux for hard polystyrene spheres with a water-swellable polyacrylic acid polymer coating undergoing crossflow filtration. The poly(styrene-co-acrylic acid) particles had a size of 200 to 300 nm and were filtered on a 0.022-m2 composite polysulphone/polypropylene membrane with a cutoff of 200 nm. In crossflow filtration, these particles were observed to form a highly compressible cake similar to that observed in the filtration of microorganisms. The authors speculate that the extracellular polymeric substances on the cell walls of microorganisms are responsible for cake-compressibility. While this article is not relevant to WTP operations, it provides an interesting discussion of flux dynamics and steady-state flux properties for crossflow filtration.
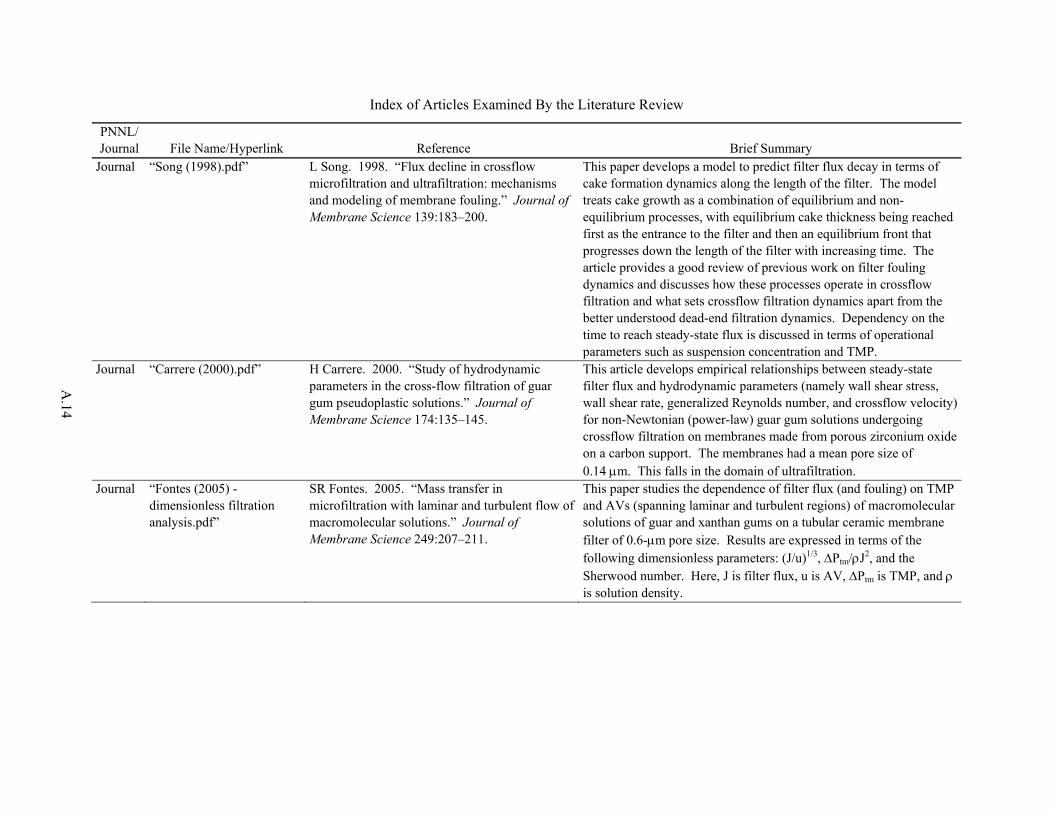
A.14
Index of Articles Examined By the Literature Review
PNNL/ Journal File Name/Hyperlink Reference Brief Summary
Journal “Song (1998).pdf” L Song. 1998. “Flux decline in crossflow microfiltration and ultrafiltration: mechanisms and modeling of membrane fouling.” Journal of Membrane Science 139:183–200.
This paper develops a model to predict filter flux decay in terms of cake formation dynamics along the length of the filter. The model treats cake growth as a combination of equilibrium and non-equilibrium processes, with equilibrium cake thickness being reached first as the entrance to the filter and then an equilibrium front that progresses down the length of the filter with increasing time. The article provides a good review of previous work on filter fouling dynamics and discusses how these processes operate in crossflow filtration and what sets crossflow filtration dynamics apart from the better understood dead-end filtration dynamics. Dependency on the time to reach steady-state flux is discussed in terms of operational parameters such as suspension concentration and TMP.
Journal “Carrere (2000).pdf” H Carrere. 2000. “Study of hydrodynamic parameters in the cross-flow filtration of guar gum pseudoplastic solutions.” Journal of Membrane Science 174:135–145.
This article develops empirical relationships between steady-state filter flux and hydrodynamic parameters (namely wall shear stress, wall shear rate, generalized Reynolds number, and crossflow velocity) for non-Newtonian (power-law) guar gum solutions undergoing crossflow filtration on membranes made from porous zirconium oxide on a carbon support. The membranes had a mean pore size of 0.14 m. This falls in the domain of ultrafiltration.
Journal “Fontes (2005) - dimensionless filtration analysis.pdf”
SR Fontes. 2005. “Mass transfer in microfiltration with laminar and turbulent flow of macromolecular solutions.” Journal of Membrane Science 249:207–211.
This paper studies the dependence of filter flux (and fouling) on TMP and AVs (spanning laminar and turbulent regions) of macromolecular solutions of guar and xanthan gums on a tubular ceramic membrane filter of 0.6-m pore size. Results are expressed in terms of the following dimensionless parameters: (J/u)1/3, Ptm/J2, and the Sherwood number. Here, J is filter flux, u is AV, Ptm is TMP, and is solution density.
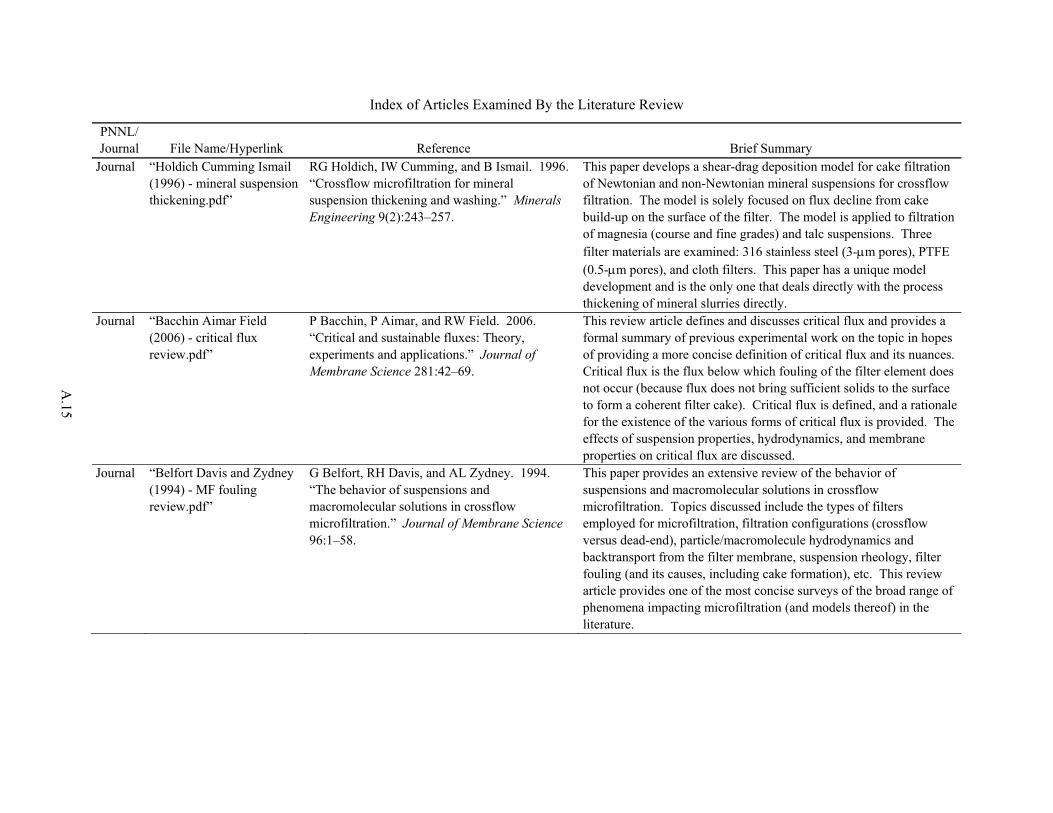
A.15
Index of Articles Examined By the Literature Review
PNNL/ Journal File Name/Hyperlink Reference Brief Summary
Journal “Holdich Cumming Ismail (1996) - mineral suspension thickening.pdf”
RG Holdich, IW Cumming, and B Ismail. 1996. “Crossflow microfiltration for mineral suspension thickening and washing.” Minerals Engineering 9(2):243–257.
This paper develops a shear-drag deposition model for cake filtration of Newtonian and non-Newtonian mineral suspensions for crossflow filtration. The model is solely focused on flux decline from cake build-up on the surface of the filter. The model is applied to filtration of magnesia (course and fine grades) and talc suspensions. Three filter materials are examined: 316 stainless steel (3-m pores), PTFE (0.5-m pores), and cloth filters. This paper has a unique model development and is the only one that deals directly with the process thickening of mineral slurries directly.
Journal “Bacchin Aimar Field (2006) - critical flux review.pdf”
P Bacchin, P Aimar, and RW Field. 2006. “Critical and sustainable fluxes: Theory, experiments and applications.” Journal of Membrane Science 281:42–69.
This review article defines and discusses critical flux and provides a formal summary of previous experimental work on the topic in hopes of providing a more concise definition of critical flux and its nuances. Critical flux is the flux below which fouling of the filter element does not occur (because flux does not bring sufficient solids to the surface to form a coherent filter cake). Critical flux is defined, and a rationale for the existence of the various forms of critical flux is provided. The effects of suspension properties, hydrodynamics, and membrane properties on critical flux are discussed.
Journal “Belfort Davis and Zydney (1994) - MF fouling review.pdf”
G Belfort, RH Davis, and AL Zydney. 1994. “The behavior of suspensions and macromolecular solutions in crossflow microfiltration.” Journal of Membrane Science 96:1–58.
This paper provides an extensive review of the behavior of suspensions and macromolecular solutions in crossflow microfiltration. Topics discussed include the types of filters employed for microfiltration, filtration configurations (crossflow versus dead-end), particle/macromolecule hydrodynamics and backtransport from the filter membrane, suspension rheology, filter fouling (and its causes, including cake formation), etc. This review article provides one of the most concise surveys of the broad range of phenomena impacting microfiltration (and models thereof) in the literature.

A.16
Index of Articles Examined By the Literature Review
PNNL/ Journal File Name/Hyperlink Reference Brief Summary
Journal “Hermia (1981).pdf” J Hermia. 1981. “Constant pressure blocking filtration laws – Application to power-law non-Newtonian fluids.” Transactions of the Institution of Chemicals Engineers 59(1):183–187.
This article provides a single model basis for known modes of dead-end filter fouling, namely 1) complete pore blocking, 2) standard pore blocking, 3) intermediate pore blocking, and 4) cake filtration. A derivation of intermediate blocking is provided. This standard model basis is used to derive equations for predicting filter flux dynamics during constant-pressure filtration of power-law (non-Newtonian) fluids.
Journal “Kim and Digiano (2009) - UF MF Modeling Review.pdf”
J Kim and FA DiGiano. 2009. “Fouling models for low-pressure membrane systems.” Separation and Purification Technology 68:293–304.
This review article summarizes the fouling mechanisms and models for low-pressure membrane filtration systems and their applications in micro- and ultra-filtration. Concepts discussed include dead-end filtration and crossflow filtration in constant pressure and flux operational modes. Specific topics for crossflow filtration include concentration polarization, cake formation, limiting flux, critical flux (and distance), alternate fouling mechanisms (beyond cake formation), and the importance of particle and cake characteristics in understanding membrane fouling.
Journal “Broz and Epstein (1976) - MF stream potential.pdf”
Z Broz and N Epstein. 1976. “Electrokinetic flow through porous media composed of fine cylindrical capillaries.” Journal of Colloid and Interface Science 56(3):605–612.
This paper presents a study of eletrokinetic flow (and the underlying theory) through bundles of cylindrical capillaries. Studies examine the flow of potassium iodide solutions through bundles of either borosilicate capillaries (2 m in diameter, 1.91 mm long, and high zeta potential) or polycarbonate capillaries (0.1 m in diameter, 12 m long, and low zeta potential). Streaming potentials across the capillary bundles are measured. This paper provides an example of (and theory for) characterizing the zeta potential of filter membranes via streaming potential measurement. The zeta potential of filter media can affect fouling of the filter elements.
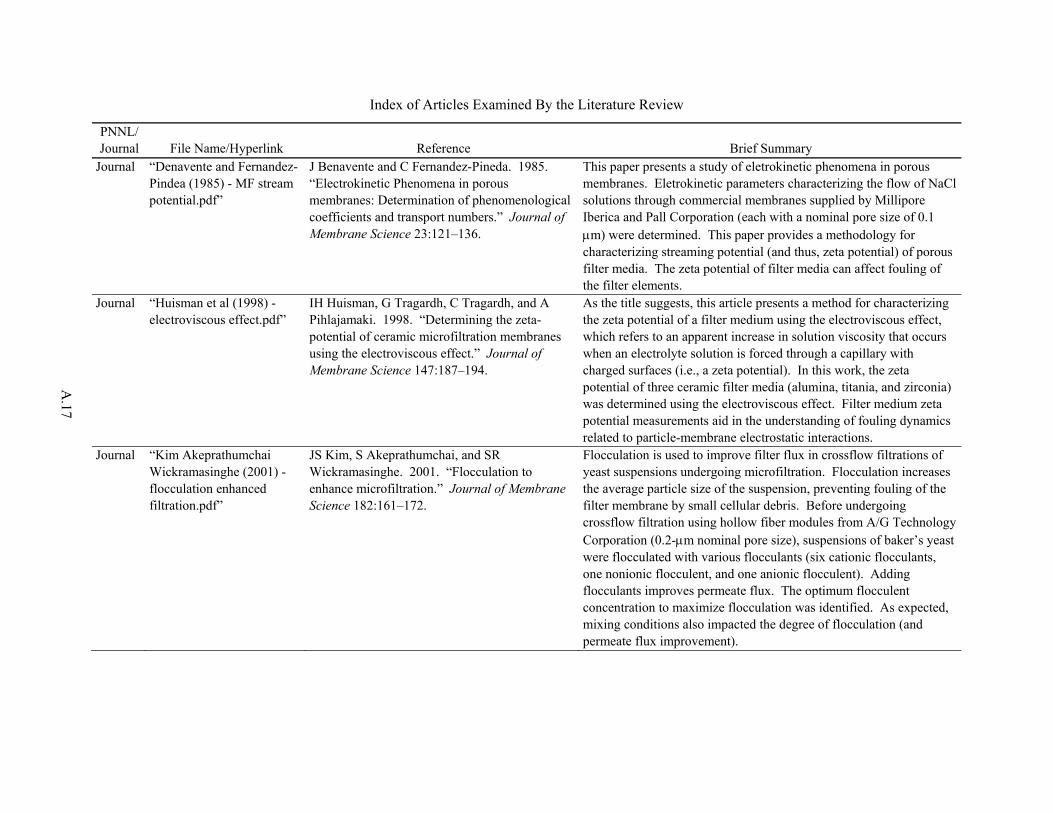
A.17
Index of Articles Examined By the Literature Review
PNNL/ Journal File Name/Hyperlink Reference Brief Summary
Journal “Denavente and Fernandez-Pindea (1985) - MF stream potential.pdf”
J Benavente and C Fernandez-Pineda. 1985. “Electrokinetic Phenomena in porous membranes: Determination of phenomenological coefficients and transport numbers.” Journal of Membrane Science 23:121–136.
This paper presents a study of eletrokinetic phenomena in porous membranes. Eletrokinetic parameters characterizing the flow of NaCl solutions through commercial membranes supplied by Millipore Iberica and Pall Corporation (each with a nominal pore size of 0.1 m) were determined. This paper provides a methodology for characterizing streaming potential (and thus, zeta potential) of porous filter media. The zeta potential of filter media can affect fouling of the filter elements.
Journal “Huisman et al (1998) - electroviscous effect.pdf”
IH Huisman, G Tragardh, C Tragardh, and A Pihlajamaki. 1998. “Determining the zeta-potential of ceramic microfiltration membranes using the electroviscous effect.” Journal of Membrane Science 147:187–194.
As the title suggests, this article presents a method for characterizing the zeta potential of a filter medium using the electroviscous effect, which refers to an apparent increase in solution viscosity that occurs when an electrolyte solution is forced through a capillary with charged surfaces (i.e., a zeta potential). In this work, the zeta potential of three ceramic filter media (alumina, titania, and zirconia) was determined using the electroviscous effect. Filter medium zeta potential measurements aid in the understanding of fouling dynamics related to particle-membrane electrostatic interactions.
Journal “Kim Akeprathumchai Wickramasinghe (2001) - flocculation enhanced filtration.pdf”
JS Kim, S Akeprathumchai, and SR Wickramasinghe. 2001. “Flocculation to enhance microfiltration.” Journal of Membrane Science 182:161–172.
Flocculation is used to improve filter flux in crossflow filtrations of yeast suspensions undergoing microfiltration. Flocculation increases the average particle size of the suspension, preventing fouling of the filter membrane by small cellular debris. Before undergoing crossflow filtration using hollow fiber modules from A/G Technology Corporation (0.2-m nominal pore size), suspensions of baker’s yeast were flocculated with various flocculants (six cationic flocculants, one nonionic flocculent, and one anionic flocculent). Adding flocculants improves permeate flux. The optimum flocculent concentration to maximize flocculation was identified. As expected, mixing conditions also impacted the degree of flocculation (and permeate flux improvement).
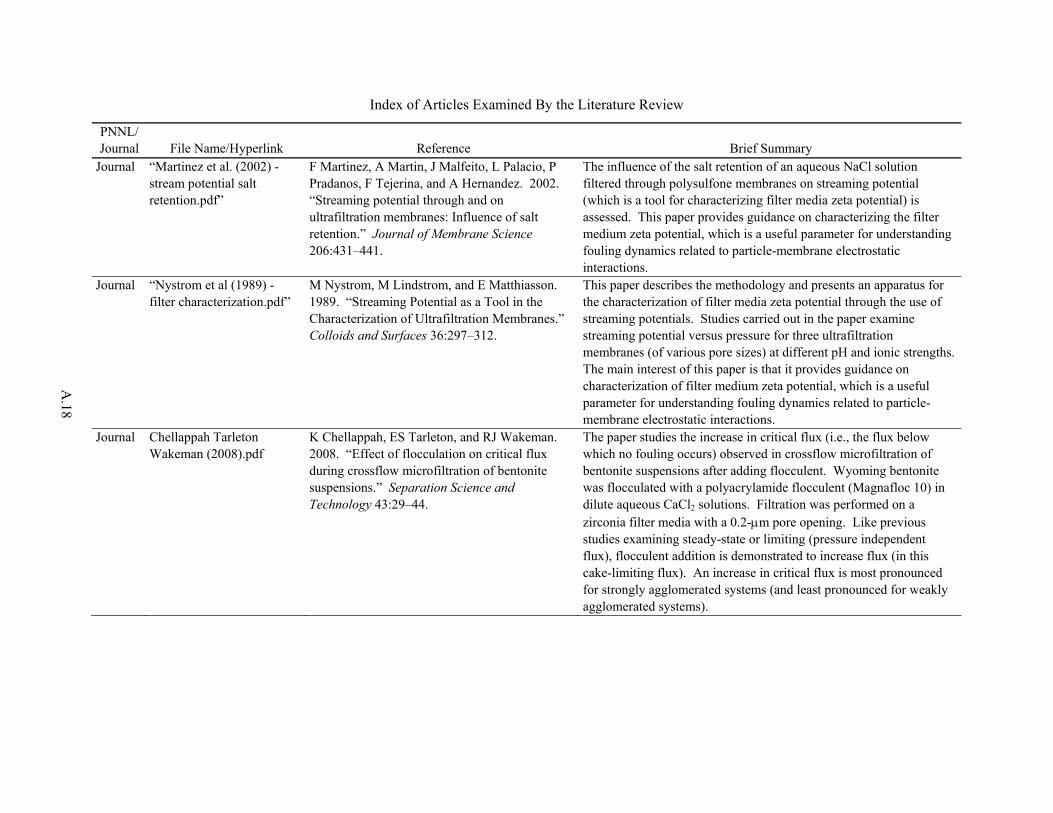
A.18
Index of Articles Examined By the Literature Review
PNNL/ Journal File Name/Hyperlink Reference Brief Summary
Journal “Martinez et al. (2002) - stream potential salt retention.pdf”
F Martinez, A Martin, J Malfeito, L Palacio, P Pradanos, F Tejerina, and A Hernandez. 2002. “Streaming potential through and on ultrafiltration membranes: Influence of salt retention.” Journal of Membrane Science 206:431–441.
The influence of the salt retention of an aqueous NaCl solution filtered through polysulfone membranes on streaming potential (which is a tool for characterizing filter media zeta potential) is assessed. This paper provides guidance on characterizing the filter medium zeta potential, which is a useful parameter for understanding fouling dynamics related to particle-membrane electrostatic interactions.
Journal “Nystrom et al (1989) - filter characterization.pdf”
M Nystrom, M Lindstrom, and E Matthiasson. 1989. “Streaming Potential as a Tool in the Characterization of Ultrafiltration Membranes.” Colloids and Surfaces 36:297–312.
This paper describes the methodology and presents an apparatus for the characterization of filter media zeta potential through the use of streaming potentials. Studies carried out in the paper examine streaming potential versus pressure for three ultrafiltration membranes (of various pore sizes) at different pH and ionic strengths. The main interest of this paper is that it provides guidance on characterization of filter medium zeta potential, which is a useful parameter for understanding fouling dynamics related to particle-membrane electrostatic interactions.
Journal Chellappah Tarleton Wakeman (2008).pdf
K Chellappah, ES Tarleton, and RJ Wakeman. 2008. “Effect of flocculation on critical flux during crossflow microfiltration of bentonite suspensions.” Separation Science and Technology 43:29–44.
The paper studies the increase in critical flux (i.e., the flux below which no fouling occurs) observed in crossflow microfiltration of bentonite suspensions after adding flocculent. Wyoming bentonite was flocculated with a polyacrylamide flocculent (Magnafloc 10) in dilute aqueous CaCl2 solutions. Filtration was performed on a zirconia filter media with a 0.2-m pore opening. Like previous studies examining steady-state or limiting (pressure independent flux), flocculent addition is demonstrated to increase flux (in this cake-limiting flux). An increase in critical flux is most pronounced for strongly agglomerated systems (and least pronounced for weakly agglomerated systems).

A.19
Index of Articles Examined By the Literature Review
PNNL/ Journal File Name/Hyperlink Reference Brief Summary
Journal “Chong Wong Fane (2008).pdf”
TH Chong, FS Wong, and AG Fane. 2008. “Implications of critical flux and cake enhanced osmotic pressure (CEOP) on colloidal fouling in reverse osmosis: Experimental observations.” Journal of Membrane Science 314:101–111.
This article examines the applicability of the critical flux phenomenon (i.e., the existence of a flux below which membrane fouling does not occur) when using reverse osmosis membranes. Authors claim that studies of critical flux have focused on micro- and ultra-filtration membranes and that the phenomenon still needs to be demonstrated on RO filters. Authors also discuss cake-enhanced osmotic pressure, which refers to the hindrance back diffusion of salts rejected by the membrane by the existence of a colloidal cake layer on the filter membrane. The study employs colloidal silica (Ludox) with a mean diameter of 24 nm suspended in an aqueous sodium chloride solution. The filter membrane was a commercial RO membrane (FilmTec, model BW30).
Journal “Churaev et al. (2005) - pore plugging dead end MF.pdf”
NV Churaev, RG Holdich, PP Prokopovich, VM Starov, and SI Vasin. 2005. “Reversible adsorption inside pores of ultrafiltration membranes.” Journal of Colloid and Interface Science 288:205–212.
This article explores the deviation from the expected linear dependence between filter flux and TMP for dead-end ultrafiltration of poly(ethylene glycol) solutions. While previous articles focus on flux reductions derived from gel formation, membrane fouling, concentration polarization, and deformation of polymer molecules inside membranes, the current study attributes the deviation to adsorption of polyethylene glycol (PEG) molecules inside the filter pores (and the effective constriction of flow resulting from that adsorption). The pressure dependence of filter flux for PEG with a range of molecular weights filtered through commercial poly(sulfone) membranes is studied and modeled.
Journal “Cumming Holdich Ismail (1999) - xflow cake depth.pdf
IW Cumming, RG Holdich, and B Ismail. 1999. “Prediction of deposit depth and transmembrane pressure during crossflow microfiltration.” Journal of Membrane Science 154:229–237.
This paper models cake thickness for crossflow microfiltration operations involving concentrated slurries and non-Newtonian flow behavior (such that cake depth is appreciable). Experiments involve the filtration of concentrated talc suspensions (26.3 to 28.3 wt%) through two types of stainless steel filters (with 3- and 2-m pore sizes) and two types of ceramic filters (of 0.3- and 0.1-m pore size). Filtration is modeled using the shear stress method developed in Holdich, Cumming, and Ismail (1996) (see main reference list).

A.20
Index of Articles Examined By the Literature Review
PNNL/ Journal File Name/Hyperlink Reference Brief Summary
Journal “Hajipour et al (2010).pdf” M Hajipour, M Soltanieh, and M Yazdanshenas. 2010. “Investigation of membrane fouling in cross flow microfiltration of non-alcoholic beer and modeling of tubular membrane flow.” Desalination 251:20–28.
This paper uses finite element method (FEM) analysis to model fouling (flux decline) during crossflow microfiltration of non-alcoholic beer through alumina membranes with a pore size of 0.45 m. This is one of the few papers that use FEM to solve for filter flux dynamics.
Journal “Huisman Pradanos Hernandez (2000) - protein membrane interactions fouling.pdf”.
IH Huisman, P Pradanos, and A Hernandez. 2000. “The effect of protein–protein and protein–membrane interactions on membrane fouling in ultrafiltration.” Journal of Membrane Science 179:79–90.
This paper presents a study of the influence of protein-protein and protein-membrane interactions on the crossflow ultrafiltration of bovine serum albumin (BSA) on polymeric membranes with pore sizes ranging from 2 to 15 nm. Measurements were performed at different pH to study protein-membrane charge effects. Filter fouling during the initial stages of filtration were found to be governed by membrane-protein interactions. Fouling during the later stages of filtration (i.e., after significant fouling) were governed by protein-protein interactions. AFM was used to study the structure of the protein fouling layer. Below the protein iso-electric point, open protein structures were observed (and corresponded to high filter flux values relative to those above the IEP).
Journal “Kim and Zydney (2005).pdf”
M Kim and AL Zydney. 2005. “Particle–particle interactions during normal flow filtration: Model simulations.” Chemical Engineering Science 60:4073–4082.
The motion of particles under the influence of crossflow filtration flow fields is studied by numerical integration of the Langevin equation. The effects of electrostatic repulsion, enhanced hydrodynamic drag, Brownian diffusion, and interparticle forces are all accounted for in the modeling effort. Modeling efforts examined filter-particle interactions (with like charged particle and filter surfaces) for both a single isolated particle and two-particle systems. For single particles, electrostatic repulsion can prevent particles from entering the filter pores unless the hydrodynamic drag is sufficient to overcome repulsion (in the absence of Brownian motion). For two particle systems, particle-particle repulsion can force one of the particles into the pore opening.

A.21
Index of Articles Examined By the Literature Review
PNNL/ Journal File Name/Hyperlink Reference Brief Summary
Journal “Kim and Zydney (2006).pdf”
M Kim and AL Zydney. 2006. “Theoretical analysis of particle trajectories and sieving in a two-dimensional cross-flow filtration system.” Journal of Membrane Science 281:666–675.
As in Kim and Zydney (2005) (see main reference list), the motion of particles under the influence of crossflow filtration flow fields is studied by numerical integration of the Langevin equation. This time, the effects of electrostatic repulsion, enhanced hydrodynamic drag, Brownian diffusion, inertial lift and van der Waals attraction are discussed. Electrostatic repulsion causes a critical flux below which particles cannot enter the filter pore. As stated in the article summary, “Particle transmission [capture] increases with increasing filtrate flux and ionic strength, and decreases with increasing particle size, wall shear rate and electrostatic potential.”
Journal “Knutsen and Davis (2006).pdf”
JS Knutsen and RH Davis. 2006. “Deposition of foulant particles during tangential flow filtration.” Journal of Membrane Science 271:101–113.
Direct visual observation is used to study foulant deposition during crossflow filtration of four particle systems (Yeast cells and 4.5-m, 10-m, and 20-m latex particles) on alumina membranes (with pore sizes of 0.02 and 0.2 m). Particles are observed to roll on the filter membrane. A surface transport model is developed to predict the rolling velocity and fractional deposition.
Journal “Kosvinstev (2002) - pore blocking dead end MF.pdf”
S Kosvintsev, RG Holdich, IW Cumming, and VM Starov. 2002. “Modeling of dead-end microfiltration with pore blocking and cake formation.” Journal of Membrane Science 208:181–192.
Pore blocking in dead-end filtration was studied using roughly size-matched particles and pore openings. Latex particles of 0.45 m were filtered through Isopore track-etched membrane filters with a nominal pore size of 0.4 m. Three stages of filter fouling were observed—two pore-blocking stages (occurring at low deposition masses) and cake filtration (which occurred once the deposition layer was ~12 particles thick). These stages of filtration were modeled.

A.22
Index of Articles Examined By the Literature Review
PNNL/ Journal File Name/Hyperlink Reference Brief Summary
Journal “Lamminen et al (2006) - ultrasonic cleaning electro effects.pdf”
MO Lamminen, HW Walker, and LK Weavers. 2006. “Effect of Fouling Conditions and Cake Layer Structure on the Ultrasonic Cleaning of Ceramic Membranes.” Separation Science and Technology 41:3569–3584.
The effectiveness of ultrasonic cleaning to remove polystyrene latex particles deposited on aluminum membranes was studied at different pH and ionic strength values. Solution conditions (pH and ionic strength) had a much greater impact on cleaning effectiveness than particle size. Cleaning effectiveness was governed by both particle-particle and particle-membrane interactions. When particle-particle repulsion was low, applying sonic energy causes particles to break off in flocs, resulting in highly effective cleaning (cake disruption). When particle-particle repulsion was high, particles broke off as individual particles, resulting in poor cleaning.
Journal “Lawrence et al (2006).pdf” ND Lawrence, JM Perera, M Iyer, MW Hickey, and GW Stevens. 2006. “The use of streaming potential measurements to study the fouling and cleaning of ultrafiltration membranes.” Separation and Purification Technology 48:106–112.
Streaming potential is used to study the fouling and cleaning of membranes used for crossflow ultrafiltration of whey protein concentrate. Polysulphone (with polypropylene backing), polyvinylidine fluoride, and polyethersulphone membranes were used, and the influence of pH and background electrolyte was studied. Increased levels of membrane fouling were observed when the whey protein and membrane were oppositely charged. Attraction also made removal of the protein during cleaning more difficult.
Journal “Parvatiyar (1998) - mass transfer tubular membrane.pdf”
MG Parvatiyar. 1998. “Mass transfer in a membrane tube with turbulent flow of Newtonian and non-Newtonian fluids.” Journal of Membrane Science 148:45–57.
The spectral theory of turbulence is applied to describe mass transfer in ultrafiltration processes for Newtonian and non-Newtonian fluids.
Journal “Smidova et al (2004).pdf”. D Smidov, P Mikrulfigek, RJ Wakeman, and P Velikovskfi. 2004. “Influence of ionic strength and pH of dispersed systems on microfiltration.” Desalination 163:323–332.
Crossflow microfiltration of two china clay suspensions (with mean particle sizes of 3.5 and 1.5 m) on ZrO2 membranes (mean pore size 0.2 m) was used to study the influence of particle shape, zeta potential, and particle size (and their variation with pH and ionic strength) on filter flux. The zeta potential is found to have significant impact, as the permeate flux doubled near the isoelectric point. The increase is attributed to particle aggregation, which resulted in a more open cake structure.

A.23
Index of Articles Examined By the Literature Review
PNNL/ Journal File Name/Hyperlink Reference Brief Summary
Journal “Sohndi et al. (2000).pdf” R Sondhi, YS Lin, and F Alvarez. 2000. “Crossflow filtration of chromium hydroxide suspension by ceramic membranes: fouling and its minimization by backpulsing.” Journal of Membrane Science 174:111–122.
Fouling of alumina membranes of varying pore size (0.2 to 5 m) by a Cr(OH)3 suspension during crossflow filtration was studied in terms of pore blocking, pore constriction, and cake formation fouling models. For the smaller pore size membranes, fouling could not be described by any of the three models alone. Agreement with results could only be achieved by a combination of the three fouling mechanisms. In the 5.0-m pore membrane, pore blocking is the dominant mechanism. Fouling is minimized and high flux rates maintained by backpulsing of the filter. Backpulsing here refers to a TMP reversal occurring every few seconds or less where the duration of the pulse is less than one second. It is not similar to backpulsing in WTP.
Journal “Vadi and Rizvi (2001).pdf” PK Vadi, and SSH Rizvi. 2001. “Experimental evaluation of a uniform transmembrane pressure crossflow microfiltration unit for the concentration of micellar casein from skim milk.” Journal of Membrane Science 189:69–82.
Two operational modes, 1) uniform transmembrane pressure (UTMP) and 2) non-uniform TMP, are evaluated for the crossflow microfiltratrion concentration of micellar casein from skim milk (using a 0.2-m pore size zirconia filter on an alumina support). In UTMP, TMP is maintained over the length of the filter. At low concentration factors (up to concentration factor 4), non-UTMP maintained a higher flux and faster dewatering. At high concentration factors, non-UTMP filtration fell below acceptable flux, whereas the UTMP mode maintained acceptable flux.
Journal “Velikovska and Mikulasek (2007) - electro effects titania filtration.pdf”
P Velikovsk and P Mikulasek. 2007. “The influence of Cl-, SO4
2- and PO43- ions on the ζ-
potential and microfiltration of titanium dioxide dispersions.” Separation and Purification Technology 58:295–298.
This paper reports a study of the impact of pH, ionic strength, and anion chemistry on the crossflow microfiltration of TiO2 dispersions (~300-nm mean particle size, 5-wt% suspension) filtered through a ceramic (alumina, 91-nm nominal pore size) medium. The results highlight the importance of both membrane and particle surface properties in crossflow microfiltration. The zeta potential of particle and filter medium are characterized in 0.001 and 0.01 M solutions of NaCl, Na2SO4, and Na3PO4. The steady-state filter flux was observed to increase with increasing ionic strength (in the presence of electrolytes) and with decreasing pH due to the impact of these properties on the dispersivity of TiO2.
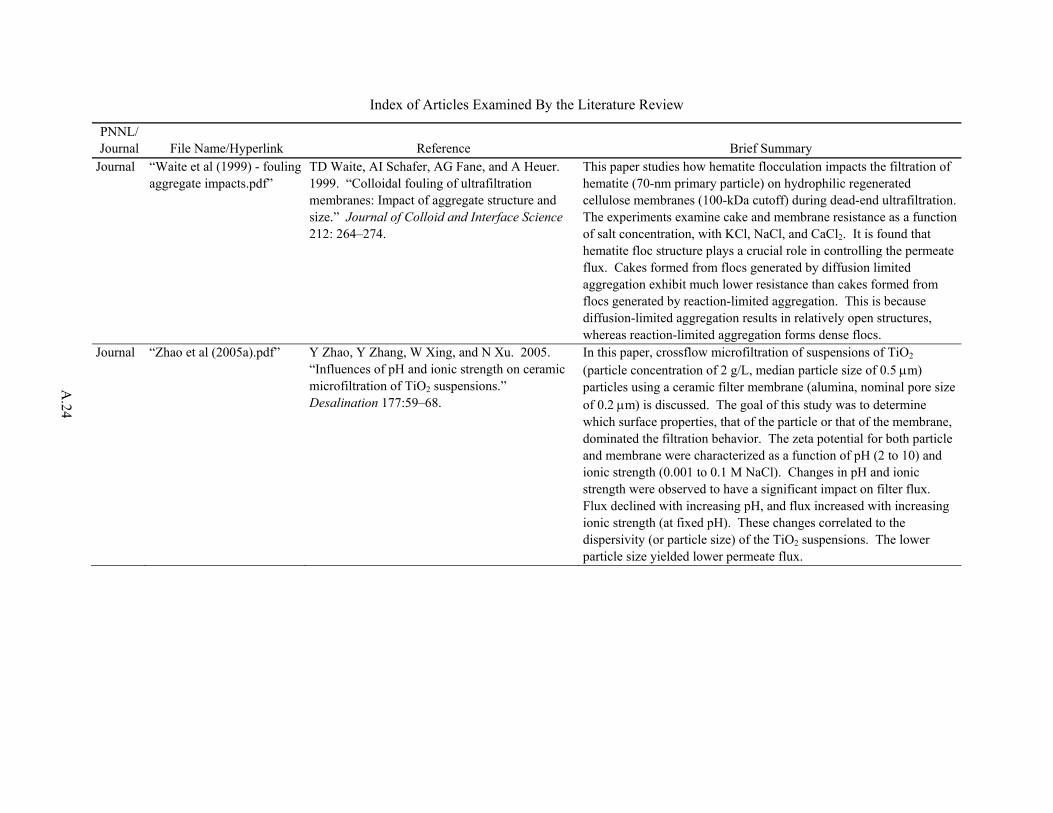
A.24
Index of Articles Examined By the Literature Review
PNNL/ Journal File Name/Hyperlink Reference Brief Summary
Journal “Waite et al (1999) - fouling aggregate impacts.pdf”
TD Waite, AI Schafer, AG Fane, and A Heuer. 1999. “Colloidal fouling of ultrafiltration membranes: Impact of aggregate structure and size.” Journal of Colloid and Interface Science 212: 264–274.
This paper studies how hematite flocculation impacts the filtration of hematite (70-nm primary particle) on hydrophilic regenerated cellulose membranes (100-kDa cutoff) during dead-end ultrafiltration. The experiments examine cake and membrane resistance as a function of salt concentration, with KCl, NaCl, and CaCl2. It is found that hematite floc structure plays a crucial role in controlling the permeate flux. Cakes formed from flocs generated by diffusion limited aggregation exhibit much lower resistance than cakes formed from flocs generated by reaction-limited aggregation. This is because diffusion-limited aggregation results in relatively open structures, whereas reaction-limited aggregation forms dense flocs.
Journal “Zhao et al (2005a).pdf” Y Zhao, Y Zhang, W Xing, and N Xu. 2005. “Influences of pH and ionic strength on ceramic microfiltration of TiO2 suspensions.” Desalination 177:59–68.
In this paper, crossflow microfiltration of suspensions of TiO2 (particle concentration of 2 g/L, median particle size of 0.5 m) particles using a ceramic filter membrane (alumina, nominal pore size of 0.2 m) is discussed. The goal of this study was to determine which surface properties, that of the particle or that of the membrane, dominated the filtration behavior. The zeta potential for both particle and membrane were characterized as a function of pH (2 to 10) and ionic strength (0.001 to 0.1 M NaCl). Changes in pH and ionic strength were observed to have a significant impact on filter flux. Flux declined with increasing pH, and flux increased with increasing ionic strength (at fixed pH). These changes correlated to the dispersivity (or particle size) of the TiO2 suspensions. The lower particle size yielded lower permeate flux.

A.25
Index of Articles Examined By the Literature Review
PNNL/ Journal File Name/Hyperlink Reference Brief Summary
Journal “Zhao et al (2005b).pdf” Y Zhao, W Xing, N Xu, and FS Wong. 2005. “Effects of inorganic salt on ceramic membrane microfiltration of titanium dioxide suspension.” Journal of Membrane Science 254:81–88.
This article discusses the impact of inorganic salt chemistry on the crossflow microfiltration of TiO2 suspensions (suspension concentration—2 g/L, median particle size 0.5 m) using ceramic membranes (alumina, nominal pore size of 0.2 m). Filter flux was measured as a function of suspending phase pH, ionic strength, and salt species. The uniqueness of the study was in the use of different cations (AlCl3, FeCl3, NH4Cl, and NaCl) and anions (NaCl, Na2SO4, and Na3PO4). Using NH4Cl and NaCl increased the flux, which was associated with an increase in the median particle size of the TiO2 (consistent with Zhao et al (2005a). Adding AlCl3 and FeCl3 reduced flux. It is speculated that this flux drop results from increased membrane resistance resulting from specific adsorption of Al3+ and Fe3+ ions onto the filter membrane (causing an increase in membrane zeta potential). Relative to NaCl additions, adding Na2SO4 and Na3PO4 yielded a higher decrease in permeate flux. Again, this is attributed to specific adsorption of anions on the membrane. As such, the paper indicates that filter flux is strongly dependent on salt chemistry and how salt addition affects the median dispersion particle size and membrane and particle zeta potential.


PNNL-20023
Dist. 1
Distribution No. of Copies OFFSITE*
No. of Copies ONSITE*
2 Department of Energy–EM N Machara S Schneider 5 Savannah River National Laboratory
M Duignan D Herman C Nash F Pennebaker B Wilmarth
4 Pacific Northwest National Laboratory RC Daniel P7-22 RA Peterson P7-22 RW Shimskey P7-27 PP Schonewill P7-25
*All distribution will be made electronically.