Embed Size (px)
Citation preview

Application of Horizontal Wells in Mature Basins:
A Case History from KansasA Case History from Kansas
Tulsa Geological Society September 5, 2000

Acknowledgements
US Department of Energy Mull Drilling Company Inc. Ritchie Exploration Inc. Sperry-Sun Drilling CMG (Computer Modeling Group) Security DBS Baroid Norseman Art Merrick Consulting Scientific Drilling Weatherford

University of Kansas
Saibal Bhattacharya Tim Carr John Doveton Paul Gerlach Bill Guy Richard Pancake

Presentation Outline
Introduction, Overview, ResultsWhy Identify Horizontal Candidates in
Mature Basins ?Remaining Oil and Gas ReservesEconomic Impact
Tools for Identifying Candidate Reservoirs, Leases and Locations
Large and Numerous Targets
One Kansas Target: MississippianReservoir Heterogeneity (Vertical &
Horizontal)

Presentation Outline
Reservoir Characterization & Simulation
Work with Sparse and Old Data
PC-Based Case Study of Horizontal Well
Operational Success
Economic Success ?$?$?$?$? The Learning Curve
http://www.kgs.ukans.edu/PTTC

Potential Targets
Numerous Targets State Level
Numerous Targets State Level
Compartmentalized ReservoirsMississippian “Meramecian”
Thin BedsLansing - Kansas CityShoaling Carbonates
Attic OilSub UnconformityOrdovician and Mississippian
SAGDCherokee Sandstones in Eastern Kansas
EOR InjectorsMultiple Reservoirs
Fractured ReservoirsArbuckle, Chat
Low Permeability Gas ReservoirsMississippian “Cowley Facies”
Gas / Water ConingCentral Kansas Reservoirs
Modified from Paul Gerlach

Why Identify Horizontal Candidates in Mature Basins ?Exploit Remaining Oil and Gas Reserves
Remaining Mobile Oil in Place/Quarter Section
Welch-Bornholdt-Wherry FieldsRice County, KansasDiscovered: 1924Producing Formation: MississippianTrap Type: StratigraphicCumulative Oil Production: 60 MMBO
CI: 500 MBOColor GridRed = 7 MMBOBlue = 2.5 MMBO
Modified from Paul Gerlach

ST
B/m
nth
ST
B/m
nth
Oppy South FieldHodgeman County, KansasDiscovered: 1962
Impact of Horizontal Well
Producing Formation: MississippianCum. Oil Prod.: 800 MBO
Why Identify Horizontal Candidates in Mature Basins ?Economic Impact
10001000
Modified from Paul Gerlach

Large Potential Target
Ness County
Schaben
Total Production 5+ Billion Barrels
Regan & Granite2 %
ARBUCKLE32 %
Upper & MiddleOrdovician
8 %Hunton
1 %
Pennsylvanian(Virgilian)
3 %
Pennsylvanian(Missourian)
23 %
Pennsylvanian(Desmoisian)
8 %
Pennsylvanian(Morrow)
3 %
Pennsylvanian(Other)
1 %
Mississippian19 %
Cumulative Production 6.6+ Billion BarrelsCumulative Production 6.6+ Billion Barrels Numerous Targets Mississippian
Numerous Targets Mississippian

Kansas Regional Cross-Section
Southwest Northeast1 2 3 4 5 6 7 8 9 10 11 12
1
23 4 5
6
78
9
10 11
12
Rush
Ness
Ellis
Lane
FinneyKearny
0 10 20 30 40
miles
Lansing - Kansas City
Pleasanton
Marmaton
Arbuckle
Viola Simpson
Reagan
Datum top Heebner
SchabenField
Cherokee
Mississippian
Kinderhook
Precambrian
Morrow

Cost Effective High Technology for the Independent Producer
In the Past....» Performed on Core Assets of Large Companies» Required Expensive Hardware and Software
At the Present....» Advances in PC-Based Hardware Software and Databases» Within Reach of Independent Producer

Mapping Field Level VolumetricsRemaining Mobile Oil in Place / Quarter Section
Welch-Bornholdt-Wherry FieldsRice County, KansasDiscovered: 1924Producing Formation: MississippianTrap Type: StratigraphicCumulative Oil Production: 60 MMBO
CI: 500 MBOColor GridRed = 7 MMBOBlue = 2.5 MMBO
Modified from Paul Gerlach

000
20S/7W
123456
7 8 9 10 11 1 2
1 3141 5161718
19 20 21 2 2 23 2 4
2 5262 7282 930
31 32 33 3 4 35 3 6
20S/6W
123456
7 8 9 10 11 12
131 415161718
19 20 21 22 2 3 24
252627282930
31 32 33 34 3 5 36
20S/5W
456
7 8 9
161718
19 20 21
2930
31 32
1
12
1 3
21S/7W
123456
7 8 9 10 11 12
1314151 61718
21S/6W
123456
7 8 9 1 0 11 1 2
1 3141 5161718
56
7 8
1718
Welch-Bornholdt-Wherry Fields
Cumulative Production per Quarter Section
CI: 100 mbo / quarter section
= 1.5 mmbo = 0.4 mmbo
Mapping Field Level VolumetricsCumulative Production / Quarter Section
Modified from Paul Gerlach

Welch-Bornholdt-Wherry Fields
Recovery Efficiency per Quarter SectionCI: 2%
0
60
0
20
20S/7W
123456
7 8 9 10 11 1 2
1 3141 5161718
19 20 21 2 2 23 2 4
2 5262 7282 930
31 32 33 3 4 35 3 6
20S/6W
123456
7 8 9 10 11 12
131 415161718
19 20 21 22 2 3 24
252627282930
31 32 33 34 3 5 36
20S/5W
456
7 8 9
161718
19 20 21
2930
31 32
1
12
1 3
21S/7W
123456
7 8 9 10 11 12
1314151 61718
21S/6W
123456
7 8 9 1 0 11 1 2
1 3141 5161718
56
7 8
1718
0
60
0
20
= 18% = 2%
Mapping Field Level VolumetricsRecovery Efficiency / Quarter Section
Modified from Paul Gerlach

Lease Level AnalysisVolumetric Recovery Efficiency

Horizontal Well Applicationin a Lease with Low Recovery Efficiency
Lease Level AnalysisVolumetric Recovery Efficiency

Large Potential TargetNess County
Ness CountyNess County
Schaben Field
Schaben Field

Numerous Targets Regional Level
Numerous Targets Regional Level

Production Data AnalysisSchaben Field
High Vertical High Vertical PermeabilityPermeability
Result Poor Result Poor Horizontal Horizontal SweepSweep


Reservoir Heterogeneity
Strong Vertical Heterogeneity 3” Interval Facies Controlled
Result Poor Lateral Drainage
Strong Vertical Heterogeneity 3” Interval Facies Controlled
Result Poor Lateral Drainage
0.00 100.00 200.00 300.00 400.00
Minipermeability (md)
4395.0
4400.0
4410.0
4420.0
4430.0
4405.0
4415.0
4425.0
4435.0
Ritchie Exploration1 Foos "A-P" TwinNE SW SW Sec. 31-T19S-R21W
Ness County, Kansas
Dolo Wacke-Packstone
Grainstone
Lime or DoloMudstone - Wackestone
Silt-Shale Fill
Late Stage BrecciationOriginal Facies Indeterminate
Chert
OilStain
Brecciation

Depositional Model
Shelf
Skeletal Bank
Shoal Island
Lagoon
SkeletalBank
RestrictedShelf
Silty Mudstoneand Wackestone
Mudstone andWackestone
Packstone andGrainstone
Wackestone andPackstone
Mudstone andEvaporites
Schaben Field

Geologic Reservoir Description
0.00 100.00 200.00 300.00 400.00
Minipermeability (md)Oil
Stain
Dolo Wacke-Packstone
Grainstone
Lime or DoloMudstone - Wackestone
Silt-Shale Fill
Late Stage BrecciationOriginal Facies Indeterminate
Chert
Brecciation
4430.0
4435.0
Ritchie Exploration#1 Foos "A-P" TwinNE SW SW Sec. 31-T19S-R21WNess County, Kansas

Reservoir FaciesSkeletal Wackestone - Packstone
Ritchie 2 Schaben PRitchie 2 Schaben P

Spicule-Rich Mudstone -Wackestone Facies
Ritchie 1 Moore BRitchie 1 Moore B

Perforation: 4400-4404. Produced 85 bopd & 132 bwpdPerforation: 4400-4404. Produced 85 bopd & 132 bwpd
Super Pickett Plot
Reservoir PorositySaturationPay HeightBVW
Super Pickett Plot
Reservoir PorositySaturationPay HeightBVW
Petrophysical Analysis

NMR AnalysisNMR AnalysisCore PlugsCore Plugs
Sample S23POROSITY vs T2
0.00
0.05
0.10
0.15
0.20
0.25
0.30
0.35
0.40
0.45
0.50
1.00 10.00 100.00 1000.00 10000.00
T2 Relaxation Time, ms
Incr
em
enta
l P
oro
sity
, %
0.00
1.00
2.00
3.00
4.00
5.00
6.00
7.00
8.00
9.00
10.00
Incr
em
enta
l P
oro
sity
, %
Saturated Incremental
Saturated Cumulative
Desaturated Incremental
Desaturated Cumulative

NMR Derived Effective Porosity vs. Core Pororsity
0
5
10
15
20
25
0 5 10 15 20 25
Core Porosity
Eff
ecti
ve P
oro
sity
2nd OrderFitData Points
Eff. Por. =( Core Por.)^2*.03295 - (Core Por.)*0.00956
NMR Derived Effective Porosity vs. Core Pororsity
0
5
10
15
20
25
0 5 10 15 20 25
Core Porosity
Eff
ecti
ve P
oro
sity
2nd OrderFitData Points
Eff. Por. =( Core Por.)^2*.03295 - (Core Por.)*0.00956
Schaben Field Effective Porosity
NM
R E
ffec
tive
Por
osit
y
Core Porosity

Average Reservoir Pressure

Reservoir SimulationReservoir Heterogeneity
Poor Lateral Drainage Poor Lateral Drainage

Reservoir SimulationPerformance Prediction
24
25
19
30
W ITTM A N
2
W ITTM A N
1
G N EIC H
1
G N EIS C H
1
G N EIC H
2
W ILH E LM C
1
R EIN A
5
FR AN K E R E IN
1-A
R E IN O W W O
1R EIN 'A '
2
R EIN A O W W O
1
FR AN K R E IN
1
R E IN A
6
R E IN A
4
M O O R E C
2
M O O R E D
1
M O O R E D
4
M O O R E D
3
M O O R E D
2
M O O R E B
5
M O O R E C
3M O O R E B
2
M O O R E B
1
M O O R E B
3
M O O R E C
1
M O O R E B7
M O O R E B
6M O O R E B
4
SC H A BE N
1
SC H A BE N A
1
SC H A BE N A
1
LY LE S C H AB EN
1
SC H A BE N A
2
BATT C
1
B ATT A
1
G ILLIG
1
G ILLIG A
2
G ILLIG
1
G ILLIG
1-24
G ILLIG B
2
G ILLIG B
1
S C H AB EN
1O U T O N BA IL
1
BO R G ER
1
H U M B U R G1-X
BO R G ER
2
D O R A W AG N E R
3
W A G N E R2
D O R A W AG N ER
1
BO R G ER
2
BO R G ER
1
BO R G ER
2
H U M BU R G
2
H U M BU R G
1
H U M BU R G 1
H U M BU R G 'A '
2
H U M B U R G 'A '1
BO R G ER 'A '
1
BO R G ER
4
B O R G E R
13
B O R G E R 'A '
2
G ILLIG
1
R O BE RT B LE N T
2
R O B ERT B LEN T
1
G ILLIG
1
FIC KE N
1
F IC KE N
1A N N A W ILLIA M S
1
A N N A W ILLIA M S2
3
AN N A M W ILLIA M S
5
W ILLIA M S ES T
2H L W ILLIA M S ES T
1
H U M BU R G 3
W A G N E R
4
W AG N E R
5
B O R G E R3
W ITTM A N 3
M O O R E D P 6 M O O R E B-P TW IN 4M O O R E D P 5
Sim ulated Horizontal Well #1
2 4 2 0 1 6 1 2 48 0 S o - F t
V e r t i c a l I n f i l l v s . H o r i z o n t a l I n f i l lC o m p a r i s o n A r e a
Best Areas for Infill Drilling
So > 40% & Payheight > 20 ft.
Schaben Field

2 4 2 0 1 6 1 2 48 0 S o - F t
W ITTM AN
2
W ITTM AN
1
G N EIC H
1
1
M O O R E D M O O R E D
M O O R E D 3
M O O R E D 2
M O O R E B
6M O O R E B
4
W ITTM AN 3
MOORE DP 6 MOORE B-P TW IN 4MOORE DP 5
Simulated Horizontal Well #1
Vertical Infill vs. Horizontal Infill Schaben Field
Reservoir SimulationPerformance Prediction

10,000
1,000
100
10
1365 730 1095 1460 1825 2190
Cu
mu
lati
ve M
ST
B
Tim e (days from 1/1/1997)
1st Year Oil Production 5 Yr. Oil Production
1st Year Water Production 5 Yr. Water Production
184.0 mstb - 1 Horizontal Infill 337.2 mstb - 1 Horizontal Infill
820.9 5,486.1
99.4 mstb - 3 Vertical Infill 233.4 mstb - 3 Vertical Infill
425.3 2,725.5
46.2 mstb - No Infill
262.1 1,593.5
3 Vertical Infills vs. 1 Horizontal Infill
Boast VHS Performance Prediction
Reservoir SimulationPerformance Prediction

Numerous Targets Regional Level
Numerous Targets Regional Level

Ness City North Field
Numerous Targets Local Level
Numerous Targets Local Level

Reservoir Heterogeneity
Strong Horizontal Heterogeneity 10’ - 100’ Interval Karst Controlled
Result Poor Lateral Drainage
Strong Horizontal Heterogeneity 10’ - 100’ Interval Karst Controlled
Result Poor Lateral Drainage

Economic Success $?$?$?
IP: 85 BOPD & 54 BWPD
Daily Prod:
55 BO& 50 BW
1000’ of fluid over pump
Current Daily Prod:
18 BO & 32 BW
Pumped off
Cum Prod: 3,417 BO (7/31/00)
Plan to work over in September
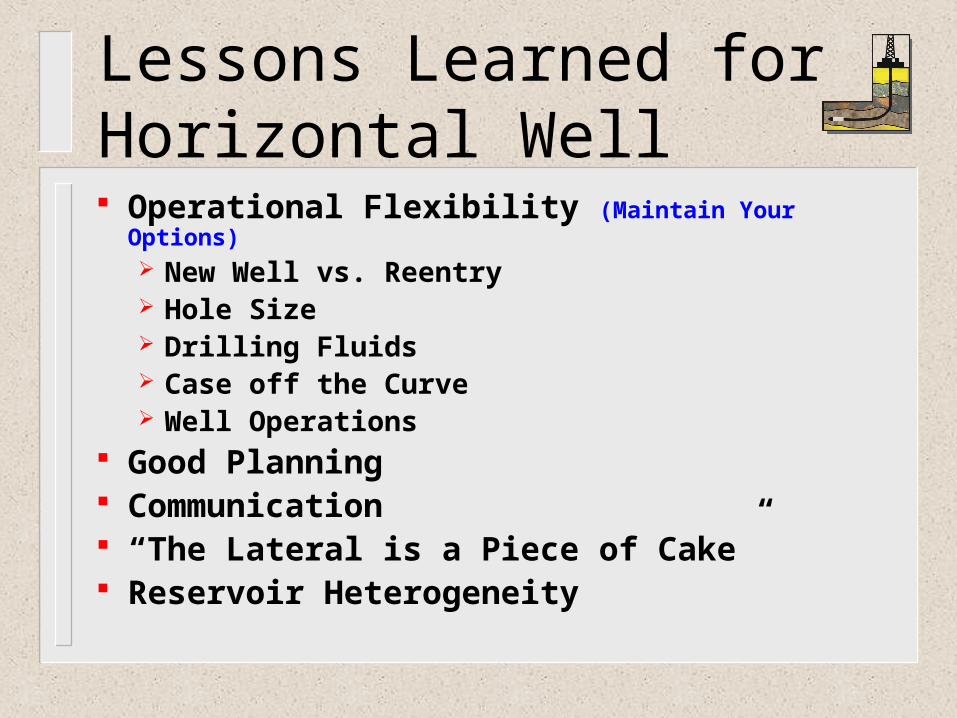
Lessons Learned forHorizontal Well Operational Flexibility (Maintain Your Options)
New Well vs. Reentry Hole Size Drilling Fluids Case off the Curve Well Operations
Good Planning Communication “The Lateral is a Piece of Cake” Reservoir Heterogeneity

Reservoir CharacterizationGeologic Model
Geologic model: log (GR, Res), core, production, DST data
Maps & cross-sections of Mississippian sub-units: 5 layered reservoir model

Reservoir CharacterizationPetrophysical Model
Log K (eff. Klink) vs. Phi y = 0.1361x - 1.7989
R2 = 0.43
y = 0.1251x - 1.2269
R2 = 0.5407
y = 0.1401x - 2.3942
R2 = 0.6537y = 0.0815x - 2.5567
R2 = 0.209
-3.0
-2.0
-1.0
0.0
1.0
2.0
3.0
0 5 10 15 20 25 30
Phi (%)
Lo
g K
(m
d)
Moldic Pckst Moldic Pck-WckstMudstone WckstoneLinear (Moldic Pck-Wckst) Linear (Moldic Pckst)Linear (Wckstone) Linear (Mudstone)
41 core plugs from wells in study area

Reservoir CharacterizationInitial Reservoir Model
Sparse porosity logs
DST and IP average K
HP1>HP2>LP2
>LP1& LP3
Assumptionuniform K for
each layer
Frequency histogram of core permeability
0
5
10
15
20
25
0 5 10 15 20 25 30 35 40 45 50 55 60 65 70 75
Insitu Klinkenberg horizontal K, md
Fre
qu
ency
Class 1: LP1 & LP3, 8 md
Class 2: LP2, 25 md
Class 3: HP2,40 md
Class 4: HP1,60 md

Reservoir CharacterizationInitial Reservoir Model
Identification of dominant lithofacies - core studies
LP1, LP2, LP3 –
Moldic Wackestone
HP1 & HP2 –
Moldic Packstone
Layer porosity –
from phi-K correlation, and
dominant lithofacies
Sub Phi, % K, mdunit
LP1 15 8LP2 21.5 25LP3 15 8HP1 23.6 60HP2 22.2 40

Reservoir CharacterizationSwi - Core Plugs
Swi @ 150
ft above OWC
Variation of Swi with porosity y = -2.0764x + 55.709
R2 = 0.4884
0102030405060708090
100
0 5 10 15 20 25 30
Phi, %
Sw
i, %
Swi - Pck Swi - PckWck Swi-Wck
Swi-Mudst Linear (Swi - Pck)

Reservoir CharacterizationSorw - Core Plugs
Variation of Sorw with porosity
0
5
10
15
20
25
30
35
40
0 5 10 15 20 25 30
Phi
So
rw
Sorw-Pck Sorw-PckWck Sorw-Wck
Sorw averaged in each cluster

Reservoir CharacterizationRelative Permeability
Honarpour’s correlation - intermediately wet carbonates
Relative permeability profiles
0.0
0.1
0.2
0.3
0.4
0.5
0.6
0.7
0.8
0.9
1.0
0 0.1 0.2 0.3 0.4 0.5 0.6 0.7 0.8 0.9 1
Sw (fraction)
Re
lati
ve
K (
fra
cti
on
)
Krw - HP1 Krow - HP1 Krw - HP2 Krow - HP2
Krw - LP2 Krow(f) - LP2 Krw - LP1&3 Krow(f) - LP1&3

Reservoir CharacterizationCapillary Pressure
Cap Pr - Ness City
0
2
4
6
8
10
0 10 20 30 40 50 60 70 80 90 100
Sw
Br-
HC
, p
si
HP1,Pck 55md,24% HP2,Pck,33md,22%
LP2,PckWck,24md,19% LP1&3,Pck,8md,17%

Engineering AnalysisDST Interpretation
Pressure declined by 450 psi over a period of 17 years
Ness City North Fieldy = -0.0587x + 2953.3
R2 = 0.9316
0
200
400
600
800
1000
1200
1400
1600
Dec-75
No
v-79
No
v-83
No
v-87
No
v-91
No
v-95
No
v-99
Pi,
psi

Engineering AnalysisProduction History Reconstruction
WOR vs. cumulative production y = 0.0001x
R2 = 0.6933
y = 0.0008x
R2 = 0.684
y = 0.0068x
R2 = 0.6882
0
20
40
60
80
100
120
140
0 50000 100000 150000 200000
Cum Oil prod. STB
WO
R
Ummel#1 Ummel#2 Ummel#3 Linear (Ummel#1)Linear (Ummel#2 ) Linear (Ummel#3)
Limited water production data available

Engineering AnalysisProduction History Reconstruction
Lease production - allocated to wells
Water production approximated when data unavailable -Ummel #2
Cumulative comparison - well production
100
1000
10000
100000
1000000
0 2000 4000 6000 8000 10000
Days produced
Cu
mu
lati
ve
pro
du
cti
on
(S
TB
)
Ummel #1 Ummel #2Ummel #3 Pfannenstiel #2Pfannenstiel #1 Pfannenstiel #1-24Pember A5
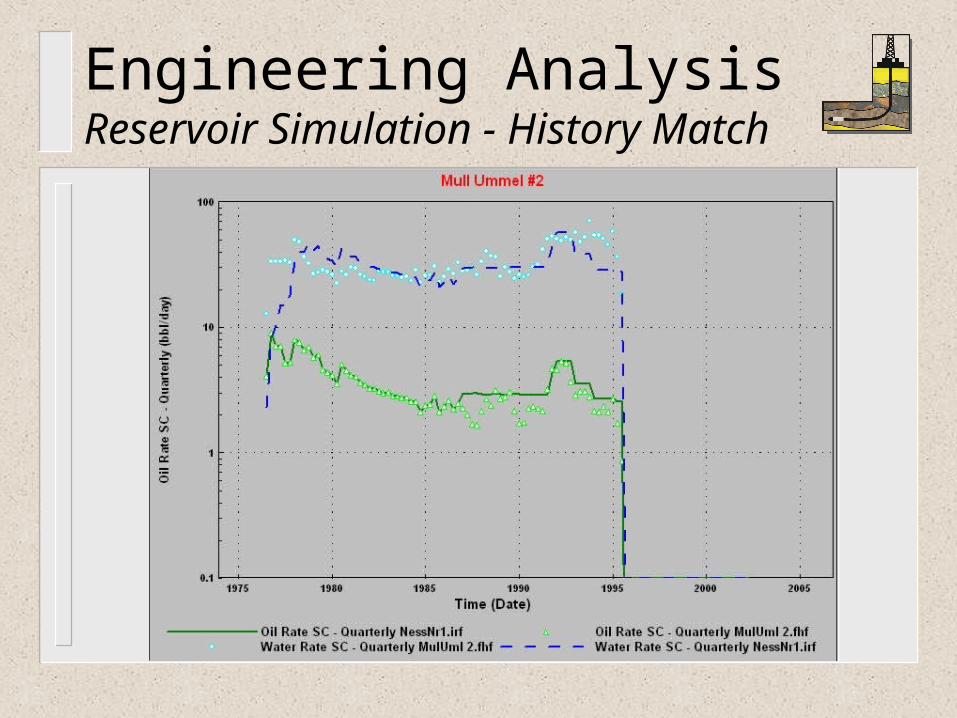
Engineering AnalysisReservoir Simulation - History Match

Reservoir SimulationResidual Potential - So-ft, 2000

Performance PredictionPerformance Prediction - Infill
Rate performance & best case - Ummel #4 Hskin = 4.5, Pwf = 675 psi, effective producing
length = 400 ft
76
2829.946.6 37.5 32.8
22.72425.9
143
3728.5
214211198 206
186
153
60.7
163160134
148.7 155.5
5551
0
50
100
150
200
250
300
Dec-99 Dec-00 Dec-01 Dec-02 Dec-03 Dec-04 Dec-05
Av
era
ge
qu
art
erl
y b
bl/d
Qo Qo - bestQw Qw - bestQo - avg 2 mnths Qw - avg 2 mnths
Oil Oil (b) Wtr Wtr (b)1st yr 18803 23526 59208 372322nd yr 32128 33560 126069 86816

Original Plugged Well


Drill Out Cement & Set CIBP

Set Whipstock - Mill Casing

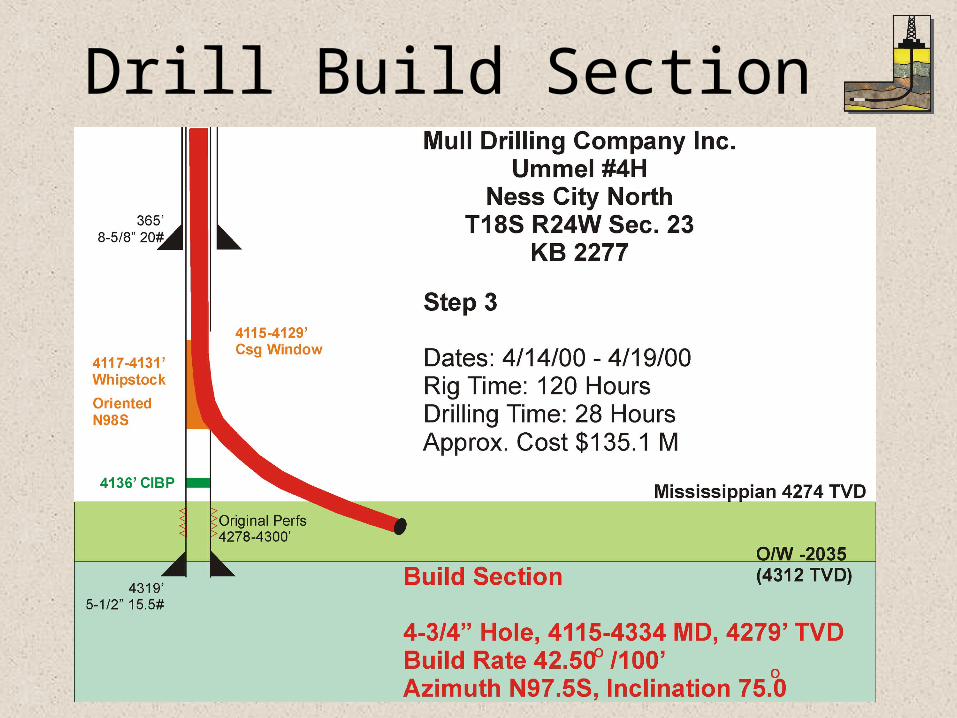
Drill Build Section


Drill Lateral Section


Set Liner

Final Completion

Rig Time & Job Costs
Work Performed
Approximate Rig Hours
% of Total
Approximate Workover Costs
% of Total
Drilling out cmt & setting CIBP 82.0 23.5 $26.4 M 10.6 Setting whipstock & milling casing 84.5 24.2 $24.2 M 9.8
Drilling build section (actual drilling time)
120.0 (27.8)
34.4 (8.0)
$135.1 M
54.4
Drilling lateral section (actual drilling time)
52.0 (32.8)
14.9 (9.4)
$44.3 M 17.8
Setting liner through the curve 10.0 2.9 $18.2 M 7.3
Totals 348.5 100 $ 248.2 M 100

Lessons Learned forHorizontal Well Operational Flexibility (Maintain Your Options)
New Well vs. Reentry Hole Size Drilling Fluids Case off the Curve Well Operations
Good Planning Communication “The Lateral is a Piece of Cake” Horizontal Heterogeneity
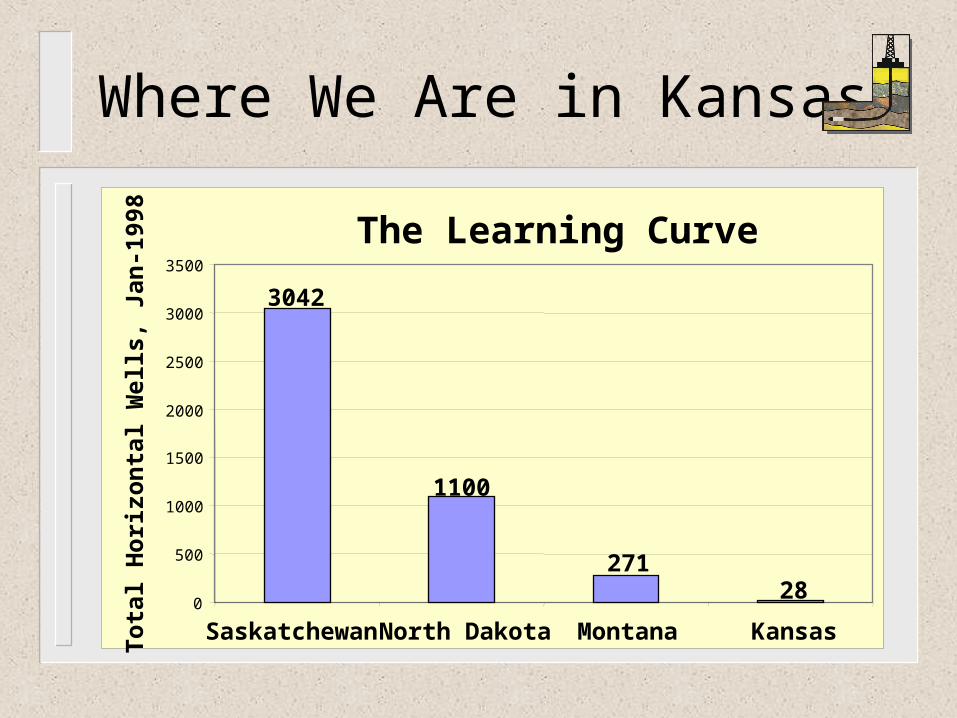
The Learning Curve
3042
1100
27128
0
500
1000
1500
2000
2500
3000
3500
Saskatchewan North Dakota Montana Kansas
To
tal
Ho
rizo
nta
l W
ells
, Ja
n-1
998
Where We Are in Kansas