Embed Size (px)
Citation preview

NGM 2016 Reykjavik
Proceedings of the 17th Nordic Geotechnical Meeting
Challenges in Nordic Geotechnic 25th – 28th of May
IGS 513 NGM 2016 Proceedings
A Case Study of the Interaction between a Pile and Soft Soil
focusing on Negative Skin Friction using Finite Element Analysis
P. Belinchon
Aarhus University, Department of Engineering, Denmark, [email protected]
K. K. Sørensen
Aarhus University, Department of Engineering, Denmark
R. Christensen
Rambøll and Aarhus University, Aarhus School of Engineering, Denmark
ABSTRACT
This paper presents the findings of an investigation carried out with numerical methods in order to
evaluate the interaction between a driven concrete pile and soft organic clay (gyttja) in the case
where the soft soil is experiencing settlement relative to the pile. A numerical model was
developed based on a full-scale field test that was carried out to investigate the effects of bitumen
coating on the development of negative skin friction on driven concrete piles. The bitumen was
modelled with interface elements and was controlled by the strength reduction factor Rinter.
Relevant soil and pile properties were partly obtained from laboratory testing. Numerical and
analytical solutions were compared with field test results. Two consecutive scenarios were
considered. The first scenario assumed a slightly over consolidated soft soil loaded vertically to
around the preconsolidation pressure through the addition of a fill layer at ground level. This
scenario reflects the conditions under which the field test was carried out. For the second
scenario, additional loading was applied to bring the soft soil into a normally consolidated state.
No field results were available for comparison since this scenario will be the next step of the
experimental project. Hence, the first part served as a check against the observed field behaviour
whilst the second part is used to predict future behaviour.
Keywords: soft soil, finite element modelling, negative skin friction, soil-pile interaction.
1 INTRODUCTION
When loading a single pile driven into soft
soil, shaft and base resistance will mobilise to
carry the load. Subsequent surface loading of
the soft soil is likely to result in settlement of
the soil relative to the pile. As a consequence,
down drag forces will appear along the pile
shaft where the soil settles more than the pile
(Fellenius, 1984). This effect is called
negative skin friction and can be a problem
since it increases the working load of the pile
(Tomlinson and Woodward, 2008).
It is common practice in Denmark to
apply bitumen coating to the top part of
precast concrete piles in order to reduce
negative skin friction (Møller et al. 2016). On
the basis of the case study presented below, a
numerical model is created and presented that
investigates the interaction between a pile
and soft soil, with emphasis on the
development of negative skin friction.
2 CASE STUDY
In 2013, the Research Group of Geotechnical
Engineering at Aarhus University in
collaboration with Per Aarsleff A/S and
Centrum Pæle A/S initiated a project to study
the effects of bitumen coating on the
development of negative skin friction for
driven concrete piles in soft soils.
A full-scale pile test setup was established
at Randers Harbour, Denmark. It consisted of
four test piles (T) and five reaction piles (R)
installed in a row with 3 m centre-centre
spacing. A longitudinal section view of the

Modelling, analysis and design
NGM 2016 Proceedings 514 IGS
test setup is illustrated in Figure 1. All piles
are precast reinforced concrete piles with a
square cross-section (0.25 m width). Bitumen
coating was applied to test piles T1 and T3.
Piles T2 and T4 are not coated. A HE 280 M
beam is directly supported by the reaction
piles. The test piles are connected to the
beam through an anchor. A load cell is
installed between the beam and the anchor, as
shown in Figure 2, so the total down drag
force on the test pile could be measured.
Figure 2 Anchor and load cell at the top of the
test pile (after Ventzel and Jensen, 2013).
Other in situ instrumentation comprised
four piezometers and four magnetic
extensometers located at different depths
approx. 1.5 m from R1 (away from the pile
row). These have been used to monitor the
pore water pressures and the settlements of
the soil respectively.
The ground investigation (CPT and
boreholes) carried out prior to pile
installation showed the soil stratigraphy to
consist of: 1.0-1.3 m of fill overlain by 6.5-
9.5 m layer of soft organic clay (gyttja) over
sand (with gravel). The water table (WT) was
at the top of the soft clay (Ventzel and
Jensen, 2013).
After pile installation and a period of rest,
0.8 m of fill was placed around the piles to
initiate settlement in the soft soil below and
hence to generate negative skin friction on
the piles. Monitoring of the field test is still
on-going, and the results are yet to be
published. Preliminary results have been
presented by Sorensen (2015).
3 FINITE ELEMENT MODEL
A numerical model has been developed to
simulate and further analyse the full-scale
field test. The Finite Element software
PLAXIS 2D AE is used in the analysis.
A single pile is considered in an
axisymmetric model to represent test piles T1
and T2 (pile length of 9.75 m with pile toe at
a depth of 8.75 m below original ground
level). The original square cross-section is
Figure 1 Cross-section of the pile test setup in Randers before terrain loading (Ventzel and Jensen, 2013).
All levels are in meters above mean sea level (DVR90)
Figure 1 Longitudinal section view of the pile test setup in Randers before terrain loading (after Ventzel
and Jensen, 2013). All levels are in meters above mean sea level (DVR90). Distances are in meters.

A Case Study of the Interaction between a Pile and Soft Soil focusing on Negative Skin Friction
using Finite Element Analysis
IGS 515 NGM 2016 Proceedings
converted to an equivalent circular cross-
section (radius = 16 cm) with the same
perimeter (1 m), i.e. the same shaft surface.
The model has a radius of 15 m, large
enough to minimise boundary effects. The
mesh is formed by 15-noded elements with
“fine” global coarseness. WT is assumed at
the top of the gyttja. The analysis is carried
out as long-term drained. Figure 3 shows the
FE model in Plaxis.
Figure 3 FE model in PLAXIS.
The initial conditions of the soil are
obtained by the K0-procedure followed by a
plastic calculation. A subsequent plastic
calculation phase is applied to activate the
pile, anchor and interface elements. At this
stage all displacements are reset to zero.
Two scenarios are considered. In Scenario
1, a surface load is applied by placing an
additional 0.8 m of fill at ground level (y = 0
m) with a radius R = 5.8 m. The full-scale
field setup reflected this scenario, thus
numerical and field results can be compared.
In Scenario 2, further loading of the ground
level is simulated. The additional applied
load ranges from 15 to 50 kPa, and the results
are used to predict future behaviour (field test
results are presently not available for
comparison with the FE model).
The main limitation of the 2D numerical
model of a single pile compared to the field
setup is that group effects cannot be studied.
However, for one row with 3 m centre-centre
spacing between the piles (approximately 10
times the diameter) group effects can be
neglected according to previous research
(Comodromos and Bareka, 2005), (Jeong et
al., 1997). Furthermore, as the reaction piles
surrounding the test piles have been coated
with bitumen in the settling soil layers, this
significantly reduces their influence on the
settlement of the soil around the test piles.
3.1 Soil models and parameters
The stratification and soil properties assumed
in the model are presented in Table 1.
Drained (D) parameters are specified in all
cases. The properties of the existing and
additional fill (soft organic sandy silty clay)
and sand layers have been roughly estimated
based on the soil description and ground
investigation. Simple Mohr-Coulomb (MC)
model parameters are used to represent these
layers.
Since the settlement and soil-pile
interaction is mainly controlled by the
properties of the soft organic layer, these
properties have in contrast been determined
based on laboratory testing (direct shear tests
and oedometer tests) carried out by students
from Aarhus School of Engineering (Brandt
et al., 2015).
3.1.1 Soft organic clay (gyttja)
A soft soil model is chosen to represent the
behaviour of the soft organic soil layer, as it
is important to reflect accurately the changes
in stiffness and strength of the soil with
compression. The soft soil model has a
logarithmic compression behaviour
controlled by the modified compression
index λ* and the modified swelling index κ*
as defined in Figure 4.
The results from oedometer tests have
shown the soft organic soil to be slightly
overconsolidated. The assumed value of the
pre-overburden pressure (POP) is given in
Table 1.
In scenario 1, the soft soil experience
reloading from a slightly over consolidated
state up to around the preconsolidation
pressure, i.e. settlement depends primarily on
κ*. While, in scenario 2 where the soil is
further loaded, the settlement is primarily
governed by the compression of a soil in a
normally consolidated state and the
parameter λ*.

Modelling, analysis and design
NGM 2016 Proceedings 516 IGS
Figure 4 Logarithmic relation between
volumetric strain and mean stress (Brinkgreve et
al., 2014).
3.2 Pile
A linear elastic model is used for the concrete
pile. It is a simple constitutive model but it
represents adequately the behaviour of the
pile for the stress levels applied. Parameters
are given in Table 2.
Table 2 Pile parameters.
Parameter Pile
Material model Linear elastic
Drainage type Non-porous
Density γ [kN/m3] 24
Young’s modulus E [GPa] 26
Poisson ratio ν [-] 0.2
3.3 Interface
Interface elements are used to model the pile-
soil interaction. They are placed along the
vertical limit surface between the pile and
soil, from the pile top to 0.5 m below the
bottom of the pile (see Figure 5). This extra
length is very important to avoid non-
physical stress oscillations in the corner.
Interface elements are also placed at the base
of the pile. The roughness between the pile
and the soil is defined by a strength reduction
factor Rinter.
Figure 5 Detail of the interface at the pile toe.
3.4 Anchor
The pile is assumed vertically restrained at
the top. This is modelled with a fixed-end
anchor element. A linear elastic material
model is used to define the anchor, where the
value of EA = 160,850 kN is determined
based on the stiffness of four M16 steel bolts
(shown in Figure 2) with a total area A = 256
mm2 and a Young’s modulus E = 200,000
MPa.
4 ANALYSIS OF SCENARIO 1
4.1 Settlement of the soil
During the field test, the settlement of the soil
was measured using four extensometers
placed at different depths and, approximately,
1.5 m away from reaction pile R1. The
measured settlements 315 days after loading
(the additional fill layer of 0.8 m) are shown
in Figure 6. At this point the pore water
pressure and time-settlement curves indicated
nearly full consolidation of the soft soil layer
(Sorensen, 2015).
Table 1 Soil parameters and initial stratification. Parameter Fill Gyttja Sand
Ymax [m] 0 -1 -10.5
Ymin [m] -1 -10.5 -15
Material model MC Soft soil MC
Drainage type D D D
Density γ [kN/m3]
18 14 16
Young’s modulus E'
[kN/m2] 10,000 - 30,000
Poisson ratio ν'
[-] 0.25 - 0.3
Eff. cohesion c'ref [kN/m2]
6 2 1
Eff. angle of friction φ' [˚]
25 25 35
Angle of dilantancy Ψ [˚]
0 0 0
Mod. compr.
index λ* [-] - 0.1013 -
Mod. swelling
index * [-] - 0.0231 -
Pre-overburden pressure POP
[kN/m2] - 15 -

A Case Study of the Interaction between a Pile and Soft Soil focusing on Negative Skin Friction
using Finite Element Analysis
IGS 517 NGM 2016 Proceedings
Two analytical solutions and the FE
PLAXIS solution (at x=1.5 m, using λ* =
0.1013 and * = 0.0231) are also shown in
Figure 6 for comparison.
In Analytical Approach A (AA-A), a
simple linear relation between settlement (s)
and variation of vertical effective stress (σ'v)
is assumed using a constant value of stiffness
Eoed.
𝑠 =1
𝐸𝑜𝑒𝑑· ∆𝜎′𝑣,𝑖 ·𝐻0,𝑖𝑖
(1)
An initial thickness of sublayers H0,i = 0.5
m is considered. An oedometer modulus Eoed
= 4000 kPa was obtained directly from
oedometer tests at an appropriate stress
interval.
𝐸𝑜𝑒𝑑 =∆𝜎∆𝜀
(2)
The linear variation of Eoed relative to
stress was investigated but over the small
stress range, the variation in Eoed values
obtained from the oedometer testing showed
little effect on the results.
In Analytical Approach B (AA-B)
settlement of the soft soil is based on the
logarithmic relation (in reloading) between
volumetric strain (εv) and mean stress (p')
(Brinkgreve et al., 2014).
𝜀𝑣𝑒 − 𝜀𝑣
𝑒0 = −𝜅∗ · ln𝑝′
𝑝0
(3)
If the vertical strain is assumed equal to
the volumetric strain (no horizontal strain)
the settlement can be estimated from Eq. (4).
𝑠 = 𝜅∗ · ∆ ln𝑝′𝑖 · 𝐻0,𝑖𝑖
(4)
As seen from Figure 6 the measured
settlements at levels y = -7.1 m and y = -10.1
m are identical. This suggests that the
stiffness of the soil at these depths is very
large, something not anticipated for this level
of stresses. It is probable that measurements
from the extensometer at y = -7.1 m are
erroneous due to relative movement between
the soil and the extensometer.
Generally, it can be observed that the
Plaxis model fairly accurately predicts the
measured settlements. AA-A gives results
that are fully comparable with the Plaxis
results up to a level approximately 4 meters
below ground level. Near the ground level,
where the stresses are small, AA-A
underpredicts the settlement compared to
Plaxis. This may be explained by the
differences in the logarithmic (PLAXIS) and
linear (AA-A) strain-stress relation used.
Figure 6 Settlement profile.
AA-B is seen to result in a significant over
estimation of the settlements compared to the
other solutions and the field results. The main
reason for this discrepancy is the assumption
of zero horizontal strain, which is not likely
to be true. An analytical solution using *
(and λ*) requires further investigation.
4.2 Effect of Rinter on the relative settlement
between soil and pile
The relative settlement between soil and pile
from the PLAXIS model is shown in Figure
7. No neutral point (defined as the point at
which the settlement of the pile equals the
settlement of the soil) is found since the soil
settles more than the pile at all depths. A
decrease of the strength reduction factor Rinter
leads to an increase in relative settlement due
to both larger settlement of the soil and
smaller settlement of the pile. As discussed in
section 4.3, this results in less negative skin
friction. Figure 7 also shows that none or
very small relative settlement occurs at the
pile top. This is due to the low confining

Modelling, analysis and design
NGM 2016 Proceedings 518 IGS
pressure of the fill at the boundary zone. In
addition, the cohesion of the fill (6 kPa)
results in the soil adhering to the pile top. If
c' = 0, the relative settlement would be
greater at the top. However, this effect only
occurs for a small length (a few centimetres)
and it does not affect the results significantly.
Figure 7 Relative settlement soil-pile.
Figure 8 shows the settlement of the
original ground level at distances x from the
centre of the pile for different values of Rinter.
As the movement of the pile is restrained by
the anchor it hinders the settlement of the
surrounding soil for high values of Rinter. For
low values of Rinter the soil is barely affected
by the presence of the pile.
Regarding the previous section, Figure 8
also shows that the settlement of the soil at x
= 1.5 m varies a few mm depending on Rinter.
However, the difference is very small
compared to results from AA-B (Fig. 6).
Figure 8 Settlement of the original ground level
(y = 0 m) at x distance from pile centre.
4.3 Effect of Rinter on shear stresses along
the pile shaft
As discussed, the soil settles more than the
pile at all depths. Hence, negative skin
friction develops along the entire length of
the pile. However, the maximum shear
stresses are not mobilised over the full length
of the pile as seen in Figure 9.
Figure 9 Shear stresses along the pile shaft
(black line for mobilised shear stress and grey
line for maximum shear stress).
Table 3 shows the total down drag force
Fneg developed along the pile shaft and the
relative settlement srel required to mobilise
full skin friction for the different Rinter values.
It shows that a reduction in Rinter leads to
less Fneg and that the relative settlement
required for full skin friction to develop
increases. Higher settlement normally gives
higher mobilised friction, but since Rinter is
reduced, mobilised friction is less.
Table 3 Total down drag forces and relative
settlement to mobilise full skin friction in the FE
model.
Rinter 1 0.7 0.4 0.12
Fneg (kN) 111 77 40 6
srel (mm) 5 7 12 33
Based on the results of direct shear
interface tests Rinter = 1 is considered for the
uncoated piles and Rinter = 0.12 for the coated
piles. Rinter = 1 might be too high since a rigid
interface implies that the soil is able to
transfer the full shear stress to the pile which

A Case Study of the Interaction between a Pile and Soft Soil focusing on Negative Skin Friction
using Finite Element Analysis
IGS 519 NGM 2016 Proceedings
results in a very large Fneg (111 kN). The
actual Rinter values might be lower since piles
are precast and have a fairly smooth concrete
surface. For bitumen coated piles Rinter = 0.12
is considered and numerical results show that
Fneg = 6 kN. This suggests a reduction of 95
% in Fneg due to the effect of the bitumen
coating. The field test results show that 1
year after surcharging, Fneg = 4 kN on the
coated test pile T1. 41 kN are registered on
uncoated test pile T2 with values further
increasing.
Greater Fneg values are obtained from the
numerical FE model compared to the field
test results. This may be caused by an over
estimation of Rinter values, especially in the
case of the uncoated piles. The reduction in
negative skin friction as a function of Rinter is
in good agreement with results from similar
studies (El-Mossallamy et al., 2012) but
using Rinter = 1 leads to excessively large Fneg.
Finally, field test results do not assume any
resistance force at the pile base whilst in the
numerical model this force is approx. 3 kN.
4.4 Effect of anchor stiffness and position
In order to understand better the effect of the
anchor the scenario of a floating pile is
presented. The same model is used but the
anchor is not activated. As the only boundary
condition of the pile is the surrounding soil
(shaft and base) equilibrium of forces impede
negative skin friction to develop along the
whole length of the pile.
Figure 10 shows the relative settlement
between the soil and the pile for this scenario.
The soil settles more than the pile in the
upper part (above the neutral point) leading
to the development of negative skin friction.
Below the neutral point the pile settles more
than the soil and positive (upwards) shaft
resistance is mobilised. The position of the
neutral point is found to be affected by Rinter.
If the anchor is activated, then the
movement of the pile is restrained and larger
negative shear stresses are developed along
the pile-soil interface. The movement of the
pile depends on the stiffness of the anchor.
This has an influence on Fneg as shown in
Figure 11. Different values of EA are
considered. One can identify three trends in
the series. For low values of EA, Fneg is not
affected significantly by the presence of the
anchor since the movement restriction is not
high enough to allow negative skin friction
along the full length of the pile. However,
when greater EA is adopted, negative skin
friction is mobilised along the full length and
Fneg increases. For EA > 105 kN an increase
of stiffness does not significantly affect Fneg.
Figure 10 Effect of anchor stiffness on the
relative settlement between soil and pile.
Figure 11 Dependency of total down drag force
on anchor stiffness for different values of Rinter.
Consider that in the model, EA = 160,850
kN. Therefore, a higher stiffness of the
anchor would not increase Fneg significantly
while a lower stiffness would lead to a lower
Fneg. In other words, an under estimation of
EA is not a problem in this model while an
over estimation of EA might lead to
excessive Fneg. Nevertheless, it is important
to say that an equivalent length of 1 m has
been used in the model while in the field
Modelling, analysis and design
NGM 2016 Proceedings 520 IGS
setup the anchor length is approximately 70
cm resulting in a greater stiffness (the actual
stiffness is EA/L but for practical reasons EA
is used in the text as the anchor stiffness,
since L = 1 m is considered). Also, the
anchor was moved to other positions (0 < x <
0.16 m) but no significant effects were
noticed.
4.5 Effect of stiffness parameters of soft
soil
The overburden pressure due to the addition
of 0.8 m of fill is equal to 14.4 kPa, slightly
lower than the pre-overburden pressure (POP
= 15 kPa). Settlement of the soil should be
only affected by κ*. Different values from
laboratory testing were used (0.0174-0.0285).
The best fit between field and numerical
settlement results was obtained for κ* =
0.0231 - the value given in Table 1.
On the contrary, λ* is not expected to have
an influence on the results for scenario 1.
Oedometer tests suggest that λ* values range
from 0.1013 to 0.1377 (0.1013 has been
assumed in the previous analysis). It has been
checked that both values result in the same
settlement profile at x = 1.5 m. However,
small variations have been found regarding
the relative settlement and shear stresses
along the pile shaft, which affects Fneg as
seen in Table 4.
Table 4 Effect of λ* on down drag forces.
Rinter
1 0.7 0.4 0.12
λ* Fneg (kN)
0.1013 111 77 40 6
0.1377 104 71 35 5
Contrary to the anticipated results, an
increase of λ* (softer soil in the normally
consolidated state) leads to a decrease in
shear stresses at the lower part of the pile
shaft resulting in less Fneg. It has been
checked that no point of the soil has reached
its pre-consolidation pressure, confirming
that soil behaviour should not depend on λ*.
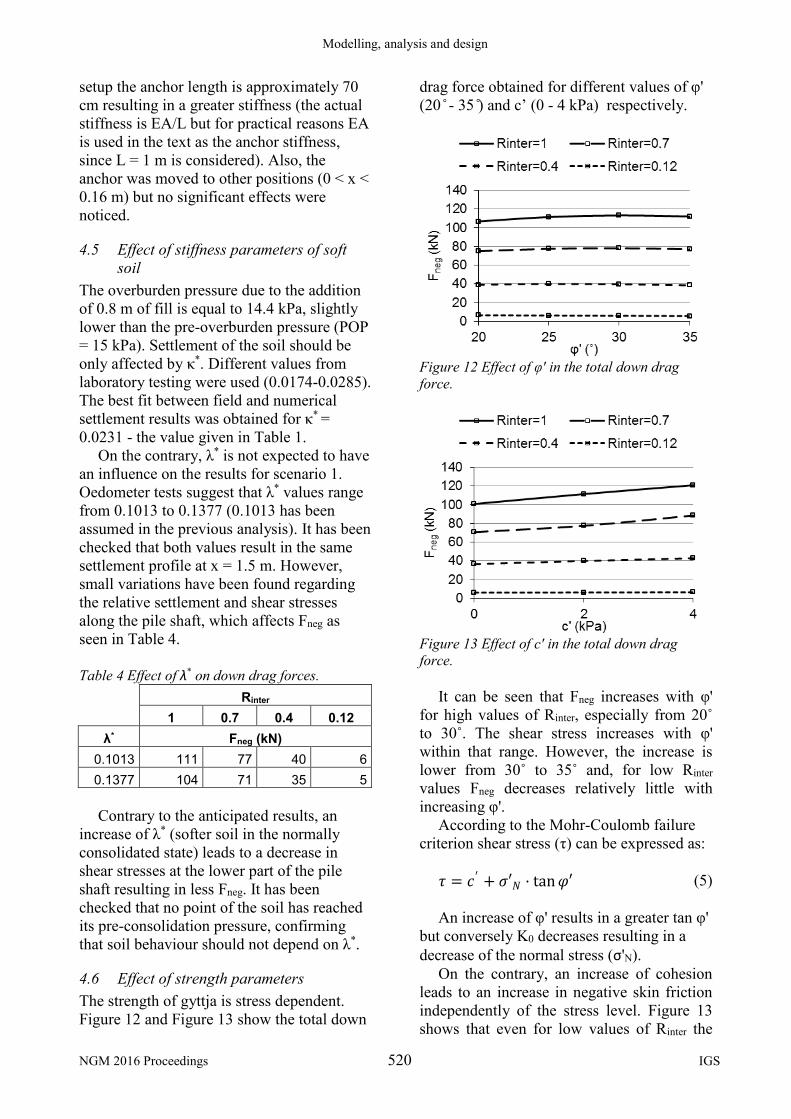
4.6 Effect of strength parameters
The strength of gyttja is stress dependent.
Figure 12 and Figure 13 show the total down
drag force obtained for different values of φ'
(20 ̊ - 35 ̊) and c’ (0 - 4 kPa) respectively.
Figure 12 Effect of φ' in the total down drag
force.
Figure 13 Effect of c' in the total down drag
force.
It can be seen that Fneg increases with φ'
for high values of Rinter, especially from 20˚
to 30˚. The shear stress increases with φ'
within that range. However, the increase is
lower from 30˚ to 35˚ and, for low Rinter
values Fneg decreases relatively little with
increasing φ'.
According to the Mohr-Coulomb failure
criterion shear stress (τ) can be expressed as:
𝜏 = 𝑐′ + 𝜎′𝑁 · tan𝜑′ (5)
An increase of φ' results in a greater tan φ'
but conversely K0 decreases resulting in a
decrease of the normal stress (σ'N).
On the contrary, an increase of cohesion
leads to an increase in negative skin friction
independently of the stress level. Figure 13
shows that even for low values of Rinter the

A Case Study of the Interaction between a Pile and Soft Soil focusing on Negative Skin Friction
using Finite Element Analysis
IGS 521 NGM 2016 Proceedings
total down drag force increases with c'.
Hence, the effect of cohesion is greater
compared to the effect of friction angle for
the investigated range.
5 ANALYSIS OF SCENARIO 2
5.1 Settlement of soil
Figure 14 shows the settlement profile at x =
1.5 m for different load values (q) and range
of λ* obtained from laboratory testing.
If in scenario 1 the maximum settlement
was about 30 mm, then in scenario 2 the soil
experiences a much greater settlement for a
similar increase in the overburden pressure
(109 mm of total settlement for q = 15 kPa).
This is due to the soil being loaded to a
normally consolidated state. For higher q the
difference in settlement due to variation of λ*
is higher since more soil is normally
consolidated and, hence, settlement is
governed by λ*.
Figure 14 Settlement profile after applying
different additional loads (black line for λ* =
0.1013 and grey line for λ* = 0.1377).
5.2 Negative skin friction
In Table 5 numerical values for down drag
forces are shown. Scenario 1 corresponds to
q = 0 kPa so all results can be compared.
It is important to note that, in
contradiction to expected results, the low
values in the intervals correspond to λ* =
0.1377 which lead to higher settlements of
the soil. It is not quite clear why an increase
of λ* produces a decrease in Fneg and, why
this effect is greater for q = 0 (when the soil
is over consolidated). Hence, this point
requires further investigation.
Table 5 Down drag forces.
Rinter 1 0.7 0.4 0.12
q (kPa) Fneg (kN)
0 104-111 71-77 35-40 5-6
15 130-135 92-96 47-50 8-9
30 153-157 113-115 60-61 12-13
50 187-187 138-138 75-75 16-16
Figure 15 shows the results tabulated in
Table 5. In agreement with previous studies
(Comodromos and Bareka, 2005), (Liu et al.,
2012), an increase of the applied loads results
in greater down drag forces transmitted to the
pile. Also, the effect of soil stiffness on Fneg
disappears for q = 50 kPa, since full negative
skin friction is mobilised along the full length
of the pile. Hence, for the same level of
stresses, larger settlement does not give
higher Fneg.
Figure 15 Down drag forces (black line for λ* =
0.1013 and grey line for λ* = 0.1377).
6 CONCLUSIONS
Based on a full-scale field test, a numerical
model was developed to investigate the soil-
structure interaction between a driven
concrete pile and soft organic clay (gyttja)
with emphasis on the development of
negative skin friction due to settlement of the
soil relative to the pile.
In scenario 1, relative settlement between
the soil and the pile was investigated by

Modelling, analysis and design
NGM 2016 Proceedings 522 IGS
adding 0.8 m of fill at ground level. The
calculated total settlement of the soil was
similar to field test results (30 mm). A simple
analytical solution (AA-A) that considered a
constant stiffness gave comparable results to
the FE model at a depth greater than 4 m
below the ground surface. A more complex
analytical analysis (AA-B) that considered
similar parameters to those adopted in
PLAXIS requires further investigation.
The presence of bitumen was modelled
with interface elements and controlled by the
interface reduction factor Rinter. Based on the
results of direct shear interface tests, Rinter = 1
was considered for the uncoated piles and
Rinter = 0.12 for the coated piles. Numerical
results showed that a reduction of Rinter leads
to greater relative settlement. The presence of
a bitumen coating also reduced the length of
the pile that experienced full mobilised
negative skin friction.
Total down drag forces Fneg from the
numerical model (104-111 kN) were found
greater than the field test results (41 kN) for
the uncoated pile. It was assumed that a rigid
interface mainly caused this. Group effects
were not expected to have a big influence due
to the large centre-centre interspacing and
since the reaction piles are coated with
bitumen within the settling soil layers.
The anchor (stiffness) was found to have
an influence on the relative settlement
between soil and pile and, hence, on Fneg.
Conversely to the anticipated results, the
modified compression index λ* had an effect
on numerical results in scenario 1, although
the analysis did not indicate any part of the
soil matrix to have moved into a normally
consolidated state. An increase of λ* resulted
in a reduction of Fneg, which could not be
explained and requires further investigation.
Numerical results were not significantly
sensitive to the effective friction angle φ', but
an increase of the effective cohesion c'
increased the negative skin friction.
In scenario 2, an additional load q was
applied on top of the fill. For a similar
overburden pressure applied as in scenario 1,
the settlement was approximately three times
greater (most of the soil was expected to
behave in a normally consolidated state). As
expected, the value of λ* had a greater impact
on the settlement with increasing values of q.
However, numerical results for q = 50 kPa
showed that the stiffness had no influence on
Fneg (the load was large enough to mobilise
full negative skin friction along the full
length of the pile).
7 ACKNOWLEDGEMENTS
The authors want to thank Per Aarsleff A/S
and Centrum Pæle A/S for their contribution
to the project, as well as previous students at
Aarhus School of Engineering, who have
been involved in the project and contributed
with field and lab results.
8 REFERENCES
Brandt, E.S., Haugaard, J.A. and Nielsen, N.B.
(2015). Reduktion af negative overflademodstand ved
påføring af bitumen. Bachelor project. Aarhus School
of Engineering, Aarhus University (In Danish).
Brinkgreve, R. B. J., Engin, E. and Swolfs, W. M.
(2014). Plaxis 2D Manual Anniversary Edition.
Comodromos, E.M. and Bareka, S.V. (2005).
Evaluation of negative skin friction effects in pile
foundations using 3D nonlinear analysis. Computers
and Geotechnics 32, 210-221.
El-Mossallamy, Y. M., Hefny, A. M., Demerdash,
M. A. and Morsy, M. S. (2012). Numerical analysis of
negative skin friction on piles in soft clay. HBRC
Journal 9, 68-76.
Fellenius, B. H. (1984). Negative skin friction and
settlement of piles. 2nd International Seminar, Pile
Foundations, Nanyang Technological Institute,
Singapore.
Jeong, S., Kim, S. and Briaud, J. L. (1997).
Analysis of Downdrag on Pile Groups by the Finite
Element Method. Computers and Geotechnics 21 (2),
143-161.
Liu, J., Gao, H. and Liu, H. (2012). Finite element
analyses of negative skin friction on a single pile. Acta
Geotechnica 7, 239–252.
Møller, O. et al. (2016). Design of Piles – Danish
Practice. ISSMGE - ETC 3 International Symposium
on Design of Piles in Europe. Brussels.
Sørensen, K.K. (2015). Fuldskala pæleforsøg på
Randers havn/Full-scale pile testing at Randers
Habour, presentation, www.danskgeoteknisk-
forening.dk, DGF meeting no. 4/2015.
Tomlinson, M. and Woodward, J. (2008). Pile
Design and Construction Practice (5th edition). Taylor
& Francis, London & New York.
Ventzel, G. K. and Jensen, C. S. (2013). Reduktion
af negativ overflademodstand på pæle ved påføring af
bitumen. Bachelor project. Aarhus School of
Engineering, Aarhus University (In Danish).