Embed Size (px)
Citation preview
A CASE STUDY ON AID EFFECTIVENESS IN ETHIOPIAANALYSIS OF THE HEALTH SECTOR AID ARCHITECTURE
Getnet Alemu
WOLFENSOHN CENTER FOR DEVELOPMENT
WORKING PAPER 9 | APRIL 2009
The Brookings Global Economy and Development working paper series also includes the following titles:
• Wolfensohn Center for Development Working Papers
• Middle East Youth Initiative Working Papers
• Global Health Initiative Working Papers
Learn more at www.brookings.edu/global
Editor’s Note:
This paper was commissioned by the Wolfensohn Center for Development at the Brookings Institution. This paper
is one in a series of country case studies that examines issues of aid effectiveness and coordination at the country
level. It does not necessarily refl ect the offi cial views of the Brookings Institution, its board or the advisory council
members. For more information, please contact the Wolfensohn Center at [email protected].
Getnet Alemu is Associate Dean for Graduate
Programs in the College of Development Studies at
Addis Ababa University.
CONTENTS
Introduction . . . . . . . . . . . . . . . . . . . . . . . . . . . . . . . . . . . . . . . . . . . . . . . . . . . . . . . . . . . . . . . . . . . . . . . . . . .1
Trends in total infl ows of Offi cial Development Assistance (ODA) . . . . . . . . . . . . . . . . . . . . . . . . . .1
ODA in the health sector . . . . . . . . . . . . . . . . . . . . . . . . . . . . . . . . . . . . . . . . . . . . . . . . . . . . . . . . . . . . 2
Why focus on health sector . . . . . . . . . . . . . . . . . . . . . . . . . . . . . . . . . . . . . . . . . . . . . . . . . . . . . . . . . . 4
Macroeconomic performance and MDG indicators . . . . . . . . . . . . . . . . . . . . . . . . . . . . . . . . . . . . . . 5
Objectives, methodology and structure of the study . . . . . . . . . . . . . . . . . . . . . . . . . . . . . . . . . . . . 7
Country Programmable Aid (CPA) . . . . . . . . . . . . . . . . . . . . . . . . . . . . . . . . . . . . . . . . . . . . . . . . . . . . . . . 8
Emerging Aid Providers in the Health Sector . . . . . . . . . . . . . . . . . . . . . . . . . . . . . . . . . . . . . . . . . . . . . 10
Magnitude of resources for the health sector . . . . . . . . . . . . . . . . . . . . . . . . . . . . . . . . . . . . . . . . . . 11
Alignment with government systems and priorities and their effect on the health system . . 13
Fragmentation of Aid . . . . . . . . . . . . . . . . . . . . . . . . . . . . . . . . . . . . . . . . . . . . . . . . . . . . . . . . . . . . . . . . . . 15
Fragmentation of total ODA . . . . . . . . . . . . . . . . . . . . . . . . . . . . . . . . . . . . . . . . . . . . . . . . . . . . . . . . 15
Aid fragmentation in the health sector . . . . . . . . . . . . . . . . . . . . . . . . . . . . . . . . . . . . . . . . . . . . . . . 16
Aid Predictability and Volatility . . . . . . . . . . . . . . . . . . . . . . . . . . . . . . . . . . . . . . . . . . . . . . . . . . . . . . . . . 20
Aid Coordination . . . . . . . . . . . . . . . . . . . . . . . . . . . . . . . . . . . . . . . . . . . . . . . . . . . . . . . . . . . . . . . . . . . . . 28
Instruments of coordination . . . . . . . . . . . . . . . . . . . . . . . . . . . . . . . . . . . . . . . . . . . . . . . . . . . . . . . 28
Structures and mechanisms for dialogue . . . . . . . . . . . . . . . . . . . . . . . . . . . . . . . . . . . . . . . . . . . . 28
Monitoring and evaluation frameworks and their success/failure in achieving the objectives . 30
Results from survey of monitoring Paris Declaration . . . . . . . . . . . . . . . . . . . . . . . . . . . . . . . . . . 31
Key Challenges . . . . . . . . . . . . . . . . . . . . . . . . . . . . . . . . . . . . . . . . . . . . . . . . . . . . . . . . . . . . . . . . . . . . . . . 33
References . . . . . . . . . . . . . . . . . . . . . . . . . . . . . . . . . . . . . . . . . . . . . . . . . . . . . . . . . . . . . . . . . . . . . . . . . . 34
Endnotes . . . . . . . . . . . . . . . . . . . . . . . . . . . . . . . . . . . . . . . . . . . . . . . . . . . . . . . . . . . . . . . . . . . . . . . . . . . . 36
TABLES
Table 1: ODA as share of local economy (percent) . . . . . . . . . . . . . . . . . . . . . . . . . . . . . . . . . . . . . . 3
Table 2: Countrywide public health expenditure and ODA (share in percent) . . . . . . . . . . . . . . . 4
Table 3: GDP growth rates for the period 1997/98-2006/07 (in percent at constant price) . . . 6
Table 4: Trends in poverty and inequality . . . . . . . . . . . . . . . . . . . . . . . . . . . . . . . . . . . . . . . . . . . . . . 6
Table 5: Donors expenditures by programs and capital versus recurrent (in $) . . . . . . . . . . . . . 9
Table 6: Role of GHP in fi nancing health in Ethiopia . . . . . . . . . . . . . . . . . . . . . . . . . . . . . . . . . . . . 12
Table 7: Grants portfolio of the Global Fund (approved), updated on August 2, 2006 . . . . . . . 12
Table 8: PEPFAR’s contribution in 2006 . . . . . . . . . . . . . . . . . . . . . . . . . . . . . . . . . . . . . . . . . . . . . 13
Table 9: Shares of donors in the health sector fi nancing (in percent) . . . . . . . . . . . . . . . . . . . . . .17
Table 10: Donor mapping by their projects . . . . . . . . . . . . . . . . . . . . . . . . . . . . . . . . . . . . . . . . . . . . 18
Table 11: Social sector Aid Fragmentation Index (in percent) . . . . . . . . . . . . . . . . . . . . . . . . . . . . 18
Table 12: Health sector fragmentation index (TI) . . . . . . . . . . . . . . . . . . . . . . . . . . . . . . . . . . . . . . 19
Table 13: Ethiopian health sector donors and their planning horizon . . . . . . . . . . . . . . . . . . . . . 22
Table 14: Donor alignment and harmonization in the health sector . . . . . . . . . . . . . . . . . . . . . . . 24
Table 15: Volatility in net ODA and CPA . . . . . . . . . . . . . . . . . . . . . . . . . . . . . . . . . . . . . . . . . . . . . . 26
Table 16: Trends in volatility of net ODA, de-trended series . . . . . . . . . . . . . . . . . . . . . . . . . . . . . 26
Table 17: Indicators measured through the surveys . . . . . . . . . . . . . . . . . . . . . . . . . . . . . . . . . . . . 32
FIGURES
Figure 1: Flows of net ODA to Ethiopia . . . . . . . . . . . . . . . . . . . . . . . . . . . . . . . . . . . . . . . . . . . . . . . . 2
Figure 2: Trends in share of CPA from total net ODA (in percent) . . . . . . . . . . . . . . . . . . . . . . . . . 9
Figure 3: Total ODA fragmentatin trends . . . . . . . . . . . . . . . . . . . . . . . . . . . . . . . . . . . . . . . . . . . . . .17
Figure 4: Aid as budgeted by the government and actual disbursements . . . . . . . . . . . . . . . . 26
Figure 5: Government responses to cope with aid volatility . . . . . . . . . . . . . . . . . . . . . . . . . . . . . 27
AfDF African Development Fund
AFI Aid Fragmentation Index
AMP Aid Management Platform
APR Annual Progress Report
CCM Country Coordinating Mechanisms
CJSC Central Joint Steering Committee
CPA Country Programmable Aid
CRDA Christian Relief and Development
Association
DAC Development Assistance Committee
DBS Direct Budget Support
GDP Gross Domestic Product
DFID Department for International Development, UK
EC European Commission
EPI Expanded Programme of Immunization
ETB Ethiopian Birr (legal currency)
GAVI Global Alliance for Vaccines and
Immunization
GFATM Global Fund Against AIDS, Tuberculosis
and Malaria
GHI Global Health Initiatives
GHP Global Health Partnerships
GNI Gross National Income
GoE Government of Ethiopia
HFL High Level Government–Donor Forum
HHI Hirschman-Herfi ndahl Index
HICES Household Income Consumption and
Expenditure Survey
HPN Health, Population, and Nutrition
HSDP Health Sector Development Program
HSPF Health Sector Pooled Fund
ICC Interagency Coordinating Committee
IDA International Development Association
IHP International Health Partnership
IMNCI Integrated Management of Neonatal and
Childhood Illnesses
JCCC Joint Core Coordinating Committee
JICA Japan International Cooperation Agency
MDG Millennium Development Goals
MoFED Ministry of Finance and Economic
Development
MoH Ministry of Health
NGO Non-Governmental Organization
NHA National Health Account
ODA Offi cial Development Assistance
OECD Organization for Economic Co-operation
and Development
PASDEP Plan for Accelerated and Sustained
Development to End Poverty
PBS Protection of Basic Services
PEPFAR U.S. President’s Emergency Plan for AIDS
Relief
PRSP Poverty Reduction Strategy Paper
SDPRP Sustainable Development and Poverty
Reduction Program
SIDA Swedish International Development
Agency
SWAps Sector Wide Approaches
TI Theil’s Index
UN United Nations
UNCDF United Nations Capital Development Fund
UNDP United Nation Development Program
UNFPA United Nations Fund for Population
Activities
UNICEF United Nations Children’s Fund
USAID United States Agency for International
Development
WB The World Bank
WHO World Health Organization
ABBREVIATIONS AND ACRONYMS
A CASE STUDY ON AID EFFECTIVENESS IN ETHIOPIA 1
A CASE STUDY OF AID EFFECTIVENESS IN ETHIOPIAANALYSIS OF THE HEALTH SECTOR AID ARCHITECTURE
Getnet Alemu
INTRODUCTION
Trends in total infl ows of Offi cial De-velopment Assistance (ODA)
Foreign aid has played a major role in Ethiopia’s
development effort since the end of World War II.
It has been instrumental in bridging the country’s sav-
ings-investment and foreign exchange gaps.1 Its im-
portance as a source of fi nancing for the development
of capacity building (human capital, administrative
capacity, institutional building, and policy reforms)
is also unquestionable. Thus, increasing efforts were
made to mobilize foreign aid in the last two regimes.
Following the change in political regime in 1991 and
the adoption of the structural adjustment program
in 1992/93 in particular, the country has enjoyed a
signifi cant amount of aid. A large and growing infl ow
of concessionary loans and grants has occurred since
2001, following the issuance of the fi rst poverty re-
duction strategy paper (known as the Sustainable
Development Poverty Reduction Program) from 14
multilateral sources—mainly IDA, EC, the Global Fund,
and the African Development Fund2 and more than 30
bilateral sources—mainly the USA, UK, Italy, Canada,
Germany, Ireland, Japan, Netherlands, Norway, and
Sweden.3
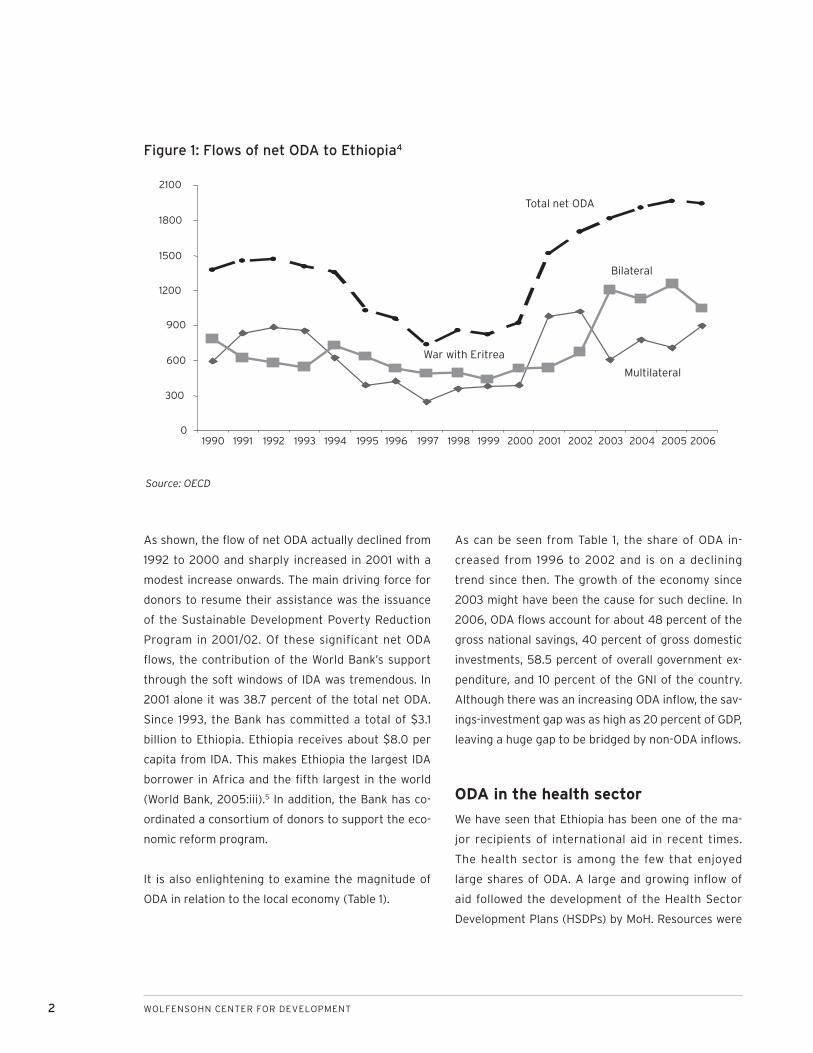
Ethiopia has been one of the major recipients of inter-
national aid in recent times. According to OECD-DAC
statistics, net ODA to Ethiopia amounted to US$1.94
billion in 2006, making it the 7th largest recipient
among 169 aid receiving developing countries. In ab-
solute terms, the amount of ODA has risen sharply
from an average of $881 million per annum in the
second half of the 1990s to over $1574 million per
annum for the fi rst half of the 2000s. Over the last
seven years (2000-2006), ODA has averaged at $1683
million per year. The average contribution of bilateral
donors to ODA over the eight year period was $322.4
million per year accounting for 31 percent of ODA.
In the 1990s, some 49 percent of the total net ODA
was in the form of multilateral aid. This was slightly
reduced to 46 percent for 2000-2006, refl ecting the
increased importance of non-multilateral sources.
Figure 1 presents the recent annual fl ows of foreign
aid to Ethiopia.
2 WOLFENSOHN CENTER FOR DEVELOPMENT
As shown, the fl ow of net ODA actually declined from
1992 to 2000 and sharply increased in 2001 with a
modest increase onwards. The main driving force for
donors to resume their assistance was the issuance
of the Sustainable Development Poverty Reduction
Program in 2001/02. Of these significant net ODA
fl ows, the contribution of the World Bank’s support
through the soft windows of IDA was tremendous. In
2001 alone it was 38.7 percent of the total net ODA.
Since 1993, the Bank has committed a total of $3.1
billion to Ethiopia. Ethiopia receives about $8.0 per
capita from IDA. This makes Ethiopia the largest IDA
borrower in Africa and the fi fth largest in the world
(World Bank, 2005:iii).5 In addition, the Bank has co-
ordinated a consortium of donors to support the eco-
nomic reform program.
It is also enlightening to examine the magnitude of
ODA in relation to the local economy (Table 1).
As can be seen from Table 1, the share of ODA in-
creased from 1996 to 2002 and is on a declining
trend since then. The growth of the economy since
2003 might have been the cause for such decline. In
2006, ODA fl ows account for about 48 percent of the
gross national savings, 40 percent of gross domestic
investments, 58.5 percent of overall government ex-
penditure, and 10 percent of the GNI of the country.
Although there was an increasing ODA infl ow, the sav-
ings-investment gap was as high as 20 percent of GDP,
leaving a huge gap to be bridged by non-ODA infl ows.
ODA in the health sector
We have seen that Ethiopia has been one of the ma-
jor recipients of international aid in recent times.
The health sector is among the few that enjoyed
large shares of ODA. A large and growing infl ow of
aid followed the development of the Health Sector
Development Plans (HSDPs) by MoH. Resources were
Figure 1: Flows of net ODA to Ethiopia4
0
300
600
900
1200
1500
1800
2100
1990 1991 1992 1993 1994 1995 1996 1997 1998 1999 2000 2001 2002 2003 2004 2005 2006
Total net ODA
Bilateral
Multilateral
War with Eritrea
Source: OECD
A CASE STUDY ON AID EFFECTIVENESS IN ETHIOPIA 3
delivered by ten multilateral sources, more than 22
bilateral sources, and more than 50 international
NGOs.7
Getting the complete picture on the fl ow of aid in the
health sector is very difficult because of problems
associated with the disbursement channel itself. This
problem may be understood better by briefl y looking
into the three disbursement channels practiced in
Ethiopia.
It could be said that funds disbursed through “channel
1,” MoFED, are immune to data reporting problems:
they are invariably captured in the budget. Funds dis-
bursed through “channel 2,” via sector bodies, are dis-
bursed outside the mainstream government budget
and thus might not be captured. As noted by MoFED
(2005), some federal line ministries deal directly
with donors and may spend funds without notifying
MoFED, let alone reporting to MoFED.
Funds through “channel 3” are those disbursed di-
rectly by donors without involving any government
agency; they are usually not captured in the budget
and, disturbingly, are not reported at all in many
cases. In some cases they do report to the regional bu-
reaus or to the sectoral ministry concerned but these
parties may not report to MoFED. There seems to be
no systematically organized and comprehensive data
available on a regular and consistent basis regard-
ing the trends of aid fl ows to the health sector—ei-
ther by MoFED or MoH. Data sourced from budget
documents/MoFED therefore do not refl ect the exact
amount of aid used in the health sector. One simple
example is that U.S. President’s Emergency Plan for
AIDS Relief (PEPFAR) data is not available from the
budget document; it is disbursed partly through chan-
nel 2 and partly through channel 3.
With this limitation (and the lack of an adequate time
series on sectoral breakdowns of ODA) Table 2 gives
some insight about the share of public health expen-
ODA/Gross national income
ODA/Gross national savings
ODA/Gross domestic investment
ODA/Total government expenditure
1996 6.6 44.4 33.3 37.3
1997 5.6 30.1 26.3 30.8
1998 6.7 47.5 30.7 36.3
1999 6.6 38.5 32.6 30.0
2000 7.0 36.8 32.7 27.5
2001 11.6 74.0 48.4 47.5
2002 13.4 81.0 61.1 59.2
2003 12.7 81.5 49.6 63.1
2004 11.9 68.2 51.8 62.7
2005 11.1 62.9 45.8 59.5
2006 10.0 48.2 40.1 58.5
Table 1: ODA as share of local economy (percent)6
Source: Author’s calculations, OECD statistics, and the National Bank of Ethiopia
4 WOLFENSOHN CENTER FOR DEVELOPMENT
diture from total public expenditure and the share of
aid in the health sector.
As may be observed in Table 2, the share of public
health expenditure from total expenditure is very low
by any standard. From the data obtained from MoFED
(on-budget health aid) the share of aid from total pub-
lic health expenditure for the last four years is more
than 64 percent. Given the problems of volatility,
harmonization, and alignment of ODA (discussed be-
low), one can argue that a 64 percent share is a major
source of concern for the health sector.8
Why focus on health sector
The Ethiopian health sector exhibits many of the gen-
eral aid problems shared by many African countries.
The health sector in Ethiopia continues to attract
many aid organizations, even as compared to other
sectors. As mentioned above, there are as many as
10 multilaterals, 22 bilaterals, and more than 50 in-
ternational NGOs providing aid to the health sector,
which poses a big challenge for coordination. There
are also emerging players in the health sector aid that
represent signifi cant changes to the traditional aid ar-
chitecture. These include the global initiatives that are
modeled using a public private partnership arrange-
ment, including but not limited to GFATM, PEPFAR,
and the Global Alliance for Vaccine and Immunization
(GAVI). The modalities under which these initiatives
are operating are signifi cantly different from tradi-
tional bilateral and multilateral donors.
It is against a context of aid dependency, aid prob-
lems, and changing aid architecture that we choose
our focus on the health sector.
Health expenditure/total public expenditure
Health aid/totalhealth expenditure
1993/94 5.0 -
1994/95 5.3 -
1995/96 5.3 -
1996/97 6.0 -
1997/98 6.1 -
1998/99 4.8 -
1999/00 3.2 -
2000/01 6.6 -
2001/02 5.0 -
2002/03 4.7 -
2003/04 4.6 57.3
2004/05 4.9 67.4
2005/06 4.7 62.2
2006/07 6.8 69.7
Table 2: Countrywide public health expenditure and ODA (share in percent)
Source: For public expenditure: NBE Quarterly Bulletin, Third Quarter 2007/08, Vol. 23, No.3 and for health aid: MoFED (External Economic Cooperation Section), various bulletins of external economic cooperation
A CASE STUDY ON AID EFFECTIVENESS IN ETHIOPIA 5
Macroeconomic performance and MDG indicators
The Real Sector: During the last 10 years, Ethiopia’s
economy has nearly doubled at constant prices and
tripled at current prices. It is estimated to have had
an average annual growth rate of about 6.3 percent,
reaching a peak of 13.6 percent growth in 2003/04.
The main reason for the wide variation in the GDP
growth rates over the ten years has been the volatile
performance of the agricultural sector, with high vari-
ations in the amount of rainfall affecting output. This,
in turn, affected overall growth because of the large
share of the agricultural sector in total GDP. The de-
tailed performance of various sectors of the economy
is shown in Table 3.
Albeit from a small base, the manufacturing sector
has shown steady growth in recent times. Mining, with
some fl uctuations, has also shown sound growth.
Public Finance: One of the most critical issues for
long-term macro-economic stability is public revenue
mobilization. The relative share of domestic revenue
is not only decreasing but its share of GDP has also
averaged 14.6 percent for the last ten years. Revenue
collection in Ethiopia is low relative to GDP mainly
because direct tax on the dominant agricultural sec-
tor is very limited. The existence of a signifi cant tax
exemption period to promote investment almost in all
sectors also contributed to low tax collection.
Total public spending has increased from 17.3 percent
of GDP in 1996/97 to 24.5 percent of GDP in 2006/07,
with a record of 27 percent in 2002/03. On the other
hand, domestic revenue has increased only by 0.5
percent of GDP for the same period. This differential
has increased the public fi scal defi cit from 4.3 percent
to 11 percent of GDP. The shortfall in domestic revenue
to fi nance public expenditure was bridged by grants
from abroad and external borrowing. The overall pub-
lic defi cit, including grants, increased from 1.7 percent
to 5.8 percent of GDP for the same period. This shows
the increasing dependency of the country’s public ex-
penditure programs on donors.
External Sector: The overall balance of payments po-
sition improved from a defi cit of 8.5 percent of GDP
in 1996/97 (ETB 720 million) to a modest surplus of
5.2 percent of GDP (ETB 407 million) in 2001/02. The
balance of payments has been much healthier since
2002/03. This is due to improvements in the interna-
tional price of coffee, Ethiopia’s dominant export com-
modity, and a substantial increase in the quantity of
other major export items.
Poverty: According to the Household Income
Consumption and Expenditure Survey (HICES,
1995/96, 1999/00, 2004/05), Ethiopia has made a
significant improvement in reducing poverty. The
proportion of poor people (poverty head count index)
in the country has decreased from 45.5 percent in
1995/96 to 38.7 in 2004/05, a 17.6 percent decline in
the last ten years (Table 4). The depth and severity of
poverty has declined at much faster rate than that of
the head count index. Double digit overall economic
growth rate since 2004/05 bodes well for future pov-
erty statistics.
Key Millennium Development Indicators: A signifi -
cant improvement has been recorded in the increas-
ing access to, and quality of, services—particularly in
the education, health, and water sectors. Gross pri-
mary enrolment has increased tremendously with sig-
nifi cant reduction in gender gaps. Infant mortality and
under five child mortality have shown tremendous
declines. Similarly, life expectancy at birth, immuni-
zation coverage, and household access to safe water
have registered signifi cant improvements.9
6 WOLFENSOHN CENTER FOR DEVELOPMENT
Period 97/98 98/99 99/00 00/01 01/02 02/03 03/04 04/05 05/06 06/07
Agriculture, Hunting and Forestry
-9.7 3.4 3.1 9.6 -1.9 -10.5 17.0 13.5 10.9 9.4
Mining and Quarrying
2.7 -8.4 11.1 5.2 10.5 4.1 2.0 4.1 7.2 6.0
Manufacturing 0.1 8.2 7.5 3.6 1.3 0.8 6.6 12.8 10.6 10.5
Electricity and Water
3.6 1.6 4.0 3.3 9.7 4.8 6.6 7.9 8.8 13.6
Construction 13.4 5.8 2.8 8.0 16.2 13.6 19.5 7.5 10.5 10.9
Transport and Communications
4.6 -0.8 9.0 13.7 5.6 10.5 9.5 19.2 5.7 7.6
All others 2.5 8.3 10.0 7.0 3.3 3.6 11.2 9.7 11.8 13.5
Over all GDP -3.5 5.2 6.1 8.3 1.5 -2.2 13.6 11.8 10.9 11.1
Year National Urban Rural
National poverty line 95/96 99/00 04/05 95/96 99/00 04/05 95/96 99/00 04/05
Headcount 45.5 44.2 38.7 47.5 45.4 39.3 33.2 36.9 35.1
Depth of poverty 12.9 11.9 8.3 13.4 12.2 8.5 9.9 10.1 7.7
Severity of poverty 5.1 4.5 2.7 5.3 4.6 2.7 4.1 3.9 2.6
Gini Coeffi cient 0.29 0.28 0.30 0.27 0.26 0.26 0.34 0.38 0.44
As can be seen from the preceding paragraphs, most
macro-economic indicators have shown improve-
ments over the last decade. The magnitude of foreign
aid has also risen. The questions that follow, then, are
those which ask whether there is room to improve the
effectiveness of aid—and generate the maximum im-
pact on growth and poverty reduction.
The effectiveness of aid is currently a hot agenda
at the international level and politicians from both
developed and developing nations are advocating
for reforms in the delivery and management of aid.
This has led to international agreement in the form
of the Paris Declaration, which aims at improving
predictability and fragmentation of aid through bet-
ter harmonization and alignment, promoting country
ownership, managing results, and increasing mutual
accountability.
Progress in meeting these targets is mixed. In
Ethiopia, there are many donors operating in the
country with varied modalities of aid delivery ranging
from sector support to project type of aid. In spite of
the increase in the magnitude of donor funding, there
are questions on the quality of aid, and how much of
it is fi nancing the recipients’ priorities. The increased
Table 3: GDP growth rates for the period 1997/98-2006/07 (in percent at constant price)
Source: Author’s calculations and National Bank of Ethiopia
Table 4: Trends in poverty and inequality
Source: MoFED 2006 and World Bank 2008
A CASE STUDY ON AID EFFECTIVENESS IN ETHIOPIA 7
number of donors operating in various sectors brings
with it a series of implications on meeting donor re-
porting requirements which further constrain limited
public sector management capacity.
These issues have been a major part of the dialogue
between government and development partners
particularly since 2005. Various policy and strategy
papers address how to better manage aid within
Ethiopia. However, studies documenting fragmenta-
tion and predictability of aid are few and far between.
This paper will attempt to supplement the growing
body of literature on aid effectiveness.
Objectives, methodology, and struc-ture of the study
The objective of the study is to:
assess trends and experiences in dealing with frag-
mentation and volatility of aggregate and health
sector aid and their impacts in terms of costs and
gaps in the delivery of services; and,
assess the effectiveness of approaches and innova-
tions that are put in place to smooth and coordinate
both aggregate and health sector aid.
This research has two methodological components:
quantitative and qualitative. The quantitative com-
1.
2.
ponent will entail collecting and analyzing data from
relevant research reports and databases, such as
OECD-DAC statistics. Additional information was
gathered from donors and other sources. For the
qualitative information, a checklist was used to collect
information about alignment and harmonization from
multilateral and bilateral donors that are active in the
health sector. An extensive review of literature was
also carried out to put the argument in context. The
whole process of the research is informed and concep-
tualized by the concept of aid effectiveness.
This paper is organized into seven sections. Following
this introductory section, the second section disag-
gregates overall aid into various sub-components to
work out how much actually goes into development
programs, referred to as Country Programmable Aid
(CPA). The next describes emerging players in health
sector aid that signifi cantly affect the health sector
aid architecture. Two sections analyze the fragmen-
tation and volatility of aid, describing both overall
trends and government responses. A penultimate sec-
tion investigates various mechanisms and processes
that are in place to address the problem of aid coordi-
nation. The fi nal section highlights key challenges as-
sociated with aid and its delivery in Ethiopia.
8 WOLFENSOHN CENTER FOR DEVELOPMENT
COUNTRY PROGRAMMABLE AID (CPA)
CPA is the part of aid that goes directly into devel-
opment programs, and thus excludes components
such as emergency humanitarian aid, development
food aid, debt forgiveness, and technical co-operation.
In the Ethiopian context, except for a few years, the
share of CPA in total net ODA has always been more
than 50 percent (Figure 2). The exceptions are 1971,
1972, 1973, 1981, and 2003. In 1971, non-CPA increased
due to technical cooperation and CPA has decreased.
What happened in 1972 was that both have decreased
but the initial volume for non-CPA was higher than
that of CPA. In 2003, CPA decreased signifi cantly and
non-CPA more than doubled.10
Data about health sector resources are far from accu-
rate and diffi cult to disaggregate into the various gov-
ernment program priorities. It is even more diffi cult to
disaggregate donors’ resources into capital and recur-
rent expenditures. As can be seen from Table 5, of the
total reported donor expenditure of $421.2 million and
$538.2 million for 2005/2006 and 2006/2007, only 4
percent and 13 percent, respectively, can be disaggre-
gated into capital and recurrent expenditures by pro-
gram areas. This inability shows that the information
obtained on donor resources—both in terms of for-
ward looking information for budgeting and backward
looking information for expenditure tracking—needs
to be strengthened. If one also looks at program dis-
tribution, more than 72 percent of donor resources
fi nanced three diseases: HIV/AIDS, malaria, and tu-
berculosis (TB). This distribution leaves child and ma-
ternal health, as well as health system strengthening,
underfi nanced. The government’s fl agship program—
the health extension package—received only 1 percent
of donor resources in 2005/06 and 2006/07.
If it is diffi cult to disaggregate donor expenditures into
capital and recurrent, it is even more diffi cult to know
the functional distribution of donor resources into pri-
mary and curative care. The only evidence that sheds
light on this is the National Health Account (NHA)
study conducted in 2005. According to this study,
donors contributed the lion’s share (80 percent) of
the total expenditure on prevention and public health
services, while the government contributed only 19
percent (MoH 2006). In contrast, the government fi -
nanced most curative care services (58 percent); with
the private sector coming second (39 percent). The
private sector financed almost all pharmaceuticals
(98 percent). With the emergence and expansion of
ARV treatments and new anti-malarial medicines—
driven mainly through donor fi nancing over the last
three years—donors’ shares of fi nancing of curative
care and pharmaceuticals are likely to increase from
what is estimated in NHA 3.
Donor resource was the major contributor to capital
formation (67 percent) followed by government (32
percent). Again, with the increased support from
global health initiatives for health systems strength-
ening over the last three years, the current donors’
share might be more than what is stated in this esti-
mation. Government covered most health-related ad-
ministrative costs, with 83 percent. This again might
not have considered the various administrative costs
of aid that are incurred in the form of donor expendi-
ture on technical assistance or contractor overheads.
These types of costs are always diffi cult to capture.
When one only looks at the donor resources func-
tional classifi cation, the NHA 2005 documented that
52 percent went to prevention and public health, fol-
lowed by capital formation (27 percent), functions not
specifi ed by kind (13 percent), and to diagnosis and
health administration (8 percent).
A CASE STUDY ON AID EFFECTIVENESS IN ETHIOPIA 9
Figure 2: Trends in share of CPA from total net ODA (in percent)
Program
2005/2006 2006/2007
Recurrent Capital Total Recurrent Capital Total
Health Extension Package - - 3,292,000 28,409 - 4,987,006
EPI 753,148 246,811 32,365,959 152,335 26,944,756 38,639,949
IMNCI - - 4,628,526 - - 5,468,009
Malaria 104,369 246,811 58,375,269 - 20,077,123 149,567,287
HIV/AIDS 787,022 3,511,122 217,483,907 600,000 3,115,077 190,720,059
TB - 275,072 39,538,813 - 129,682 45,156,804
Reproductive Health 2,561,119 2,569,858 21,847,918 3,090,884 5,773,241 20,456,013
Nutrition - 246,811 11,721,240 - 444,756 11,243,614
Water, Sanitation & Hygiene - - 5,641,349 - - 3,658,079
Health Systems Strengthening 3,126,376 2,834,246 26,325,063 7,335,021 2,569,049 68,275,822
Total 7,332,034 9,930,730 421,220,042 11,206,650 59,053,683 538,172,642
60.558.9
61.9
55.9
52
53
54
55
56
57
58
59
60
61
62
63
1970s 1980s 1990s 00-06
Table 5: Donors expenditures by programs and capital versus recurrent (in $)
Source: MoH, 2007.
Source: Author’s calculation and OECD

10 WOLFENSOHN CENTER FOR DEVELOPMENT
EMERGING AID PROVIDERS IN THE HEALTH SECTOR
There are emerging players in health sector aid
that signifi cantly affect the health sector aid ar-
chitecture. These include the global initiatives that are
modeled using a public private partnership arrange-
ment, including but not limited to GFATM, PEPFAR,
and GAVI. The modalities under which these initiatives
operate are signifi cantly different from traditional bi-
lateral and multilateral donors.
Recent estimates by the WHO suggest that there
are between 75 and 100 Global Health Partnerships
(GHPs), sometimes referred to as Global Health
Initiatives (GHIs). GHPs are a heterogeneous group,
both in mission (advocacy, coordination, financing,
etc.) and in design (scale, scope, etc.). However, the
vast majority engage communicable diseases; many
target the “big three” diseases of HIV/AIDS, TB, and
malaria. While there are a large number of GHPs,
only a handful have a major impact on health fi nanc-
ing—most notably GAVI, GFATM, and PEPFAR. Between
2003 and 2005, GFATM annually committed on aver-
age $1.16 billion around the world. Funding from GAVI
and GFATM now accounts for 9 percent of develop-
ment assistance in health.11
The signifi cance of these types of funding agencies
has grown both in terms of the volume of aid they
bring to the health systems and in their organizational
impact on health systems. This has generated mixed
reactions. On the one hand, there are views stating
that these funding mechanisms have brought a num-
ber of positive infl uences including: (i) a global politi-
cal and technical focus to deliver results for targeted
interventions; (ii) the mobilization of signifi cant ad-
ditional resources to the sector (without which some
of the recent gains in health outcomes might not have
been achieved), and; (iii) the introduction of a new
business model (performance-based funding) to aid
delivery both in terms of fund mobilization and pro-
viding aid to recipient countries.
On the other hand, there are others that agree with
the above fi ndings but question the sustainability of
these arrangements over the long term. They argue
that GHPs more often than not bypass the mainstream
health systems to achieve quick results—sometimes at
the cost of other important health sector goals. They
establish their own management and reporting struc-
tures and create parallel systems, which are likely
to collapse when funding from such agencies stops.
GHPs also created a number of global institutions
and are not adequately represented at country level,
which makes alignment and harmonization efforts
more complicated. Critics also argue that GHPs create
separate fi nancing and delivery modes, leaving very
little for fl exibility in resource allocation.
Though these confl icting views are expressed, the evi-
dence on the impact of GHPs on country health sys-
tems remains scanty. A recent study on 20 countries
stated that GHPs pay insuffi cient attention to health
systems, often provide limited technical assistance
on how to effectively manage their programs, and
impose signifi cant transaction costs to the recipient
countries.
The role of NGOs in mobilizing external resources for
relief and development has also been a main feature
of aid in Ethiopia. In the health sector, NGOs are es-
timated to provide around 10 percent of all services.
In addition, many local and international NGOs sup-
port service delivery and management strengthen-
ing through government facilities and management
structures. However, it is diffi cult to obtain informa-
tion on their activities or on the magnitude of their
contribution.
A CASE STUDY ON AID EFFECTIVENESS IN ETHIOPIA 11
There is debate between the government and NGOs
about the effi ciency, effectiveness, and transparency
of NGO-managed services as compared to public
services. Some anecdotal evidence shows that the
management cost of service delivery is much higher
than government services. One study documented
that while 60 percent of resources managed by gov-
ernment are spent on service delivery, the analogous
proportion of NGOs is much less: about 35 percent.12
Though NGOs are thought to reach underserved and
unreached areas, data available from the government
coordinating body in 2003 suggest that NGOs were
more concentrated in urban areas and in relatively
better-off regions13. The same NGO study found a doc-
umented existence of problems of poor transparency
and accountability, high administrative costs, gaps in
capacity, and weak inter-NGO networking. While these
anecdotes might not be conclusive facts (and require
further scrutiny) they are able to question the validity
of the belief that NGOs are more effi cient and more
effective deliverers of health services in Ethiopia.
The government is drafting a new NGO law, on which
both NGOs and donors alike raised concerns regarding
its objectives and ability to create a more democratic
space in the country. The law delineates activities
that national and international NGOs are allowed to
be involved in, and thus stands to affect the fi nanc-
ing of NGOs. According to the draft law, only national
NGOs will be allowed to be involved in advocacy on
human rights and good governance, and 90 percent
of their fi nances should be generated within the coun-
try. National NGOs with more than 10 percent of their
fi nancing coming outside the country will only be al-
lowed to engage in service delivery. NGOs and donors
are arguing to change these clauses, but the outcome
of the dialogue is yet to be known.
At this juncture, it is necessary to comment on the
role of emerging bilateral donors like China and NGOs.
China’s role in the Ethiopian aid architecture in gen-
eral, and the health sector in particular, is a recent
phenomenon and remains marginal as compared to
other bilateral donors. This is particularly apparent as
China is not even a member of the Health, Population,
and Nutrition (HPN) donor group. Its role might be vis-
ible in the next few years in the area of infrastructure
development.
In what follows, we explore the magnitude and share
of aid from these new sources, investigate their align-
ment to the government priorities and systems, and
analyze their effect on health systems in Ethiopia.
Magnitude of resources for the health sector
In the Ethiopian context, the Global Fund and GAVI
account for about 55 percent of all donor resources.
Their resources are estimated to account for about
95 percent of the resources going through “channel
2” (the MoH account, see above). This fi gure does not
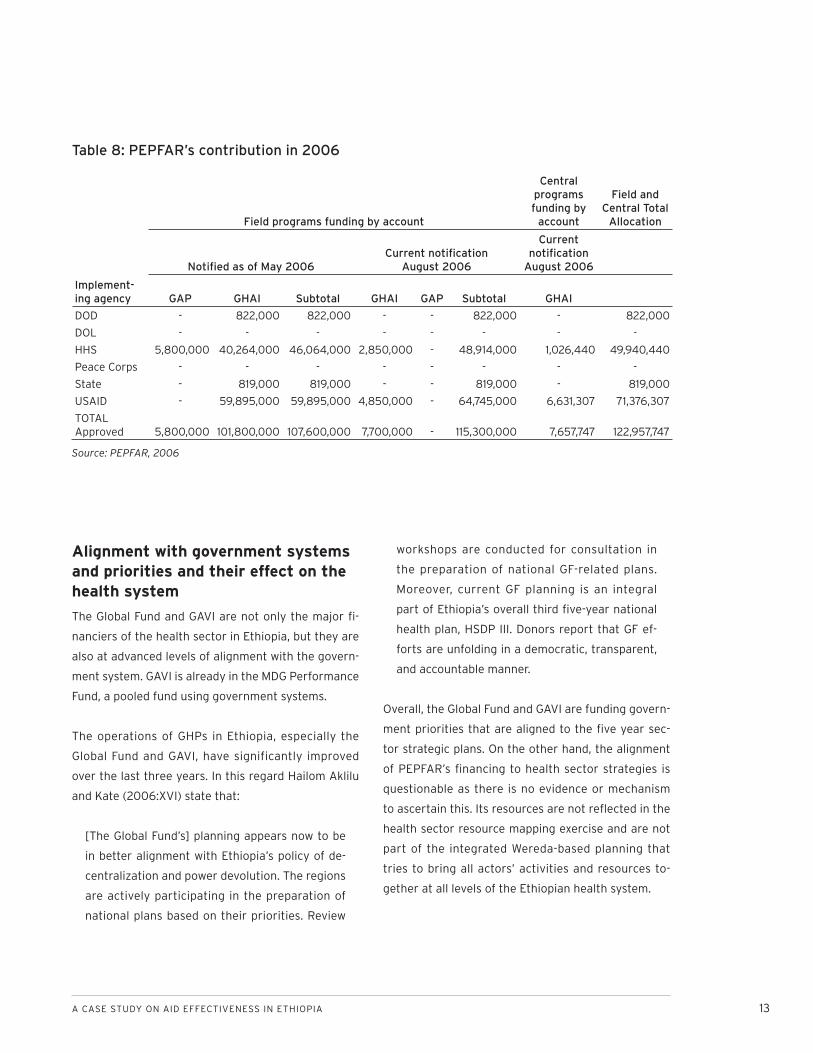
include PEPFAR, one of the major fi nanciers of health.
According to HSDP III midterm review, the attempt to
obtain PEPFAR’s contribution has not been success-
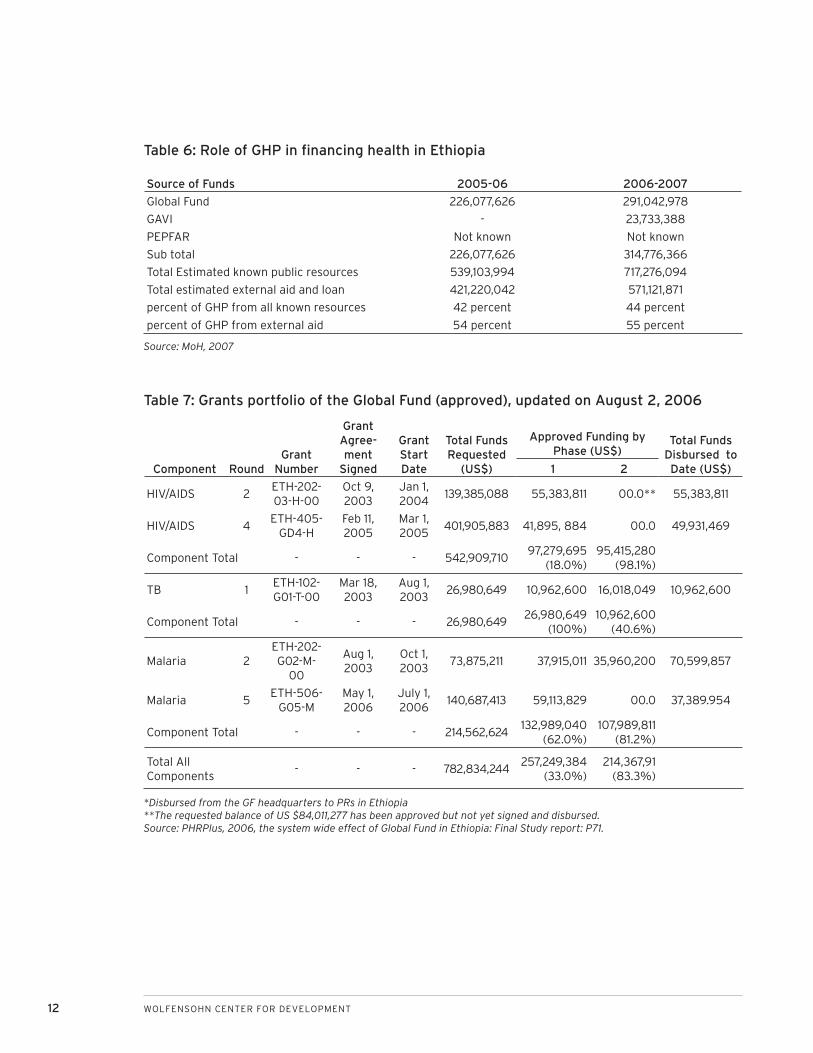
ful. Table 6 refl ects the contribution of these donors
for health sector fi nancing.
As can be seen from Table 6, GHPs contributions track
nicely with the recent improvements in child mortal-
ity, malaria morbidity and mortality, and care for HIV/
AIDS, suggesting the importance of GHPs in achieving
health outcomes.
12 WOLFENSOHN CENTER FOR DEVELOPMENT
Table 6: Role of GHP in fi nancing health in Ethiopia
Source of Funds 2005-06 2006-2007
Global Fund 226,077,626 291,042,978
GAVI - 23,733,388
PEPFAR Not known Not known
Sub total 226,077,626 314,776,366
Total Estimated known public resources 539,103,994 717,276,094
Total estimated external aid and loan 421,220,042 571,121,871
percent of GHP from all known resources 42 percent 44 percent
percent of GHP from external aid 54 percent 55 percent
Table 7: Grants portfolio of the Global Fund (approved), updated on August 2, 2006
Source: MoH, 2007
Component RoundGrant
Number
Grant Agree-ment
Signed
Grant Start Date
Total Funds Requested
(US$)
Approved Funding by Phase (US$)
Total Funds Disbursed to Date (US$)1 2
HIV/AIDS 2ETH-202-03-H-00
Oct 9, 2003
Jan 1, 2004
139,385,088 55,383,811 00.0** 55,383,811
HIV/AIDS 4ETH-405-
GD4-HFeb 11, 2005
Mar 1, 2005
401,905,883 41,895, 884 00.0 49,931,469
Component Total - - - 542,909,71097,279,695
(18.0%)95,415,280
(98.1%)
TB 1ETH-102-G01-T-00
Mar 18, 2003
Aug 1, 2003
26,980,649 10,962,600 16,018,049 10,962,600
Component Total - - - 26,980,64926,980,649
(100%)10,962,600
(40.6%)
Malaria 2ETH-202-G02-M-
00
Aug 1, 2003
Oct 1, 2003
73,875,211 37,915,011 35,960,200 70,599,857
Malaria 5ETH-506-
G05-MMay 1, 2006
July 1, 2006
140,687,413 59,113,829 00.0 37,389.954
Component Total - - - 214,562,624132,989,040
(62.0%)107,989,811
(81.2%)
Total All Components
- - - 782,834,244257,249,384
(33.0%)214,367,91
(83.3%)
*Disbursed from the GF headquarters to PRs in Ethiopia**The requested balance of US $84,011,277 has been approved but not yet signed and disbursed.Source: PHRPlus, 2006, the system wide effect of Global Fund in Ethiopia: Final Study report: P71.
A CASE STUDY ON AID EFFECTIVENESS IN ETHIOPIA 13
Alignment with government systems and priorities and their effect on the health system
The Global Fund and GAVI are not only the major fi -
nanciers of the health sector in Ethiopia, but they are
also at advanced levels of alignment with the govern-
ment system. GAVI is already in the MDG Performance
Fund, a pooled fund using government systems.
The operations of GHPs in Ethiopia, especially the
Global Fund and GAVI, have significantly improved
over the last three years. In this regard Hailom Aklilu
and Kate (2006:XVI) state that:
[The Global Fund’s] planning appears now to be
in better alignment with Ethiopia’s policy of de-
centralization and power devolution. The regions
are actively participating in the preparation of
national plans based on their priorities. Review
workshops are conducted for consultation in
the preparation of national GF-related plans.
Moreover, current GF planning is an integral
part of Ethiopia’s overall third fi ve-year national
health plan, HSDP III. Donors report that GF ef-
forts are unfolding in a democratic, transparent,
and accountable manner.
Overall, the Global Fund and GAVI are funding govern-
ment priorities that are aligned to the fi ve year sec-
tor strategic plans. On the other hand, the alignment
of PEPFAR’s fi nancing to health sector strategies is
questionable as there is no evidence or mechanism
to ascertain this. Its resources are not refl ected in the
health sector resource mapping exercise and are not
part of the integrated Wereda-based planning that
tries to bring all actors’ activities and resources to-
gether at all levels of the Ethiopian health system.
Table 8: PEPFAR’s contribution in 2006
Source: PEPFAR, 2006
Field programs funding by account
Central programs funding by
account
Field and Central Total
Allocation
Notifi ed as of May 2006Current notifi cation
August 2006
Current notifi cation
August 2006
Implement-ing agency GAP GHAI Subtotal GHAI GAP Subtotal GHAI
DOD - 822,000 822,000 - - 822,000 - 822,000
DOL - - - - - - - -
HHS 5,800,000 40,264,000 46,064,000 2,850,000 - 48,914,000 1,026,440 49,940,440
Peace Corps - - - - - - - -
State - 819,000 819,000 - - 819,000 - 819,000
USAID - 59,895,000 59,895,000 4,850,000 - 64,745,000 6,631,307 71,376,307
TOTAL Approved 5,800,000 101,800,000 107,600,000 7,700,000 - 115,300,000 7,657,747 122,957,747
14 WOLFENSOHN CENTER FOR DEVELOPMENT
The Global Fund is like most other donors in the health
sector in that it follows its own resource channeling
approach to support health activities. The result can
be a complicated implementation process as well as
systems issues in terms of human resources, resource
use, measurement, evaluation and reporting, fi nancial
management, and requirements for the submission of
statements of expenditure and overall accountability.
Therefore, harmonization of donor funds is now a pri-
ority for the Ethiopian government. The MoH has put
a lot of effort to harmonize programs operating in the
health sector. One of the most signifi cant early efforts
is the signature a memorandum of understanding
between the GFATM and PEPFAR to coordinate activi-
ties and resources relative to HIV and AIDS. Outcomes
from the memorandum still need to be reviewed.
Unlike in other countries, GHPs have started playing a
very signifi cant role in fi nancing an accelerated expan-
sion of health infrastructure. MoH in Ethiopia is now
using the resources of the GHPs (GAVI and GFATM)
as a catalytic fund to increase resource allocation to
health at lower tiers of government through signing
performance contracts with regional health bureaus.
While there is debate about whether the Global Fund
should consider diagonal fi nancing of health systems,
such a structure is already happening in Ethiopia. 14
The funds are managed through the MoH and govern-
ment systems, thereby reducing transaction costs. In
addition to disease-specifi c programs, they have also
started financing other health systems like human
resource development and health management infor-
mation systems.
A CASE STUDY ON AID EFFECTIVENESS IN ETHIOPIA 15
FRAGMENTATION OF AID
Fragmentation of total ODA
Ethiopia is one of the countries where donor frag-
mentation is an issue. The number of donors
operating in Ethiopia is large. Excluding international
NGOs, there were more than 30 bilateral and 14 mul-
tilateral donors operating in the country in 2006. Aid
fragmentation can be manifested in different forms:
the number of donors, the fi nancial size of each donor,
and the number of donor-funded activities.
Most bilateral donors have a small share from the
aid market. In 2006, some 54 percent of ODA came
from more than 30 bilateral donors, and 12 bilateral
donors accounted for only 0.87 percent of total ODA.
Countering this fragmentation, the USA accounted for
30.1 percent of total ODA. Furthermore, most donors
support more than one project through different dis-
bursement channels, resulting in a proliferation of aid
projects.15
The main feature of aid fragmentation in Ethiopia is
an increasing numbers of donors each with a small
share of the total aid envelop yet numerous aid
projects. This setup is believed to overburden the
Ethiopian government and compromise the effective-
ness of aid.16
There are three possible methods of computing aid
fragmentation.17 The fi rst one is using data extracted
from the OECD, which provides a breakdown of annual
disbursements by various bilateral and multilateral
donor agencies, treating each funding country or
multilateral institution as a single donor. The second
method is by treating agencies or departments (within
a single donor) as separate donors. The difference be-
tween the two methods, however, is small as the cor-
relation coeffi cient between the two indexes is about
92 percent. The third method computes aid fragmen-
tation based on investment projects and other ac-
tivities fi nanced by bilateral and multilateral donors.
According to Knack and Rahman (2004:14), “A count
of projects sponsored by each donor can be made.
From these counts, a fragmentation index is computed
from donors’ shares of projects.”18
The third method is believed to be more appropri-
ate than the fi rst two as an aid fragmentation index,
“based on the number of projects may refl ect actual
problems associated with lack of donor coordination
better than fragmentation indexes based on aid vol-
umes, for which budget support provided by many do-
nors could produce a high value” (Knack and Rahman,
2004:14). The problem with the third method is that
one cannot generate annual data as most projects
have a lifespan of more than a year. Furthermore, data
on projects including start and end dates is very dif-
fi cult to obtain. In line with this, Knack and Rahman
(2004:15) observed that, “about 60 percent of the
activities included in AiDA lack project start and end
dates.” It should be noted also that the results ob-
tained using the first two methods and the third
method are quite different as the correlation coeffi -
cient between the two is about 45 percent.19
In this paper we adopt the fi rst method because of
data availability. Based on this method, aid fragmen-
tation is conceptualized as a large number of donors
each with a small share of the total aid provided to a
given recipient country. Based on this defi nition, aid
fragmentation can be obtained simply as the differ-
ence between one and a Hirschman-Herfi ndahl Donor
Concentration Index (HHI).20
HHI is calculated by summing the squared shares of
each donor in total ODA provided to a given recipient:
16 WOLFENSOHN CENTER FOR DEVELOPMENT
HHI = ΣSD2
where SD stands for the share of each donor in total
ODA. 21
By subtracting the HHI from 1 and multiplying by 100
we can easily form an aid fragmentation index (AFI):
AFI = 1 – HHI
Since the value of the HHI ranges between 0 and 1,
the value of donor fragmentation index is also ranges
between 0 and 1. While an AFI close to 0 indicates
smaller fragmentation, values close to 1 indicate
greater fragmentation.22 The higher the index, the
greater is the degree of donor fragmentation indicat-
ing large number of donors and possibly proliferation
of aid projects.23 Based on this, we calculated frag-
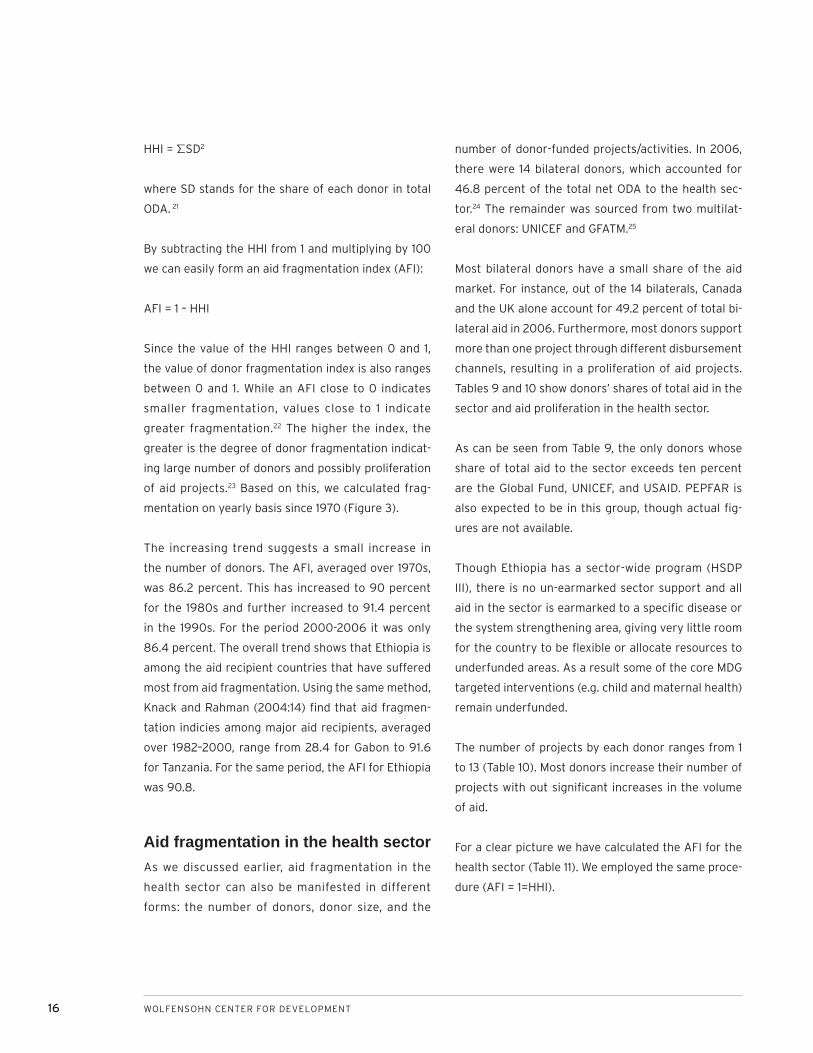
mentation on yearly basis since 1970 (Figure 3).
The increasing trend suggests a small increase in
the number of donors. The AFI, averaged over 1970s,
was 86.2 percent. This has increased to 90 percent
for the 1980s and further increased to 91.4 percent
in the 1990s. For the period 2000-2006 it was only
86.4 percent. The overall trend shows that Ethiopia is
among the aid recipient countries that have suffered
most from aid fragmentation. Using the same method,
Knack and Rahman (2004:14) fi nd that aid fragmen-
tation indicies among major aid recipients, averaged
over 1982–2000, range from 28.4 for Gabon to 91.6
for Tanzania. For the same period, the AFI for Ethiopia
was 90.8.
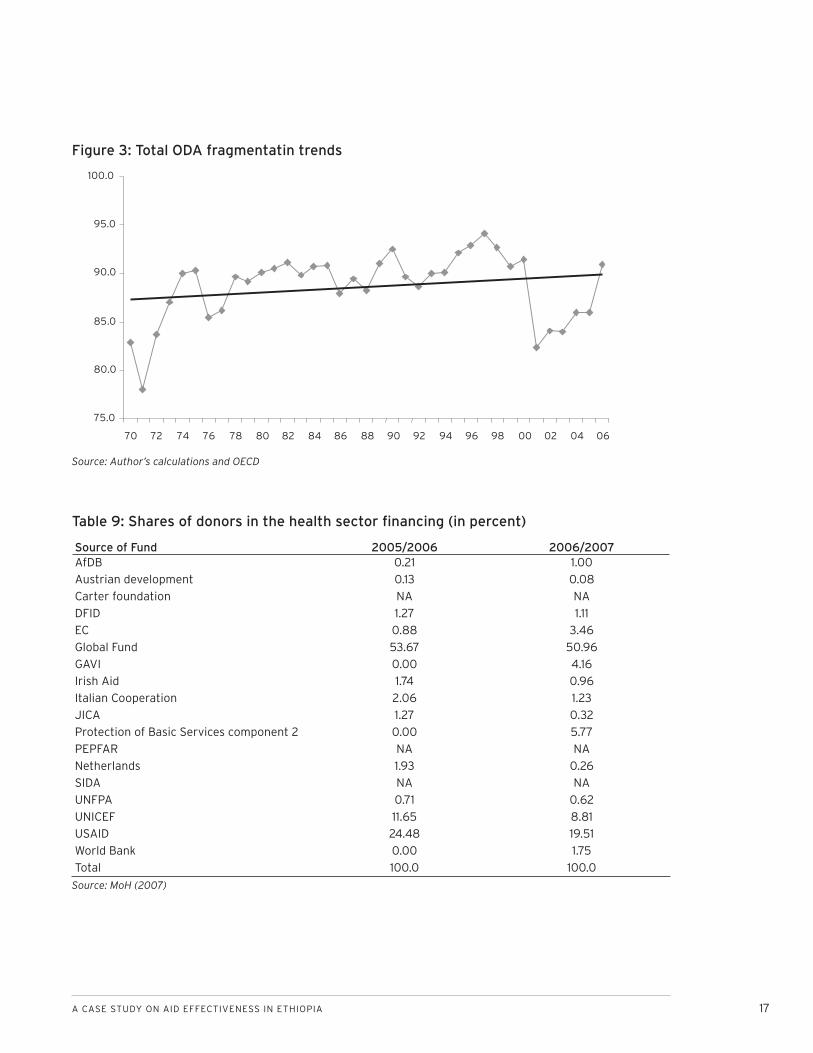
Aid fragmentation in the health sectorAs we discussed earlier, aid fragmentation in the
health sector can also be manifested in different
forms: the number of donors, donor size, and the
number of donor-funded projects/activities. In 2006,
there were 14 bilateral donors, which accounted for
46.8 percent of the total net ODA to the health sec-
tor.24 The remainder was sourced from two multilat-
eral donors: UNICEF and GFATM.25
Most bilateral donors have a small share of the aid
market. For instance, out of the 14 bilaterals, Canada
and the UK alone account for 49.2 percent of total bi-
lateral aid in 2006. Furthermore, most donors support
more than one project through different disbursement
channels, resulting in a proliferation of aid projects.
Tables 9 and 10 show donors’ shares of total aid in the
sector and aid proliferation in the health sector.
As can be seen from Table 9, the only donors whose
share of total aid to the sector exceeds ten percent
are the Global Fund, UNICEF, and USAID. PEPFAR is
also expected to be in this group, though actual fi g-
ures are not available.
Though Ethiopia has a sector-wide program (HSDP
III), there is no un-earmarked sector support and all
aid in the sector is earmarked to a specifi c disease or
the system strengthening area, giving very little room
for the country to be fl exible or allocate resources to
underfunded areas. As a result some of the core MDG
targeted interventions (e.g. child and maternal health)
remain underfunded.
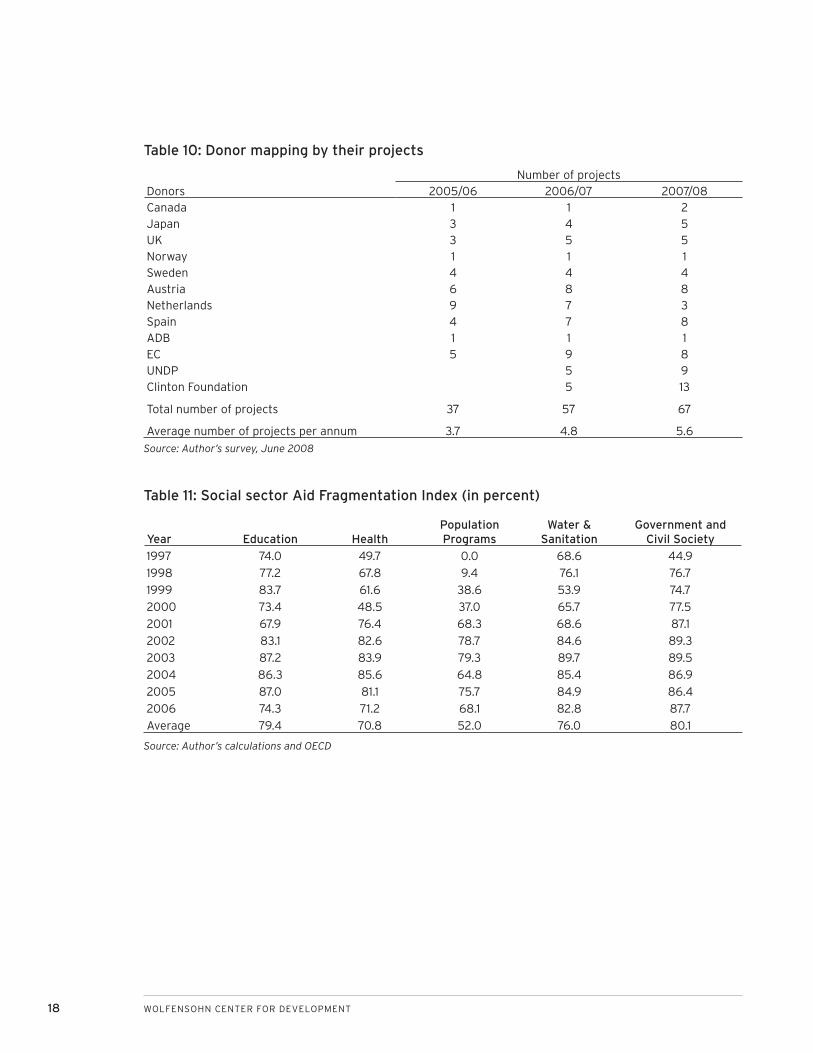
The number of projects by each donor ranges from 1
to 13 (Table 10). Most donors increase their number of
projects with out signifi cant increases in the volume
of aid.
For a clear picture we have calculated the AFI for the
health sector (Table 11). We employed the same proce-
dure (AFI = 1=HHI).
A CASE STUDY ON AID EFFECTIVENESS IN ETHIOPIA 17
Source of Fund 2005/2006 2006/2007AfDB 0.21 1.00
Austrian development 0.13 0.08
Carter foundation NA NA
DFID 1.27 1.11
EC 0.88 3.46
Global Fund 53.67 50.96
GAVI 0.00 4.16
Irish Aid 1.74 0.96
Italian Cooperation 2.06 1.23
JICA 1.27 0.32
Protection of Basic Services component 2 0.00 5.77
PEPFAR NA NA
Netherlands 1.93 0.26
SIDA NA NA
UNFPA 0.71 0.62
UNICEF 11.65 8.81
USAID 24.48 19.51
World Bank 0.00 1.75
Total 100.0 100.0
Figure 3: Total ODA fragmentatin trends
75.0
80.0
85.0
90.0
95.0
100.0
70 72 74 76 78 80 82 84 86 88 90 92 94 96 98 00 02 04 06
Table 9: Shares of donors in the health sector fi nancing (in percent)
Source: MoH (2007)
Source: Author’s calculations and OECD
18 WOLFENSOHN CENTER FOR DEVELOPMENT
DonorsNumber of projects
2005/06 2006/07 2007/08Canada 1 1 2Japan 3 4 5UK 3 5 5Norway 1 1 1Sweden 4 4 4Austria 6 8 8Netherlands 9 7 3Spain 4 7 8ADB 1 1 1EC 5 9 8UNDP 5 9Clinton Foundation 5 13
Total number of projects 37 57 67
Average number of projects per annum 3.7 4.8 5.6
Table 10: Donor mapping by their projects
Source: Author’s survey, June 2008
Year Education HealthPopulation Programs
Water & Sanitation
Government and Civil Society
1997 74.0 49.7 0.0 68.6 44.9
1998 77.2 67.8 9.4 76.1 76.7
1999 83.7 61.6 38.6 53.9 74.7
2000 73.4 48.5 37.0 65.7 77.5
2001 67.9 76.4 68.3 68.6 87.1
2002 83.1 82.6 78.7 84.6 89.3
2003 87.2 83.9 79.3 89.7 89.5
2004 86.3 85.6 64.8 85.4 86.9
2005 87.0 81.1 75.7 84.9 86.4
2006 74.3 71.2 68.1 82.8 87.7
Average 79.4 70.8 52.0 76.0 80.1
Table 11: Social sector Aid Fragmentation Index (in percent)
Source: Author’s calculations and OECD
A CASE STUDY ON AID EFFECTIVENESS IN ETHIOPIA 19
Since 2000, the AFI for the health sector has exhibited
an increasing trend with modest declines in 2005 and
2006. The overall trend shows that the health sector
has been suffering most from aid fragmentation. We
also calculated Theil’s Index (TI) for the health sec-
tor. This second measure is used to decompose the
overall fragmentation into within- and across-sector
fragmentation (Table 12).
The fragmentation of aid is a constraint to the fi scal
space in two ways: (i) most of the aid is provided off-
budget to fi nance NGOs and technical assistants that
provide little fungible resources to government; (ii)
the proliferation of projects imposes major effi ciency
costs (i.e., substantial waste of resources resulting
from management duplication, weak coordination and
the establishment of parallel planning and manage-
ment structures).26
Year 1997 1998 1999 2000 2001 2002 2003 2004 2005 2006
TI 1.43 0.71 0.78 1.09 0.76 0.81 0.77 0.58 0.92 0.99
Table 12: Health sector fragmentation index (TI)
20 WOLFENSOHN CENTER FOR DEVELOPMENT
AID PREDICTABILITY AND VOLA-TILITY
Why does aid predictability and volatility matter?
For developing countries like Ethiopia, aid is an
important source of public spending. The government
has a target for aid revenue, and it incorporates the
expected revenue into its fi scal planning. Ethiopia has
a plan to mobilize more than 30 percent of its revenue
from foreign fi nancing. This means that aid is taken
into account when revenue decisions and expenditure
allocations are made. Thus, volatile and unpredictable
aid undermines the development effort. If the recipi-
ent government is not certain about the volume and
the time of aid infl ows, it is in a very diffi cult position
to plan and implement development expenditures in
line with its development priorities. Thus, one can say
volatile and unpredictable aid can cause ineffective
and distorted uses of resources, and can compromise
growth and development.
The government acknowledged the existence of seri-
ous challenges to predictability and information on
aid fl ows, pointing out in its annual progress report
on Plan for Accelerated and Sustained Development
to End Poverty (PASDEP), “aid flow is frequently
much less predictable both in terms of timing as well
as amount of disbursement. Aid to Ethiopia has been
leveling off and new commitments of several bilateral
donors have been falling, though some like UK-DFID
has increased their support” (MoFED, 2007:51). This
problem, however, may be solved once the new da-
tabase technology adopted by MoFED based on the
Development Gateway is fully operational. The system
allows donors and recipient government institutions
to access and enter data related to signed commit-
ments, planned and actual disbursements, and expen-
ditures—project by project, and on a regular basis (for
details, see below).
Aid predictability is all about when and what amount
of aid commitments are disbursed. OECD (2005), for
instance, defi nes aid as predictable if “partner coun-
tries can be confi dent about the amount and timing
of aid disbursements.” If predictability is about the
amount and timing of disbursement, one can mea-
sure it by taking a number of specifi c programs over a
specifi c period and comparing the difference between
commitments and disbursements with the mean. The
higher the gap between aid commitments and actual
disbursements, the lower is the predictability of aid.
There is some evidence that suggests aid predictabil-
ity is poor in Ethiopia. Getnet (2006: Table 2.5), for in-
stance, fi nds that for the period 2000/01-2004/05 the
disbursement ratio of Ethiopia’s IDA credit portfolio
was, on average, only 25.4 percent. Three-fourths of
the commitment was not disbursed as planned. One of
the major reasons for this very low disbursement rate
was the lack of donor harmonization.
Despite the World Bank’s and Ethiopia’s insistence to
work with a similar modality, donors tend to rely on
different instruments of assessment. Instead of plan-
ning and working in a harmony—a system which would
be more fruitful—most donors tend to prefer to build
separate frameworks for identifying areas of interven-
tion in the country. Even worse, some donors often
use different systems for disbursements, approval,
procurement, monitoring, evaluation, fi nancial man-
agement, and reporting. This implies that projects and
programs, which are supported by multiple donors,
are likely to face overlapping procedures—bringing
about diffi culties for implementing agencies in the
implementation process with subsequent low and
slow disbursements.
Due to the paucity of data, we cannot use the gap be-
tween commitments and disbursements as a measure
A CASE STUDY ON AID EFFECTIVENESS IN ETHIOPIA 21
of predictability. Instead, we defi ne aid predictability
as the aid recipient government’s ability to forecast
budget aid disbursements based on the information
available at the time of budget formulation. As a re-
sult, we shall discuss aid predictability in relation with
donor harmonization and alignment of donors with
the recipient government in terms of the planning cal-
endar, budgeting process, provision of budget infor-
mation, and fi nancial management and procedures.
The major principle of predictability is that donors
should communicate as much as possible the likely
size of the budget envelope they will provide in the
budgeting calendar, and to ensure that their fi nancial
resources will be transferred to the country on a pre-
dictable schedule. It also calls to program aid over a
multi-year framework, aligned with partners’ fi nancial
horizon. Donors should fully disclose expected fl ows
(all aid, without exception, should be captured on the
partner budget, even where not channeled through
its treasury) and any triggers for their reduction or
suspension. They should adapt conditions to make aid
more predictable, and commit to disburse funds on
schedule, once conditions are met. Partners should
build up effective, accountable management systems
for raising and using public resources. They also need
to reinforce tax systems, improve fi scal planning, and
link it fi rmly to development results.27
Most of the donors in Ethiopia have committed cer-
tain amounts of resources between 2005/06 and
2009/2010 in support of the third Health Sector
Development Program (Table 13). There are signifi -
cant donors like PEPFAR whose resources are not
refl ected. Some have provided complete resources
(including those that they channel through NGOs),
while others provide partial funding information (even
missing some resources that go to the government).
Though most donors provide a three- to fi ve-year re-
sources framework, these frameworks are often only
indicative and cannot be used for planning. Most donors
can only provide two years of resources and most often
it is only fi rst year that is useful for planning and prior-
ity setting. Most donors indicated that they usually have
about 25-30 percent more resources at the end of the
year than what they planned for at the beginning.28
The Ethiopian budgeting calendar often complicates
the ability of donors to align to the country budgeting
calendar and process. It is stated that it might take
three donor calendar years to fi t into two Ethiopian
fi scal years.29
In one survey, donors were asked to provide their com-
mitments and disbursements for 2005/06, 2006/07,
and 2007/08. Almost all donors responded that they
have disbursed all of what they are committed for. It
is therefore impossible to show gaps between com-
mitment and disbursement, as reliable fi gures are not
available at the country level.
Ethiopia is one of the few countries that have initiated
very early on an in-country harmonization and align-
ment process for better aid predictability—both at the
sector and country levels.
At the sectoral level, Ethiopia has utilized a sector
wide approach (SWAp) for health sector planning and
implementation since 1997. While donors were part of
the overall design and implementation process (refer
to sections on coordination), the SWAp has not been
effectively exploited (by the government or donors) to
improve aid predictability and harmonize funding ar-
rangements. By defi nition, “sector wide” requires fol-
lowing country-defi ned plans and strategies, using one
expenditure framework, one coordination mechanism,
and government or harmonized systems for planning,
22 WOLFENSOHN CENTER FOR DEVELOPMENT
fi nancial management, measurement and evaluation,
and technical assistance. While a development pro-
gram (the HSDP III-strategy document) exists, other
parts of SWAp are not yet fully in place. For instance,
resource mapping exercises have not been successful
in building a common expenditure framework. There
is no un-earmarked sector support so far; all donors
provide projectized support and try to fi nance activi-
ties rather than the agreed overall strategy. Most of
the donors are using their program/project approach
to fi nance the health sector.
At the country level, since the launching of the
Sustainable Development and Poverty Reduction
Program (Ethiopia’s PRSP), there was a shift toward
budget support until 2005. This movement has sig-
nifi cantly improved the government’s ability to fl ex-
ibly allocate resources among the various sectors,
including health based on its priorities and strategies.
This ability was reinforced by a renewed effort after
the signing of the Paris Declaration for improving aid
effectiveness. In this regard, a national harmonization
action plan was developed in 2005 for implementa-
tion. The harmonization action plan states that the
country will benefi t from external aid if donors could:
take necessary steps to effect realignment of their
country assistance strategies in terms of content
and timing with government strategies;
harmonize their institutional assessment, the rules
they apply to disbursement and procurement; and
use audit procedures relying increasingly on the
government systems and procedures; and,
provide capacity building support as necessary and
help meet donor expectations and international
standards.
1.
2.
3.
Name of Donor Provision of resource envelope (2005/06 to 2009/10) Earmarking African Dev’t Bank 3 years YesAustrian development 5 years YesCarter Foundation No information YesDFID 4 years (does not include 2009/10) YesEC 5 years YesGAVI 4 years (the last years) YesGlobal Fund 5 years YesIrish Aid 5 years YesItalian cooperation 4 years (last year not included) YesJICA 3 years (last three years only) YesPBS (component 2) 4 years (last four years) YesPEPFAR No information YesNetherlands 5 years YesSIDA No information YesUNFPA 5 years YesUNICEF 5 years YesUSAID 5 years YesWorld Bank 4 years (does not include last year) YesWHO No information Yes
Table 13: Ethiopian health sector donors and their planning horizon
Source: MoH (2007)
A CASE STUDY ON AID EFFECTIVENESS IN ETHIOPIA 23
The action plan states clearly that it will be imple-
mented in a phased manner.30
The action plan clearly stipulated action points that
the government should undertake to strengthen sys-
tems and procedures on the one hand and what do-
nors should do to align and harmonize on the other.
As a result of these developments, the coordination
and effectiveness of aid have been improving (see the
fi gures on the Paris Declaration Indicators in the sub-
sequent sections). With this overall improvement in
coordination, however, there is retrogression in some
aspects of provision of effective development aid:
working through the government system.
Unfortunately political concerns following the 2005
elections did not help to get the above action plan
fully implemented. Harmonization and alignment in
the country in general, and in the health sector in par-
ticular, is moving slowly. Most donors that were pro-
viding Direct Budget Support (DBS) before the 2005
general elections have resorted back to earmarked
project support. While DBS has increased predictable
and fl exible funding at the country level, mechanisms
have not been put in place to ensure that more re-
sources are allocated to health once it goes into the
government coffers. In project type support (par-
ticularly PBS block grants, see below) there has been
efforts to increase resources to local district govern-
ments, which, in turn, has enabled increased resource
allocation to the poverty reduction focused sectors.
In the absence of sector support funds, results have
been achieved in getting like-minded donors to estab-
lish pooled funds. In-country health sector coordina-
tion mechanisms have enabled eight development
partners to harmonize among themselves through the
establishment of two pooled funds: the Health Sector
Pooled Fund (HSPF) and the PBS.31 These funds are
administered outside government systems by UNICEF
and the World Bank, respectively, and have not con-
tributed to strengthening government systems in any
way.
With the exception of the Bank (that has pooled its re-
sources to the Bank-managed PBS), and UNICEF (that
managed health-sector pooled funds) most multilat-
eral organizations continue to use their own systems.
UN agencies in particular harmonize neither among
themselves nor with the government—again, with the
exception of UNICEF. In this regard, donors were asked
to fi ll a questionnaire in order to obtain information on
the contribution of development partners in the area
of alignment and harmonization. Table 14 summarizes
the results.
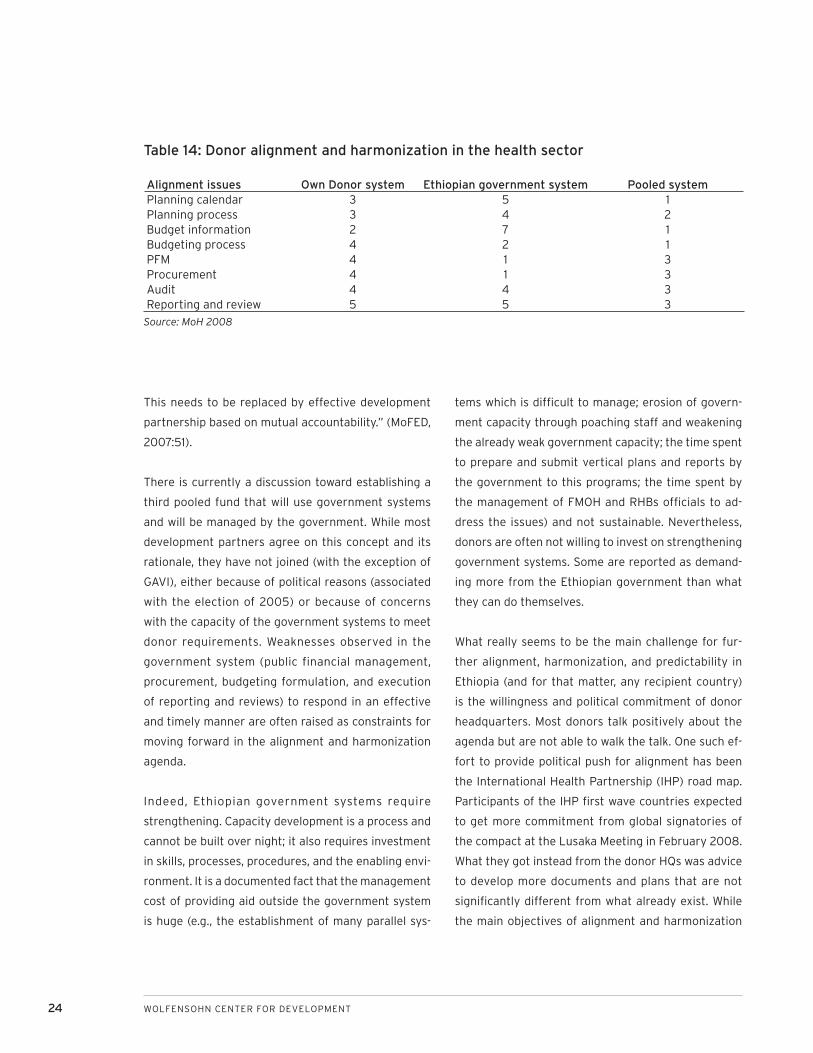
Table 14 shows the number of donors that use of their
own, Ethiopian, or a pooled system (or a combination
of these three). Seven out of eight donors that pro-
vided information responded that they provide budget
information to the government; fi ve use the Ethiopian
budgeting calendar and four use the Ethiopian bud-
geting process. Donors have yet to align their critical
budgeting fi nancial management and procurement
processes with the national government, raising sig-
nificant transaction costs for Ethiopia. Because of
more aligning and harmonizing policies adopted at
headquarters (HQs), two development partners were
able to abandon their systems and procedures in favor
of either the pooled or government systems. These
development partners were encouraged by their HQs
to do so. In line with this, the government, in its annual
progress report on PASDEP, stated that the country is
facing a serious challenge with regard to harmoniza-
tion and alignment among development partners. It
states that the “lack of harmonization and alignment
of policies, procedures and programs among various
donors’ agencies is still a problem in making aid de-
livery effective. On the other hand there is no mecha-
nism for the country to hold donors accountable.
24 WOLFENSOHN CENTER FOR DEVELOPMENT
This needs to be replaced by effective development
partnership based on mutual accountability.” (MoFED,
2007:51).
There is currently a discussion toward establishing a
third pooled fund that will use government systems
and will be managed by the government. While most
development partners agree on this concept and its
rationale, they have not joined (with the exception of
GAVI), either because of political reasons (associated
with the election of 2005) or because of concerns
with the capacity of the government systems to meet
donor requirements. Weaknesses observed in the
government system (public financial management,
procurement, budgeting formulation, and execution
of reporting and reviews) to respond in an effective
and timely manner are often raised as constraints for
moving forward in the alignment and harmonization
agenda.
Indeed, Ethiopian government systems require
strengthening. Capacity development is a process and
cannot be built over night; it also requires investment
in skills, processes, procedures, and the enabling envi-
ronment. It is a documented fact that the management
cost of providing aid outside the government system
is huge (e.g., the establishment of many parallel sys-
tems which is diffi cult to manage; erosion of govern-
ment capacity through poaching staff and weakening
the already weak government capacity; the time spent
to prepare and submit vertical plans and reports by
the government to this programs; the time spent by
the management of FMOH and RHBs offi cials to ad-
dress the issues) and not sustainable. Nevertheless,
donors are often not willing to invest on strengthening
government systems. Some are reported as demand-
ing more from the Ethiopian government than what
they can do themselves.
What really seems to be the main challenge for fur-
ther alignment, harmonization, and predictability in
Ethiopia (and for that matter, any recipient country)
is the willingness and political commitment of donor
headquarters. Most donors talk positively about the
agenda but are not able to walk the talk. One such ef-
fort to provide political push for alignment has been
the International Health Partnership (IHP) road map.
Participants of the IHP fi rst wave countries expected
to get more commitment from global signatories of
the compact at the Lusaka Meeting in February 2008.
What they got instead from the donor HQs was advice
to develop more documents and plans that are not
signifi cantly different from what already exist. While
the main objectives of alignment and harmonization
Alignment issues Own Donor system Ethiopian government system Pooled systemPlanning calendar 3 5 1Planning process 3 4 2Budget information 2 7 1Budgeting process 4 2 1PFM 4 1 3Procurement 4 1 3Audit 4 4 3Reporting and review 5 5 3
Table 14: Donor alignment and harmonization in the health sector
Source: MoH 2008
A CASE STUDY ON AID EFFECTIVENESS IN ETHIOPIA 25
are to reduce transaction costs, there is an ironic
feeling that costs are increasing (from increased
meetings) while donor behavior on the ground is only
changing a little.
Given the signifi cant dependency on aid, aid fl ow sta-
bility is important for ensuring proper planning and
development. In most aid literature, it is claimed that
the volatility of aid is increasing recently (see Kharas,
2007). Kharas fi nds that aid is, “much more volatile than
national income” and that, “volatility has risen since
1990, compared to the two preceding decades” (Kharas,
2007:21). Ruth (2005) finds the same result for sub-
Saharan African countries. It is shown that aid is more
volatile (30 percent from a trended average) than GDP
(<10 percent from a trended average). Aid is also twice as
volatile as tax revenues (see Ruth, 2005: Figure 1-4).
The same story is true in Ethiopia. Both net ODA and
CPA are volatile and volatility has risen in 1990s. The
volatility of CPA is higher than the volatility of total
ODA. An interesting observation from Table 15 is that
the volatility of CPA and the share of CPA in net ODA
move in the same direction implying that CPA is more
volatile than non-CPA. This is understandable as a sig-
nifi cant part of non-CPA has a characteristic of timely
and fast disbursing nature. Aid volatility is calculated
as the deviation of observed fl ows from the expected,
constant dollar trend of net ODA. Table 15 presents
the volatility of total aid and CPA.
As may be observed Table 16, unlike the percentage
deviation from the trend, the volatility from the de-
trended aid series has declined since 1990s.
The volatile and unpredictable nature of aid fl ows is
costly. The cost is reflected in the deviations from
actual plans. The Ethiopian government has a target
for aid revenue, and this expected revenue is incorpo-
rated into its budget. The actual disbursement of aid
revenue has always been less than from the level of
what was budgeted, except in the 1998/99 fi scal year.
The details are presented in Figure 4.
As may be observed, the gap between what is bud-
geted and the actual disbursement is increasing with
no clear pattern. For the period 1996/97-2005/06, on
the average, about 77.3 percent of the target for aid
revenue was disbursed, ranging between 58.0 percent
in 2005/06 and 117.0 percent in 1998/99. The huge
gap in 2005/06 was as a result of the aftermath of
the May 2005 election. Most multilateral and bilat-
eral donors expressed their concern on the political
developments and on how the government handled
the situation, sending a clear message that “business
as usual will not be possible.” Notably the European
Union’s reaction to the crisis has been critical. Thus,
following the May 2005 election, aid disbursement
had two characteristics: (i) delayed disbursement de-
spite all technical conditionalities were fulfi lled and (ii)
most donors suspended their budget support.
As a result, fiscal policy in 2005/06 was marked
by a rapid adjustment to this signifi cant shock. The
Ethiopian government was forced to adjust its rev-
enue and expenditure plan. The expenditure was ad-
justed by scaling down activities, abandoning planned
projects, and discontinuing existing projects. The ex-
penditure cut was made in those high-import content
investment programs, such as public utilities. On the
revenue side, the government attempted to fi nance
most pro-poor expenditure plans by increasing do-
mestic financing. Domestic financing of the fiscal
defi cit in 2005/06 fi scal year had to increase to 4.2
percent of the GDP as opposed to 3.6 percent that
was budgeted. A draw down of international reserves,
higher fuel prices to consumers through upward ad-
justment of retail fuel prices, and increased electricity
prices through tariff adjustment were all used to raise
domestic revenue.
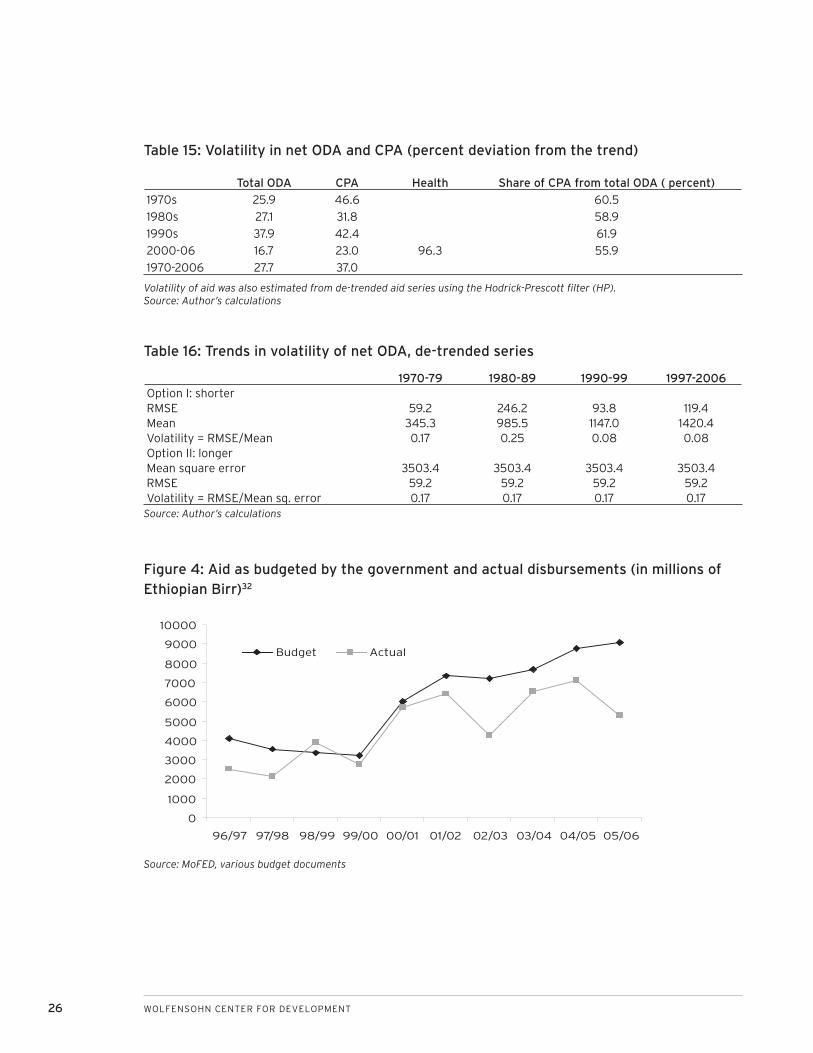
26 WOLFENSOHN CENTER FOR DEVELOPMENT
1970-79 1980-89 1990-99 1997-2006Option I: shorterRMSE 59.2 246.2 93.8 119.4Mean 345.3 985.5 1147.0 1420.4Volatility = RMSE/Mean 0.17 0.25 0.08 0.08Option II: longerMean square error 3503.4 3503.4 3503.4 3503.4RMSE 59.2 59.2 59.2 59.2Volatility = RMSE/Mean sq. error 0.17 0.17 0.17 0.17
Table 15: Volatility in net ODA and CPA (percent deviation from the trend)
Total ODA CPA Health Share of CPA from total ODA ( percent)
1970s 25.9 46.6 60.5
1980s 27.1 31.8 58.9
1990s 37.9 42.4 61.9
2000-06 16.7 23.0 96.3 55.9
1970-2006 27.7 37.0
Volatility of aid was also estimated from de-trended aid series using the Hodrick-Prescott fi lter (HP).Source: Author’s calculations
Table 16: Trends in volatility of net ODA, de-trended series
Figure 4: Aid as budgeted by the government and actual disbursements (in millions of Ethiopian Birr)32
Source: MoFED, various budget documents
96/97 97/98 98/99 99/00 00/01 01/02 02/03 03/04 04/05 05/06
Budget Actual
0
1000
2000
3000
4000
5000
6000
7000
8000
9000
10000
Source: Author’s calculations
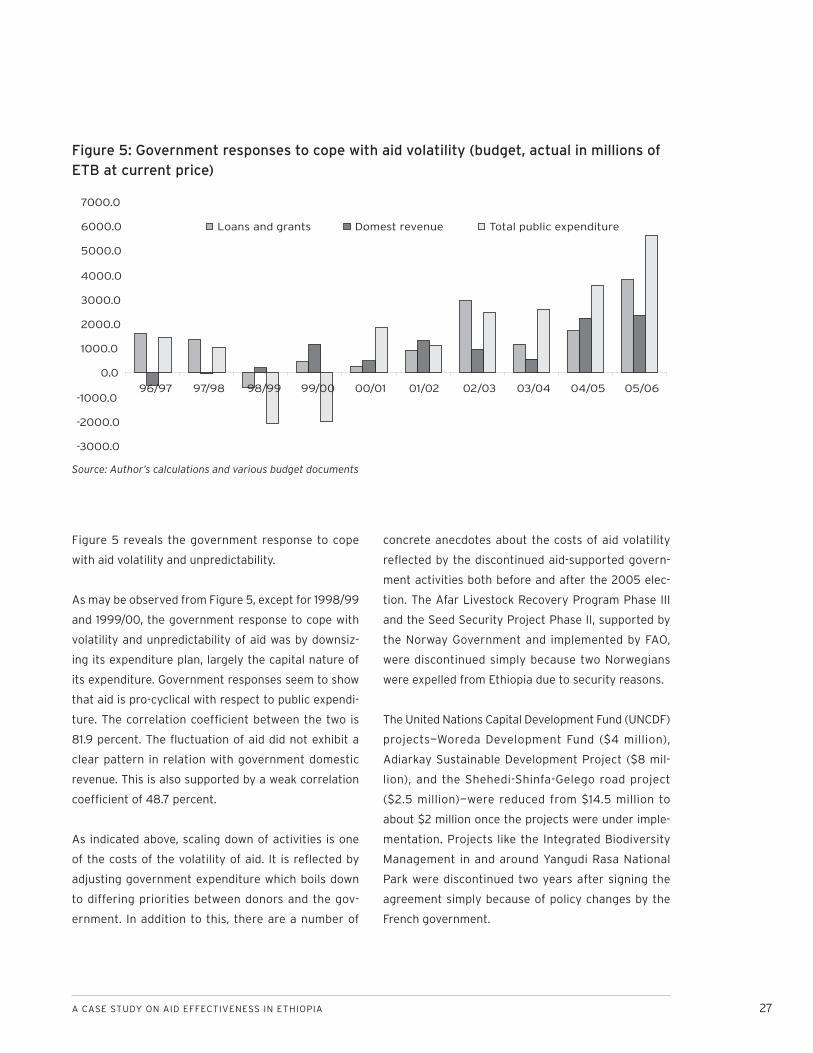
A CASE STUDY ON AID EFFECTIVENESS IN ETHIOPIA 27
Figure 5 reveals the government response to cope
with aid volatility and unpredictability.
As may be observed from Figure 5, except for 1998/99
and 1999/00, the government response to cope with
volatility and unpredictability of aid was by downsiz-
ing its expenditure plan, largely the capital nature of
its expenditure. Government responses seem to show
that aid is pro-cyclical with respect to public expendi-
ture. The correlation coeffi cient between the two is
81.9 percent. The fl uctuation of aid did not exhibit a
clear pattern in relation with government domestic
revenue. This is also supported by a weak correlation
coeffi cient of 48.7 percent.
As indicated above, scaling down of activities is one
of the costs of the volatility of aid. It is refl ected by
adjusting government expenditure which boils down
to differing priorities between donors and the gov-
ernment. In addition to this, there are a number of
concrete anecdotes about the costs of aid volatility
refl ected by the discontinued aid-supported govern-
ment activities both before and after the 2005 elec-
tion. The Afar Livestock Recovery Program Phase III
and the Seed Security Project Phase II, supported by
the Norway Government and implemented by FAO,
were discontinued simply because two Norwegians
were expelled from Ethiopia due to security reasons.
The United Nations Capital Development Fund (UNCDF)
projects—Woreda Development Fund ($4 million),
Adiarkay Sustainable Development Project ($8 mil-
lion), and the Shehedi-Shinfa-Gelego road project
($2.5 million)—were reduced from $14.5 million to
about $2 million once the projects were under imple-
mentation. Projects like the Integrated Biodiversity
Management in and around Yangudi Rasa National
Park were discontinued two years after signing the
agreement simply because of policy changes by the
French government.
Figure 5: Government responses to cope with aid volatility (budget, actual in millions of ETB at current price)
-3000.0
-2000.0
-1000.0
0.0
1000.0
2000.0
3000.0
4000.0
5000.0
6000.0
7000.0
96/97 97/98 98/99 99/00 00/01 01/02 02/03 03/04 04/05 05/06
Loans and grants Domest revenue Total public expenditure
Source: Author’s calculations and various budget documents
28 WOLFENSOHN CENTER FOR DEVELOPMENT
AID COORDINATION
Instruments of coordination
The government of Ethiopia has used the earlier
Sustainable Development and Poverty Reduction
Program (SDPRP) and now the PASDEP as its develop-
ment strategy. PASDEP has a fi ve year horizon and its
development has been led and owned by the govern-
ment. Though the extent to which the process of its
development has been broad based and participatory
is debatable—its ownership and government-commit-
ment is not questionable at all. Based on the develop-
ment strategy, the health sector has also developed
a health sector development program to guide the
health sector spending decisions. Both PASDEP and
HSDP III aim their targets and resource requirements
at meeting the MDG goals and are based on an MDG
Needs Assessment Study.
There are a number of structures and systems that
are put in place for aid coordination. As described
below, some are working better than others. (See pre-
vious section on predictability for information on the
instruments of fi nancing—sector wide approaches, di-
rect budget support, and pooled funding.) This section
will only focus on the structures of the new database
technology based on the Development Gateway to re-
cord and coordinate all aid, dialogue, monitoring, and
mutual accountabilities.
Cognizant of the problem of recording and coordinat-
ing the aid infl ows, MoFED has adopted a new data-
base technology based on the Development Gateway
known as the Aid Management Platform (AMP). The
database technology enables MoFED to record aid
infl ows (commitments, disbursements, and expendi-
tures) by type of aid (loan, grant, and in-kind), sector,
component, and location (federal, region, or woreda)
on a regular basis. Basic project information is also re-
corded. Physical and fi nancial reports are to be gener-
ated from the AMP on a quarterly and annual basis.
Introduction of the AMP has two phases. The first
phase is to fully operationalize within MoFED. The
AMP is under implementation within MoFED since
2007/08 and all relevant departments are progres-
sively being familiarized with the system. Once this
phase is completed, the second phase is to rollout
the AMP to federal and regional aid recipients, public
institutions, and donors. In the second phase, the fi rst
target is line ministries. Line ministries will be allowed
to have access to the database and also obliged to
report expenditure data in the system. Once this is
operational the major four regions will have access to
the data base and they are also obliged to fi ll expen-
diture data.33 Donors are last in the second phase to
have access to the database. Donors will be also re-
quired to fi ll disbursement data regularly. It is hoped
that by 2009/10 the AMP will be fully operational in
the country.34
Despite the current confi nement of the AMP within
the MoFED, benefi ts are already starting to be reaped.
Bulletins of external economic cooperation are being
made based on data obtained from the AMP. Offi cials
from Tanzania, Zanzibar, Burkina Faso, and Malawi
have visited to learn about the system.
Structures and mechanisms for dia-logue
There are established structures at county and sec-
toral levels that help the coordination of aid. An en-
hanced mechanism for government-donor dialogue
has been put in place since 2004 to assist “each party
to hold the other transparently accountable” and for
better dialogue on program implementation and poli-
cies. A high level government-donor forum (HLF) led
A CASE STUDY ON AID EFFECTIVENESS IN ETHIOPIA 29
by the State Minister of MoFED and co-chaired by the
Development Assistance Group is expected to meet
on quarterly basis to meet the three main HLF agen-
das (program implementation, harmonization, and
policy discussions). In addition to the HLF, subsidiary
groups (health, education and food security) sector
coordinating institutions (see below for health) have
been recognized and should link to the HLF.35
The health sector is one of the few sectors in the
country with development program in place for more
than a decade. The Central Joint Steering Committee
(CJSC), consisting of donors and the government,
is the highest policy decision making body with the
responsibility of overseeing, coordinating, and facili-
tating the implementation of the health sector devel-
opment programs (HSDP I to HSDP III). Membership of
the CJSC is from MoH, other government ministries,
and donor representatives. The Christian Relief and
Development Association (CRDA), an umbrella orga-
nization for NGOs, also sits as a member of the CJSC
though its capacity to negotiate with government and
donors on behalf of its members. Still, its ability to ef-
fectively coordinate its members is questionable.
There are also parallel coordinating structures for HIV/
AIDS and the Global Fund, like Country Coordinating
Mechanisms (CCM) and Interagency Coordinating
Committees (ICCs). Most of the membership of these
two types of coordinating structures is similar and yet
it has not been possible to bring these coordinating
structures together to allow meaningful implementa-
tion of the one plan, one budget and one monitoring
processes. The transaction cost of involvement is very
high, though it is reported that GAVI and GFATM are
willing to reconsider joining a strengthened in-country
coordinating structure.36 Currently, it seems there are
two plans, two budgets, and two monitoring systems:
one for health and one for HIV/AIDS.
The CJSC is expected to meet every quarter but has
not been as functional as it should be for many rea-
sons: (i) it has not met on a quarterly basis; (ii) the
members of the committee were not able to attend
these meetings as they are ministers and in some
cases ambassadors. When members are not available,
they are represented by health program offi cers who
make the CJSC more or less similar with the Joint
Core Coordinating Committee (JCCC, described be-
low). As a result, the interest to convince the CJSC
seems very low.
The next level coordinating body is the MoH-HPN
Donor Joint Consultative Forum. NGOs are repre-
sented by CRDA in this forum, too. The forum is more
of a broader consultative forum, which promotes dia-
logue and regular exchange of information, enhances
the spirit of partnership, and builds confi dence among
the stakeholders to facilitate the implementation and
monitoring of the HSDP program.
The JCCC is both a coordination and executive organ,
as well as the technical arm of the CJSC. It follows up
the implementation of CJSC and MoH-HPN joint con-
sultative meeting decisions; it assists the HSDP sec-
retariat (Planning and Programming Department of
the MoH) in undertaking review and other necessary
activities to manage the implementation of the HSDP.
CRDA is also expected to be part of this committee but
it does not usually attend.
There is a health sector harmonization manual, which
describes the process by which harmonization is going
to be undertaken in the health sector. Furthermore, a
Code of Conduct between some 14 donors and the gov-
ernment of Ethiopia has been signed. 37 The USA has
not signed the Code of Conduct. (See previous sec-
tions relating to the gains, challenges, and constraints
in the various thematic issues.) It is important to note
30 WOLFENSOHN CENTER FOR DEVELOPMENT
that the gains that have been achieved so far have
been far below what is agreed both in the country and
at international levels. Progress did not meet the high
expectations that the Paris Declaration process hoped
for. There was a general impression that the rhetoric
was well ahead of action. Donor coordination and col-
laboration in general is not about producing policies,
studies, and guidelines but to change behavior and to
improve development results in the health sector. It is
therefore necessary to explore the main issues that
undermine the alignment and harmonization agenda
and what should be done to try and encourage stake-
holders of aid to “walk the talk.” These issues can be
placed in three groups.
First, the country’s political situation affected prog-
ress and trust between donors and the government.
The government fi nds itself in diffi cult position after
the 2005 election to take leadership and enforce
alignment and harmonization commitments. Donors
feel that the country has not fully met its commit-
ment of good governance as is stated in the Paris
Declaration. Hence it was diffi cult to have one plan,
one budget, and one monitoring framework. Because
of governance concerns, some donors resorted from
general budget support to earmarked project type
funding through the establishment of PBS. The weak
country systems (financial management, procure-
ment, budgeting, and auditing) provided adequate
reason for donors to continue strengthening parallel
systems. There have been very weak enforcement
mechanisms for donors that perpetuate non-aligning
behaviors. There are instances where some donors
opt out from the sectors with strong leadership and
opt in to weaker sectors.
Second, the alignment and harmonization agenda
takes the transaction cost of aid from the govern-
ment to donor offi ces within countries. Donor staff
must prepare and work toward one plan, one budget,
and one monitoring framework. The various sector
leads in the donor community, more often than not,
must translate the sector’s priorities and reports to
their agency’s own planning, budgeting, and report-
ing formats. This takes time and energy. Most donors
have no incentive mechanism designed to encourage
these offi cers to exert more energy and time toward
harmonization.
Third, the commitments, willingness, and the ability
of most donor headquarters to change their behav-
iors (policies, processes, and procedures) are at best
questionable and at worst non-existent. This is com-
pounded by the fact that donor agencies need to be
accountable to their tax payers. It still remains a chal-
lenge to balance “accountability at home” and mutual
accountability with the recipient country.
Monitoring and evaluation frame-works and their success/failure in achieving the objectives
Countrywide frameworkGovernment wide, the performance of the Ethiopia is
being reviewed through the Annual Progress Reports
(APRs) of PASDEP, which has now been prepared
for the third time after the Joint Declaration on
Harmonization, Alignment, and Aid Effectiveness of
2006. The report analyzes the performance of the
economy based on administrative reports generated
for sector and macroeconomic performance, and is
supported by various survey-based data including but
not limited to: household income, consumption and
expenditure, welfare monitoring surveys, and the par-
ticipatory poverty assessment.
Though all sector performance indicators have been
reviewed and included in the APR, the 12 indicators
A CASE STUDY ON AID EFFECTIVENESS IN ETHIOPIA 31
and 22 targets of aid effectiveness to be reached by
December 2010 have not been reviewed as part of the
APR. 38 The section on the aid management remains
too general without refl ecting progress or lack of it.
Unless mechanisms are put in place to follow up and
hold both government and donors “transparently ac-
countable” for the commitments made as part of the
APR, the declaration will not be realized.
Health sector frameworkEthiopia is one of the countries that routinely carries
out these sector reviews. So far two fi nal evaluations,
three midterm reviews and nine annual health sector
reviews have been carried since the initiation of the
sector wide approach. International and national con-
sultants have been selected and deployed for these
reviews. The review teams usually are composed of
various disciplines. Most of the recommendations,
particularly in the recent times, have been followed
up and implemented. The main achievements of these
reviews have been their ability to show, through an in-
dependent team, the status of the commitments and
their ability to tease out the main challenges/possible
solutions. The reviews have enabled stakeholders
to re-negotiate targets and strategies for improve-
ment. On the other hand, reviews are carried out by
independent teams and have so far not involved, in a
systematic way, implementers in the evaluation pro-
cess. Consequently some of the recommendations
are not followed up or may not be owned/shared by
implementers.
What follows from the above is that that there is a
need to refocus the objective of the external review
on verifi cation and providing external quality check.
This could assist in getting issues taken up and rec-
ommendations implemented. The fi ndings of the an-
nual reports and midterm and fi nal reviews and other
topical issues have been presented and actions and
recommendations are made during annual review
meetings, which have been carried out without any
interruption for the last nine years. Regional health
bureaus have started to take on organizational and
leading roles since last year. These are expected to
improve with the results framework to be adopted as
part of IHP compact.
Reviews mainly focus on all issues of recipient govern-
ment accountability to results. The Paris Declaration
clearly states mutual accountability as one of the
five principles. However, in practice, there is only
one-sided accountability (government to donors) and
not vice-versa. There is no mechanism put in place
to ensure that donors are also accountable for pre-
dictability of aid, aligning, and harmonization to the
government systems and priorities. That is the main
reason for lack of progress in the area of alignment
and harmonization in Ethiopia.
Results from survey of monitoring Paris Declaration
Ethiopia took part in both the 2006 and 2008 Paris
surveys monitoring donors’ efforts to coordinate. The
survey report (OECD 2008b) from these two sur-
veys assesses progress made with regard to Paris
Declaration in terms of country-owned policy pro-
cesses and systems, alignment of aid with country
systems, aid harmonization, and accountability.
Responses to the 2006 and 2008 surveys in Ethiopia
are summarized in Table 17.
As may be observed from Table 17, the aid coordina-
tion effort seems to be moving slowly. The refl ection
of aid fl ows in the country’s national budget suggests
that aid flows are aligned with national priorities.
The alignment initiative was weakened following the
events surrounding the 2005 election. The govern-
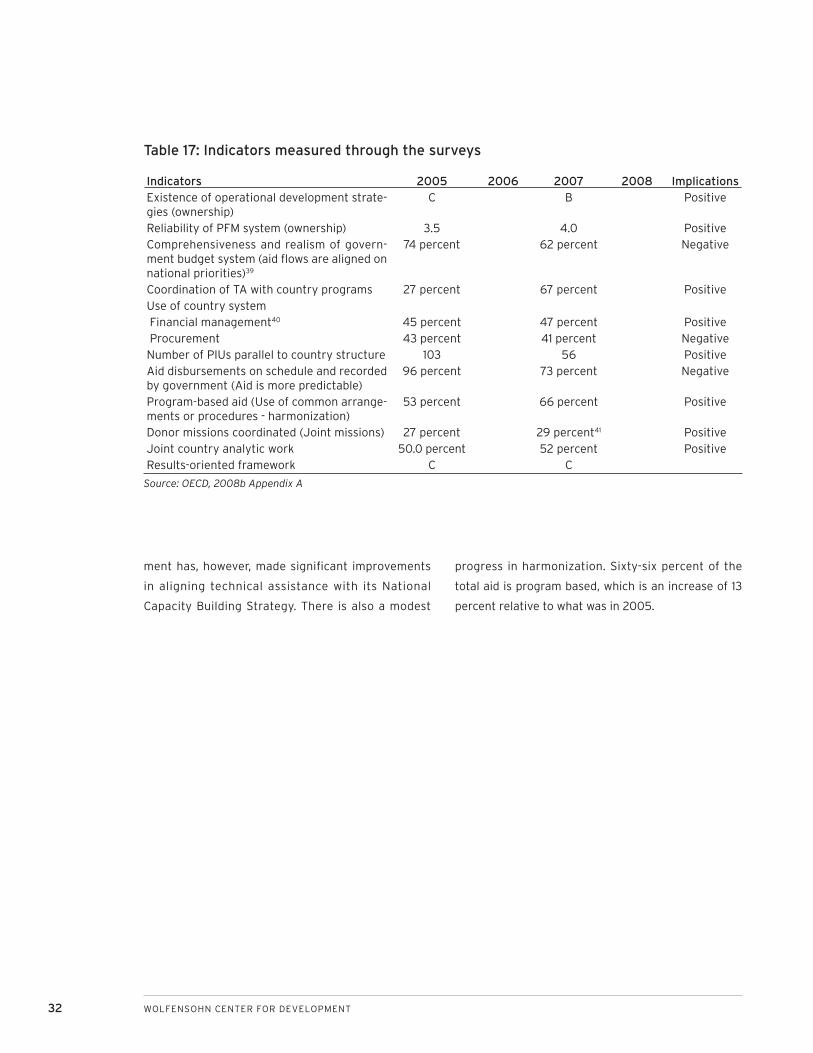
32 WOLFENSOHN CENTER FOR DEVELOPMENT
ment has, however, made signifi cant improvements
in aligning technical assistance with its National
Capacity Building Strategy. There is also a modest
progress in harmonization. Sixty-six percent of the
total aid is program based, which is an increase of 13
percent relative to what was in 2005.
Indicators 2005 2006 2007 2008 ImplicationsExistence of operational development strate-gies (ownership)
C B Positive
Reliability of PFM system (ownership) 3.5 4.0 PositiveComprehensiveness and realism of govern-ment budget system (aid fl ows are aligned on national priorities)39
74 percent 62 percent Negative
Coordination of TA with country programs 27 percent 67 percent PositiveUse of country system Financial management40 45 percent 47 percent Positive Procurement 43 percent 41 percent NegativeNumber of PIUs parallel to country structure 103 56 PositiveAid disbursements on schedule and recorded by government (Aid is more predictable)
96 percent 73 percent Negative
Program-based aid (Use of common arrange-ments or procedures - harmonization)
53 percent 66 percent Positive
Donor missions coordinated (Joint missions) 27 percent 29 percent41 PositiveJoint country analytic work 50.0 percent 52 percent PositiveResults-oriented framework C C
Table 17: Indicators measured through the surveys
Source: OECD, 2008b Appendix A
A CASE STUDY ON AID EFFECTIVENESS IN ETHIOPIA 33
KEY CHALLENGES
Aid is not effectively coordinated. It is fragmented
and unpredictable. There are several donors that
have several projects but only a small share of the
aid market. Despite Ethiopia’s early initiation of an in-
country harmonization and alignment process, both
at the sector and country levels, achievements have
not been comprehensive . The health sector SWAp, for
instance, has not been effectively exploited by either
the government or donors to improve aid predict-
ability or harmonize funding arrangements. Progress
is often made in areas where signifi cant transaction
costs cannot be reduced. Most multilateral organiza-
tions continue to use their own systems rather than
aligning and harmonizing. UN agencies, in particular,
harmonize neither among themselves nor with the
government, with exception of UNICEF. What really
seems to be the main challenge for further alignment
and harmonization in the health sector is the willing-
ness and political commitment of donors and their
headquarters. Most of donors do talk positively about
the agenda but are not able to walk the talk. Without
political commitment at donor headquarters or incen-
tive mechanisms to change the attitude and behavior
of donor staff, recipient counties are likely to be frus-
trated by the lack of meaningful progress.
The other challenge is related to meeting the ideals
and principles that underpin the Paris Declaration.
A lot more should be done to strengthen good gov-
ernance, the rule of law, and fi duciary systems to an
acceptable standard. These are real challenges, as
they require huge investment in a country with severe
fi nancial and capacity constraints. These investments
require commitment well before visible results. The
IHP initiative in the health sector that aims to ensure
that aid is more predictable and aligned to govern-
ment priorities and systems can reduce a number of
transaction costs—but only if systems are strength-
ened and become acceptable to donors.
The coordination structures both at the country and
sectors levels exist, but their full functionality remains
a challenge. Most coordination structures need to
work as per their terms of references. In the health
sector, the coordination structures require consoli-
dation and reduction of parallel mechanisms. These
coordination structures should practice the concept
of mutual accountability (including naming and sham-
ing) rather than government-to-donor accountability
to infl uence donor behavior on aid effectiveness in
general, and on alignment and harmonization in par-
ticular. The concept of division of labor among donors
through the introduction of lead and silent donors,
delegated partnership, or specialization in a few sec-
tors has yet to be practiced in Ethiopia.
The composition of the existing consultative and co-
ordination mechanisms at all levels do provide room
for all stakeholders to voice their concerns and issues.
However, in terms of power and decision making, one
can say that it is dominated by the government and
donors. The involvement of the private and NGO sec-
tors is weak. This is justifi ably so for reasons related
to their limited roles (comparatively) in service deliv-
ery and management, and their weak organizational
strength. But it is a challenge for the private sector
and NGOs to align their interests and strengthen their
negotiating ability with the government and donors.
34 WOLFENSOHN CENTER FOR DEVELOPMENT
REFERENCES
Alemu, G. 2002. Aid-driven Import Substitution and
the Agriculture-industry Nexus: Conceptualizing
the Aid-growth Relationship in Ethiopia. Ph.D dis-
sertation, Maastricht: Shaker Publishing.
2006. “Problem of Low/Slow Disbursement
in the World Bank Funded Projects in Ethiopia,”
Study commissioned by and submitted to African
Economic Research Consortium (AERC), Nairobi,
Kenya.
Banteyerga, H. et al. 2006. “The System wide effects
of the Global Fund in Ethiopia,” Report commis-
sioned by USAID, Abt Associates.
FMOH/HCF secretariat. 2006. NGO involvement in
Ethiopian Health Sector: Facts, Challenges and
Suggestions for Collaborative Environment. Addis
Ababa.
Government of Ethiopia. 2005. Ethiopia Harmonization
Action plan 2004-2006. Addis Ababa.
International Development Association Resource
Mobilization. 2007. “Aid Architecture: An Over-
view of the Main Trends in Offi cial Development
Assistance Flows.”
Kharas, H. 2007. “Trends and Issues in Development
Aid,” Wolfensohn Center for Development
Working Paper 1.
Knack, S. and A. Rahman. 2004. ”Donor Fragmentation
and Bureaucratic Quality in Aid Recipients,” World
Bank Policy Research Working Paper 3186.
MoFED, Government of Ethiopia. 2003. Mechanisms
for Enhanced Government-Donor Dialogue in
Ethiopia.
2005. Bul let in of Externa l Economic
Cooperation. MoFED Cooperation Section.
2006. Ethiopia: Building on Progress A Plan for
Accelerated and Sustained Development to End
Poverty (PASDEP) (2005/06-2009/10). Volume
I: Main Text.
2007. Ethiopia: Building on Progress: A Plan
for Accelerated and Sustained Development to
End Poverty (PASDEP), Annual Progress Report
2006/07.
2007. Annual Report on Macroeconomic
Developments EFY 1999 (2006/07), Macro
Economy Policy and Management Department.
n.d. “Problems Encountered in Mobilizing
Foreign Resources and Donor-funded Project
Implementation and Follow-up,” Prepared in
Amharic by the Multilateral and Cooperation
Department (Cooperation Section).
MoH, Government of Ethiopia. 2006. Ethiopia’s Third
National Health Accounts, 2004/0.
2007. Resource Mapping.
2008, Draft HSDP III Midterm Review Report.
Ooms, G. et al. 2008. ”The Diagonal Approach to
Global Fund Financing: a Cure for Broader Malaise
of Health System,” Globalization and Health,
4(6).
Powell , A. and M. Bobba. 2006. “Multi lateral
Intermediation of Foreign Aid: What is the Trade-
Off for Donor Countries?” Inter-American De-
velopment Bank Research Department, working
paper series; 594.
A CASE STUDY ON AID EFFECTIVENESS IN ETHIOPIA 35
Organization for Economic Co-operation and Devel-
opment. 2005. High Level Forum for MDGs, Fiscal
Space and Sustainability from the Perspective of
the Health Sector, Paris,
2008a “Scaling up Aid Fragmentation, Aid
Allocation, and Aid Predictability: Report of 2008
Survey of and Allocation Policies and Indicative
Forward Spending Plan.”
2008b. “Survey on Monitoring the Paris
Declaration: Effective Aid by 2010? What it will
take,” Vol. 1 Overview, 3rd High Level Forum on
Aid Effectiveness, September 2-5, 2008. Accra,
Ghana.
Ruth, V. H. 2005. “Assessing rhetoric and reality in
the predictability of aid,” Human Development
Report Offi ce Occasional Paper, UNDP.
United States Government. 2006. Ethiopia FY 2006
County Operational Plan.
Waddingtton, C. 2008. “Review of Adherence to the
Health Sector Code of Conduct, Ethiopia,” Draft
report for the Health Pooled Fund.
World Bank. 2003. Ethiopia: Public Expenditures
Review. Two volumes, Report No. 29338-ET.
2003. “Country Assistance Strategy,” Report
No. 25591-ET.
2007. “Protecting Basic Services (PBS)
Program Joint Review and Implementation
Support Mission Aid Memoire.”
2008. “Country Assistance Strategy,” Report
No. 43051-ET.
World Health Organization. 2007. “Aid Effectiveness
and Health, Health System,” Working Paper 9.
36 WOLFENSOHN CENTER FOR DEVELOPMENT
ENDNOTESFor an account of the special interest of the role
of aid in Ethiopia see Getnet 2002 and 2006.
Other multilateral sources include: GEF, Nordic
Development Fund, IFAD, UNDP, UNFPA, UNHCR,
UNICEF, UNAIDS, UNTA, and WFP.
Other bilateral sources include: Australia, Aus-
tria, Belgium, Denmark, Finland, France, Greece,
Luxemburg, New Zealand, Portugal, Spain, Swit-
zerland, Czech Republic, Hungary, Korea, Poland,
Slovak Republic, Thailand, Turkey, and Arab coun-
tries. All data used in this study were extracted
from OECD.Stat on April 28, 2008, unless and
otherwise indicated. Data represent donors active
since 2000.
Values are in 2006 constant price, US$ millions.
Of the total net ODA Ethiopia received in 2006,
IDA (17 percent) and USA (16 percent) forms the
single most important source from multilateral
and bilateral group.
It should be noted, however, that, considering the
total aid infl ows, Ethiopia receives a signifi cantly
lower level of development aid than most other
low-income countries. Excluding humanitarian
relief, aid infl ows have averaged between $7.5
and $9.0 per capita over the past decade, rising
to about $12 per capita in the recent past against
$23.0 for sub-Saharan Africa and $21 for all least
developed countries. (See World Bank, 2003:7;
World Bank, 2004:28; MoFED, 2005:18.)
National accounts are defl ated by GDP defl ator
(2006/07 price) and converted into US$ by using
the average exchange rate.
Data sources are OECD.Stat and Resource Map-
ping Study for Education, Health, and HIV/AIDS,
MoH forthcoming.
It should be noted, however, that the data on aid
in the health sector is disbursement and not ac-
tual expenditure.
For details see World Bank 2008: Figure 3.
1.
2.
3.
4.
5.
6.
7.
8.
9.
Humanitarian aid has increased more than four
times.
WHO (2007:3).
FMOH, Second National Health Account 2003,
draft and not published
FMOH, HCF Secretariat. 2003. “NGO Involvement
in the Ethiopian Health Sector: facts, challenges,
and suggestions for collaborative environment.”
Addis Ababa
Gorik Ooms and et al (2007).
There are three disbursement channels prac-
ticed in Ethiopia. Channel 1 refers to those funds
coming through the central treasury; Ministry of
Finance and Economic Development. Funds dis-
bursed through channel 2 directly go to line min-
istries and/or lower level of public agencies. Funds
disbursed through channel 3 are directly goes to
implementers completely bypassing the main-
stream budget process.
See Radelet (2006), Knack and Rahman (2004)
and Roodman (2006).
See Knack and Rahman (2004:14-15).
The Development Gateway’s AiDA (Accessible In-
formation on Development Activities) database is
used to construct this kind of aid fragmentation
index. This source contains records provided by
the DAC and other sources on investment proj-
ects and other activities fi nanced by various do-
nor agencies.
See Knack and Rahman (2004:14).
The Hirschman-Herfi ndahl Index is more common-
ly used as a measure of the degree of concentra-
tion—in terms of the number and size of fi rms—in a
given industry. In this case, the parameter s would
be interpreted as the market share of each indi-
vidual fi rm. The lower (higher) is the index, the
more (less) competitive is the industry. A value
of 1 for the index indicates a single monopolis-
tic fi rm. (International Development Association
Resource Mobilization (FRM) February 2007, Aid
10.
11.
12.
13.
14.
15.
16.
17.
18.
19.
20.
A CASE STUDY ON AID EFFECTIVENESS IN ETHIOPIA 37
Architecture: An overview of the main trends in
offi cial development assistance fl ows.)
See Knack and Rahman (2004:13-14).
If there is no any dominant donor and all have
somehow equal share, the fragmentation index
will take higher values.
If there is no any dominant donor and all have
somehow equal share, the fragmentation index
will take higher values.
Canada alone accounts for 33.6 percent and UK
15.6 percent.
The data extracted from OECD.statistics on April
28, 2008 at 22:13 has serious problems. On the
one hand the total net ODA of all sectors is only
$1216.5 million while the total Net ODA by aid
types (CPA and non-CPA) is $1946.8 million for
2006. The net ODA for health sectors for 2006,
for instance, did not include some bilateral and
multilateral donors like Italy, AfDB, EC, UNFPA,
and UNICEF to mention a few.
OECD/DAC (2005:22).
OECD/DAC, High Level Forum, Joint Progress to-
ward Enhanced Aid effectiveness, Harmonization,
Alignment Results: Report on Progress Challeng-
es and opportunities, 2005, p 22.
Catriona (2007:55)
The Ethiopian budget year runs from July to June
and the calendar year runs from September to
August while most donor calendars follow Janu-
ary to December. Two Ethiopian calendar years
therefore fall into three donor calendar years.
Donors therefore have to grapple with scheduling
their funding to fi t to Ethiopian fi scal year. This
has therefore complicated the alignment agenda.
See GoE (2005)
PBS has two components: component one con-
sisting of block grants to Regional states and Dis-
tricts and component two of health sector com-
modities.
21.
22.
23.
24.
25.
26.
27.
28.
29.
30.
31.
Aid includes grants and loans from the govern-
ment budget document.
These are Amhara, Oromia, Southern Nations Na-
tionalities and Peoples, and Tigray regional state.
Based on the interview with Mr. Admasu Nebebe,
UN team leader, Multilateral Department, MoFED.
GoE (2003), Mechanisms for Enhanced Govern-
ment-Donor Dialogue in Ethiopia.
See Waddingtton (2008).
Donors that have signed the COC for the sector
include ADB, DFID, GAVI, Irish Aid, Italian Coop-
eration, Royal Netherlands’s Embassy, SIDA, UN-
AIDS, UNFPA, UNICEF, WHO, and World Bank.
GoE and DAG (2006) Draft Joint Declaration on
Harmonization, Alignment and Aid Effectiveness.
The percent is computed as a ratio of government
budget estimates of aid fl ows to aid disbursed by
donors.
This includes budget execution, fi nancial manage-
ment, and auditing.
Total donor missions in the same year were 222.
32.
33.
34.
35.
36.
37.
38.
39.
40.
41.

38 WOLFENSOHN CENTER FOR DEVELOPMENT
Selected photos courtesy of the World Bank: cover left to right: (#4) Ami Vitale, (#6) John Isaac
The views expressed in this working paper do not necessarily refl ect the offi cial position of Brookings, its board or the advisory council members.
© 2009 The Brookings Institution
ISSN: 1939-9383
1775 Massachusetts Avenue, NWWashington, DC 20036202-797-6000www.brookings.edu/wolfensohncenter