Embed Size (px)
Citation preview

98th Congress JOINT COMMTTTEE P { S. PBT. App. 102d Session J 98-164
HARD CHOICES
A Report on the Increasing Gap Between America'sInfrastructure Needs and Our Ability To Payfor Them
Appendix 10. MASSACHUSETTS
A CASE STUDYPREPARED FOR THE USE OF THE
SUBCOMMITTEE ON ECONOMIC GOALS ANDINTERGOVERNMENTAL POLICY
OF THE
JOINT ECONOMIC COMMITTEECONGRESS OF THE UNITED STATES
31-895 0
FEBRUARY 25, 1984
Printed for the use of the Joint Economic Committee
U.S. GOVERNMENT PRINTING OFFICE
WASHINGTON: 1984

JOINT ECONOMIC COMMITTEE
(Created pursuant to sec. 5(a) of Public Law 304, 79th Congress)
SENATE
ROGER W. JEPSEN, Iowa, ChairmanWILLIAM V. ROTH, JR., DelawareJAMES ABDNOR, South DakotaSTEVEN D. SYMMS, IdahoMACK MATTINGLY, GeorgiaALFONSE M. D'AMATO, New YorkLLOYD BENTSEN, TexasWILLIAM PROXMIRE, WisconsinEDWARD M. KENNEDY, MassachusettsPAUL S. SARBANES, Maryland
HOUSE OF REPRESENTATIVES
LEE H. HAMILTON, Indiana, Vice ChairmanGILLIS W. LONG, LouisianaPARREN J. MITCHELL, MarylandAUGUSTUS F. HAWKINS, CaliforniaDAVID R. OBEY, WisconsinJAMES H. SCHEUER, New YorkCHALMERS P. WYLIE, OhioMARJORIE S. HOLT, MarylandDAN LUNGREN, CaliforniaOLYMPIA J. SNOWE, Maine
Baucm R. BARTLETT, Extecutive DirectorJAMES K. GALBRAITH, Deputy Director
SuBCOMMITTEE ON ECONOMIC GOALS AND INTERGOVERNMENTAL POLICY
HOUSE OF REPRESENTATIVES
LEE H. HAMILTON, Indiana, ChairmanAUGUSTUS F. HAWKINS, CaliforniaOLYMPIA J. SNOWE, Maine
SENATE
LLOYD BENTSEN, Texas, Vice ChairmanROGER W. JEPSEN, IowaALFONSE M. D'AMATO, New York
(U)

Preface
Infrastructure problems are widespread. They do not respect regional
or state boundaries. To secure a better data base concerning national and
state infrastructure conditions and to develop threshold estimates of
national and state infrastructure conditions, the Joint Economic Committee
of the Congress requested that the University of Colorado's Graduate School
of Public Affairs direct a twenty-three state infrastructure study.
Simultaneously, the JEC appointed a National Infrastructure Advisory
Ccmnittee to monitor study progress, review study findings and help develop
policy recommendations to the Congress.
In almost all cases, the studies were prepared by principal analysts
Erom a university or college within the state, following a design developed
by the University of Colorado. Close collaboration was required and was
received from the Governor's staff and relevant state agencies.
Because of fiscal constraints each participating university or college
agreed to forego normal overhead and each researcher agreed to contribute
considerable time to the analysis. Both are to be commended for their
commitment to a unique and important national effort for the Congress of
the United States.
(m3)

National Infrastructure_ NllvisoryoCaaritteeJointEco omic Cneutt-ee infrastructure Proiect
Chairman
Honorable Henry S. Reussformer Chairman Joint nconomic Canmittee
Chapman, Duff & PaulWashington, D.C. 20006
Vice Chairmen
Mr. Peter GoldmarkExecutive DirectorPort Authority of N.Y. & N.J.New York, N.Y.
Mr. Lee WhiteVice President & ManagerDenver OfficeSmith Barney, Harris Upham & Co.Denver, Colorado
Committee Members
Mr. Roy BahlDirector, MetropolitanSyracuse UniversitySyracuse, N.Y.
Studies ProgramHonorable Michael DukakisGovernor of MassachusettsBoston, Massachusetts
Mr. C. Phillip BaumelProfessorAgricultural EconomicsIowa State UniversityAmes, Iowa
Mr. Michael BrewerDirector of Government Relations/Public Affairs
Cummins Engine Co.Columbus, Indiana
Mr. Pat ChoateSenior Policy Analyst, EconomicsTRW, Inc.Washington, D.C.
Mr. Peter M. DawkinsManaging DirectorLehman Brothers Kuhn Loeb, Inc.New York, N.Y.
Mr. Robert GeorginePresidentBuilding & Construction TradesWashington, D.C.
Mr. Hyman GrossmanVice President, Municipal RatingStandard & Poor's Corp.New York, N.Y.
Honorable William HobbyLt. Governor of TexasAustin, Texas
Honorable Thomas H. KeanGovernor of New JerseyTrenton, New Jersey
(V)

VI
Mr. Thomas KlutznlcxMiller, Klutznick, Davis & GreyChicago, Illinois
Ms. Juanita KrepsFormer U.S. Secretary of CoxmerceDuke UniversityDurham, N.C.
Honorable Richard D. LammGovernor of ColoradoDenver, Colorado
Mr. Peter LewisPartnerLazard FreresNew York, N.Y.
Ms. Jane McGrewSteptoe & JohnsonWashington, D.C.
Honorable John MutzLt. Governor of IndianaIndianapolis, Indiana
Mr. Raymond NasherChairmanNasher Co.Dallas, Texas
iMr. George PetersonDirector, Public Finance CenterThe Urban InstituteWashington, D.C.
Mr. Leland S. PrussiaChairman of the BoardBank of AmericaSan Francisco, Ca.
Honorable Charles RoyerMayorCity of SeattleSeattle, Washington
Mr. George SchraderL.D. Brinkman & Co.Dallas, Texas
Honorable Ted SchwindenGovernor of MontanaHelena, Montana
Honorable John SpellmanGovernor of WashingtonOlympia, Washington
Honorable Mark WMiteGovernor of TexasAustin, Texas
Mr. John WiedemanPresidentAmerican Society of Civil EngineersAtlanta, Georgia
Honorable Coleman A. YoungMayorCity of DetroitDetroit, Michigan

PARTICIPATINJG SPATIS AND RICO ARCIII1IUS
State Researchers and Affiliation
Alabama Niles SchoeningUniversity of Alabama
California Fred CollignonUniversity of California at Berkeley
Colorado James OhiUniversity of Colorado at Denver
Florida Earl StarnesNeil SipeUniversity of Florida
Indiana Salmon ShahMorton MarcusIndiana University
Kentucky Phillip W. RoederDennis B. MurphyUniversity of Kentucky
Louisiana James D. SchillingLouisiana State University
Maine Carl VeazieUniversity of Southern Maine
Maryland David L. PuryearJohns Hopkins University
Massachusetts Karen PolenskeGerald SussmanRichard TaborsLyn TodmanPAdrian WalterJoint Center for Urban Policy ResearchMIT and Harvard University
Missouri L. Kenneth HubbellUniversity of Missouri at Kansas City
Montana James OhiUniversity of Colorado at Denver
New Jersey Robert LakeRutgers University
New Mexico Lee ZinkUniversity of New Mexico
(VII)
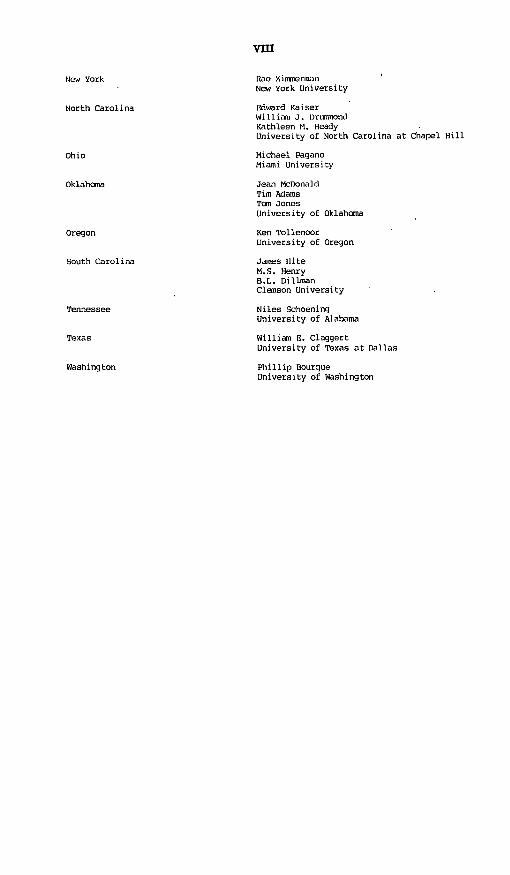
Vm
Rae ZimmermanNew York University
Edward KaiserWilliam J. .ruimondKathleen M. HeadyUniversity of North Carolina at Chapel Hill
Michael PaganoMiami University
Jean McnonaldTim AdamsTom JonesUniversity of Oklahoma
Ken TollenoorUniversity of Oregon
James HiteM.S. HenryB.L. DillmanClemson University
Niles SchoeningUniversity of Alabama
William E. ClaggertUniversity of Texas at Dallas
Phillip BourqueUniversity of Washington
New York
North Carolina
Ohio
Oklahoma
Oregon
South Carolina
Tennessee
Texas
Washington

AN ASSESSMENT OFPUBLIC INFRASTRUCTURE IN MASSACHUSETTS
April 1983
(Latest revision,September 1983)
by
Karen R. Polenske, Gerald Sussman, Richard D. Tabors,Lynn C. Todman, and Adrian R. Walter
Joint Center for Urban Studiesof the
Massachusetts Institute of Technologyand
Harvard University
TABLE OF CONTENTS
Title Page
List of Figures xv
List of Tables xvi
List of Abbreviations xviii
Acknowledgments xix
AN ASSESSMENT OF PUBLIC INFRASTRUCTURE IN MASSACHUSETTS 1
Part 1, EXECUTIVE SUMMARY FOR MASSACHUSETTS 2
General Conclusions 2Specific Conclusions 2
Part 2, BACKGROUND TO THE ANALYSIS 6
METHODS OF ANALYSIS 6
State Agencies 7Regional Planning Commissions 13
CONTEXT FOR THE STUDY 15
Economic Factors 17Population Trends -17
Part 3, TRANSPORTATION INFRASTRUCTURE 19
MASSACHUSETTS BAY TRANSPORTATION AUTHORITY 19
Bus System 22
Facilities, Age, and Current Condition 22Maintenance Plans and Costs 25Purchase Plans and Costs 29
Rapid Transit 29
Facilities and Age 29Construction Plans and Costs 31
The Green Line 35Commuter Rail 37
Facilities 37Maintenance Plans and Costs 38Construction Plans and Costs 43

Title
STATE-OWNED RAILROAD GRADES AND CROSSINGS 47.
STATE-OWNED RAILROAD BRIDGES AND TUNNELS 47
REGIONAL TRANSIT AUTHORITIES 49
Facilities 49
Maintenance Plans and Costs 49
HIGHWAY BRIDGES 51
Facilities, Age, and Current Conditions 51
Maintenance Plans and Costs 55
Construction Plans and Costs 59
AIRPORTS 59
Facilities and Age 60
Maintenance Plans and Costs 63
Construction Plans and Costs 67
SEAPORTS 67
Facilities, Age, and Condition 70
Maintenance Plans and Costs 71
Construction Plans and Costs 72
HIGHWAYS 74
Facilities and Age 75
Maintenance Plans and Costs 80
Construction Plans and Costs 81
TUNNELS 81
SUMMARY 82
Part 4, ENVIRONMENTAL INFRASTRUCTURE--WATER 84
WATER 84
Water Supply 90
Existing Facilities and Age 92
Current Conditions 95
Needs 98
Plans 99
Page
Page
Water Distribution ioi
Existing Facilities and Age 102Current Conditions 103Maintenance Plans 107Maintenance Costs 109Construction Plans 115
SUMMARY 116
Part 5, ENVIRONMENTAL INFRASTRUCTURE--SEWERAGE SYSTEM 118
SEWAGE TREATMENT 119
Existing Facilities and Age 120Current Conditions 120Maintenance Costs 123Construction Costs 123Construction Needs 123Construction Plans 130
SEWAGE COLLECTION SYSTEM 130
Existing Facilities and Age 130Needs 134Construction Plans 134
HAZARDOUS WASTE 135
Existing Facilities 136Needs 137Costs 137
SUMMARY 137
Part 6, SUMMARY OF NEEDS AND REVENUES: MASSACHUSETTS 140
NEEDS 140
Title
145REVENUES

Title Page
APPENDIX A, MASSACHUSETTS REGIONAL TRANSIT AUTHORITIES 149
APPENDIX B, RTA FACILITY SURVEY 150
APPENDIX C, MASSACHUSETTS INFRASTRUCTURE STUDY, 1983:QUALITY OF INFORMATION AVAILABLE 151
APPENDIX D, REGIONAL PLANNING DISTRICTS 154
APPENDIX E, INTERVIEW GUIDELINES 155
LIST OF REFERENCES 163

LIST OF FIGURES
Figure No. Title Page
1-1 Capital Expenditures in Massachusetts byType, FY1968-69 through FY1981-82 4
1-2 Revenues in Massachusetts for CapitalExpenditures for Highways and Sewers,FY1973-74 through FY1982-83 5
3-1 1982 Commuter Rail Network 39
3-2 Number of State-Owned Bridges BuiltPer Year 53
3-3 Number of City/Town-Owned BridgesBuilt Per Year 54
3-4 AASHTO Sufficiency Ratings <80 57
3-5 AASHTO Sufficiency Ratings <50 58
3-6 Airport Coverage in Massachusetts 61
3-7 Massachusetts Essential Airport System 62
4-1 Source of Water Supply for MassachusettsCommunities, 1982 93
4-2 Projected 1990 Water Supply Status forMassachusetts Communities, PreliminaryAssessment 96
4-3 Communities Applying for 406 and 805 LocalAssistance Grant Programs 110
Exhibit 5-1 Prioritized List of Projects 125

LIST OF TABLES
Table No. Title Page
3-1 Book Value of Selected MBTA TransportationEquipment/Facilities, 1982 21
3-2 Listing of MBTA Federal Funding to 1983 23
3-3 Transit Capital Funding Schedule FY1981-1987 24
3-4 Major Mass Transit/Bus Service Maintenanceand Repair Projects as of 1983 26
3-5 MBTA Bus Garage/Storage Facility (1982) 28
3-6 Value of Rapid Transit/Green Line Stations 30
3-7 MBTA Rapid Transit/Green Line Vehicle andTrack Statistics, 1983 32
3-8 Rapid Transit Rail Equipment/Green LineRequested Maintenance 1983/FY1984 33
3-9 The Green Line, 1982 36
3-10 Commuter Rail Inventory, 1981 40
3-11 Commuter Rail Rolling Stock, 1981 41
3-12 1983 MBTA Commuter Rail Operated Rail Lines 4-2
3-13 Commuter Rail Improvement Program (CRIP) 44
3-14 5-Year Commuter Rail Improvements Summaryof Costs, 1983-1987 46
3-15 Railroad/Highway Grade Crossing Projects1982 and Proposed 1983 Costs 48
3-16 RTA Fixed-Route Service, FY1982 50
3-17 Highway Bridges--Existing Facilities 52
3-18 AASHTO Rating of Massachusetts Bridges 56
3-19 Airport and Runway Description 64
3-20 Airport Construction Plans and Costs, FY83 68

Table No.
3-21 Existing System Mileage by FunctionalClassification 76
3-22 Existing Mileage by Funding System 76
3-23 Funding Systems 77
3-24 Jurisdictional Comparison 78
3-25 Road Miles and Daily Vehicle Miles Traveled 78
3-26 Summary of Capital Investment Needs andRevenues in Massachusetts--Transportation 83
4-1 Population and Water Supply for Communitiesof 10,000 or More, 1982 85
4-2 Recent Population Trends in Six Water-SupplySystems 91
4-3 Number of Miles of Water Mains in SelectedTowns, Age of Oldest Mains, and Percentageof System Metered, 1979 104
4-4 Water Distribution in the Old Colony PlanningCouncil Region 106
4-5 Summary of Leak Detection Grants Awardedthrough 1983 111
4-6 Estimated Cost of Rehabilitation andReplacement, and Method of Water DepartmentFinancing, 1979 112
4-7 Summary of System Rehabilitation GrantsAwarded through 1983 113
4-8 Summary of Capital Investment Needs andRevenues in Massachusetts--Water Supply 117
5-1 SRPEDD District Sewage Treatment Facilities 121
5-2 1982 EPA Assessment of Backlog Costs 129
5-3 1982 Estimates of Year 2000.Needs 131
5-4 Sewage Systems in Selected Cities and Towns 133
5-5 Summary of Capital Investment Needs andRevenues in Massachusetts--Wastewater 138
6-1 Summary of Capital Investment Needs andRevenues in Massachusetts 14].
31-895 0 - 84 - 2
Title Page

LIST OF ABBREVIATIONS
AASHTO American Association of State Highway and
Transportation Officials
B&M Boston and Maine
CTPC Central Transportation Planning Commission
DEM Department of Environmental Management
DEQE Department of Environmental Quality Engineering
EDA [U.S.] Economic Development Administration
EMMA Eastern Massachusetts Metropolitan Area
EOEA Executive Office of Environmental Affairs
EOTC Executive Office of Transportation and Construction
EPA [U.S.] Environmental Protection Agency
FHWA Federal Highway Administration
FY Fiscal Year
GAO [U.S.] Government Accounting Office
LRV Light Rail Vehicle
MAC Massachusetts Aeronautics Commission
MBTA Massachusetts Bay Transportation Authority
MDPW Massachusetts Department of Public Works
MDC Metropolitan District Commission
MTA Metropolitan Transportation Authority
mgd million gallons per day
NMRPC Northern Middlesex Regional Planning Commission
OCPC Old Colony Planning Council
PCC Presidential Conference Car
RDC Rail Diesel Car
RPA Regional Planning Agency
RTA Regional Transit Authority
SRPEDD Southeastern Regional Planning and Economic Development
TOTOA Toronto Area Transportation Operating Authority
TRIP The Road Information Program
UMTA (U.S.] Urban Mass Transportation Administration

ACKNOWLEDGMENTS
This project could not have succeeded without the direct
and indirect help of many people. The research staff particularly
thanks Mr. Alden Raine, Director of the Governor's Office of Economic
Development. His office provided some of the financial support
for the project and helped locate key personnel within each agency
from whom staff members could obtain the information presented in
the report. Louis S. Moore from that office was the liaison with
the research staff. An initial meeting held in Mr. Raine's office
on February 10, 1983, helped to establish the setting within which
the research could be conducted as quickly as possible. As a result
of that meeting, staff members met with James P. Atkinson, Special
Assistant to the Secretary of the Executive Office of Transportation
and Construction, and with Elizabeth Kline, special assistant to
the Secretary of the Executive Office of Environmental Affairs,
both of whom were key people in helping to locate the information
and in identifying state personnel with whom the research staff
could meet. In addition, both Mr. Atkinson and Ms. Kline read
drafts of this report and provided many valuable comments on it.
Staff members met with a large number of people in the state
and also communicated with many other people in the state and in
Washington, DC, by phone. The list is long. Some spent only a
small amount of time, while others devoted several days in helping.
To each, we express our deep appreciation. They include:
Budget BureauMary Shaughnessy, Assistant Budget DirectorAlexandra Schweitzer, Budget Analyst

Central Transportation Planning StaffToby Pearlstein, Librarian
Department of Environmental ManagementDiane Hoffman, Project Manager for Policy Development,
Bureau of Solid Waste Disposal
Department of Environmental Quality EngineeringGeorge Howland, Division of Water Supply
Paul Taurasi, Chief Engineer, Construction Grants Program,
Division of Water PollutionHank Southworth, Acting Section Chief, Policy and Program
Management, Division of Hazardous Waste
Executive Office of Environmental AffairsRichard Thibedeau, Chief Planner,Division of Water Resources Planning
Executive Office of Transportation and ConstructionPaul McBride, Assistant Secretary for Rail OperationsHoward Taub, Planner
Massachusetts Aeronautics CommissionRichard Kimball, Airport EngineerDavid Graham, Chief Aeronautical Inspector
Massachusetts Bay Transportation AuthorityFrancis X. Crowley, Chief Rail Maintenance Officer
Ralph Duvall, Chief Engineer, Engineering Maintenance
Robert Gerry,.Assistant Chief, Automotive Equipment Officer
Lawrence Gleason, Department Supervisor of Everett Shops
Thomas Kennedy, Capital Funding ManagementWilliam MacDonald, Assistant Director & Chief Engineering
Officer for Railroad OperationsRobert Pittman, Supervisor
Massachusetts Department of Public WorksFrancis Bratton, Assistant Maintenance Structural Engineer
Norman Diegoli, Deputy Chief Engineer for Highway Maintenance
Phillip Hughes, Assistant Supervisor for Highway Data and
StatisticsRichard H. McGinn, Maintenance Structural Engineer
Thomas Richardson, Central Environmental Planning Office
Administrator
Massachusetts Port AuthorityAnne Aylward, Acting Port DirectorJoseph Brevard, Chief Planner
Massachusetts SenateCarol Amick, State SenatorSteven Karnas, Committee on Ways and Means

Massachusetts Turnpike AuthorityJohn Dias, Maintenance EngineerEdward King, Director of Community Relations
Metropolitan District CommissionJulia O'Brien, Planning Director
Office of Senator Paul TsongasSteven Johnson, Economic Development Assistant
The Road Information Program, Washington, DCSally Thompson, Research Director
Wallace, Floyd AssociatesWendy Landman, Senior Planner
Although staff members from the different regional planning commissions
are not listed separately here, we are grateful for the extensive
efforts some of them made to help us obtain information on local
infrastructure.
We are also appreciative of the financial and other support
supplied by the Joint Center for Urban Studies of the Massachusetts
Institute of Technology and Harvard University, and the Department
of Urban Studies and Planning of the Massachusetts Institute of
Technology. Bernard J. Frieden and Gary A. Hack from the Department
were instrumental in setting up the initial contact between Karen
R. Polenske and Richard D. Tabors from the Massachusetts Institute
of Technology, and Marshall Kaplan, from the University of Colorado,
who is coordinator for these infrastructure projects being undertaken
throughout the United States.
Finally, several of our colleagues from the Department of
Civil Engineering at the Massachusetts Institute of Technology were
especially helpful during this project. Both Thomas F. Humphrey
and Michael J. Markow provided staff members with transportation
literature from their personal files, met several times with us

to discuss specific issues and types of information, and read and
commented on drafts of this report. Nigel H.M. Wilson provided
useful information on the Massachusetts Bay Transportation Authority.
Daniel Mesnick, a graduate student in the Department of Urban Studies
and Planning, assisted in obtaining revenue and expenditures data.
We appreciate the care with which people read different
verisons of this report; the authors, of course,assume full
responsibility for the information reported.

AN ASSESSMENT OFPUBLIC INFRASTRUCTURE IN MASSACHUSETTS
The purpose of this report is to present a preliminary assessment of
public infrastructure in Massachusetts. During the study, major emphasis was
given to the identification and evaluation of current (1983) public
infrastructure for transportation, water, sewers, and hazardous waste. In
addition, an initial estimate was made of public infrastructure needs and
anticipated revenues (where possible to the year 2000). This is one of a
series of studies being conducted in over 20 states for the Joint Economic
Committee of the U.S. Congress. Stress must be placed on the preliminary
nature of the findings.
The first part of the report contains a summary of the major
conclusions. In the second part of the report, an explanation is given of the
methods used to obtain the information, and a brief introduction is provided
to the economic, political, and social factors in Massachusetts relevant to an
assessment of infrastructure in the state. The various types of
transportation infrastructure and environmental infrastructure are assessed in
the third and fourth parts of the report, respectively. The fifth part of the
report contains a brief discussion of public infrastructure needs, and the
final part contains some general policy recommendations for the state.
(it

Part 1
EXECUTIVE SUMMARY FOR MASSACHUSETTS
General Conclusions
Most maintenance expenditures are being deferred, forcing a crisisresponse rather than planned maintenance.
The completion date of a fair number of projects is being delayed or the
project is not being completed because of lack of funds.
Capital expenditures for current needs are insufficient.
Few consistent data exist across administrative divisions with which to
evaluate the overall state of infrastructure needs. Such data can be, and
some were, obtained from the 14 Regional Transportation Authorities, but
comparable infrastructure data were not obtained from most of the 13
Regional Planning Agencies.
Specific Conclusions
Bridges and tunnels (roads and rail) require immediate attention as
deferred maintenance has created a potential for catastrophic failure.
Within the MBTA, the system age and deferred maintenance with limited
funds for system rejuvenation are causing lowered reliability and,
apparently, higher average operating costs.
There are no serious problems with airports.
Current planning for harbor development appears adequate.
In the area of potable water supply, the state has initiated its own
program to repair the distribution system. However, insufficient
information is available to define and assess the full magnitude of the
problem. It appears that available funds do not meet needs.
While considerable planning and publicity have occurred, no solution to
in-state handling of hazardous waste has been found.
Meeting the federal requirements for sewage treatment and disposal will
require a massive investment in treatment and facilities over the next
decade. Lack of improvements to sewage treatment are perceived by many to
be the major impediment to the cleanup of Boston Harbor.
The quality of (and therefore the need for) roads within the state is
dependent upon the administrative jurisdictions under whose authority they
fall and often on the wealth of the community in which they exist.
(2)

3
To provide an overview of past trends, annual data were assembled on
expenditures and revenues on transportation and environmental infrastructure.
All data were converted to constant 1982 dollars. The annual data are shown
graphically in Figures 1-1 and 1-2.
As shown in Figure 1-1, expenditures on water-supply infrastructure
have increased gradually from a low of $38 million in FY 1968-69 to $64
million in FY 1981-82. A surge in expenditures in FY 1974-75 to $169 million
was a one-year phenomenon that did not recur in later years. Expenditures on
sewerage infrastructure also increased from $80 million in FY 1968-69 to $153
million in FY 1981-82, with a year of peak expenditures of $160 million
occurring in FY 1972-73 and another of $251 million occurring in FY 1979-80.
These increases in environmental infrastructure expenditures were more than
offset by the decreases in highway expenditures, from a total of $500 million
in FY 1968-69 to a total of only $299 million in FY 1981-82.
As shown in Figure 1-2, revenues in Massachusetts both for highways
and sewerage have declined significantly since the early 1970
s. Revenues for
sewerage fell from a high of $310 million in 1973-74 to a low of $69 million
in 1982-83, while those for highways fell from $283 million in 1974-75 to a
low of $126 million in 1982-83.
Emphasis should be given to the fact that the annual expenditures and
revenues portrayed in Figures 1-1 and 1-2 represent only a portion of the
total infrastructure expenditures and revenues during this time period.
Annual data for other infrastructure categories were not readily available. A
few of the critical factors that have affected the individual infrastructure
expenditures and revenues are indicated throughout the remainder of this
report.

\\ I, Io ~~~- Aggregate
, Highway
"I \ A. \ / Sewerage
. --. / * Water
1968- 1969- 1970- 1971- 1972- 1973- 1979- 1975- 1976- 1977- 1978- 1979- 1900- 1901- Fi-caI Year1969 1970 1971 1972 1973 1974 1975 1976 1977 1978 1979 1980 1981 1982
Figure 1-1. Capital Expenditures in Massachusetts by Type,FY1968-69 through FY1981-82
SOURCE: Expenditures Data: U.S. Bureau of the Census. Governmental Finances.Washington, DC: Government Printing Office, various years.Deflators: U.S. Department of Commerce, Bureau of EconomicAnalysis "BEA Deflators," unpublished worksheets.
Mill ... 650-of
198201. la-e 600
550 -
500
450-
400-
350-
300
250
200-
150 -
100-
50-
. . . . . . . . . . .
" 1,

Millions
1982Dollars 350
325
300 "
275 "
250
225
200
175
150
125
100
75 ~50 '
25
I a I I |
1973- 1974- 1975- 1976- 1977- 1978- 1979- 1980- 1981- 1982- Fiscal Year1974 1975 1976 1977 1978 1979 1980 1981 1982 1983
Figure 1-2. Revenues in Massachusetts for Capital Expenditures forHighway and Sewers, FY1973-74 through FY1982-83.
SOURCE: Data received directly from the Federal Highway Administration and theSewer and Water Monitoring Division, Environmental Protection Agency.
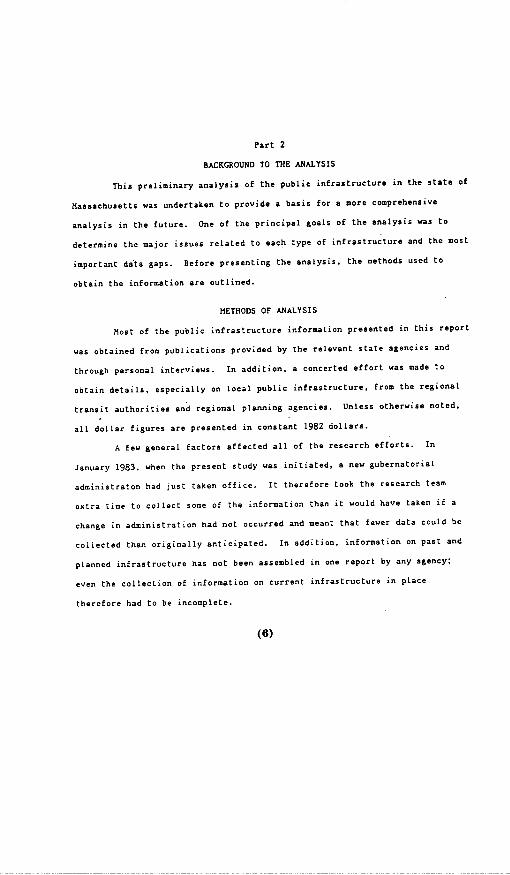
Part 2
BACKGROUND TO THE ANALYSIS
This preliminary analysis of the public infrastructure in the state of
Massachusetts was undertaken to provide a basis for a more comprehensive
analysis in the future. One of the principal goals of the analysis was to
determine the major issues related to each type of infrastructure and the most
important data gaps. Before presenting the analysis, the methods used to
obtain the information are outlined.
METHODS OF ANALYSIS
Most of the public infrastructure information presented in this report
was obtained from publications provided by the relevant state agencies and
through personal interviews. In addition, a concerted effort was made to
obtain details, especially on local public infrastructure, from the regional
transit authorities and regional planning agencies. Unless otherwise noted,
all dollar figures are presented in constant 1982 dollars.
A few general factors affected all of the research efforts. In
January 1983, when the present study was initiated, a new gubernatorial
administraton had just taken office. It therefore took the research team
extra time to collect some of the information than it would have taken if a
change in administration had not occurred and meant that fewer data could be
collected than originally anticipated. In addition, information on past and
planned infrastructure has not been assembled in one report by any agency;
even the collection of information on current infrastructure in place
therefore had to be incomplete.
(6)

7
State Agencies
The study of public transportation infrastructure was begun with a
search at the Central Trarisportation Planning Staff library. The library was
a source of historical and background information; however, there wars very
little current information. The Executive Office of Transportation and
Construction provided literature on public transportation facilities. The
rapidly changing situation with respect to inventory, particularly rolling
stock, rendered much of the documentation in this literature out-of-date.
In attempting to collect information on the various transportation
modes under the Massachusetts Bay Transportation Authority (MBTA). it became
evident that political and economic factors affecting the IBTA, and its
predecessor the Metropolitan Transit Authority (MTA). created problems in
obtaining reliable and up-to-date data. The staff at the MBTA did actively
participate in locating and providing the information used in this report.
The data, however, were organized in a cumbersome and inadequate way for an
overall assessment of the mass transportation infrastructure.
The META library, to which the research staff was given access, was of
marginal utility, primarily because the studies conducted, which are numerous,
are of a narrowly focussed technical orientation, with little reference to the
whole of any single transit operation. The MBTA currently lacks a short-term
or long-term assessment of overall transit coordination and planning. Within
the last decade, rapidly increasing oil prices, general inflation, and the
current recession have transferred attention away from automobile and highway
transportation toward fixed-route mass transportation. More attention,
therefore, will start to be given in Massachusetts to long-term mass
transportation planning.
The MBTA also appears to be i highly fragmented operation, not only

8
with respect to its many areas of responsibility, including three separate
rapid transit lines, a light rail vehicle operation, an extensive bus and
commuter rail system, and a distinctive trackless trolley, but also with
respect to the areas of maintenance, storage, and other auxiliary (for
example, power and power generation) facilities. As a practical matter, it
was difficult to find any written or personal source of expertise on the
infrastructure in existence and needed for the overall MBTA operation, which
means that a great deal of effort and time was expended in piecing the
structure together from scattered sources of information.
A large portion of the most important data was taken not from
published accounts or interviews, but from summary sheets that were usually
not in a form easily available for public access. Hence, hastily assembled
summary sheets and reports tend to substitute for public transportation
studies or detailed annual reports. An MBTA "Management Report" for the new
Dukakis administration in January 1983 is the closest facsimile to a general
overview of the transportation system, but even this report provides little
descriptive indication of what overall standards the MBTA envisions as part of
an efficient mass transit system. The data gathered on the MBTA, then, was
obtained primarily from recently (1982,1983) published reports and unpublished
current summary sheets, which, though limited, appear to be generally
reliable.
For the Regional Transit Authorities (RTAs), the data were collected
from a published 1981-1982 "Operations Report," and from a questionnaire
mailed to all 14 RTAs by the Executive Office of Transportation and
Construction (EOTC) planning section. (The questionnaire is included as
Appendix A, and a map of the 14 RTAs is included as Appendix B.) The data
focus on future fixed-route bus service requirements. While the cost

9
projections cannot be precise, different inflation estimates employed allow
for a range of possibilities.
Data on state-owned railroad grades and crossings, bridges, and
tunnels were based upon information stored in the Massachusetts Department of
Public Works computer files.
Documented information on the current condition of the road system in
the state, especially local roads, was particularly difficult to locate, as
were plans for maintenance and construction. The Massachusetts Department of
Public Works (MDPW), was the major source of state highway and bridge
information. Most of the data were obtained through interviews, but a good
deal of that information is very tentative in nature. The tentative nature of
the information was reinforced by uncertainty at the MDPW regarding the
funding priorities and levels of Congressional appropriations. The
difficulties in collecting data were also a function of the significant recent
reductions in the MDPW staff. As a result, much of the information that
should have been available from the MDPW was incomplete or unavailable because
of an excessive backlog due to severe staff shortages. In spite of the
political and technical constraints they were operating under, the MDPW staff
were extremely helpful in providing the information on the state highway and
bridges used in this report.
As already indicated, data for the local road system was extremely
difficult, and, in some cases, impossible to collect because of the lack of a
centralized source of information. The Regional Planning Agencies were not
equipped or structured to overcome this problem. In some cases, the agencies
lacked even a process by which the type of information needed could be
collected. The most comprehensive source of local road information was the
Road Information Program in Washington D.C. Attempts to collect sufficient

10
and accurate data on the state's local road system would require more time and
staff than allotted for this study.
Collection of data on the state's seaport facilities was also hampered
by the lack of a centralized source of information. The staff at Massport
were able to provide some data on the New Bedford and Fall River ports,
however, as would be expected, most of the information provided was on the
Port of Boston. Again, because of the decentralized nature of the data,
additional time and staff would be required to collect comprehensive and
reliable information on the state's seaport facilities.
In contrast to the other transportation modes, information on the
state's airports is collected at a centralized location, the Massachusetts
Aeronautics Commission. The data immediately available at the Commission were
not comprehensive, but appeared to be reliable. There is every reason to
believe that in the future the Commission could be extremely useful in
providing additional help.
All of the information in this report on the Callahan and Sumner
Tunnels was obtained through telephone interviews with officials at
Massachusetts Turnpike Authority, under whose jurisdictions the Tunnels lie.
Efforts to collect more information on the state's tunnels will require
greater cooperation between the responsible state bodies and the research team
than occurred for the current project.
Altogether, the data collected on the public transportation sector
must be considered preliminary. Time factors, including limited preparation
time, made it impossible to examine the interface of public demands on mass
transit and political, economic, technical, and labor aspects of the question.
Perhaps the most striking planning consideration is the absence of literature
on the MBTA that would provide a comprehensive understanding of the system.
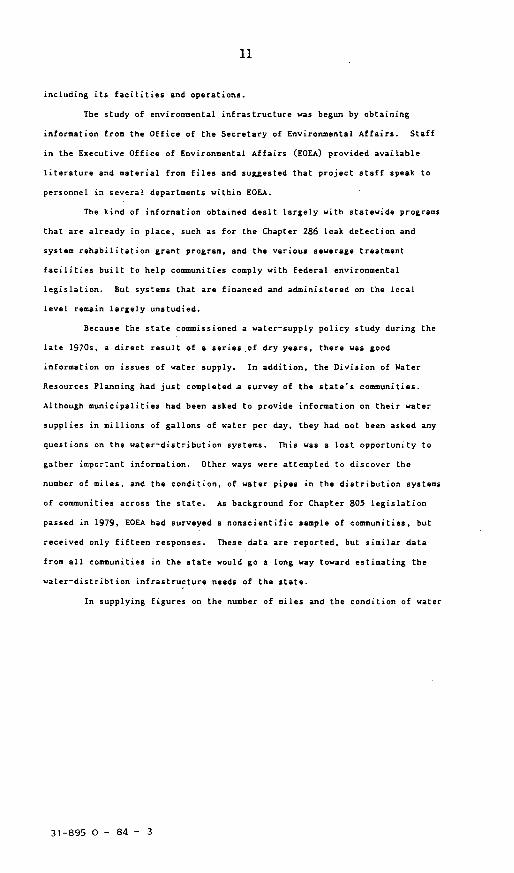
11
including its facilities and operations.
The study of environmental infrastructure was begun by obtaining
information from the Office of the Secretary of Environmental Affairs. Staff
in the Executive Office of Environmental Affairs (EOEA) provided available
literature and material from files and suggested that project staff speak to
personnel in several departments within EOEA.
The kind of information obtained dealt largely with statewide programs
that are already in place, such as for the Chapter 286 leak detection and
system rehabilitation grant program, and the various sewerage treatment
facilities built to help communities comply with federal environmental
legislation. But systems that are financed and administered on the local
level remain largely unstudied.
Because the state commissioned a water-supply policy study during the
late 1970s, a direct result of a series of dry years, there was good
information on issues of water supply. In addition, the Division of Water
Resources Planning had just completed a survey of the state's communities.
Although municipalities had been asked to provide information on their water
supplies in millions of gallons of water per day, they had not been asked any
questions on the water-distribution systems. This was a lost opportunity to
gather important information. Other ways were attempted to discover the
number of miles, and the condition, of water pipes in the distribution systems
of communities across the state. As background for Chapter 805 legislation
passed in 1979, EOEA had surveyed a nonscientific sample of communities, but
received only fifteen responses. These data are reported, but similar data
from all communities in the state would go a long way toward estimating the
water-distribtion infrastructure needs of the state.
In supplying figures on the number of miles and the condition of water
31-895 0 - 84 - 3

12
and sewer pipes in the Commonwealth, the staff at the Department of
Environmental Quality Engineering (DEQE) tried to be of assistance. However,
they do not have those data. A staff member in the Division of Water Supply
thought that information on sewage pipelines existed in the four regional
offices of DEQE. Because it was not possible to ascertain whether that
information existed in all of the offices, a site visit to each office to
obtain data was never arranged.
In short, the types of infrastructure financed, administered, or
monitored by the state, such as water supply and sewage treatment, were
relatively well-documented, but those of concern to localities remain
unstudied. At the state level, only problems that provided high levels of
funding and that received significant media attention have been studied by
others. Basic data collection needs have been largely ignored, with the
consequence that there is no assessment of the magnitude of the water and
sewerage infrastructure problem at the local level. The Chief Engineer.of the
Construction Grants Program in the Division of Water Pollution Control, DEQE,
for example, assured the staff that there was absolutely no way to discover
the miles or conditions of sewage pipes in the state without a major study by
a consulting engineer. The basic issue of the extent and condition of the
infrastructure that delivers water to, and removes sewage from, homes and
businesses is completely unaddressed by any data collection undertaken so far
by the Commonwealth.
The major difference between hazardous waste on the one hand, and
water and sewerage infrastructure on the other, is that hazardous waste
facilities are privately owned and operated, whereas water and sewerage
infrastructure is within the public sector. Because DEQE is a regulator, not
a provider, the only information available was that related to the existence

13
of hazardous waste-treatment facilities. In addition, a copy of an
environmental impact study on hazardous waste, which was completed in August
1982, was obtained.
In Appendix C, the research staff have presented a summary of their
judgments concerning the quality of the information available for use in
preparing this report. The assessments were based upon two factors: (1) the
amount of information available, and (2) the presumed reliability of the
information. The assignments of excellent, good, fair, and poor were
necessarily made using judgmental assessments of the research staff, rather
than statistical analyses. Although the staff attempted to classify the
information into four categories, none of the information was considered to be
of excellent quality; therefore, only three of the four categories appear in
the table.
Because information available from the state agencies frequently did
not include local infrastructure data on roads, sewer, water, etc., the
research team also attempted to obtain these local data from the regional
planning agencies, which are discussed in the next section.
Regional Planning Agencies
There are 13 Regional Planning Agencies (RPAs) in the Commonwealth of
Massachusetts, which were set up during the 1970s to coordinate regional
planning efforts in the state. The RPAs are shown on the map in Appendix D.
The staff members assumed that since most of the information not
obtainable from the state agencies pertained to locally funded and
administered programs, the RPAS, which have a local orientation, should be
able to fill in the missing pieces. A questionnaire (Appendix E) was
therefore designed and mailed to each of the 13 RPAs. Each agency was then

14
called to see whether the questionnaire had been received and to determine
whether or not there were any questions concerning it. It was discovered that
the regions varied greatly in their capacity to provide the data requested.
Both the Franklin County Department of Planning and the Berkshire
County Regional Planning Commission sent letters explaining that the data
requested were beyond their capacity to provide. The Planning Director in
Franklin County estimated that providing the requested information "would be a
nice project for a summer intern or a cost equal to that." The Director of
the Berkshire County Regional Planning Commission estimated that potential
costs to gather the information for Berkshire County ranged from $7,500 for
in-house data compilation, a procedure that could meet an estimated 15 percent
of the data needs, to $90,000 to gather 90 percent of the data, and $180,000
to $200,000 to provide 100 pecent of the information requested from Berkshire
County.
The Metropolitan Area Planning Council (MAPC), the RPA for the Boston
area, also estimated the cost of data compilation. The Director of Land Use
and Environmental Quality outlined the kinds of data sources that could be
exploited to meet the data requested for the MAPC and provided the following
time and cost estimates: for water supply and distribution data,
approximately four weeks of staff time, or about $4,000; for sewage collection
and treatment, another 4 weeks, or $4,000; for solid waste facilities, between
4 and 12 weeks, depending upon the level of detail required; and for hazardous
waste facilities, about 7 weeks of staff time. With respect to the
transportation infrastructure (highways, bridges, tunnels, railroad crossings
and lines), it was estimated that collecting information on just the condition
of local roads in the MAPC region would take a minimum of six months to a
year: for airports. about 4 weeks would be needed to identify and compile

15
information on Logan Airport and other airfields in the MAPC region; and about
4 weeks to identify and compile information on mass transit in the
Metropolitan Boston area.
Four of the RPAs provided data that could be incorporated into this
study. The Lower Pioneer Valley Regional Planning Commission organized a
three-week data-collection effort, which provided good information on transit
and local roadways, but they could not find any data on either water or
sewerage infrastructure. The Old Colony Planning Council provided reports and
separate sheets of data from which a considerable amount of information was
obtained for use in this report. The Southeastern Regional Planning and
Economic Development District (SRPEDD) also sent reports, with some updated
materials attached, and much of that information was also used. Just before
this report was completed in May 1983, the Northern Middlesex Area Commission
sent materials that covered each of the infrastructure areas rather
comprehensively. This material was also incorporated into the final version
of this report. The SRPEDD and the Northern Middlesex Area Commission were
the only RPAs that filled out the questionnaire and provided some information
on each community in their region.
Although the questionnaire was mailed to all 13 RPAs, and at least two
follow-up telephone calls were made to each one that had not responded, no
material was received from 6 of the 13 RPAs.
CONTEXT FOR THE STUDY
As one of the first parts of the country settled by English
immigrants, one of the original thirteen American colonies, and one of the
oldest industrial states in the country, many of Massachusetts' infrastructure
problems are a direct corollary of the antiquated infrastructure in the
16
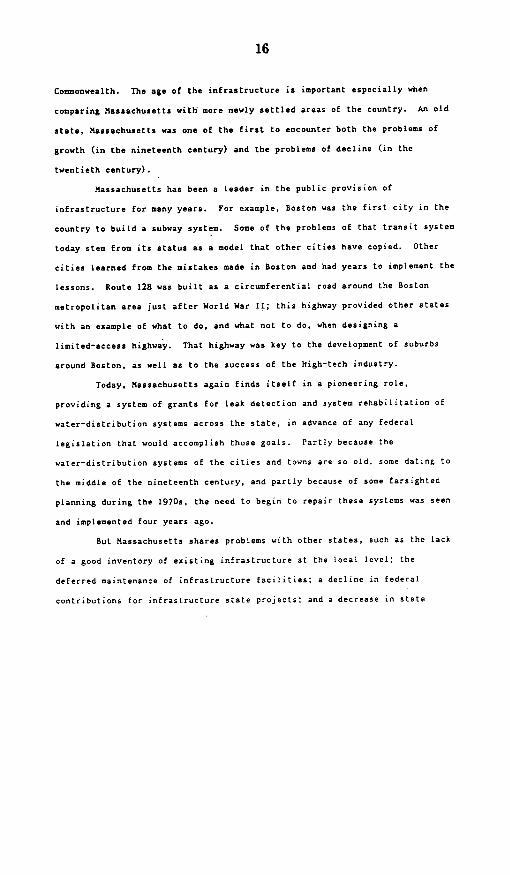
Commonwealth. The age of the infrastructure is important especially when
comparing Massachusetts with more newly settled areas of the country. An old
state, Massachusetts was one of the first to encounter both the problems of
growth (in the nineteenth century) and the problems of decline (in the
twentieth century).
Massachusetts has been a leader in the public provision of
infrastructure for many years. For example, Boston was the first city in the
country to build a subway system. Some of the problems of that transit system
today stem from its status as a model that other cities have copied. Other
cities learned from the mistakes made in Boston and had years to implement the
lessons. Route 128 was built as a circumferential road around the Boston
metropolitan area just after World War II; this highway provided other states
with an example of what to do, and what not to do, when designing a
limited-access highway. That highway was key to the development of suburbs
around Boston, as well as to the success of the high-tech industry.
Today, Massachusetts again finds itself in a pioneering role.
providing a system of grants for leak detection and system rehabilitation of
water-distribution systems across the state, in advance of any federal
legislation that would accomplish those goals. Partly because the
water-distribution systems of the cities and towns are so old, some dating to
the middle of the nineteenth century, and partly because of some farsighted
planning during the 1970s, the need to begin to repair these systems was seen
and implemented four years ago.
But Massachusetts shares problems with other states, such as the lack
of a good inventory of existing infrastructure at the local level; the
deferred maintenance of infrastructure facilities; a decline in federal
contributions for infrastructure state projects: and a decrease in state

17
revenues due to the recession and other factors. In the latter case, for
example, Massachusetts' voters have imposed a local tax-limitation measure,
referred to as Proposition 2-1/2, that has reduced the revenues available to
municipalities across the state to fund both current and capital outlays.
Economic Factors
The employment structure of Massachusetts has undergone a long-term
shift away from manufacturing and toward services and computer-related
industries, known colloquially as "high-tech." These service and high-tech
industries are characterized by widespread dispersal, rather than
concentration inside of cities or even SMSA's. The growth of these scattered
industries was helped substantially by previous infrastructure decisions, such
as the construction of Route 128 around the perimeter of Boston and the
subsequent location of computer industries along that route. Future economic
growth could well be enhanced by wise investment in infrastructure, and lack
of, or unwise, investment could inhibit economic growth in the long run.
Population Trends
Although the Commonwealth of Massachusetts has a growth policy that
tries to channel population growth into existing communities rather than
encouraging scattered housing in fringe areas, long-term population trends run
counter to this policy. The economic transition to service and high-tech
industries has been accompanied by dispersal of the labor force of those
industries. Along with many firms located in fringe areas, population has
been moving toward the least dense areas of Massachusetts. Between 1970 and
1980, the population of central cities in the state declined by 5.2 percent,
the urban fringe grew by 7.7 percent, and rural areas grew by 5.7 percent,
while the population of the state as a whole was growing by just 0.8 percent
18
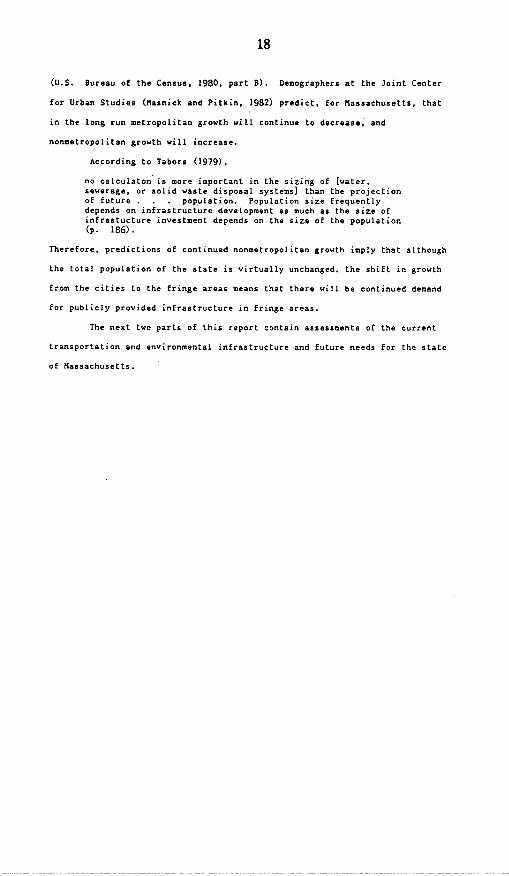
(U.S. Bureau of the Census, 1980. part B). Demographers at the Joint Center
for Urban Studies (Masnick and Pitkin, 1982) predict, for Massachusetts, that
in the long run metropolitan growth will continue to decrease, and
nonmetropolitan growth will increase.
According to Tabors (1979),
no calculaton is more important in the sizing of [water,sewerage, or solid waste disposal systems] than the projectionof future . . . population. Population size frequentlydepends on infrastructure development as much as the size ofinfrastucture investment depends on the size of the population(p. 186).
Therefore, predictions of continued nonmetropolitan growth imply that although
the total population of the state is virtually unchanged, the shift in growth
from the cities to the fringe areas means that there will be continued demand
for publicly provided infrastructure in fringe areas.
The next two parts of this report contain assessments of the current
transportation and environmental infrastructure and future needs for the state
of Massachusetts.

Part 3
TRANSPORTATION INFRASTRUCTURE
Information on public transportation infrastructure was obtained for
the following components: Massachusetts Bay Transportation Authority,
state-owned railroad grades and crossings, state-owned railroad bridges and
tunnels, Regional Transit Authorities, highway bridges; airports, seaports,
highways, and highway tunnels. Each of these will be discussed in this part
of the report.l
MASSACHUSETTS BAY TRANSPORTATION AUTHORITY
The mass transit system of the metropolitan Boston area, the oldest
and currently the fifth largest in the nation, today serves 79 cities and
towns in eastern Massachusetts and some 168 million passengers yearly. First
operated as an horsecar line in 1856 between Cambridge and Boston, public rail
transport spread rapidly, with bankers and speculators extending lines
throughout the expanding urban-suburban metropolis. In 1897, Boston became
the first U.S. city with a subway. By 1904, Boston had the first underwater
tunnel, located beneath the Boston Harbor. The 1920s and 1930s brought motor
bus and trackless trolleys to the city area.
By this time, however, public transit was already facing the
development and rapid expansion of private automobile transportation that
competed for public financing and ridership. Severe problems with the Boston
It should be pointed out that there are essentially three types of budgetaryyears used in this report: the federal fiscal year (October 1-September 30),the calendar year (January 1-December 31) and the state fiscal year (July1-June 30). The state fiscal year was begun for 1983-1984 (FY1984). In someplaces the use of 1983/FY1984 appears, which refers to the overlapping periodcovered by the transition from the calendar to the fiscal year, which is 18months, in the Commonwealth. Most capital projects, however, are administeredon the basis of the federal fiscal budget, October I through September 30.
(19)

20
Elevated led to the Public Control Act of 1918 and continuing instability to
the creation of a regional transit agency representing 14 cities and towns,
the Metropolitan Transit Authority (MTA) in 1947. Although the MTA continued
to grow, it also continued to have financial difficulties. The transit system
was reorganized under the name of Massachusetts Bay Transportation Authority
(MBTA) in 1964 and was expanded to include 78 cities and towns (later 79)
under its jurisdiction. Economic downturns, inflation, oil price increases,
air pollution, and other issues in the 1970s combined to give new life to mass
transit and to bring increases in ridership, up to 300,000 daily by the end of
the decade (MBTA, 1982a. pp. 1-6).
At present, the MBTA consists of three rapid transit lines, in
addition to the light rail vehicle (LRV) "Green Line," commuter light rail,
bus services, and trackless trolleys. As part of its public transportation
responsibilities, the MBTA maintains in operating condition almost 2000
vehicles--1049 buses, 353 rapid transit cars, 74 streetcars/125 light rail
vehicles, 50 trackless trolleys and 126 commuter rail vehicles (MBTA, 1983c,
p. 1). The value of major MBTA equipment and facilities is indicated in
Table 3-1.
One of the obstacles in assessing needs projections for the MBTA
system as a whole is the fact that attention and financial assistance to the
maintenance of the current systems' operations occur on a largely ad hoc
crisis-by-crisis basis, with too little focus on establishing preventive
maintenance/replacement priorities on a long-term basis. This can be
explained, in part, by the complexity of maintaining an old transit system
that is forced to run on several generations of parts and equipment. The
problem also reflects, in part, the shifting priorities of the federal
government toward mass transit over the years. Currently, the federal

21
Table 3-1
BOOK VALUE OF SELECTED MBTA TRANSPORTATIONEQUIPMENT/FACILITIES, 1982
AnnualRate of
Book Value Depreciation
Way and Structure
Tunnels and Subways $ 45,004,415 2.0000Bridges, Trestles and Culverts 27,122,322 1.3333Trackwork 133,004,073 n.a.Elevated Structures and Foundations 9,520,984 1.3333Signals and Interlockers 32,896,147 1.9000Communications Systems 27,755,594 1.9000Distribution System 25,192,903 2.2222Shops, Carhouses, and Garages 75,464,483 1.6667Shops, Carhouses, and Garages 1,461,512 3.3333Stations, Misc. Bldgs., and Structures 112,908,431 1.6667
Equipment
PCC Cars 3,177,301 4.0000Buses 67,569,274 8.3333Trackless Trolleys 3,962,504 6.6667Quincy Line Cars Silver Birds 17,251,181 4.0000Orange Line Cars Main Line 5,145,760 15.2317Blue Line Cars (old) 1,894,471 2.2222Cambridge Dorchester Lines 16,009,232 4.0000B&M Cars RDCs 2,951,000 10.0000LRVs 38,647,511 5.0000Commuter Rail Coaches 30,099,433 4.0000Orange Line (New) 1979 70,607,527 4.0000Blue Line (New) 1979 37,772,334 4.0000
Power
Power Plant Structures 11,263,853 1.6667Power Plant Equipment 28,270,188 2.8571Transmission 2,097,035 2.0000
Other
Total Subway and Tunnels andFacilities Constructed byMBTA 8/2/49-8/3/63 32,783,085 --
Original Cost of Subway andTunnels 8/3/49 70,346,941 --
Total Property $1,207,986,314 --
SOURCE: MBTA, Depreciation Schedule, 6/30/81 to 6/30/82.

22
government constitutes the primary source of revenues on most major MBTA
projects. Of $2.8 billion currently invested in federally supported
mass-transit projects, the federal government provides $2.2 billion (about 80
percent) of the funding. Past and current projects are shown in Table 3-2,
which includes projects funded since the 1960s. Projected sources of future
funding of mass transit can be seen in Table 3-3. Another factor that
mediates against long-term transit planning is that within the Commonwealth,
new state administrations, in general, have tended to slow or accelerate the
established capital-improvement programs, rather than undertake a complete
revamping.
Discussion of public transportation will focus on the MBTA bus, rapid
transit, Green Line, trackless trolley, and commuter-rail services, followed
by a brief consideration of the Commonwealth's Regional Transit Authorities
(RTAs), and the state railroad grades, crossings, bridges, and tunnels. The
sources of information are referenced throughout the text. As mentioned in
Part 2, the Executive Office of Transportation and Construction (EOTC)
distributed a questionnaire to the 14 RTAs.
Bus System
Of the MBTA transit services, buses have the smallest fixed-facility
requirement, but because buses use infrastructure (for example, highways)
shared by private vehicles, evaluation of its relative efficiency and cost
would, therefore, need to consider complementary investments made in
non-public transportation sectors.
Facilities, Age, and Current Condition
As of May 1, 1982, there were 1220 vehicles in the MBTA area, of which
1049 were available for daily operation, 724 were assigned to specific routes

23
Table 3-2LISTING OF MBTA FEDERAL FUNDING TO 1983
K-ner Project Na Prjot ~Cos edai he
031-000I Station hod.'nieatlon $ .SS 103-0003 Pras15Stra100033.003-0003 hayoarbal Tunnl 0,.3.2315.07010 3-0000 Soa rnh xeso 57.999 293 30.20 M~
03-OO sao",k~ Onros1 trcen?, ,35,01,4?1 (7,506,ES03-0 00? Casot Trass-rxatins Center 610, 25,09ht'2-
0.3-3010 Oystee1oio Mouenloation A.M02,0 3.1192J~03-00 11 P-rtns. 310 Buses 12.USO.375 ailO:.10'03-0013 Stawo Mdrnize t-nn- P:,se 11 14,517.23503-0015 Gree :lei5ne2et 1l7.4 3035,03.0016 CharIestosa Btus Circa. - Phtses I * 4j 323;77 3 IS. 2.0*03-0017 plan o mf oeet - Phase 1 9,503.555 Z i03-0010 Purchase 12 hosts 1: 931:335 S.O9i5,1h03-0009 Poer lePr-esets- Phase I - V 6.04,6Oh6923.203.0021 h..-' esenoe Oqolonnt 55,aoSoah03-OCZ? 14.19 hai 'lenlet 06.30_.003-0004 Porcnasn 190 Nea 2,pId Irensit Cars 20.944.72003-0020 lTey 57.000,00 12tdI.E-03-0025 Plant leprone-ets - Plase II1030050 .3.203'0020 Trackless Trolleys 4.161,035 I~20*'03-0029 hestoration of Ora-le Line Sctncture 5.826,71003-0031 Plan.t Imoron-ets - Phase ill 17.420.'o,O 913.9-a03-033 Pucae304 h,,,es and Want 12 914 245 I.3303-.00 36 es.o-otln nof Tract 0uppcrt Strnctrrns 3,15 0l 2.2603-0037 Irn~edlote Needs Pnner 72.30h 8 0OOOCY
03-0040 COOP 1 13,L.-I 10.i0'0! .t1103-0042 Purchase Sem ice O3is LIn es06003-0043 Seehhbill titn- of tEr...tt caslt. Pat'. 721.7k33.Z .`03-3019 homy Mann~l IL tation Cosotes A 21' 004 3.3,03-0051 tastt Ffflcey II1.1
03-0053 PCC hehnild 607,0 l~ttl03-0054 Poner Cable3000.3 t03-0150 St ation 9udorniction. - Phase IllI '8 t.X03-COO) Tac Inpren-ets 49 4 n~ 1 3Sa0340070 30aClan-uer hail Coaches on;303-007P Plan1t :oro.--cts - Phate IV 2'. 371,255 23.TW03-0084 Sytcnnde Siplnsi!C~u-usratlc les. 66030 l,.1
403-C005 lin el Rhenbil'tusticn - Phase I 10.Z30,4nuo 1.t03-0306 Colum" tacsPrtject "S.010 h,'1
03-0000 lootS1 Statius Proje ,Ijct 30.h3j~l 001.2o3P2 ceO~sil Squar Sttl S Prjc I!uJ 30001.3t)
00-0203 Pucaeo 00 fle-,a Bue :000 : 7l~303-010 North Ohore ECatenslon 3.tcS'03013-0106 CIP II CliSa, io)5,0.06,115 4 ..GS,'T'03-0107 iiodernlation of Transit Cars 37,100:h5 2q.-flZ.000-011I ChIP IV 0.545:,1103-0114 Trasit Varh-Sl-i 090.0 33I20- 9201 Scutth OraIct.ee Eotensiun 500000:-1'S 6 1533 1,~03-9D02 Purchase 1913 Oct duet) Transit Cars 94 .099,1:0 1033123-99034 MI dland Branch hestoration 20,177130 l,0<'23- 000 Sooth Coon Tusel and StatIon 33,61S00 26 0-3,4223-9lOB CORP I 07th CM.33ht23-9207 Son~tes!t Corr1dor (1703 M) 70 81.03 52.~jI2Z2,~23-900 harvard Square. Is A;ifee (01022 laS 040.00 J 031.337.01323-9009 Nodcrn.aotinc.1 of ked 14cc Cars S?0hO ?Z,0-0..31
23-9001 ChIP Ill 25.03~M ,, 2T (O ,I.L-'OOs-d1l Pornase of hi loses C.1,~C 2..2,24
00-0010 Purc one n3000 lose l02 Gr77 11 ,o.O'05-0033 Plut lornc~nisChae I - ut 41
05-0330 Transit Offtcicncy - dS-- 7,8200 Oh 3,T'S.'nS06-0000 'ieyoa rhet Suits Incorunetanl. Inn ,03 hOT02,00106-0011 validation Study 66) 020 S0.106-0015 100 Sprciflct on155 37817.106-0309 PrePaid Tresnlt .Pass Pruqrao EdO 003 72.10004-0091 Otatins Art 0eoD 703,000 713,30306017 hoe Stress St-d 173,90c30 129 0s06-1121 hock Coarser St-~dy 20.099 LT,5000-0127 hock Chanoer Study M:5.769 210, 'F90-0030 Eho1ergny Pone Otiply Study 77,0 7,3
061-01 39 tohe 1g Fatt..enes Teot 00.0901.003-001 outhnon Corr!dor Study '74 6.21 4,109-0000 Central Area Systen Study 10,0151,)09-0010 Ouston Tri. in en'c. 2.500. 00 O.q,59,Si)09-003 6 Tranit, O eonatPona c,00d 1,203.30000-40006 Pait. Pr.oucinity Sptudy" 170,003 O'h C'
09.0006 Rail he1oroct holutln 8.030 63.0M59-0096 Plant FCI ...clitis dee1)r.en1~ t 070.030 z10,'0_,09-1001 Bus Onrolce Enoluatic Study l6 "-3,3 120,2.2g09-9301 Unified Suck P-ruo 3,k hroveo 29,220l n,00
29-902. Project One vetleon. Stony Z. ,8ai2 2.220.2-3092-0303 tcin96 8hock Grant P0483 19.203,730 1045,'2
03-72001 P!uu Centinsi Acuuisltion Loan 13 n30"0 0 0,00120- 9010 S A 3 Azoulstt-u L.,e. 20).:1723 6,02M
SOURCE: MBTA, "Federal Funding Summary Sheet," 1983.

24
Table 3-3
TRANSIT CAPITAL-FUNDINGFY1981-1987+
Future AnnualProgram Element
FY81 Total FY1982
TOTAL 319.4 3266.7 380.0
Federal Share
Section 3 69.1 2355.11 183.76Interstate 190.0 297.50 121.04Section 5 7.6 n.a. 6.6
Local Share
Section 3 17.3 583.34 45.94Interstate 33.5 52.50 21.36Section 5 1.9 n.a. 1.3
SOURCE: Central Transportation Planning Staff,Program, 1982-1986. January 31, 1982,
SCHEDULE
2-5 YearElement
1983-1986 FY1987+
1018.0 1876.6
648.32 1523.03176.46 0.0n.a. 0.0
162.08 353.5731.04 0.0n.a. 0.0
Transportation Improvementp. II-18.
25
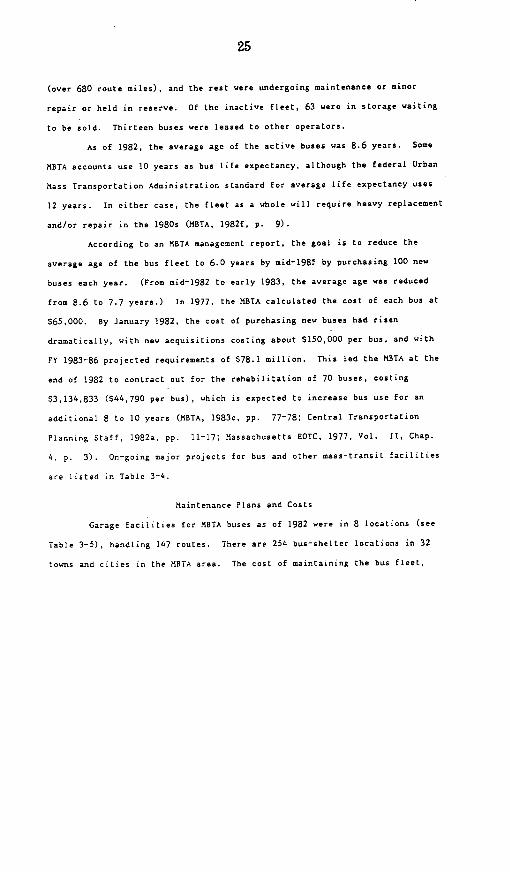
(over 680 route miles), and the rest were undergoing maintenance or minor
repair or held in reserve. Of the inactive fleet, 63 were in storage waiting
to be sold. Thirteen buses were leased to other operators.
As of 1982, the average age of the active buses was 8.6 years. Some
MBTA accounts use 10 years as bus life expectancy, although the federal Urban
Mass Transportation Administration standard for average life expectancy uses
12 years. In either case, the fleet as a whole will require heavy replacement
and/or repair in the 1980s (MBTA, 1982f, p. 9).
According to an MBTA management report, the goal is to reduce the
average age of the bus fleet to 6.0 years by mid-1985 by purchasing 100 new
buses each year. (From mid-1982 to early 1983, the average age was reduced
from 8.6 to 7.7 years.) In 1977, the MBTA calculated the cost of each bus at
565,000. By January 1982, the cost of purchasing new buses had risen
dramatically, with new acquisitions costing about $150,000 per bus, and with
FY 1983-86 projected requirements of $78.1 million. This led the MBTA at the
end of 1982 to contract out for the rehabilitation of 70 buses, costing
53,134,833 ($44,790 per bus), which is expected to increase bus use for an
additional 8 to 10 years (MBTA, 1983c, pp. 77-78; Central Transportation
Planning Staff, 1982a, pp. 11-17; Massachusetts EOTC, 1977, Vol. II, Chap.
4, p. 3). On-going major projects for bus and other mass-transit facilities
are listed in Table 3-4.
Maintenance Plans and Costs
Garage facilities for MBTA buses as of 1982 were in 8 locations (see
Table 3-5), handling 147 routes. There are 254 bus-shelter locations in 32
towns and cities in the MBTA area. The cost of maintaining the bus fleet,

26
Table 3-4
MAJOR MASS-TRANSIT/BUS-SERVICEMAINTENANCE AND REPAIR PROJECTS
AS OF 1983
Project Purpose Cost Status
Charlestown PlantMaintenance Project
Everett MaintenanceImprovements Project
ReservoirReconstructionComplex
Bartlett StreetGarage
Cabot Bus Garage
Lynn Bus Garage
Quincy Bus Garage
Albany StreetGarage
South Boston BusWaiting andDispatchingFacility
New bus garageVehicle maintenanceRail bendingLight and heavymaintenance
Renovate MBTA mainrepair facility
Reconstruction ofReservoir carhouseand yard complex
Rehabilitation ofgarage for South-west bus area
Washer and siteimprovements
Site work andreconstruction
Site work andrenovations
Site work andrenovations
Site work and newbuilding structure
$37,100,000 Started 1975, toApproved be complete in
mid-1984
$29,700,000Approved(including$13,300,000in federalfunds)
Started 1978, tobe completed in1984
Received Started 1972;$60 million Phase I complete;
Phase II to becomplete by late1984
$5 million 70% complete; tobe finished byApril 1983
$500,000Approved
To be completedMay 1983
$1.6 million To be completedApproved June 1983
$2.5 million To be completedApproved July 1983
$1.2 million To be completedApproved July 1983
$230,000Approved
Final designcomplete; construc-tion to beginJanuary 1983
27
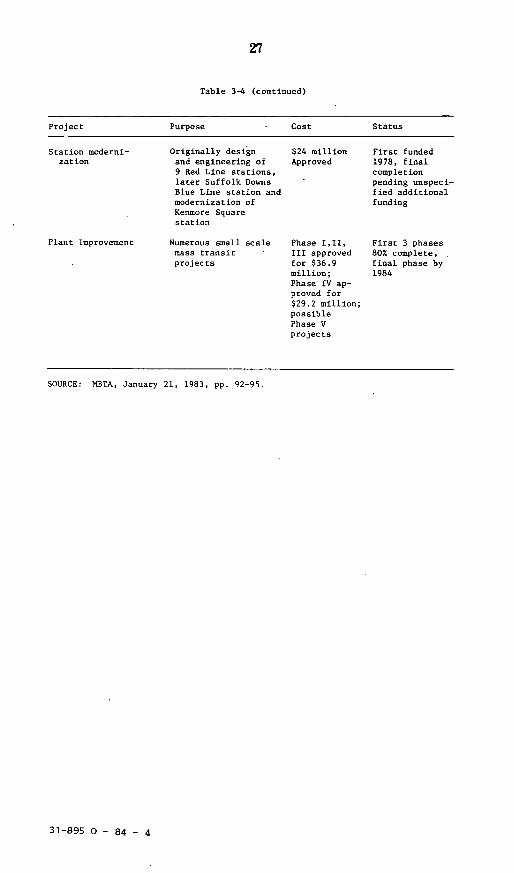
Table 3-4 (continued)
Project Purpose Cost Status
Station moderni- Originally design $24 million First fundedzation and engineering of Approved 1978, final
9 Red Line stations, completionlater Suffolk Downs pending unspeci-Blue Line station and fied additionalmodernization of fundingKenmore Squarestation
Plant Improvement Numerous small scale Phase I,II. First 3 phasesmass transit III approved 80% complete,projects for $36.9 final phase by
million; 1984Phase IV ap-proved for$29.2 million;possiblePhase Vprojects
SOURCE: MBTA, January 21, 1983, pp. 92-95.
31-895 0 - 84 - 4

28
Table 3-5
MBTA BUS GARAGE/STORAGE FACILITY (1982)
Garage/Storage No. of Avg. No. of Avg. Value of Facility
Facility Vehicles Age Routes Seats ($000)
Albany Street 114 4.9 15 51 $2,288
Cabot 214 8.5 22 45 1,468
Arborway 200 6.6 22 46 940
Somerville n.a. 7.5 21 n.a. 2,298
Fellsway 74 13.7 11 44 n.a.
Charlestown 247 7.5 15 45 n.a.
Lynn 113 10.2 24 47 1,717
Quincy 87 9.0 17 46 n.a.
Total 1049 816 147 46 n.a.
SOURCE: MBTA, Title VI AssessmenA for Capital and Operating Assistance,
December 1982, Exhibit E and Table 4.1.
MBTA-Systems, "Treasurer's Office Replacement Costs," 1983.
The MBTA Budget 1983/FY84, pp. 34, 45, lists seven garages
operating 152 routes for 987 buses.
n.a. = not availableAvg. = Average

29
along with 400 nonrevenue vehicles, in FY 1984 was estimated at $21.5 million
(MBTA, 1982b, p. 86; MBTA, 1982f, Exhibit H).
Purchase Plans and Costs
KIBTA plans to purchase 100 new buses per year over the next four years
(1983-1987); this will require an outlay estimated at about $60 million.
However, there are no known studies by the MBTA on precisely what mix of
purchase and/or rehabilitation will take place over this period with respect
to growth or decline of ridership, nor are there estimations of bus-service
costs at various standards of service.
RApid Transit
The HBTA rapid transit system, the subway, which has the largest share
of public transportation fare box revenue, operates on three routes: the Red,
the Orange, and the Blue Lines. The Green Line, which operates surface
vehicles as well as subway transit, is generally treated separately from
'rapid transit," although, because of its overlapping operations (maintenance,
system connections, etc.), its budgetary items often appear together with the
Red, Blue, and Orange Lines. Recent years have found increasing ridership on
the MBTA system overall, adding to the need to maintain and upgrade it to the
standard of a reliable and efficient mode of transportation.
Facilities and Age
Together, the three lines consist of 41.6 route miles (one way), in
addition to 8.4 route miles under construction, 15 miles of subway track (one
way), and 48.2 miles of track on bridges, elevated, or surface areas (HBTA,
1982
a, p. 36). The three lines utilize 354 cars and have 56 stations. The
value of the rapid transit/Green Line system is given in Table 3-6. For a

30
Table 3-6
VALUE OF RAPID-TRANSIT/GREEN-LINE STATIONS
Value
Line (1983 $)
Red Line1 $ 73,557,668
Blue Line2 7,733,147
Orange Line3 28,777,440
Green Line4 1,184,720
Total $111,252,975
1Harvard/Brattle, Northwest Extension, Park, Washington, and Shawmut
not included.
2Bowdoin, State, Aquarium and Maverick not included.
3Essex, Washington, State, Haymarket, and North Station not included.
4Only North Station, Science Parkand Lechmere included.
SOURCE: MBTA Systems, "Treasurer's Office Replacement Costs," 1983.

31
general index of rapid transit/Green Line facilities, see Table 3-7.
The cost of maintaining the rapid transit system derives from no
specific long-term program, and maintenance is carried out largely on a
day-to-day emergency-management basis. The MBTA rail system has never had a
long-term maintenance program (Massachusetts EOTC, Vol.II, 1977, Chap. 2, p.
2)
Construction Plans and Costs
Construction over the past decade, amounting to $2 billion, has been
approximately 80 percent funded by the federal government with the other 20
percent raised by MBTA long-term bonds. (See Table 3-8.) The Urban Mass
Transportation Administration (UMTA) funds on-going projects on a "cash"
basis, authorizing payment only for bills and invoices due and payable.
One of the largest IBTA expansion projects is the $574 million Red
Line Extension Northwest, a 3.5 mile subway extension between Harvard Station
and Alewife that includes 4 stations, 3.5 miles of twin tunnels, and a
2000-car garage at Alewife Brook Station. It is scheduled for completion by
1984. A $792 million Southwest Corridor Project on the Orange Line is the
largest construction project in Boston's history, which will include nine new
stations and was scheduled for completion by late 1986, now postponed to 1987.
A third major rapid-transit project in terms of cost is the construction of
the $33.2 million Quincy Adams Station on the Red Line, which was scheduled
for completion by the end of 1982, but is currently slated to open in
September 1983 (MBTA, 1983c, p. 88).
Long-term power projects include the UMTA-assisted "Power System
Improvements Program" for upgrading the MBTA's traction-power generation and
distribution system with an approved project budget of 588.6 million, now 60

Table 3-7
MBTA RAPID-TRANSIT/GREEN-LINE VEHICLE AND TRACK STATISTICS, 1983
Rapid Route Track Revenue S/T Bridge ROW, Car Houses,
Transit Avg. Miles Miles Track Track Track Paved Yards
Line Cars Age (1 way) (1 way) Miles Mileage Miles Streets Mileage Stations
38.1 10.5
13.6 4.5
26.3
58.8
3.5
10.5
-- 21.6
__ 9.1
-- 13.1
__ 53.7
* 579 14.2 77.4 188.9 136.8 29.0 48.2 97.5 26.7 81
Subway/Tunnel
Right-of-Way
SOURCES: MBTA, Budget 1983/FY1984, October 1, 1982, p. 34.
MBTA, Title VI: Assessment for Capital and Operating Assistance, December 1982, Exhibit D.
MBTA, Annual Report, 1981.
MBTA, Engineering and Maintenance Department, Track and Structures Summary Report, 1983.
Red Line
Blue Line
Orange Line
Green Line
164
70
120
225
16.1 24.6
2.5 6.2
1.2 10.8
21.8 35.1
50.8
18.0
36.8
83.3
Total
7.9
4.4
6.4
8.0
20
12
16
33

33
Table 3-8
RAPID-TRANSIT RAIL EQUIPMENT/GREEN-LINE REQUESTED MAINTENANCE
1983/FY1984
1983 1984 -Title (6 months) (12 months) Total Cost
Rail Equipment $ 9,493,600 $18,987,200 $28,480,800
Green Line 4,919,788 9,801,119 14,720,907
Total 1983/1984 $14,413,388 $28,788,319 $43,201,707
*
1983=1/1/83-6/30/831984=7/1/83-6/30/84
Includes revenue and nonrevenue vehicles
SOURCE: MBTA, "Rail Equipment: 1983 and FY1984 Budget Request,"August 6, 1982.

34
percent completed; an UMTA-assisted "Immediate Needs Project" budgeted at
$22.4 million to continue to operate the power-generation facility in South
Boston; and an UNTA-funded $14.4 million "Power Cable Replacement Program,"
now 60 percent complete. As a whole, the Power Program will require an
additional 10 years and $70 million to replace and upgrade cable conduits and
power-distribution facilities (MBTA, 1983c, pp. 88-89).
Other major rapid-transit projects are the "Track Improvements
Program" and the "Tunnel Rehabilitation Program," initiated with UMTA in 1977
and 1979, respectively. Track upgrading and replacement on the three
rapid-transit lines and the Green Line will cost $49.9 million, of which UMTA
has already provided $18.3 million (in 1981 and 1982). The "Track
Improvements Program," now 40 percent complete, will require ten additional
years and approximately $80 million. The other project is to repair tunnel
deterioration throughout the system and to install new ventillation equipment.
Thus far, federal funds have provided $15.3 million for tunnel rehabilitation,
with additional funds approved for ventillation shafts at two stations. Over
the next three years, $25 million is required for new ventillation shafts in
the Green Line Central Subway. A systemwide "Ventillation Program" is
anticipated to cost about $75 million, the time and completion date pending
federal funding (MBTA, 1983c, pp. 89-90).
The Red, Blue, and Green Lines are also part of a major combined
rapid-transit and streetcar signal/communication upgrading project, for which
$14.1 million has already been approved. The funding is expected to be
scheduled over several years. Additional funding of $75-80 million is said to
be needed in the next five years for the following (MBTA, 1983c, p. 91):
Green Line Signals S27-35 millionBlue Line Signals $21-25 million

35
Communications $8-10 millionBus Radio $8-10 million
For other major upgrading projects involving mass transit and/or bus service,
see Table 3-2.
The Green Line
The Green Line is separate from the rapid-transit division of the MBTA
because of its streetcar vehicle (LRVs and the older PCC cars) operations and
its responsibility for trackless-trolley maintenance. (See Table 3-9.)
The Boeing LRVs delivered in 1976 proved to be highly unreliable, and
over 40 were eventually stripped for spare parts. Operation and safety
problems made it necessary to institute single-car operations until better
coupler assemblies are provided. More recently, a court settlement was
litigated against Boeing, resulting in a $40 million award to the MBTA, which
plans to use the money to purchase new light rail vehicles. As of early 1983,
the MBTA was in the process of rehabilitating at least 120 LRVs and 34 PCCs
and intended to purchase an additional 55 new vehicles (MBTA, 1983c, pp.
72-73; interview with Jim Atkinson, EOTC Assistant Secretary, May 18, 1983).
Expansion and modernization projects of the Green Line were discussed in
previous sections.
Among the MBTA area transportation modes, trackless trolley remains a
fixture. In peak operating condition, their appeal includes a smooth, quiet
ride, the absence of in-route pollution, their limited facility requirements,
the relatively easy maintenance of their electric motors, the flexibility of
power sources, and their apparent general popularity (usership) with the
public. Trackless trolley service consists of 4 routes, 50 vehicles, and
15.75 route miles (one way).

36
Table 3-9
THE GREEN LINE, 1982
LRVs Streetcars Trackless Trolley
Number of Cars 125 100 (21.8) 50 (6)
Number of Routes 5 4
Route Miles 35.1 15.75
Track Miles 50 --
Stations 27
Generically, "streetcars" also includes LRVs. In this case.
however, "streetcars" refers only to the older (Presidential
Commission Car) vehicles.**
Average age.LRV = Light rail vehicle.
SOURCE: MBTA, October 1, 1982, pp. 34,42; MBTA, December 1982,
Exhibit E.

37
Commuter Rail
Today about 35 percent of total railroad route mileage in the
Commonwealth is used to provide transportation for a 9 million (and growing)
annual ridership of daily commuter or intercity passenger community, in
addition to piggy-backed freight service. Rail transportation, however, has
long suffered from lack of planning, private-sector speculation, and
unregulated competition from other transportation sectors. The advent of
aviation and the automobile continually diminished ridership and service from
as early as 1910. The creation of the MBTA in 1964 was, in fact, in part to
salvage commuter-rail service by providing subsidies to lines in or near
bankruptcy, and since 1976 all commuter-rail service has been subsidized
(Massachusetts EOTC, 1982b, pp. II-1 through III-3). The public subsidies
provided to commuter rail in the MBTA area, in effect, also provide subsidies
to the private sector's use of the rails for freight transport.
Facilities
Currently, and at least until December 31, 1986, all commuter rail in
and out of Boston is scheduled to be run and controlled by the MBTA under
contract with the Boston and Maine Corporation, an outcome of the series of
bankruptcies and sellouts in the 1960s and 1970s (Massachusetts EOTC, 1982b,
p. III-3). Of the 310.3 route miles connected to the MBTA, active
commuter-rail lines (including outer state connections), 239.9 route miles (77
percent) are owned by the MBTA. Including long side tracks, sidings, and
yards, the MBTA owns a total of 906 track miles. All planning for commuter
rail also takes place under MBTA jurisdiction.
There are two distinct central terminals from which commuter rail
traffic flows in and out of Boston: the North Station and the South Station.

38
These reach out with approximately 270 daily commuter trains to 10 different
main line or branch line terminals and 77 stations. (Refer to Figure 3-1.)
In addition to the 239.9 route miles of active commuter lines, the IBTA also
owns 250 route miles that do not currently carry passenger service (MBTA,
1981a; MBTA, 1981b, Vol. 1, pp. 1-1, 1-2; CTPS, 1979, pp. 39-43). A
general inventory of commuter-rail facilities is found in Table 3-10.
Maintenance of rolling stock takes place at the MBTA-owned Boston
Engine Terminal built in 1890 and the Billerica Shop (formerly shared with the
B&E freight operation) where most of the heavy repair work is performed.
Rolling stock on daily weekday operations consists of 38 locomotives, 143
coaches, and 13 self-propelled Rail Diesel Cars (RDCs), all owned by the MBTA
(Table 3-11), except for 11 locomotives leased from the Boston & Maine (B&M),
and 43 coaches leased from the Toronto Area Transportation Operating Authority
(MBTA, 1981b, Vol. 1, pp. 1-1, 1-2). In total, the KBTA owns 75 percent of
commuter rail locomotives, 100 percent of coaches, 82 percent of track, 89
percent of stations, and 100 percent of shop facilities (MBTA, 1981b, Vol. 2,
Exhibit IV-1).
Maintenance Plans and Costs
The condition and capacity of track and facilities vary. (See Table
3-12.) Taken over by the MBTA from the B&M and Penn Central in the 1970s,
commuter rail has had different degrees of deferred maintenance. There is
also variance because some lines, such as the Shore Line or Framingham Line
were built for higher speeds, while others were restricted to 30-40 mile
limits, which, in effect, imposed conditions of limited track use by modern
commuter rail vehicles. In general, when compared against peer-group regional
transportation systems, although the MBTA fell behind in some service

39
Figure 3-1. 1982 Commuter Rail Network
c- ft" ~ &8.c a- ,o Myd -..m a fed Mn fto MO ..
Ctd d~ - S-ee~.o C-rdw Proec
SOURCE: Central Transportation Planning Staff. 1982."Transportation Improvement Program; 1982-1986."(January 31), p. IV-ll.

Table 3-10
COMMUTER RAIL INVENTORY, 1981
MBTAMBTA Oper-Oper- ated Total No. of Maxi-ated Main No. of No. of No. of U.G. mumRoute Track No. of Sta- Grade O.H. Track No. of TrackMiles Miles Tracks tions Crossings Bridges Bridges Culverts Speed
Northside
East Route Main Line 27.8 49.2 2/1 9 29 29 24 70 60Gloucester Branch 16.6 29.2 2/1 7 27 7 11 62 60
West Route Main Line 31.1 46.3 2/1 13 34 28 34 88 60
New Hampshire Main Line 25.4 50.8 2 7 2 41 19 126 60Fitchburg Main Line 64.0 119.3 2 17 56 68 54 363 60
Southside
Framingham Main Line 21.5 43.0 2 8 2 63 10 126(est) 50
Franklin Branch 18.5 23.8 2/1 9b 7 14 22 30 60
Shore Line 24.7 57.7 4/2 9 1 31 18 144(est) 79Stoughton Branch 4.0 4.0 1 2 9 0 5 9 30Dorchester Branch 8.8 17.7 2 1 0 16 26 24(est) 60
Totals 242.4 441.0 82 167 267 200 932
aincludes North Station.
bIncludes South Station and Back Bay Station.
B&M = Boston and Maine RailroadMBTA = Massachusetts Bay Transportation AuthorityO.H. = OverheadU.G. = Underground
Track miles maintained by B&M 322.6Track miles maintained by Amtrak 75.4Track miles maintained by Conrail 43.0
SOURCE: MBTA, "Commuter Rail Summary Sheet," November 16, 1981.
0-

41
Table 3-11
COMMUTER RAIL ROLLING STOCK (1981)
Type
F-40 locomotive
5-10 locomotive
CP-17 locomotive
E-8 locomotive
Switch engine
Self-propelled RIC
Loco-hauled RDC
Pullman standard coaches
Coaches
Steam coaches
Number
13
19
12
1
1
14
43
60
56
20
Notes
Five on order
Leased from B&M, 5 to return to B&Mupon receipt of new F-40s
Leased from B&M
Leased from TOTOA until May 1981
Also 36 RDCs are to be converted to "loco-hauled" service.
B&M = Boston and Maine RailroadRDC = Rail Diesel CarTOTOA = Toronto Area Transportation Operating Authority
SOURCE: MBTA, June 15, 1981, Vol. 1, Exhibit 2.

Table 3-12
1983 MBTA COMMUTER RAIL OPERATED RAIL LINES (Roadways) 6
1149
7090
7990
Mil Unm 5tM - n-./ 4i§ Mp.r or t l l -b91par a.
AX aaS AM ~~~~~~0.ditta Fen l 0cml atskpl Aq
:.. POn U.n U 4 - 0p.0d 30-05 yt.. FiF-r 094- Y 3- yn. rdr 3-04 09 f.k 1944-0. 00 .yn
4.r DS.0934 0.oDely Xt. - 0t 30-76 9t .Y- 369 -1 2-35 yt0. d 9I0 * G4d 2306 40 yr.
Mi.s LLS BSX - " hlddl 22-63y Y. rWsr *-F? - D y . l7 is rt-p 19 zs7 yn
i.0 0.0U- B.4000 -1911 32-63 yn. 7.3.0-R9 2-40 y.. 0 1013 3 rt.l-F 0906 31 T
n1. IA0 09- - C.nd 345I yn. a r DSl19941* 2-60 yrn. 7V r- 0943 46 r- 194 D
h .in EA. Un on - ?r 20-50 yn. .1rdd 1990-2006 0-35 yrn. 04 1 20 G40ft 190 3-0 y
kitn ar446h 1..&AI00 - 9rlln 1-59 yr.. R 490-1943 1-35 y99. 099 I bd 2007
ao Uno00 0.400 - attlCro 15-30 yr.. 95 0r 50-094-0 4-44S y9. bd 51994-S 4 200 24 YT
l.Shl i.. Ont4n Xt. - 00..J4 59 y.. F r IN1 0003 -46 yn. -F91r 0907 09 9- 1903 Oho
d_ .r 90t44604 04 -94.49. 3 900. t d- 4-35 yn. 0I96 4 6 4 3 y.
5 $IW!4. C
, 9
T9. hY.0
7.1
V. / iOr
.. G fil
Y _i
r.. W
AM CIC 19O0-2000
U -aS 19W20
.942-S3 1997-SO 19 200
1041
*51t:i1hi17DtINI
1995
9900
1095-K7
1994-56
lN7.-|s
1965
Is90
19902000
19902m0
09902000
19W62000
1900
1. CIC .90 Ud IT.110 0a94o0 By.t
2 Cab 0ig. -CAb Big1 SY.y0- W0/ Ooor9004-i -llt.0
3. Rn-W3r of 0 I0 P0 9 0. 0 Ity 01 _0 7.r4,. ,S0.. AWr 0
4. I4o,. .1 On I0-00 0.0 140i00 0- 9II0 0.00 - 51 Y-.rn.
S. F00I LA1 0 0i0t 1.-i0 4. 0.i0 W.00L- - 35 t-rn/At t r. 0Itir1 0.1.040
I .0. A-.0 01 T50 P- W.* Kit. I N09- 000Y 7 Y-.
6. ur94 M 0.00 35400 F00419n.49 000.1 5 9.9Y- 40t E0t 0B10009 l0y 243 V-.
7. 12 0i00 03t40il44.G. 40.4igl00.d.9. M.BTA Ralra Opeati. 0.ns44 D0 (Sumar 0heet),114.
SOURCE: MBTA, Railroad Operations Directorate (Summary Sheet), 1983
I993

43
categories, it was above average in areas such as age of equipment and some
allocation measures (hBTA, 1981b. Vol. 1, pp. 2/3-1 through 2/3-8).
Construction Plans and Costs
Since the creation of the Urban Mass Transportation Act of 1964, the
federal government has been deeply involved in financing urban-rail systems.
Federal grant awards for the META rail system have increased from $6 million
in 1965 to a high in 1980 of almost $318 million. Rail-modernization programs
under UMTA grants, which provide 80 percent of project costs, amounted to $63
million in 1982. Costs of the "Commuter Rail Improvement Program" phases are
indicated in Table 3-13. In addition, an "urban initiatives" program, also
UMTA-funded, has to date provided $30 million ($14 million in 1982) for the
rehabilitation of South Station. The Reagan administration plans to eliminate
this program. Specified UNTA section 5 funds, also directed toward bus and
system-wide operating assistance, has a separate allocation for commuter-rail
operating assistance, which amounted to $6.3 million in FY1982. Of the $2.2
billion in federal grants to the META (1965-1982), commuter rail has received
about 8 percent (MBTA. 1983c. pp. 103-108).
The grants from UMTA provide the primary source of funding for
commuter rail. The local funding share is appropriated through the sale of
bonds by the MBTA, which in the 1970s took over more than 380 miles of
railroad lines formerly owned by the Penn Central Transportation Co. and the
Boston and Maine Corporation. The future of the state-run commuter rail
system, a number of META managers say, is dependent on the continuing support
of the federal government, through such programs as the UMTA grants. Given
the uncertainty of this support, EOTC reports tend to discuss fiscal plans of
the state-wide rail system in short-term efforts, which include "only a very
31-895 0 - 84 - 5

44
Table
COMMUTER-RAIL IMPROVEMENT. . (current
3-13
PROGRAM (CRIP), 1975-1981dollars)
Project Date Cost
CRIP I 1975 $13,600,000
CRIP II 1976 57,800,000
CRIP III 1978 25,300,000
CRIP IV 1981 8,400,000
TOTAL $105,100,000
SOURCE: MBTA, January 21, 1983, pp. 90-91.

45
limited number of rehabilitation projects" (EOTC, State Rail Plan Update,
1981-1982, p. IX-2.)
The future of rail improvement is thus constrained by funding
limitations. Under discretionary UMTA Section 3 funding, over $160 million
was initially proposed for Rail Modernization in FY1982, but only $63 million
was allocated. For the FY1983 Rail Modernization program, over $175 million
was initially proposed against the prospect of federal budgetary cutbacks for
mass transit (MBTA, 1983c, pp. 109-110). Proposed rail improvements for
FY1984 are valued at $10 million (MBTA, 1983f, Exhibit B). A trimmed $200
million five-year improvement program (1983-1987) has also been recently
proposed, but, according to the staff at the EOTC, it has not been funded.
(See Table 3-14.)
The condition of commuter-rail facilities, as seen in Table 3-12,
ranges from good to poor. Of the 10 rail lines, 8 will require heavy repair
or replacement of rails, which is in many cases well beyond their 50-year life
expectancy, within the next five years. Repair or replacement of ties,
ballast, and signals will also need substantial rehabilitation in the same
time frame. These requirements suggest heavy labor and material costs in the
near future. Over the next five-year period (1983-1987), a scaled down $200
million "Commuter Rail Improvements to Existing Services Program" has been
proposed "to eliminate safety hazards, increase ridership and re~venues, and
decrease costs (MBTA. 1983d, p. 1). See Table 3-14 for a summary of the
five-year project. The present conditions are below satisfactory standards,
and the public is expected to make greater demands for improved service,
which, in turn, will bring pressures for greater expenditures and
subsidization.

46
Table 3-14
5-YEAR COMMUTER-RAIL IMPROVEMENTS
SUMMARY OF COSTS (1983-1987)
Item Cost ($000)
Track Projects $ 46,390
Signal Projects 22,783
Purchase M/W Equipment 4,551
Shops and Buildings Projects 5,898
Bridge Projects 12,587
Station Improvement Projects 3,720
Station Platform Improvements Projects 5,406
Parking Expansion Projects 6,930
New Locomotives and Coaches 91,774
TOTAL $200,039
SOURCE: MBTA, "1983 Commuter Rail Improvements to Existing Services Program,"
1983.

47
STATE-OWNED RAILROAD GRADES AND CROSSINGS
Railroad grades and crossings in the Massachusetts Commonwealth are
maintained by the Massachusetts Department of Public Works (MDPW). Projects
for .1982 and 1983 are listed in Table 3-15. Most of the costs of providing
grades and crossings (90 percent) comes under federal-provision. From January
1975 to March 1983, the MDPW listed 387 needed railroad-crossing projects in
the Commonwealth with budgeted outlays for these of $33.1 million, of which
$26 million had actually been spent, and the rest of the funding was deferred,
postponed, eliminated, or tied up. For 1983, proposed spending for
highway/railroad grade crossing projects amounts to over S3 million. (See
Table 3-15.) Long-term plans and projections of expenditures are unavailable.
STATE-OWNED RAILROAD BRIDGES AND TUNNELS
The state of Massachusetts owns or partly owns 25 of the 420 railroad
bridges and tunnels in the Commonwealth, according to the staff at the
Massachusetts Department of Public Works. These 25 bridges and tunnels are
rated collectively as "bridges," inasmuch as federal assistance is given only
to that category. Of the 25 "bridges." 21 are state-owned (MDPW). and 4 are
jointly owned by private railroad companies and the MDPW. Their condition is
rated by the MDPW as follows: 1 is rated as being in "somewhat better than
minimum adequacy to tolerate being left in place as is"; 12 meet "present
minimum criteria"; 5 are "better than present minimum criteria"; and 7 are
"equal to present desirable criteria." In other words, 18 (72 percent) of the
state-owned bridges and tunnels are rated as less than "desirable." There are
no data available on repair or replacement of bridges and tunnels (NDPW. 1983;
U.S. Department of Transportation, 1979, p. 31). As with much of the mass
transportation system, attention to facilities appears to operate on the basis

48
Table 3-15
RAILROAD/HIGHWAY GRADE CROSSING PROJECTS1982 AND PROPOSED 1983 COSTS
1982 1983Railroad Company Cost Proposed
Providence & Worcester $ 403,044 $ 190,000
Central Vermont -- 131,000
MBTA 1,182,681 1,175,000
B&M 929,467 695,000
Conrail 627,000 720,000
Grafton & Upton -- 272,700
Total $3,142,192 $3,183,700
SOURCE: MBTA, Summary Sheet, 1982 (revised).

49
of emergency management rather than on well-defined and regular repair and
replacement programs.
REGIONAL TRANSIT AUTHORITIES
The Regional Transit Authority (RTA) program, created in 1973, handles
transportation needs in 14 districts, including 154 cities and towns, annually
serving some 32 million people in the Commonwealth outside the MBTA area.
Facilities
Their services include fixed-route bus service, general paratransit,
specialized services for the elderly and handicapped, and commuter rail
service to and from Boston. Inasmuch as commuter rail has been discussed
earlier, the focus here will be on the major mode of RTA transportation, the
bus service.
Maintenance Plans and Costs
As can be seen from Table 3-16, the RTAs operate under heavy
subsidies, over $20 million statewide in FY1982, with the revenue-to-cost
ratio at 30 percent in FY1982. With "Proposition 2 1/2," it is not easy for
planners to project expansion of current transportation facilities, even
financing to keep the system at current operating levels. For the next 5
years (1983-1987), however, EOTC planner Howard Taub projects the need for bus
replacement at between 525.0-27.5 million per year, based on RTA reported
needs of 30 buses per year, inflation estimates of 5 percent, 7 percent, or 10
percent, and deferred purchases of buses (currently at $150,000 per bus)
during that period. Given falling federal support, rising ridership (20
million in 1976, 35 million in 1981) and rising cost/revenue mile (S1.63 in
1976. $2.31 in 1982), the RTA bus system as a whole faces an uncertain future.

Table 3-16
RTA FIXED-ROUTE SERVICE, FY1982
New Rehabil- Rehabil- Buses Bus 3itation itation Avail- Buses 2 Costs
Revenue Subsidy Neededl Cost able Needed ($000)
Berkshire RegionalTransit Authority
Brockton AreaTransit Authority
Cape Ann Transpor-tation Authority
Cape Cod RTA("Not Applicable")
Franklin RTAGreater Attleboro-Taunton RTAGreenfield-MontagueTransportation AreaLowell RTAMerrimack Valley RTAMontachusett RTAPioneer ValleyTransit AuthoritySoutheastern RTAMartha's VineyardTransit AuthorityWorcester RTA
Total
$1,186,488 $ 518,277 $ 668,211 -- -- 18 2 $ 300
4,170,000 1,025,000 3,145,000 --
278,600 40,366 238,234
100,644 14,055598,692 119,360
298,895
1,315,6291,273,9611,012,7648,966,846
78,801
487,861295,443218,880
2,835,386
-- Garage: 305,000Fence 10,000
86,589 -- --479,332 Parking; 200,000
Garage 1,350,000220,094 Garage 15,000
Repair827.768 -- --
978,518793,884
6,131,460
5,118,309 1,165,964 3,952,34576,500 9,000 17,500
4,764,522 1,937,623 2,826,899
$29,111,850 $8,746,016 $20,365,834
Garage 335,000Garage 2,000,000
45 __
4 __
9 2 300
6 3 450
362711
217 53 7,950
-- 85 58 8,700__ -- 5 750
Garage 200.000
$4,415,000
68 35 5,250
526 158 $23,700
2Not yet appropriated for FY1984-FY1988.2Based on bus life of 12 years; needed over next 5 years.3At 1983 costs.RTA = Regional Transportation Authority.
SOURCE: Massachusetts EOTC, Regional Transit Authority Operations Report, 1981-1982.
Cost

51
HIGHWAY BRIDGES
Highway bridges in Massachusetts are divided among eight districts and
are the administrative responsiblity of the Massachusetts Department of Public
Works (MDPW), municipalities (cities and towns), the Metropolitan District
Commission (MDC), and the Massachusetts Turnpike Authority (MTA). A small
percentage of bridges are privately owned. The MDPW and the municipalities
are responsible for the greatest number of bridges, 53 percent and 28 percent,
respectively.
Facilities, Age, and Current Conditions
According to the MDPW (interview, March 1983) and The Road Information
Program (TRIP) (TRIP Report, August 1982), there are about 5000 highway
bridges in the state of Massachusetts. (Refer to Table 3-17.) Approximately
2800 or 56 percent are under state (MDPW) jurisdiction; 32 percent are under
municipal jurisdiction; and the remaining 12 percent are under the
jurisdiction of the Metropolitan District Commission (MDC), the Massachusetts
Turnpike Authority (MTA), or private owners.
Highway bridges in Massachusetts are as old as 80 years and as young
as a few years, with the average age being about 40 years. As shown by
Figures 3-2 and 3-3, bridge building, since the turn of the century, has
occurred in spurts and always in response to crises. During the Great
Depression, as many as 49 state-owned and 36 municipally owned bridges were
built in a single year as a result of the jobs programs implemented as part of
the New Deal. The average number of bridges built in each year prior to the
Great Depression was 12 state and 8 municipally owned. During the latter half
of the 1930s, there was severe flooding in the state; as many as 48 state and
36 municipal bridges were built in one year (1937 and 1939, respectively).

52
Table 3-17
HIGHWAY BRIDGES--EXISTING FACILITIES
Federal Aid Nonfederal Aid
Jurisdiction System System Total
MDPW 2496 272 2768
Municipal 681 -- 681
Town -- 856 857
MTA 317 47 364
MDC 108 8 116
Other 4 10 14
Total 3606 1193 4799
SOURCE: Massachusetts Department of Public Works, July 21, 1982.

Cumulative Percentage of Bridges
Number 150 r e -pug-:AofBridges 140Per Accelerated BridgeYear 130 Program
Year~~~~~~~~~~~~~~~~~~~~~Ya 130l
120
110
100,
80-
70. ~~~~~~~~~~~~~Floods60 ~~~~~~Great
50 Depression Floods
40
30
20
10
01900 1910 1920 1930 1940 1950 1960 1970 1980
Year BuiltbuuuLr: Massacnusetts Department or Public Works, June 1982.
Figure 3-2. Number of State-Owned Bridges Built Per Year

Cumulative Percentage of Bridges
Number 120 Floodsof Fod
Bridges 110 FloodsPerYear 100
90
80
70
60
50 Great
Depression40
30
20
10
01900 1910 1920 1930 1940 1950 1960
SOURCE: Massachusetts Department of Public Works, June 1982
Figure 3-3. Number of City-Owned Bridges Built Per Year
1970 1980Year Built

55
Hurricane and flood damage forced municipalities to build 120 bridges in 1956.
Many of the state's bridges were built between 1950 and 1970 during the time
of the state's accelerated bridge program. The ZDPW built about 63 percent of
the total number of its bridges during this period. Bridges built from
1950-1970 represent a major source of problems experienced today because they
all now require substantive maintenance or reconstruction. Older bridges face
these same needs.
The major source of information on the condition of the state's
highway bridges is the MDPW. A sufficiency scale has been developed by the
American Association of State Highway and Transportation Officials (AASHTO)
for the purposes of measuring bridge deficiencies and establishing renewal
funding priorities. (Refer to Table 3-18 and Figures 3-4 and 3-5.) On the
sufficiency scale of 0 to 100 from poorest to best condition, the MDPW
(interview, March 1983) indicates that 2,547 (50 percent) bridges fall below a
rating of 80. Of these bridges, 1,506 (30 percent) fall within the range of
50-80 on the scale. These bridges are said to have deteriorated to a point of
needing "major preventive maintenance or substantial rehabilitation" (TRIP
Report, August 1982, p.4). The remaining 951 (20 percent) bridges fall below
50 on the sufficiency scale. These bridges are said to require "immediate
rehabilitation or replacement" (TRIP Report, August 1982, p.4).
Maintenance Plans and Costs
No specific maintenance plans are available.
According to officials at the MDPW, there are insufficient financial
resources available to upgrade and maintain the state's bridge system. At an
average cost of $200,000 per bridge for some 2,525 in need of repair and
$500,000 per bridge for some 1019 considered critical, the annual cost of a

56
Table 3-18
AASHTO RATING OF MASSACHUSETTS BRIDGES
RatingOwner <50 50G-80 >80 Total
MDPW 435 841 1524 2800
(%)
Municipal 496 504 600 1600
Other 20 161 419 600
Total 951 1506 2543 5000(20%) (30%) (50%) (100%)
AASHTO = American Association of State Highway and TransportationOfficials.
MDPW = Massachusetts Department of Public Works
Other = Massachusetts Turnpike Authority, Metropolitan DistrictCommission, and Private.
SOURCE: Massachusetts Department of Public Works, 1980.

MDPW &4 28007%
1000 63%
City/Town C- -- -
Other -- 0-- - 8-_ _ 181
I A A A . . . A A _ II_1980 1981 1982
SOURCE: Massachusetts Department of Public Works, June 1982
Figure 3-4. AASHTO Sufficiency Rating < 80
NumberofBridges
2000
1500
1000
500
1983Year

I I - - - - - -I I I1980 1981 1982
SOURCE: Massachusetts Department of Public Works, June 1982
Figure 3-5. AASHTO Sufficiency Rating < 50
500
NumberofBridges
400
300
200
100
1983Year
II

59
20-year bridge program would be about $25,000,000. Additionally, assuming a
generous 100-year life for a typical highway bridge, the average annual cost
of bridge replacement to maintain the status quo would be about $25,000,000.
A program to maintain the status quo would require 50 bridge replacements each
year.
According to the TRIP report (1982, p 3), the cost of bringing those
1.476 bridges which are in need of "preventive maintenance or substantial
rehabilitation" up to state and federal standards will be on the average of
$250,000 per bridge. The cost of bringing the 951 bridges that are in need of
"immediate rehabilitation or replacement" up to state and federal standards
will be on an average of $500,000 per bridge. Thus, the total cost of simply
bringing the bridge system up to the condition required by state and federal
standards would be about $844,500,000 (in 1982 dollars). The estimate does
not include the engineering and design costs.
Construction Plans and Costs
There is no indication that there are any plans to construct new
bridges on any new locations. All of the emphasis in the various published
and unpublished sources is on the maintenance of the existing bridge
facilities.
AIRPORTS
The Massachusetts Aeronautics Commission (MAC) is the statewide
policy-making body for airport development that administers and enforces
Massachusetts' aeronautic laws (MAC, Nov. 1980). It exercises all of the
Commonwealth's responsibilty over all airports except Boston-Logan and
Bedford-Hanscom, the latter two being managed by the Massachusetts Port
Authority, a semi-independent state authority. The municipalities (cities,
31-895 0 - 84 - 6

60
towns, and counties) may construct and operate airports and restricted landing
areas provided they receive approval from the MAC. The official airport
system of the state is divided into seven subregions. They include: Boston,
Route 495, Cape and Islands, Hartford/Springfield, Route 2 Corridor,
Southeastern Massachusetts, and Berkshires.
The airport network is constructed so that a pilot flying over the
Commonwealth is always within 17 miles of a paved, lighted runway and no more
than 24 miles from an airport with a published instrument approach (MAC, 1980,
p.18). All major communities in the state have easy access to at least one
general aviation airport. (Refer to Figures 3-6 and 3-7.) Scheduled
passenger service is available at eight points: Pittsfield, Worcester, New
Bedford, Hyannis, Martha's Vineyard, Nantucket, Provincetown, and Boston.
The current airport system has enough capacity to meet the state's
airport demand until at least 1990 and perhaps the year 2000. In fact,
according to the MAC, by 1990 airport capacity is expected to be 50 percent
greater than demand. The surplus capacity will not, however, be evenly
distributed over the system. For instance, Boston-Logan is currently
experiencing a severe capacity shortage, while the Hartford/Springfield area
is expected to have more than ample capacity through 1990. The distribution
of capacity and demand will determine the needs of the existing airport
facilities in terms of future maintenance and construction (MAC, 1980. p.24).
Facilities and Age
There are about 66 airport facilities in the state of Massachusetts.
They include 47 airports, 6 grass fields, 6 heliports, 4 seaplane bases, and 2
military airports (MAC, Map, 1980). The airport facilities in the state are
either municipally or privately owned. Most of the facilities are for general

44.44.44 �$ 4- -,�44 '4 s..-4 '-.Fa 244.4..4 4..-�.. 144.4124
.4,-. 2444444�* --� 24* *-44� 244.4�,
'4 2?-4
.44.44.. 4.ai - �
p-4
SOURCE: Massachusetts Aeronautics Commission. Massachusetts Airport System Plan.November 1980
Figure 3-6. Airport Coverage in Massachusetts
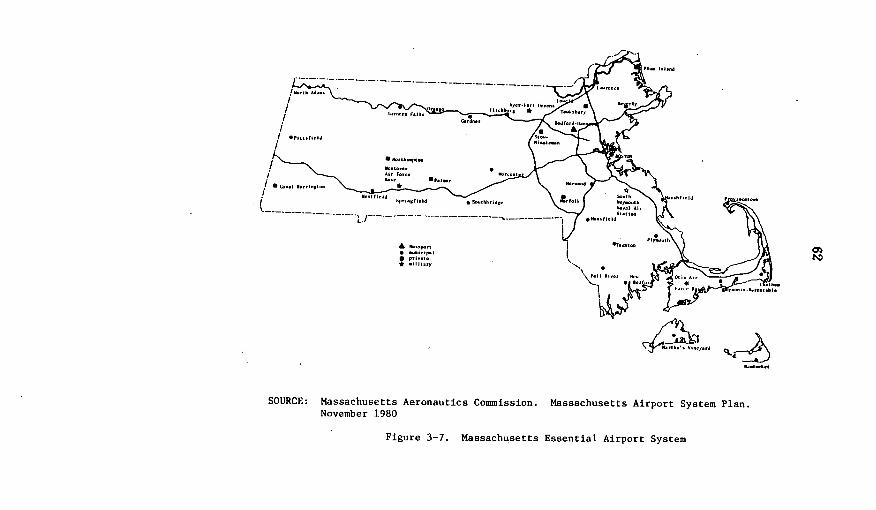
P1a Ii.,.d
* *'*.r lan\l
*Villl~~~~~tl~~r11' ' " * t ,.I *th..i,_
SOURCE: Massachusetts Aeronautics Commission. Massachusetts Airport System Plan.November 1980
Figure 3-7. Massachusetts Essential Airport System

63
aviation and open for use by the public. There are about 160 facilities that
are privately owned and not open to the public. Such facilities include, for
instance, landing strips in the backyards of private homes. The newest
general aviation airport was developed in 1947. Therefore, all the general
aviation airports are at least 35 years old. Logan, the largest of the
state's airports is 42 years old. (Prior to 1941, Logan was significantly
smaller and was called the Boston Municipal Airport.)
Specific details on the existing facilities at each of the airports
are not easy to find; however, some information is provided in Table 3-19.
Most of the runways in the state are paved, but approximately 12 percent of
the runways are sod (MAC, 1980, p.10). The runways range in length from 1,600
ft. at Falmouth to 10,000 ft. at Logan and average about 3,000 ft. Most of
the runways are lighted, but about 25 percent of them are-not (MAC, 1980,
p.10). Sources such as the Massachusetts Aeronautics Commission, the Federal
Aviation Administration, and the Aircraft Owners and Pilot's Manual may be
helpful in finding more detailed information on the other airports in the
state.
Logan airport is located on 2300 acres of land. There are five active
runways, one of which is 2.500 ft., two of which are 7,900 ft., and two of
which are 10,000 ft. The 10,000 ft. runways can accommodate any commercial
airplane.
Maintenance Plans and Costs
The Massachusetts Aeronautics Commission is responsible for overseeing
the upkeep of the municipally owned airport facilities (interviews, March
1983. Annual inspections are made by the Commission, and managers of the
facilities are required to correct any deficiencies identified during those

64
TABLE 3-19
AIRPORT AND RUNWAY DESCRIPTION
IAME RUNWAY LENGT SURFACE LIGHTITG G FT==.zVAPIT03
- -- ~ 1. -. -1-0Aga~
3Sae
Bedford
3Sverly
Eet1oo-Loga
Chathea
Edgartov
Tak: Slyer
7.1waoth
Fi:tchhbr
Cardoer
Creat 3afrllgtou
Groton
Saverhfl
Saverhill-Riverside
Bopedale
Laureate
Mansfield
Marlboro
Marsbf.3ld
5-Z310-Z3
6-24
L1-295-23
16-349-272-20
4R-22L4L-22R15R-335L15L-33R
9-27
6-24
3-2218-3 66-24
15-33
6-2415-33
7-25
14-322-20
18-36
n -29
17-35
18-36
15-33
7-25
18-36
6-2415-33
5-2314-32
14-324-22
15-33
6-24
2160
3500
70005106
463750003500
100007870
1000024607002
3000
4000300027002200
39501600
2300
45083505
3000
2700
2500
1840
2040
1610
3193
55674000
50003900
35002100
1650
3000
Paved
Paved
PavedPaved
PavedPavedPavedPaved
PavedPaved
Paved
Paved
SodSodSod
Sod
?avedPaved
Paved
PavedPaved
Paved
Paved
Sod
Paved
Paved
Paved
Paved
PavedPaved
Paved
Paved
PavedSod
Paved
Paved
No
Tea
yesYes
YesYes
No
Yes
TeaYes
Yea
Yes
YeNoNo
YesNo
Yes
YesNo
No
NO
NoYeaYeaNoNo
No
NoYea
Yea
Yes
584
133
108
1 9
72
20
.40
330
955
72628171
11.520
26956
135
124
285
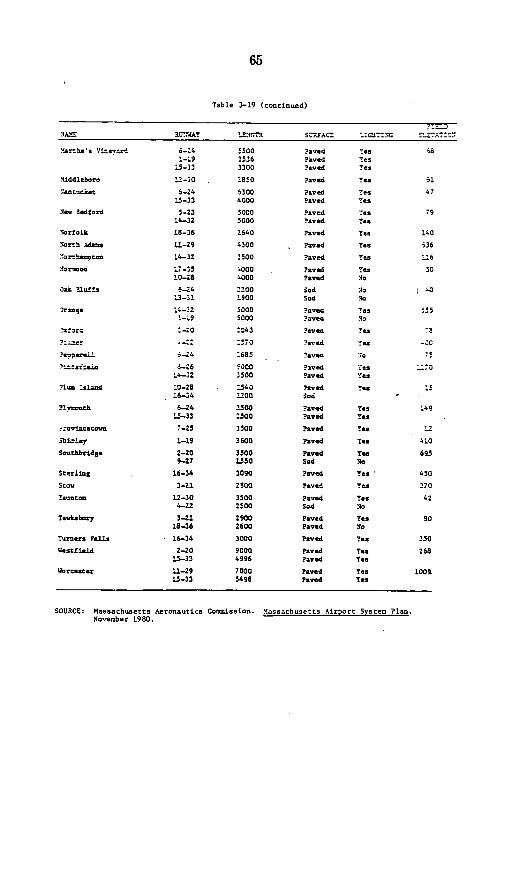
65
Table 3-19 (continued)
NAŽ!E RUNBAT 'rII:TR SZNPACZ 1LoC0 :-A.:O'J
MArla's 7ineyard 6-_4 5500 Paed Yes 6a:_;9 ?536 P6ved Yes
15-33 3300 ?aved 7es
.1iddleboro 12-30 2850 ?aved yes i1
'saucoet 6-24 6300 Paved Yes 67!5-33 4000 Paved Yes
lev 3edford 5-23 5000 Paved Tes 7914-32 5000 Paved Yes
Sorfolk 18-36 2640 Paved Yes 140
North M. 11-29 4300 Paved .es i36
"orbca=coa 14-32 2500 Paved 'es " 6YaraooC ;7-35 4000 ?Pvd Yes 50
10_28 4000 Paved No
Oak Ulafls ;-24 2200 Sad 30 j*3_-1 1900 Sod So
iraqe ;4_32 5000 Paves Yes '555000 ?ang No
7sf org -..0 :C43 Paves 7Ye 7S
-:70 ?aves res -OC
'sspere ,.j_4 :685 7avem Jo S
?'t:sfies 3-Z6 5000 Paved 7es _.OL4-32 3500 ?ave Yes
?lu :slad !0-28 2540 ?aved Yes :516-34 2200 Sod
Pl7moth 6-24 3500 Paved Yes 14915-33 2500 Paved Yes
- .oviactow 7-25 3500 Paved Yes 12
Shirle 1-19 3600 Paved T 410
Southbridge 2-20 3500 Peved Yes 6959-27 1550 Sod No
Sterling 16-34 3080 Paved Yes 450
Sto. 3-21 2800 Paved Yes 270
Taocog, 12-30 3500 Paved Yes 424-6Z 2500 Sad So
Tewksomy 3-21 2900 Paved Yes 9018J6 2600 Paved 3o
Tarogrs Falls 16-34 3000 Paved Yes 350
Westfield 2-20 9000 Paved Ye 26815-33 4996 Paved Yes
Worcester 11-29 7000 Paved Yes 100915-33 5498 Paved Tes
SOURCE: Massachusetts Aeronautics Commission. Massachusetts Airport System Plan.November 1980.

66
inspections. The inspections include examination of runway pavement
conditions, size and depth of runways, taxiways, and ramps. There are no
fixed standards by which these evaluations are made. Each airport manager has
a certain amount of time within which to correct the deficiencies. If they
are not corrected within the time frame allotted, the Commission has the right
to take away the facility's certificate of approval.
Officials at Massport indicate that the condition of the facilities at
Logan is excellent, although it was reported that there are no formal
standards by which the quality or condition of the airport facilities are
measured. There are, however, regular internal and annual FAA inspections of
the facilities.
Maintenance at all of the municipally owned airports and at most of
the privately owned airports in the state are based upon annual inspections
carried out by the Massachusetts Aeronautics Commission (interview, March
1983). Municipal airports are required by law to correct the deficiencies
identified by the Commission inspectors. It is the responsibility of the
airport managers to carry out the recommended maintenance. The Commission
only has advisory power over the maintenance activity of privately owned
facilities, although ultimately the Commission does have the right to revoke
an airport's certificate of approval if it does not carry out recommended
maintenance.
Logan airport operates a continuous preventive maintenance program.
As a result, there is seldom any need to undertake specific structural
maintenance or repair projects. As indicated above, internal inspections of
the facilities, particularly the runways, take place regularly. The findings
of these inspections vary from time to time and provide the basis for
selection of the types of maintenance required (interview, March 1983).

67
The expected level of maintenance expenditure at Logan for the next
five years is $55,000,000 (interview, March 1983).
Construction Plans and Costs
According to officials at the Massachusetts Aeronautics Commission,
the types of construction expected to be carried out this year on the state's
airports include major improvements such as apron, runway, taxiway, and
internal road network rehabilitation (lighting and pavement), terminal
expansion and renovation, obstruction clearing, and rebuilding of electrical
vaults. Related projects include installation of localizer and marker
beacons, master plan development, and environmental impact assessments. Table
3-20 provides specific details on airport construction plans and costs. Were
the current federal share to be maintained, 90 percent of the expected cost
would be financed by the Federal Aviation Administration.
SEAPORTS
There are many seaport facilities in the state of Massachusetts,
however, data on stock, age, maintenance plans and costs, and construction
plans and costs on existing facilities are disaggregated and difficult to
obtain. For this reason, the seaport information in this report is confined
to that of the ports of Boston, New Bedford, and Fall River. These are the
largest publicly administered seaport facilities in the state of
Massachusetts. In spite of their sizes and importance in the state's economy,
information on the ports of New Bedford and Fall River is not as easily
accessible as that for the port of Boston. The report reflects this
difficulty.

68
Table 3-20
AIRPORT CONSTRUCTION PLANS AND COSTS (FY83)
Airports Plans Costs
Chatham Apron and taxiway rehabilitation andexplansion $ 100,000
Curtis Falls Feasibility study for runway expansion Pendingfunding
Fall River Rehabilitation of lights Pendingfunding
Fitchburg Fence installation 50,000
Hyannis Runway rehabilitation 158,000
Lawrence Runway and taxiway lighting; approachclearing; relocation of electricity vault 297,000
Apron pavement and service road rehabilitation 450,000
Mansfield Runway light rehabilitation Pendingfunding
Marshfield Runway reconstruction; land clearing (11 acres) 300,000
Nantucket Main runway rehabilitation 1,000,000
Master plan update 55,000
New Bedford Feasibility study--obstruction clearing;terminal expansion; new taxiway lighting;runway approach improvements 55,000
Norwood Main runway rehabilitation 1,920,000
Orange Master plan update 45,000
Pittsfield Master plan update 30,000Engineering work resulting from a recently
completed pavement study 50,000
Plymouth Localizer and marker beacon installation 200,000
Master plan update 36,000Land clearing (10 acres) 100,000
Provincetown Apron and taxiway reconstruction 153,000
Westfield Pavement improvements; technical obstructions 2,100,000
Worcester Main runway lighting; taxiway holding signs 100,000
Tree clearing 73,000
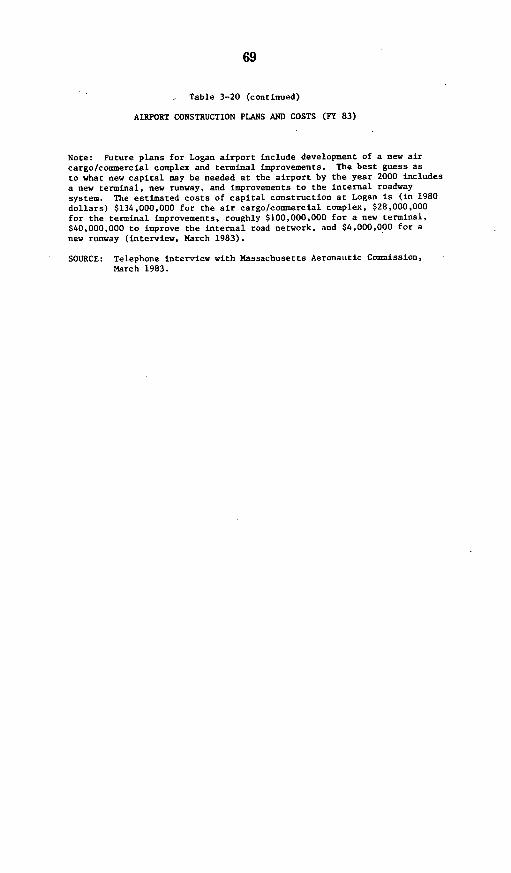
69
Table 3-20 (continued)
AIRPORT CONSTRUCTION PLANS AND COSTS (FY 83)
Note: Future plans for Logan airport include development of a new aircargo/commercial complex and terminal improvements. The best guess asto what new capital may be needed at the airport by the year 2000 includesa new terminal, new runway, and improvements to the internal roadwaysystem. The estimated costs of capital construction at Logan is (in 1980dollars) $134,000,000 for the air cargo/commercial complex, $28,000,000for the terminal improvements, roughly $100,000,000 for a new terminal,$40,000,000 to improve the internal road network, and $4,000,000 for anew runway (interview, March 1983).
SOURCE: Telephone interview with Massachusetts Aeronautic Commission,March 1983.
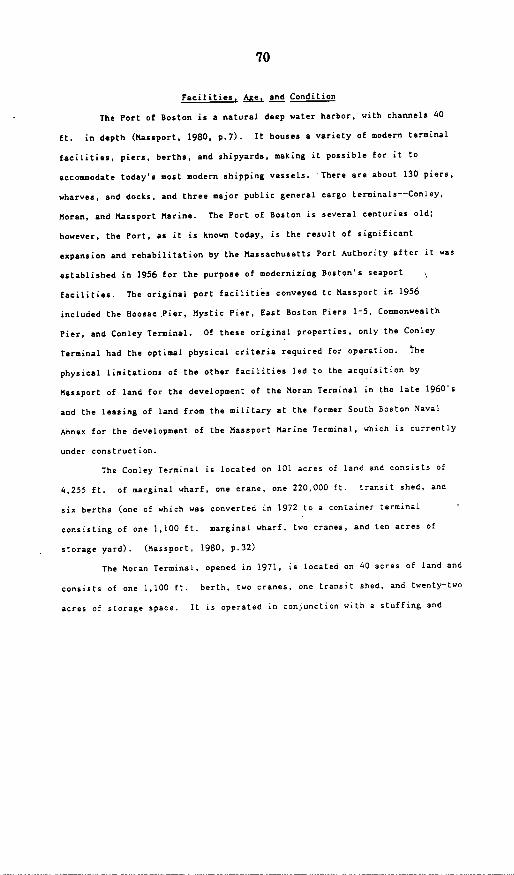
70
Facilities, Ae and Condition
The Port of Boston is a natural deep water harbor, with channels 40
ft. in depth (Massport, 1980, p.7). It houses a variety of modern terminal
facilities, piers, berths, and shipyards, making it possible for it to
accommodate today's most modern shipping vessels. There are about 130 piers,
wharves, and docks, and three major public general cargo terminals--Conley,
Moran, and Massport Marine. The Port of Boston is several centuries old;
however, the Port, as it is known today, is the result of significant
expansion and rehabilitation by the Massachusetts Port Authority after it was
established in 1956 for the purpose of modernizing Boston's seaport
facilities. The original port facilities conveyed to Massport in 1956
included the Hoosac Pier, Mystic Pier, East Boston Piers 1-5, Commonwealth
Pier, and Conley Terminal. Of these original properties, only the Conley
Terminal had the optimal physical criteria required for operation. The
physical limitations of the other facilities led to the acquisition by
Massport of land for the development of the Moran Terminal in the late 1960's
and the leasing of land from the military at the former South Boston Naval
Annex for the development of the Massport Marine Terminal, which is currently
under construction.
The Conley Terminal is located on 101 acres of land and consists of
4,255 ft. of marginal wharf, one crane, one 220,000 ft. transit shed, and
six berths (one of which was converted in 1972 to a container terminal
consisting of one 1,100 ft. marginal wharf, two cranes, and ten acres of
storage yard). (Massport, 1980, p.32)
The Moran Terminal, opened in 1971, is located on 40 acres of land and
consists of one 1,100 ft. berth, two cranes, one transit shed, and twenty-two
acres of storage space. It is operated in conjunction with a stuffing and
71
stripping shed at Mystic Pier 1, which is located on twelve acres of land and
consists of one 900 ft. berth and transit shed. The Massport Marine Terminal
is currently being redeveloped and is expected to comprise a 47-acre terminal
with 2.700 ft. of marginal wharf, three berths, and four cranes. The
terminal is being put into operation as capacity and demand expands (Massport,
1980, p.30).
In general, the Port of Boston is in good operating condition.
At the Fall River harbor, there are 17 piers, wharves, and decks. The
State Pier was completed in 1955 at a cost of about $1.5 million. The Pier is
a wooden-piling, wooden-deck fingered pier in good condition with narrow
aprons. There is one berth, one terminal, and one transit shed extending the
length of the Pier, and 2.5 acres of storage yard area. (In 1979, there were
plans to acquire 2.5 more acres for storage area.) (Louis Berger and
Associates, p.66)
The New Bedford Harbor is located on 20-25 acres of land. The State
Pier at New Bedford is constructed of concrete on timber pile with a narrow
apron on the lower side and four transit sheds made of concrete and steel.
The terminal has an 18-ton fork lift for handling containers.
Maintenance Plans and Costs
Documented information on the maintenance of seaport facilities is not
readily available. In general, however, maintenance includes dredging of ship
channels into the ports, upkeep (such as paving repairs) of the surface
infrastructure leading to the port facilities, upkeep (such as reroofing) of
the terminals and storage sheds, repairs to fenders and piling of the wharves,
and rebuilding of the berths.
These estimates reflect expectations of cost based upon past
. 72
experience at the Port of Boston. Repairs to piling and fenders of wharves
are a major expense, approximately $2 million each decade. Reroofing is done
as needed and averages about $3,000,000 per storage shed. Rebuilding berths
costs about $2.5 million and must be done every 10-20 years (interview, March
1983).
Construction Plans and Costs
The Port of Boston recently embarked on an expansive development plan.
Port development in the 1980's will focus on incremental expansion of
container handling capacity at Conley Terminal in order to meet market demand
and development of the Massport Marine Terminal complex in South Boston for
bulk and break-bulk cargo (Massport, 1980, p.2).
In 1978, Massport began implementation of a three-phase development
program. Phase 1, which was initiated in 1978, included the rehabilitation of
Moran and Conley Terminals including replacement and addition of cargo
handling equipment, rehabilitation of berths, storage areas, and terminal
buildings, and expansion of container storage areas at Moran. Phase 2
involved the construction of a new ten-acre, two-crane container site at
Conley Terminal completed in 1982. Phase 3 involves the creation of a new
47-acre (11 acres of land and 36 acres of water) marine terminal at the site
of the former South Boston Naval Annex. It will be used in conjunction with
the port properties at the Army Base, Commonwealth Flats, and the Naval
Recreation site. It is expected to accommodate demand for port facilities in
Boston through the year 2000. It will serve as a break-bulk facility and can
be converted for use in handling containers as market demand expands. The
first stage of Phase 3 includes the construction of a dike, 36 acres of
landfill and rehabilitation of existing berth and land area. The Maritime

73
Capital Program for 1983-84 continues implementation of the Phase 3 of the
development Program. There are four major areas of activity: (1)
rehabilitation of Conley terminal infrastructure unrelated to the development
of new container capacity; projects include Shed 1 repairs, roadway
construction, berth rehabilitation, and water main replacement. (2) basic
maintenance as required to keep the terminals in reasonable operating
condition; (3) continued development of Massport Marine Terminal to allow
transfer of cargo from Conley and handling of other break-bulk and bulk
vessels; projects include dredging, jetty repairs, construction of interior
dikes, replacement of drain lines, and land filling as material becomes
available; (4) development of facilities to meet demand of new cargos and
tenants.
At Fall River, an Economic Development Administration (EDA) grant was
awarded in 1979 for upgrading and expansion of the State Pier. This was a
two-phase development program. Phase 1 involved the filling of Crab Pond and
development of 7.5 new acres. Phase 2 involved the rehabilitation and
reconstruction of an existing seawall to provide docking spaces for barges and
other commercial vehicles.
Neither the Department of Environmental Quality Engineering nor the
Fall River Line Pier (which own and manage the State Pier, respectively) have
any planning staff for the development of the Fall River State Pier. Any
plans, such as those funded by the EDA grant, are initiated at the local
level. There are no comprehensive Master Plans identifying a long-run
direction for the development for Fall River port facilities.
There are no recent development plans for the New Bedford port
facilities.
For the Port of Boston, the estimated cost of Phase 3 of the

74
development program is $23 million for construction of the dike and the
filling of 36 acres of water. (The costs of Phases l.and 2 were $17 million
and $19 million, respectively.) An additional $21 million is included in the
FY1983-84 Capital Program for Phase 3. Of this amount, $9.6 million worth of
projects are already underway. An additional $4.5 million has been set aside
for expansion of container facilities at Conley if justified by market demand.
Also, $3.7 million has been set aside for other terminal rehabilitation and
access improvements.
No estimates were available for Fall River plans.
An important issue with regard to maintenance and construction of
seaport facilities in Massachusetts is the fact that the demand for usage of
port facilities appears to be growing very slowly, or, in some cases, not at
all. The uncertainty about the future growth of demand makes it very
difficult to estimate what will be required in the way of new facilities and
maintenance to the year 2000.
HIGHWAYS
Jurisdiction over the state's roadway system is divided between the
Massachusetts Department of Public Works (MDPW), the Massachusetts Turnpike
Authority (MTA), the Metropolitan District Commission (MDC), and 351 cities
and towns. The Interstate routes, established by Congress, are managed by the
MDPW and MTA. All other major highways are administered by the MDPW, MDC, and
the cities and towns.
There are two funding systems, the federal-aid system and the
state-aid system. The federal-aid system includes interstate, primary,
secondary, and urban routes administered by the MDPW and MDC. The state-aid
system includes primary and local routes administered by the cities and towns.

75
Facilities and Age
As shown in Table 3-21, there are about 33,780 linear miles of roadway
in the state of Massachusetts (Byrd, Tallamy, 1982, p.8). They are divided
among the following functional classifications:
Interstate highways 529.66Rural principle arterials and their urban extensions 756.37Rural minor arterials and their urban extensions 1471.71Other urban principle arterials with beginning and ending
terminus in a single urban area 918.64Rural major collectors and urban minor arterials 4407.38Rural minor collectors and urban minor arterials 4680.85Local roads and streets 21007.01
Local roads and streets account for about 60 percent of the state's roadway
system. However, most of the daily vehicular miles traveled in the state
occurs on a very small percentage of the system. The parts of the system
administered by the MDPW, the MIA, and the MDC account for only 10 percent of
the roadway system, but 50 percent of the daily vehicular miles traveled on
the system. The mileage by funding system is shown in Table 3-22, and the
funding systems are given in Table 3-23. A jurisdictional comparison is
provided in Table 3-24, and the daily miles traveled are given in Table 3-25.
Measurement of the condition of the roadway system is not an easy
process. The primary source of difficulty is the lack of consistency between
local, state, and federal standards. This makes a general assessment of the
condition or the quality of the state's roadway system almost impossible in
the short run. Officials at the MDPW indicate that it would take a lot of
time and energy to generate accurate, consistent, and up-to-date assessments
of the state's roadway system.
According to The Road Information Program (TRIP) report written in
1982, an estimated 21,759 miles (65 percent) of the system are in good to fair
condition. These estimates are based on standards established by the American
31-895 0 - 84 - 7

76
TABLE 3-21 EXISTING SYSTE?.I MILEACE BY FUNCTIONAL CLASSIFICATION
FUNCTIONAL JUlISOICTION
CLASSIFICATION STATE LOCAL MOC MTA OTHR
1 382.0 0 0 134.5 0
2 814.1 s8.8 3T7. 6.7 2.1
3 882.0 580.2 0.2 1.1 0.4
4 182.9 710.2 22.8 0 3.3
5 838.2 3.aes.s 62.6 0.2 14.2
6 68.8 4,593.2 1 1.8 0 10.8
0 77.0 20,380.2 123.1 0.1 430.9
TOTAL 2.843.1 130083.2 1 248.0 141.8 111.511
PERCENTAGE 8.4% | 88.1% | 0.7%1 0.4%
TOTAL PAECENT-AGE
818.5 1.5%
768.3 2.2%
1,488.8 4.4%
919.0 2.7%
4,404.1 13.0%
4,s82.3 13.8%
21,027.3 62.3%
]L1[0W _ _
TABLE 3-22 EXISTING MILEAGE BY FUNDING SYSTEM
FEDERAL-AID JURISDICTION
SYSTEM STATE LOCAL MOC MTA OTHER
INTERSTATE 382.0 0 0 134.5 0
PRIMARY 1.48e.1 .884.7 38.1 8.8 2.5
SECONDARY 304.7 1,708.5 0 0 1 0.
URBAN 462.7 5,097.2 80.8 0.2 10.2
TOTAL F-A 2,725.6 7,488.4 118.9 141.5 23.3
PERCENTOF F-A
71.3% 1.1% I 1.4% I 0.2% I
TOTAL
516.2
2,228.2
2,111.6
5,641.1
10,487.6
100%
PERCENTOF TOTAL
31.1%
o
NNON/F-A 1 17.6 | 22,594.3 | 125.1 r 0 1 4382 23L27.8 L 8. 8
TOTAL 2,843.1 1 200831.2 | 248.d 1 141.8 4151 33,777.4 _
. l

77
TABLE 3-23
FUNDING SYSTEMS
FUNCTIONAL CLASSIFICATION FEDEFIAL-AID STATE -AID * NUMBERING SYSTEMS
I INTERSTATE N/A INTERSTATE
2 PRIMARY PRIMARY US AND STATE
3 PRIMARY PRIMARY US AltD STATE
4 URBAN PRIMAR1Y STATE AND UN-NUM.'BERED
B SECONDARY PRIMARY STATE AND UN-NUMBEREDAiJD URBAN
6 UReAN AND PRIMARY UN-NUMBERED
NON-PA
0 NON-FA , LOCAL UN-NUMBERED
* THE STATE-AID SYSTEM APPLIES OrLY TO THOSE ROADS
UNDER JURISDICTION OF CITIES AND TOWNS.
MASSACHUSETTSFUNCTIONAL CLASSIFICATIONCode Description1 Interstate highways2 Rural principal arierials and their urban ex-
tensions. These are routes of both intra andinterstate importance which link populationcenters of at least 25.000.
3 Rural minor arterials and their urban exten-sions. These are routes of regional importancethat link population centers of 5,030 andmore.
4 Other urban principal arterials. with beginn-ing and ending terminals within a single ur-ban area.
5 Rural major -collectors and urban minorartierals.
6 Rural minor collectors and urban collectorstreets.
0 Local roads and streets.
SOURCE: Byrd, Tallamy, MacDonald, and Lewis. 1982. A Report to theMassachusetts Special Commission on. Highways.. Virginia (April).

78
TABLE 3-24 JURISDICTIONAL COMPARISON
TR~AFFICJURISDICTION LINEAR MILES LANE MILES (VMT 1I 1.0008)
STATE (DPW) 2.843.1 (8.4%) 8.392.8 (12.7%) 41.48.6 (43.4%)
LOCAL (INCLUDES 30,083.2 (89.1%) 66.798.8 (84.3%) 48,000 (49.8%)UNACCEPTED)
MDC 248.0 (0.7%) 653.0 (0.9%) 2.286 (2.4%)
MTA 141.6 (0.4%) 870.0 (1.0%) 4,151 (4.3%)
ALL OTHERS 481.5 (1.4%) 744.1 (0.1P.) 308 (0.3%)
TOTAL 33.777.4 (100%) O0.10.5 - 100%) 98.891 (100%)
TABLE 3-25 ROAD MILES ANDDAILY VEHICLE UILES TRAVELED
STATE JURISDICTION:
oPw ----- --- - _ 2.34a.1
IAC -- -- - -- -- 248.0
"TA … 4.
PARKS __ __ _____ 25JA
INSTITUTIONS - - - - - - .7
COLLEOE3S - - - - - -*.r
PORT - - - - - - - - - 3.
TOTAL 3.578.8 IL:S
LOCAL JURISDICTION:
ctrsS ANO TOWNS _ 21.1Z22.7
UNACCEPTED - _ _ a ee0.8
TOTAL 30.0(2.2 UILCS
FEDERAL JURISDICTION:
PARKS … - -- - - - - -25.4
DEPT OF DEFENSE - _ 66.9
CORPS Of EGOR 2.5
PTntunom … -_ _ - - -1.6
TOTAL I11.4 JILES
SOURCE: Byrd, Tallamy, MacDonald, and Lewis. 1982. A Report to the
Massachusetts Special Commission on Highways. Virginia (April).
79
Association of State Highway and Transportation Officials (AASHTO). These
roads are characterized by "extensively cracked, rutted, and broken pavement"
and require resurfacing or replacement (TRIP Report, 1982, p.2).
A second data source on road conditions, available at the MDPW, was
completed in 1981 and pertained only to the parts of the system receiving
Federal aid. The parts of the system receiving Federal aid account for only
about 33 percent of the total system (Byrd, Tallamy, 1982). According to
these data, 5,004 miles (39 percent) are in good condition, with no indication
of failure; 6,806 miles (53 percent) are in fair condition, showing minor
evidence of cracks and patching, but not yet affecting serviceablity; 916
miles (7 percent) are in deficient condition, showing evidence of cracking,
rutting, potholes, and extensive joint failure; and 32 miles (2 percent) are
intolerable and in complete disrepair.
The MDPW is currently in the process of completing a broader
assessment of the state's public road system (interview, March 1983). There
is a Highway Performance Maintenance System through which each state is
mandated to submit to the Federal Highway Administration (FHWA) detailed
information, including condition, on the Federal aid part of its roadway
system. In order to carry out the mandate of the FHWA, the MDPW has selected
a stratified random sample of 2,200 links in the highway system upon which
extensive tests of road condition are to be executed. Thus, far the MDPW has
been able to complete the tests on only 350 of the 2,200 sections. Severe
cutbacks in their staff have prohibited more timely completion of the task.
It is expected, however, that the evaluations will be completed by the end of
1983.
The Massachusetts Turnpike Authority (MTA) indicates that there is an
annual inspection of the Turnpike facilities and that the Turnpike is in good

80
repair (interview, March 1983).
One factor that will certainly effect the rate at which the road
system deteriorates in the future is the new Surface Transportation Act
Legislation (interview, March 1983). In this new legislation, there has been
an upward adjustment of the length and weight of trucks on the roads. This
will, no doubt, increase the wear and tear on the state's major roads.
Officials at the MDPW indicate that it is unlikely that the new revenues to be
generated from the increased gasoline tax and truck registration fees will
cover the higher costs of maintaining the road system as truck weights and
lengths increase.
The age of the roadway system as a whole would be extremely difficult
to determine. The initial part of the Turnpike (New York to Route 128) opened
in May 1957. The Boston extension (Route 128 to Kneeland St.) opened in
1965-1966.
Maintenance Plans and Costs
Maintenance of the roadway system generally consists of resurfacing
(every 10 years), repainting safety lines, guardrail replacement, and snow and
ice removal. Specific maintenance plans for all of the state's roads are
difficult to find. There are many administrative bodies overseeing the
maintenance of the system, hence the information is very fragmented. (The
types of maintenance mentioned above are the types of maintenance carried out
by the MDPW.) (interview, March 1983)
The MDPW is one of the many administrative bodies responsible for
maintaining the roadway system. In its FY1983 budget, the apportionment for
highway and bridge maintenance was $4,504,520; for snow and ice removal,
S7,350,000: for repainting of safety lines, $650,000; and for materials and

81
supplies, $2,380,000. Officials at the MDPW indicated that there is a severe
shortage of funds for maintenance activity and that maintenance needs far
surpass available resources. The shortage has forced the Department to become
fairly innovative in the preservation and acquisition of maintenance
equipment. For instance, snow-fighter trucks with well-preserved engines have
been rehabilitated at a cost of $52,000; the cost of a new snow fighter is
about $105,000. The MDPW staff has also purchased surplus army equipment,
often saving 50% of the cost of new equipment (interview, March 1983).
Construction Plans and Costs
At the MDPW, future investment plans are difficult to predict beyond 6
months to I year (interview, March 1983). The major factors contributing to
the uncertainty include a recent change of gubernatorial administrations, the
political ramifications of any plans, and the uncertainty regarding the
availablity of federal funds. In general, plans for construction will be
dictated by the level of federal funds made available, and the investment
priorities of Congress. The Department is currently assembling a list of
projects to be carried out in FY1984. Last year $200 million worth of new
capital investment projects were advertised.
The MTA anticipates no new construction. Because there are no
definitive construction plans, there is no information on construction costs.
TUNNELS
The two major tunnels in Massachusetts, Callahan and Sumner, which
provide linkage between Logan airport and the city of Boston, are administered
by the MTA. Each tunnel is about I mile long. The Callahan Tunnel. built in
1961. is about 22 years old. It is in good working condition. Maintenance of
the Tunnel generally consists of washing the walls, repainting the safety
82
lines, replacing the lights, and improving the drainage above and below the
tunnel. The road is resurfaced as needed, which is relatively less frequently
than other roads because of light usage and less exposure to adverse weather
conditions. The Sumner Tunnel, built in 1934, is about 50 years old and is
currently being rehabilitated. The rehabilitation project includes
repainting, road patching, and the scraping and replacement of tile.
There is a proposal to extend Interstate Route 90 (Massachusetts
Turnpike) from its present terminus in Boston at the Central Artery across the
Boston Harbor to a new terminus in East Boston. The new tunnel, the Third
Harbor Crossing, would increase harbor highway capacity thus supplementing the
capacity of the Sumner and Callahan Tunnels and the Mystic-Tobin Bridge. It
would be a four-lane, limited-access highway, and would include a depressed
Central Artery, increasing capacity one lane in each direction. The new
tunnel would provide direct access to the Mass Turnpike, Boston's Central
Artery, and Logan Airport.
SUMMARY
The current and expected revenues and expenditures on transportation
infrastructure are presented in Table 3-26. No information was readily
available for some of the modes of transportation. Therefore, the overall gap
between expected revenues and expenditures could not be determined. The
available figures indicate that for highways, bridges, tunnels, railways, and
the MBTA as a group, anticipated revenues to the year 2000 may either exceed
anticipated expenditures by approximately $200 million, or they may fall short
by as much as $3,940 million. A more detailed discussion of these estimates
is provided in Part 6.
The environmental infrastructure is discussed in the next two sections
of this report.

Table 3-26
SUMMARY OF CAPITAL INVESTMENT NEEDS AND REVENUES IN MASSACHUSETTS--TRANSPORTATION(millions of 1982 dollars)
Expec tedAverage RevenunAnnunl Total Expected Revenue Minus Eu-
Necdu fur Selected Perlods Averagn NRed tu Expendl- tu Your 2000P _ pected NeedInvestnent Period Totai Need Annual Need Year 2000 ture.
0Tntal Federal State Local to Year 2000
hiigh.uyu, Bridges,and Tunne l s
High..y. 1983 300 250-350 5,400bridges 1980-2000 i50
6 50 900 100 9,458-9.818 5 858q 3,600-3,960 na. 2.158-2.518Tunnels -- 1.000 -I 1,000 13,3391
RSilooys 1983-1987 22 0c 43 780 9 162 na. n.n. n.. (518)
PublicTrunolportt ion
MBTA 1983-1987 (1993) 1,400-1,600 150-400 2,700-7,200 70 1,260 na. nn. na. (1.440-15.940)Othor 1983-1988 2 8 5-6 100 n.a. n.a. n.a. n.a. na. n.a.
Airports
l.ogn 1983-1988 550g 110 2,300 n.e. n.a. n.e. n.a. na. n.n.Other 1983-1984 12 5 *30 n.u. nn. na. n.e. n.n. n.u.
Buoton I,nOther
SOURCE: Refer to Table 6-1.
Figures in ( ) are negative.
00CO
Part 4
ENVIRONMENTAL INFRASTRUCTURE--WATER
Information on environmental infrastructure was obtained for
water, sewerage systems, and hazardous waste.
WATER
As one of the oldest states in the Union, and indeed one of the
areas of the country first settled by Europeans in the 17th century, the
problems of Massachusetts' water infrastructure are those of a mature
system where the most easily tapped sources of water have long been uti-
lized, and the water distribution system is old and in need of repair.
The two major components of Massachusetts' water infrastructure
are water supply and water distribution, to provide potable drinking
water to communities while controlling water pollution through adequate
sewage treatment. Questions of water quality are intrinsically related
to the sewerage infrastructure, especially in terms of controlling water
pollution due to sewerage problems.
Issues associated with supplying fresh water to major urban areas
typically focus on water supply rather than on water distribution.
Distribution networks are largely fixed by public safety (fire)
requirements on the lower end and by a relatively fixed central
business/high density demand pattern on the upper end. The critical
issues of water supply today and in the future are those associated both
with the number of inhabitants and the location and adequacy of supply
to serve the projected population. (Refer to Table 4-1.)
The three basic questions to consider in the area of water are
those of quality, quantity, and cost: is enough water of acceptable
quality available to the state's residents? These issues provide a
(84)

85
Table 4-1
Population and Water Supply for Communities of10,000 or more, 1982
Percent 1982 Gallons Per1980 Change, Safe Yield Capita Per
Municipality Population 1970-1980 In MGD Day
Acton town2 17,544 18.8 2.7 153.9Adams town 3 10,381 -11.8 8.40 809.2Agawam town 26,271 21.0 -- 76.1Amesbury town 13,971 22.7 1.75 125.3Amherst town2 33,229 26.2 5.94 178.8Andover town 4 26,370 11.3 12.00 455.1Arlington town 48,219 -9.9 4.76 98.7Athol town 2 10,634 -4.9 1.74 163.6Attleboro city 34,196 3.9 8.75 255.9Auburn town 14,845 -3.3 2.5 168.4
2Barnstable tgwn 30,898 55.7 20.725 531.6Bedford town 13,067 -3.3 0.68 52.4Bellingham town 14,300 2.4 2.24 156.6Belmont town7 26,100 -7.7 3.02 115.7Beverly city 2 37,655 -1.8 13.4 176.6Billerica tewn 36,727 16.0 7.00 190.6Boston city2 562,994 -12.2 135.24 240.2Bourne town 8 13,874 9.8 5.49 395.7Braintree town 36,377 3.7 8.00 105.6Bridgewater town 17,202 45.4 1.49 86.6
Brockton city ,6 95,172 6.9 9.50 99.8Brookline town 2 55,062 -6.5 7.15 129.9Burlington tow4 23,486 6.9 5.80 247.0Cambridge citv 95,322 -5.0 17.67 185.4Canton town ' 18,182 6.3 5.05 277.7Chelmsford t4wn 31,174 -0.8 7.04 225.8Chelsea city 4 25,431 -17.0 3.38 132.9Chicopee citX 55,112 -17.3 10.42 189.1Clinton town 12,771 -4.6 1.93 151.1
Concord town2 16,293 0.9 4.5 276.2Danvers town6 6 24,100 -7.8 3.33 138.2Dartmouth t Tun 23,966 27.5 6.20 258.7Dedham town 25,298 -6.1 5.00 129.8Dennis town6 12,360 91.5 7.3 590.6Dracut town 21,249 16.7 3.18 149.6Duxbury town 2 11,807 54.6 3.01 254.9Easthampton town 15,580 19.7 6.5 417.2

86
Table 4-1, page 2
East Lopgmeadow
town 2 12,905 -1.0 -- --
Easton town 4 16,623 36.7 2.70 162.4Everett city 6 37,195 -12.5 8.47 227.7Fairhaven town 2 15,759 -3.5 2.00 126.9Fall River city 92,574 -4.5 16.00 172.8Falmouth town 2 23,640 48.3 15.1 638.7Fitchburg city 39,580 -8.7 10.55 266.5Foxborough town4 14,148 -0.5 3.00 212.0Framingham town 65,113 1.7 10.94 168.0Franklin town 18,217 2.2 3.53 193.8
Gardner city 17,900 -9.4 1.78 99.4Gloucester city 27,768 -0.6 3.5 126.0Grafton town 2 11,238 -3.6 2.25 200.2Greenfield town 18,436 1.8 3.3 179.0Hanover town 11,358 12.4 3.234 11 284.4Harvard town 2 12,170 -9.4 4.41 362.4Haverhill city 46,865 1.6 8.70 185.6Hingham town 8 20,339 7.9 9.33 458.7Holbrook topn 11,140 -5.4 8.00 105.6
Holden town 13,336 6.1 2.03 152.2
Holliston toyn 12,622 4.6 2.47 195.7Holyoke city 44,678 -10.8 15.749 352.3Hudson town 16,408 2.0 1.87 114.0Ipswich town 11,158 3.8 1.90 170.3Lawrence city 2 4 63,175 -5.6 14.0 221.6Leominster city ' 34,508 4.8 17.40 504.2Lexington town 29,479 -7.5 5.8 196.7
3Longmeadow lown 16,301 4.3Lowell city3 92,418 -1.9 14.6 158.0Ludlow town 18,150 3.2 5.60 308.5
Lynn city 4 78,471 -13.1 14.53 185.2Lynnfield t4wn 11,267 4.1 1.37 121.6Malden city 53,386 -4.9 5.43 101.7Mansfield town 13,453 35.4 4.82 358.3Marblehead town 20,126 -5.5 2.16 107.3Marlborough citY
2'4 30,617 9.6 4.28 139.8Marshfield town 20,916 37.4 4.9 234.3Medfield towc 10,220 4.1 2.88 281.8Medford city4 58,076 -9.8 8.98 154.8
Melrose city 30,055 -9.4 ,2.81 93.5
Methuen town6 36,701 3.5 3.17 86.4
Middleborougq town 16,404 20.6 2.12 129.2Milford town 23,390 20.9 3.00 128.3Millbury to n4 11,808 -1.5 3.15 266.8Milton town ' 25,860 -4.9 2.98 115.2Natick town 4 29,461 -5.1 7.5 254.6Needham town 2 27,901 -6.2 3.58 128.3New Bedford city2 98,478 -3.2 27.5 279.3Newburyport city 15,900 0.6 2.29 144.0

87
Table 4-1, page 3
Newton city 2 83,622 -8.2 11.11 132.9North Adams city 18,063 -5.9 9.25 512.1Northampton city 29,286 -1.3 10.00 341.5North Andover town 20,129 23.6 4.50 223.6North Attleborough
town 21,095 13.0 5.009 237.0Northborough towe 10,568 14.6 2.40 227.1Northbridge town 6 12,246 3.8 4.65 379.7North Reading town 11,455 1.7 1.50 130.9Norton town 12,690 33.8 2.10 165.5
Norwood town 4 29,711 -3.6 4.35 146.4Oxford town 11,680 12.9 2.00 171.2Palmer town 4 11,389 -2.5 2.18 191.4Peabody city 6 45,976 -4.4 6.49 141.2Pembroke town 2 13,487 20.5 1.78 132.0Pittsfield city 51,974 -8.8 14.7 282.8Plymouth torn 35,913 93.0 11.0 306.3Quincy city 84,743 -3.7 11.72 138.3Randolph town 28,218 4.4 8.00 105.6Reading t ow 22,678 0.6 7.7 339.5Revere city 2 42,423 -1.7 4.64 109.4Rockland town 15,695 0.1 2.50 159.3
Salem City 7 38,220 -5.8 13.4 176.6Saugus town 24,746 -1.4 3.78 152.8Scituate town 17,317 2.0 2.54 146.7Seekonk towe 12,269 10.4 3.1 252.7Sharon town 5 13,601 10.0 2.95 216.9Shrewsbury town 22,674 18.1 4.18 184.4
Somerset town2 6 18,813 4.0 4.78 254.1Somerville city 77,372 -12.8 9.80 126.7Southbridge town 2 4 16,665 -2.3 2.90 174.0South Hadley town 16,399 -3.7 3.84 234.2Spencer town 2 10,774 22.7 1.30 120.7Springfield c4ty 152,319 -7.1 65.00 426.7Stoneham town 8 21,424 3.4 3.58 167.1Stoughton town 26,710 13.9 3.57 133.7Sudbury town 14,027 3.9 3.86 275.2Swampscott town 13,837 1.9 1.97 142.4Swansea town 15,461 22.3 2.84 183.7
Taunton city2$6 45,001 2.8 12.5 277.8Tewksbury town6 24,635 8.3 4.6 186.74Wakefield town 24,895 -2.0 2.30 92.4Walpole town4 18,859 3.9 3.6 190.9Waltham city 58,200 -5.5 11.50 197.6Wareham town 18,457 60.6 4.4 238.4Watertown town 34,384 -12.5 4.72 137.3Wayland town 12,170 -9.6 4.10 336.9Webster town 14,480 -2.9 2.50 172.7Wellesley town 27,209 -3.0 5.20 191.1

88
Table 4-1, page 4
Westborough town 13,619 8.1 2.78 204.1Westfield city 36,465 16.0 16.5 452.5Westford torn 13,434 29.6 2.8 208.4Weston town 11,169 2.8 1.15 103.0
Wespot tw12 13,763 40.6 -- __Westport town 1West Springfield
town 0 27,042 -5.0 6.5 240.4Weetwood townl 13,212 3.6 5.00 129.8Weymouth towg 55,601 1.8 11.30 203.2Whitman town 2 4 13,534 3.6 .74 54.7Wilbraham town 2 12,053 0.6 0.85 70.5Wilmington town4 17,471 2.2 4.1 234.7Winchester town 20,701 -7.0 3.73 180.2Winthrop town 19,294 -5.1 2.08 107.8
Woburn city4'62 6 36,626 -2.1 5.55 151.5Worcester city2' 161,799 -8.4 29.00 179.2Yarmouth town 18,449 53.3 7.7 417.4
Source: U.S. Bureau of the Census. 1982. 1980 Census, Table 14.Massachusetts Water Resources Commission, 1982.
2 Places of 10,000 or more only3 Supplies water to other towns.4 Water supply is from Springfield Municipal Water Supply5 Member or client of Metropolftan District Commission Water District6 Also draws from Worcester Water Department7 Also draws on water supplies from other towns or cities
Beverly and Salem have combined water supply; per capita safe yield8 is for both towns combined.
Braintree, Holbrook and Randolph have a combined water supply; per9 capita safe yield is for all three towns combined.
MDC augments supply on as-needed basis10 Westwood and Dedham have combined water supply; per capita safe yield11 is for both towns combined.12 Includes 4.35 mgd from Ford Devens.
Not on central supply

89
framework for assessing the adequacy of Massachusetts' water
infrastructure by asking if that infrastructure furnishes the state with
sufficient clean, safe water at a reasonable cost.
In this part of the report, the question of the infrastructure
with respect to water is separated into the areas of water supply, water
distribution, and cost/funding considerations. Information on meters,
hydrants, standpipes, and storage towers, although part of the water
distribution system, was not provided by most sources, and is therefore
included in this analysis only when available. Questions of water
quality will be discussed below in the section on sewerage infrastruc-
ture.
The question of water supply has long been a statewide problem,
involving hundreds of pieces of legislation authorizing transfers of
water between jurisdictions since the 19th century. However, widespread
awareness that water supply is a common problem has only occurred more
recently. The decentralized nature of the water-distribution system,
with each town and city financing and building its own water
distribution system, has prevented a similar perception of commonality
of need to maintain that infrastructure until recently. It is only
since 1979 that the state has had any program of involvement with local
distribution systems (Massachusetts Legislature, Chapters 805 of the
Acts of 1979 and Chapter 286 of the Acts of 1982, discussed below).
Proposals to remedy potable water problems in the state take seve-
ral forms: increasing supply, improving quality, and reducing losses
from leakage and waste. For problems related to the adequacy and quali-
ty of the state's water supply, a Massachusetts Water Supply Policy
Statement (Wallace, Floyd, Ellenzweig and Moore Inc., 1978) emphasizes

90
the protection and conservation of the water resources of the state.
Others (Massachusetts Special Legislative Commission, 1977) have focused
on improving the water delivery system to reduce water loss through
leakage. If Table 4-2 is at all accurate, most towns have ample
supplies of water. Shortages are therefore most probably due to a
combination of especially dry conditions, poor planning, loss of potable
water during transmission from source to delivery, or excessive
consumption (i.e., waste).
In this section of the report, a summary is provided on the
problems of water supply in the Commonwealth, on some proposals to
remedy water shortages of recent years, and on some of the financial
questions. Issues involving water sources are important to an
assessment of Massachusetts' infrastructure since providing clean and
safe water to the state's citizens involves major financial and
construction efforts and are part of the overall picture with respect to
water. The following section of this report explores the quality of the
water distribution system, the steps being taken to repair the water
distribution infrastructure, and the ways these repair programs have
been funded.
Water Supply
The problem of water supply in Massachusetts stems largely from
the fact that most of the water in the state is found in the hilly
western part of the Commonwealth, far from the population center along
the eastern seaboard. The problem of supplying water to Massachusetts
communities was,in the case of the Metropolitan District Commission,
solved by developing new sources of water, involving construction of
aqueducts and water tunnels that run halfway across the state. But,

91
Table 4-2
Recent Population Trends in Six Water-Supply Systems
City 1980 Population Percent Change, 1970-1980
Boston SMSA 2.8 million -4.7 percentBoston 2.7 million 1.0MDC 1 1.8 millionBrockton, 2 180,000 19.4Fall River 1 126,000 2.0New Bedford2 133,000 -0.3Springfield 448,000 -1.7Worcester 276,000 11.6
Source: U.S. Bureau of the Census. 1982. 1980 Census, Table .14.
2 Urbanized areaMassachusetts portion of urbanized area
31-895 0 - 84 - 8

92
more recently, strong home-rule traditions plus an explicit state policy
that discourages interbasin transfers of water have made it difficult
for communities to share with each other without a legislative mandate
to do so, although communities within a river basin can cooperate with
each other, and such cooperation is encouraged by the state. A mandate
for the water-rich west to share with the water-scarce east created the
Metropolitan District Commission (MDC) in 1889, establishing one of the
largest domestic water supply and distribution systems in the world.
Problems of the MDC water-supply system are related to the
management of the water-distribution system statewide. The
MDC has no statutory authority to mandate conservation or other savings
for its member communities. Its responsibility is only to deliver water
through its aqueducts and transmission lines to the municipal
boundaries, at which- point member communities gain control of their
water supplies.
Existing Facilities and Age
Outside the MDC, the water supply and water distribution systems
are characterized by fragmented, localized administration, with little
statewide planning or management. In 1982 there were 363 central
water-supply systems in 293 of the state's 351 cities and towns. These
central systems were comprised of 68 private water companies, 78 fire
and water districts, and 217 municipal water departments. Another 58
towns draw their entire water supplies from private on-site wells, but
these 58 towns represent only 7 percent of the state's population, with
central water supply systems serving the remaining 93 percent (Massachu-
setts Water Resources Commission, 1982b; see Figure 4-1).

VI~~~~~~~~~~~~~~~~~~~~~~C
BA9INS j- ^L
I. ltoo... 11 Bh-h.tln. Ito NW.oonso2. Iaoousiloog I. Merulmo ltd Weymbooth >ni -3. lt.rfld 13. Cocrad & St ChNrilllp,.rt Y4 W-uttt1d S:ory I.. North Rito.5 1no.too t A..nbho 2S Sooth Co..g.I. Co=.o1ocoi IS. Shoh.. IS. C( Cod
S. .i1-h Is. PNrt* Co.l tMlI Io. *tvsloCh:copes 17. [pwich B.. H .srd BIY 0D 'S t..ynhos f I Sb. Chartt Ml~peDs..I... . n . It.
""T* QWin.b.. '.1 2yl 6. T...... aX~
l sil ffi h Zo10 N..h. lob. C11s.r- 21o 7. T..W ~ ) )Z $ s
tttC WFSCALE
I lk DIVISION .4 WATiE R RESOURCES PoWia Ogram I _
Figure 4-1. Source of Water Supply for Massachusetts Communities, 1982

94
Nearly half (47 percent) of the state's population is served by just
six water-supply systems: the MDC, and the municipal (nonMDC) systems in
Springfield, Worcester, New Bedford, Brockton and Fall River. These six
systems serve a population of 2.7 million people (Massachusetts Water
Resources Commission, 1982b).
Population trends in these areas are as shown in Table 4-1.
Twenty-five communities receive their entire water supply and eight a
partial supply from the MDC water division. The primary source of water
for the 45 MDC-supplied communities is the Quabbin reservoir, an
artificial lake with a capacity of 412 billion gallons (MDC, 1981) 65
miles west of Boston on the former site of four towns. This reservoir,
developed between 1927 and 1946 in the Swift River Valley in the
Berkshires to supply metropolitan Boston with water until the 1980s,
provides high quality water that does not require treatment before use.
Developing that water supply involved the displacement of 2,500 persons,
the razing of 650 homes, elimination from the map of the Commonwealth
the four towns of Dana, Enfield, Greenwich, and Prescott, and the
relocation of 7,561 bodies previously buried in 34 cemetaries in the
valley (Massachusetts Senate, Committee on Ways and Means, 1982a).
The rest of the MDC water supply comes from the Wachusett
watershed and the runoff of the Ware River watershed during certain
periods. The total storage capacity on these watersheds is 488 billion
gallons (MDC, 1981).
This water supply is delivered to Metropolitan Boston through 131
miles of aqueducts and tunnels and distributed by gravity through
approximately 260 miles of pipelines (MDC, 1981).

95
In addition, the MDC Water Division controls six storage
reservoirs with 467 square miles of tributary watersheds, a water
surface of 30,000 acres, four hydro-electric power stations, 16 miles of
high-tension power transmission lines, distribution pumping stations
(number unspecified) to high service elevations, and 16 distribution
reservoirs with a capacity of 3.1 billion gallons (MDC, 1981;
Massachusetts Senate, Committee on Ways and Means, 1982a).
Current Conditions
How much water is currently available to the six major urban
water-supply systems (MDC, Brockton, Fall River, New Bedford, Springfield,
and Worcester)? Is there enough water to supply a safe yield? Table 4-2
shows that most communities of 10,000 or more had ample water supplies as
of the end of 1982, if the minimum per capita safe yield is set at 100
gallons per capita per day (Tabors, 1979). However, Figure 4-2 shows that
many towns face shortages by the year 1990. Planning analysis is underway
in the Executive Office of Environmental Affairs to help communities plan
how to meet those shortages. Detailed plans to augment the water supplies
of the municipalities that need them are found in Massachusetts Water
Resources Commission 1982a.
By the end of 1980 the level of water in the Quabbin Reservoir
was down to 85.3 percent of capacity although Metropolitan Water
District members had reduced their demand by 8.7 million gallons per day
(mgd). The average daily demand on the system between 1972 and 1980 was
315 mgd, even though the estimated safe yield of Quabbin is 300 mgd.
The drought of 1961-1964 had reduced Quabbin to 45 percent of capacity,
and water-supply managers project that, based on current consumption, a
comparable drought today would cause a drop in the water level to 31
percent of capacity (Massachusetts Senate, Committee on Ways and Means,

P kIL INI tt £990 OAThS fot ?L o sttstioot
[2 J S-,, £ tatr acappiy *yate_ projected to hoc. a deicit In 19W0nd .4.1cM aroy tea tha 2Sf of the t o 'e 5cop oieiio o.
76 [ J C cciti:: proj0ctd to cr _ a deicit in 990 eod d hict rotcst a g n cid o. d .op ing tita aoo ccte(a
iceao r it a projected to h.t- a defict In 1990 cod etib arcin the procoan of atodying pos.ib. M o rcon of erraetto .
44 tH O11
Ig bd ill > ~~~~~~~~~lossi WaS.r sppl y osros.
14 ccuieoetn t
River BasinDIVISION ol WATER RESOURCES Planning Program
12182
to
Figure 4-2. Projected 1990 Water Supply Status forMassachusetts Communities--PreliminaryAssessment
97
1982a).
Beginning in December, 1979 and extending through late 1981,
Massachusetts experienced a two-year dry spell that dramatized the water
supply problems of many towns and cities across the state. At the
height of the drought in November 1981, 42 communities were operating
under state-declared water emergencies, and an additional 19 communities
were under voluntary water-use restrictions. In April 1982, 24
communities were under state-declared emergency water bans, and 11
others had imposed voluntary water bans, with another 21 communities
listed by the state's Department of Environmental Quality Engineering as
facing potential water shortages during drought conditions
(Massachusetts Senate, Committee on Ways and Means, 1982a).
The water shortage of the late 1970s and early 1980s caused the
MDC to stop accepting into the Metropolitan Water District new members
outside of a statutorily-mandated 10-mile radius of the Massachusetts
State House until an additional water supply is obtained. Four
metropolitan Boston communities have been affected by this moratorium on
new members-- Bedford, North Reading, Stoughton, and a section of
Lynnfield (MDC, 1981).
In addition, several towns have had severe water-supply problems
recently, either through under-supply or loss due to contamination. For
example, the affluent town of Weston lost its local water supply due to
salt contamination from road salting along Route 128 (Interstate 95),
which runs through the town, and became a partial member of the MDC
water system (Massachusetts Senate, Committee on Ways and Means, 1982a).
Provincetown on Cape Cod lost access to most of its groundwater
supply because of a leak from an underground gasoline storage tank next

98
to the aquifer, and since 1978 has relied on emergency water supplies
pumped through above-ground pipes from the Cape Cod National Seashore
and from the North Truro Air Force Station (Massachusetts Senate,
Committee on Ways and Means, 1982a).
In September 1980, the University of Massachusetts in Amherst
sent its students home because the town's water supply was inadequate to
supply the university. Although the population of Amherst had increased
during the 1970s as the University grew, no new source of water had been
developed since 1970, and water conservation efforts had only produced a
two percent decrease in water consumption in 1979 (Massachusetts Senate,
Committee on Ways and Means, 1982a, pp. 6-84).
Needs
All of the above are examples of the consequences of unplanned
water management and local inability to solve local water-supply
problems. As the Senate Ways and Means FY83 budget report states, "the
need for effective regional water management is clear" (Massachusetts
Senate, Committee on Ways and Means, 1982a, p. 6-85).
Although the recent drought is now over, the problems that so
many Massachusetts communities face in times of lower than average
rainfall have not been solved, and they will not be solved until
coordinated planning and management of water supply resources are the
rule rather than the exception.
The MDC water supply needs augmentation. That system is
exceeding the daily safe yield of 300 million gallons per day (mgd) from
Quabbin Reservoir by about 20 mgd (MDC, 1981; Massachusetts Senate,
Committee on Ways and Means, 1982a). The "safe yield" is a technical
concept that defines the appropriate level by which a body of water can

99
be drawn down and still be replenished by rainfall under normal
circumstances. The 20 mgd shortfall, with recorded peak consumption as
high as 479 mgd, means that the MDC must expand its sources of supply
and/or reduce water usage in that system or, as has been suggested, plug
up the leaks in the system. Although some officials estimate that up to
20 mgd could be saved if all the leaks in the member communities' water
distribution systems were repaired, that 20 mgd would solve just the
immediate shortfall problem but would not enable the MDC to serve future
growth needs or allow connections to the MDC system by localities that
have lost or are losing their own water supplies. Because the 2 million
residents in the MDC water district consume 320 million gallons of water
each day and the Quabbin/Wachusett reservoir system only provides a safe
yield of 300 mgd, new sources of water are being sought for the MDC
water system (Massachusetts Senate, Committee on Ways and Means, 1982a).
Plans
Some legislators believe that a regional approach to supplying
localities with their water would provide advantages to both water-rich
and water-poor communities, with a goal of developing and managing water
resources efficiently and cost-effectively (Massachusetts Senate,
Committee on Ways and Means, 1982a). Poor local planning exacerbated by
inadequate water supply and drought have combined to cause many of the
recent water shortages in the Commonwealth; therefore, an obvious
prescription is better planning and management. However, legislation to
establish a regional district to coordinate water supply in the
chronically water-short southeastern part of the state, under discussion
by the Massachusetts Senate, Committee on Ways and Means Committee
(1982a), was never drafted or submitted, and is not under active

100
consideration by the state legislature.
The MDC has commissioned an environmental impact report to study
various options to increase the physical supply of water available to
MDC communities, the largest single supplier of water in the state.
Although it is state policy (adopted separately by the Executive Office
of Environmental Affairs and the General Court) that the transfer of
water from one basin to another is to be utilized only as a last resort,
the staff at the MDC are looking into several approaches to augmenting
its water supplies, some of which would involve diversions of water from
areas west of the Metropolitan Boston area into the MDC pipelines.
These diversions would be considered only after other measures to
increase water supplies are undertaken, if feasible (Massachusetts
Senate, Committee on Ways and Means, 1982a).
A long-range water-supply study to meet needs until the year 2020
was commissioned by the MDC and is expected to be completed in 1984
(Massachusetts Senate, Committee on Ways and Means, 1982a). The staff
conducting this study will assess eight alternatives that have been
proposed as solutions to the MDC water-supply needs and will evaluate
and report on the probable environmental impacts of the various
proposals (Massachusetts Senate, Committee on Ways and Means, 1982a:
Elizabeth Kline, Executive Office of Environmental Affairs, personal
communication). The eight alternative projects are:
1. Development of the Upper Sudbury River watershed2. Merrimack River flood skimming
3. Connecticut River tributaries flood skimming (Millers river)
4. Development of groundwater and surface water in MDC member
communities5. Water conservation, including repairs to distribution systems
6. Quabbin watershed management7. Connecticut River flood skimming8. No action

101
In addition to assessing the environmental, engineering, social,
economic, and water-yield costs and benefits of the various
alternatives, the study will contain a forecast MDC water needs over the
40-year period and will include potential demands on the system by new
communities. The study area includes 300 Massachusetts cities and towns
as well as future needs of New Hampshire and Connecticut in relation to
the Connecticut and Merrimack River alternatives.
In the interim, the MDC is pilot-testing ways to restore a
previously utilized water supply from the Sudbury river system, and is
testing ways to make that water meet modern quality standards.
Reactivating the Sudbury Reservior can provide up to 20 mgd, and is seen
as an interim solution to the present safe-yield deficit. The
long-range study will assess using up to 25 mgd more water from the
entire Sudbury system (Massachusetts Senate, Committee on Ways and
Means, 1982a).
Water Distribution
The system developed over the years to transmit water from its
source to the individual household or business will now be examined.
The state has recently provided the towns and cities, both inside and
outside of the MDC, with a way to begin to repair their
water-distribution systems. In the previous section on water supply, it
was shown that the water-shortage problems of recent years is partly
attributable to a prolonged period of low rainfall. But, some officials
attribute part of the water shortage to losses of high-quality water
supplies through leaks and breaks in the pipes and aqueducts of the
water distribution system (Massachusetts Special Legislative Commission,
1977).

102
The problems of old water pipes have been cited as the "single
greatest need" of older cities and towns (Massachusetts Special
Legislative Commission, 1979, pp. 18), and the cost of repairing or
replacing water supply and distribution systems was recognized as one of
the major reasons for a recent shift in attitude within the state from a
perception of water as an abundant resource to a perception of scarcity
(Massachusetts Special Legislative Commission, 1979). There has been no
parallel commitment to an assessment on a statewide basis of the
condition of water-distribution systems across the state.
Existing Facilities and Age
A special legislative commission established in 1977 pointed out
that:
antiquated pipes in the older municipalities are responsiblefor major losses of potable water which . . . straininadequate supplies [and mean] loss of pressure for adequatefire protection and degradation of water quality (p. 12) . .. the single greatest need of the oldest cities and towns inthe Commonwealth is for financial assistance for therehabilitation of their water distribution infrastructure.. . In order to maintain the economic viability of theircommunities and to compete with more recently developedareas, officials in the state's older communities and urbancenters realize that their distribution systems must berenovated (Massachusetts Special Legislative Commission,1979, p. 51).
Despite this purported widespread understanding, there is now no
way for town and city managers to obtain data on the condition of their
water distribution infrastructure to use for planning purposes. All
information used in this report was pieced together from a variety of
sources, and for most communities it is simply not available.
As one of the oldest states in the union, it is not surprising
that Massachusetts has municipal water-distribution systems that are
among the oldest in the country. Boston has America's first piped water

103
system, begun in 1652. This system delivered water from springs and
wells to a location near the present-day Quincy Market; water was
stored in wooden tanks from which citizens filled buckets. In the late
18th century, Boston developed one of the nation's earliest municipal
water systems, and pipes laid in 1853 are still in use (Comptroller
General, 1980).
Other Massachusetts cities also have some very old water mains;
Table 4-3 shows some of the ages. The oldest mains in Worcester were
laid in 1832; in Brookline, in 1874; in Chelsea, 1868; in New Bedford,
1869; in Fitchburg, 1872. Although most of these mains are made of cast
or ductile iron, which generally provide long-lived satisfactory service
(a cast iron main laid in Versailles, France in 1664 is still in use,
according to Comptroller General, 1980), these materials are prone to a
kind of internal corrosion called -tuberculation.-
Current Conditions
The Southeastern Regional Planning and Economic Development
District (SRPEDD) reports that water pipes in Fall River are "badly
deteriorating,' in fact they are "deteriorating faster than upkeep,"
(response to Massachusetts Infrastructure Study questionnaire) although
upgrading is underway through cement lining. More repair of the old
lines is needed, and some will be funded through the Community
Development Block Grant program. However, the planner reports
1 Tuberculation both reduces the effective flow of water throughthe pipes by reducing the available diameter, and provideslodging places for bacteria and other undesirable elements tobreed. Tuberculation can be corrected by in-place cleaning andlining with a thin layer of cement mortar, a process that costsabout half the replacement cost (GAO, 1980).

104
Table 4-3
Number of Miles of Water Mains in Selected Towns,Age of Oldest Mains,
And Percentage of System Metered, 1979
Miles of Age of Percent
Town Population Water Mains Oldest Mains Metered
Arlington na 127 na na
Boston 641,000 1,080 1853 100
Brookline 56,000 135 1874 100Chelsea 25,070 62 1868 100
Fitchburg 40,000 181 1872 100
Gloucester1 28,000 120 1885 60
Lowell 90,000 260 1868 100Lynn 80,000 125 1880-1920 82
Malden 54,200 115 1880s 100New Bedford 148,600 277 1869 98
Newburyport 17,000 74 1889 100
Newton 85,200 305 1880s 100Peabody 47,000 160 1900s 98
Somerville 80,000 116 1864 100
Worcester 172,500 963 1832 100
Source: John A. Bewick, SpecialEnvironmental Affairs, 1979
survey, Executive Office of
1 Population figure is for permanent, i.e. winter, population.

105
that although a treatment plant is needed on South Watuppa Pond to
provide more water supply, no local money is available to fund that
plant (questionnaire reponse, MIS survey).
Good information was provided by the Old Colony Planning Council
(OCPC) serving the Brockton region. This regional planning council
estimated that of the thirteen communities in their region, the
condition of pipe in municipal water distribution systems, many of which
date back to the late 1800s, was as follows (OCPC, 1983):
poor 4 communities
fair I community
good 7 communities
very good I community
Of the 1,242 total miles of water pipe in the 13 communities of
the OCPC region, pipe types were as shown in Table 4-4. Although some
towns in the OCPC region have problems with tuberculation and
sedimentation in their older mains, the primary problem for most
communities was low flow rate due to undersized mains. The OCPC
estimates that an average of 26 percent of the water pipes in the OCPC
region needs to be replaced, with community estimates ranging from I
percent to 30, 40, 50 and even 60 percent replacement (OCPC, 1983).
The Northern Middlesex Regional Planning Council estimates that
the total mileage of water pipes in towns and cities with central water
supplies is quite close to the road mileage of those communities. In
the city of Lowell, there were 260 miles of pipe and in 1979 the City
allocated $1.2 million to the water department (Northern Middlesex

106
Table 4-4
Water Distribution in the Old Colony Planning Council Region
Number of Chronology ofCommunities Installation
Kind of Pipe Number of Miles Reporting
small diameter,unlined, castiron 508 9 pre-1940
asbestos/cement 249 8 1940-1970(A/C)
Cement-lined A/C,ductile, PVC,transite,galvanized pipes 138.5 unknown 1970-present
Source: OCPC, 1983.

107
Regional Planning Council, response to Massachusetts Infrastructure
Study questionnaire).
Maintenance Plans
The meters used to measure water consumption by both individual
households and municipalities receiving water from the MDC system are
old, and many have not been functioning correctly. The MDC staff is
converting their revenue meters from manual to computer-controlled
meters. Manual revenue meters, currently read by a person who descends
into the tunnels and manually records the readings, are being converted
to computerized meters, which can be read from a central console at MDC
headquarters and should be on-line in one year (MDC Planning Director
Interview, March 1983). This will greatly improve the efficiency of the
system.
Water pricing is also an issue. In the past, many water systems
operated on the principle that the largest users paid the lowest
per-unit costs, a practice that encouraged waste. Gradually, water
systems across the state are converting to a pricing system that charges
an equal per-unit cost to small and large water users, a policy that
will both encourage conservation of water and produce higher revenues
for local water departments. These higher revenues can, in turn,
finance some of the needed maintenance and construction in the
localities. Local revenues are needed because both the state and
federal grant programs require matching funds from municipalities.
A Special Legislative Commission set up to study problems in the
water-distribution infrastructure system said in 1979 that
"Massachusetts cannot afford to wait any longer, and must begin to
address this serious problem [of deteriorating water pipes] by
31-895 0 - 84 - 9

108
initiating its own rehabilitation program" (Mass. Special Legislative
Commission, 1979, p. 12). The next year, Chapter 805 of the Acts of
1979 (Mass. Acts 805, 1979) was passed, providing $10 million for this
purpose; in 1982, Chapter 286 (Mass. Acts 286, 1982) allocated another
$60 million for Leak Detection and System Rehabilitation of water
distribution systems in the state. These programs were funded through
bonds issued by the Commonwealth of Massachusetts.
Grants under Chapter 805 were first awarded in March of 1982, and
in the 1982 legislative session, the General Court of the Commonwealth
of Massachusetts passed one of the most comprehensive and innovative
pieces of water legislation enacted in the country. Having given up on
obtaining funding from the federal government, the state decided to take
action on its own.
Chapter 286 provided a total of $357.5 million for a set of
programs, which, in addition to the leak detection and system
rehabilitation programs, provide for water-filtration plants, aquifer
cleanup from chemical contamination, groundwater site acquisition for
water-supply protection, and public-building retrofitting for water
conservation. One purpose of this act, according to a legislative
summary, is to provide local aid to cities and towns to help them, in
light of Proposition 2 1/2 restrictions, realize the savings possible
with good water management. This aid is in the form of matching grants
available only to communities that have completed, or are in the process
of completing, a comprehensive water-resource management plan.
Since March of 1982, a total of 117 towns and cities have been
awarded leak detection grants under this program, and 23 received leak
detection grants twice. Of the 293 municipalities with central water

109
systems, 117, or just under 40 percent, have applied for funds to detect
leaks in the water distribution system (see Figure 4-3).
Under these grants, water department personnel in the communities
search out, with sensitive acoustical devices, places where water is
leaking either through breaks in pipes or through defective joints.
When the sound of running water reveals a source of leakage, the town
then can apply for the next segment of the program, system
rehabilitation. Table 4-5 summarizes the awards already made under this
program.
Maintenance Costs
What would it cost to rehabilitate existing water pipes? In
1979, Boston estimated that the average costs of cleaning and lining
pipes was $56 a foot, compared to $122 a foot to replace (Executive
Office of Environmental Affairs, 1979 survey). In the same year, the
town of Newburyport estimated that rehabilitation of their water system
would cost $70 per foot (Executive Office of Environmental Affairs, 1979
survey). The estimates of other towns and cities are shown in Table
4-6. Because no estimate was available of the number of feet of pipe in
need of rehabilitation across the state, the cost of system
rehabilitation could not be determined.
The system rehabilitation portion of the Chapter 286 (see Table
4-7) accounts for 95 percent of the expenditures in this category (leak
detection is held to only 5 percent of the total grant amount). Since
March 1982, a total of $24.5 million have been awarded to 129
communities (Massachusetts Department of Environmental Quality
Engineering, Memorandum, January 1983b).

0
KEY
CII. 000 Awl'--t
CH. 40 Aw0l-*n
Bloh CH. 005, .dCH. 420 ApoIein2
l t -i. i23 '2 I I IS 43 .2 f .i
C"'&§^kD.X "Fill B LZ P IN- .11Lg n .g"915 1
T,23 203 203I 421.0 i2 (40 0.0 (230)
"...... . ... (h A..h.. f .t i .. n h i.
5 EI ^t § ~~~~ ~ ~~~~~~~~ ~~~SCALf '
DIVISION ad WATER REaSOURCES pMiming Pa _
Figure 4-3. Communities Applying for 405 and 805 LocalAssistance Grant Programs

111
Table 4-5
Summary of Leak Detection Grants Awarded, through 1983
Date Awarded Number of grants Total awarded
Phase IChapter 805 March 1982 39 $500,000
Phase IIChapter 286 September 1982 40 $500,000
Phase IIIChapter 286 February 1983 61 $1.03 million
Source: Leak Detection Grants (Summary Sheet), Department ofEnvironmental Quality Engineering, Division of Water Supply, 1/15/83;Press Release, February 24, 1983, from the Secretary of EnvironmentalAffairs.

112
Table 4-6
Estimated Cost of Rehabilitation and Replacement,and Method of Water Department Financing, 1979
Replacement RehabilitationCost Cost Method of
Town (millions) (millions) Financing
Arlington na naBoston $300 $100 self supportingBrookline 100 27 subsidizedChelsea 2.5 2.5 subsidizedFitchburg 96 38 subsidizedGloucester 50 20 subsidizedLowell 20 8 self supportingLynn 75-100 61 subsidizedMalden 70 8 self supportingNew Bedford na 32 subsidizedNewburyport 15-20 10 self supportingNewton 48 26 subsidizedPeabody 30 5 subsidizedSomerville na $30,000/yr2 independent
Worcester 168 60 subsidized
Source: John A. Bewick, Special survey, Executive Office ofEnvironmental Affairs, 1979
2
"Self-supporting' means that revenue is generated by user fees;"subsidized" indicates that funds are received from the generaltreasury of the community, and revenues are intermingled in thatsame treasury.
This is an estimate for the cost of rehabilitating only the watermeters in Somerville.
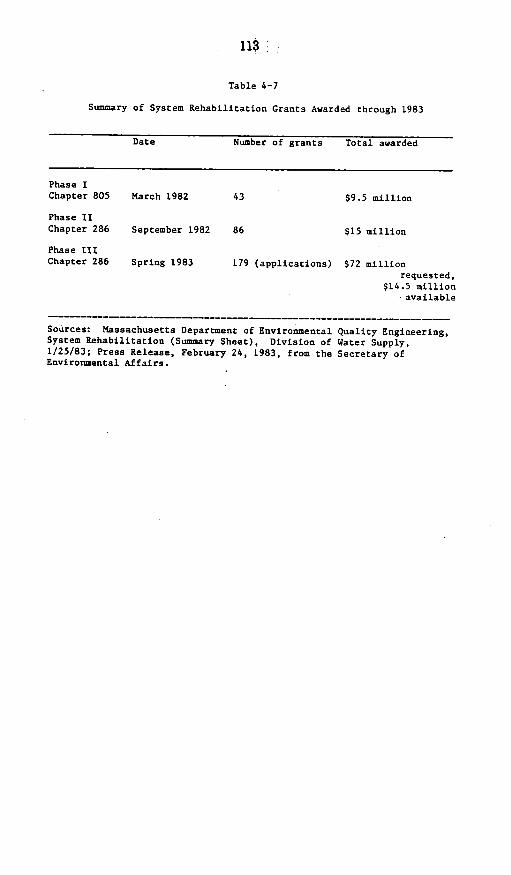
113
Table 4-7
Summary of System Rehabilitation Grants Awarded through 1983
Date Number of grants Total awarded
Phase IChapter 805 March 1982 43 $9.5 million
Phase IIChapter 286 September 1982 86 $15 million
Phase IIIChapter 286 Spring 1983 179 (applications) $72 million
requested,$14.5 million
available
___~~~~~ - - - -- -- - -- - - - - - - - - - -________ _________
Quality Engineering,Water Supply,Secretary of
Sources: Massachusetts Department of EnvironmentalSystem Rehabilitation (Summary Sheet), Division of1/25/83; Press Release, February 24, 1983, from theEnvironmental Affairs.

114
This spring the state will award another $14.5 million dollars to
communities around the state for system rehabilitation grants to remedy
health problems in community water systems associated with water quality
or with safety problems associated with loss of water pressure for
fighting fires. Over the past several years, 204 water districts have
applied for system rehabilitation grants, and of these, 101 have applied
more than once (Massachusetts Department of Environmental Engineering,
Memorandum, January 1983b).
The state has received requests for a total of $72 million, even
though only $14.5 million is available from the Department of Environmen-
tal Quality Engineering for these purposes (Massachusetts Department of
Environmental Engineering, Memorandum, January 1983a). This indicates
that the need is substantially larger than the ability of the state to
fund these grants, even on a matching basis. The $72 million is for
only half the amount of the rehabilitation necessary, since the state
grant is a 50 percent matching grant. The actual construction need is,
consequently, $144 million, of which only $29 million, or 20 percent,
will be funded this year (Massachusetts Department of Environmental
Engineering, Memorandum, January 1983a; interview, Elizabeth Kline,
Executive Office of Environmental Affairs, February 1983).
In Fiscal 1981, the last year for which data are available, the
MDC Water Division awarded ten contracts for construction work,
maintenance and repairs on its system, for a total of $2,583,890 (MDC,
1981). The MDC Water Division has begun to replace sections of corroded
steel pipelines and to reline the Weston Aqueduct. A $1.3 million
pipeline across Spot Pond Reservoir was completed in 1981, connecting
the Spot Pond Pumping Station with a 48-inch pipeline to Woburn. Design

115
began to extend this pipeline to Route 128 and to the Wakefield town
line, and construction started on a $3.8 million pipeline to improve
water pressure in the Lynn area (MDC, 1981).
As part of its ongoing maintenance program, in 1981 the MDC
repaired and rebuilt two generators at the Cosgrove Power Plant in
Clinton, erected a metal picket fence at the Waste Channel at Wachusett
Dam in Clinton, installed an altitude valve at Turkey Hill Reservoir in
Arlington, relined sections of the Weston Aqueduct, and installed a
slate-covered, wood-structured frame roof on the Old Stone Church in
West Boylston (MDC, 1981).
Construction Plans
Apart from the next allocation of Chapter 286 funding in the
Spring of 1983 for system rehabilitation, project staff could not
ascertain state plans for the water-distribution system. The
Massachusetts Department of Environmental Quality Engineering may engage
a consultant to assess the quality of the local water distribution
systems in the state's cities and towns, but no decision has been made
and no contract has been awarded. Because it was very difficult, and
impossible in some cases, to obtain information on the number of miles
of water and sewer lines in the communities, such an assessment would be
worthwhile. The quality of the local water mains and of local sewage
collection systems is also, for the most part, unknown, and merits
further study.
There is no information available on the number of communities
without a water-distribution infrastructure that need one. This would
be difficult to predict, because the need for infrastructure is dictated
either by economic or population growth, or because an existing supply

116
has been contaminated and new lines must be laid to provide water from
another area.
Massachusetts will need between $1 and $2 billion over the next
decade to maintain and rehabilitate the water-supply distribution system
(Business Week, October 1981). An illustration of the problem comes
from the 1980 Annual Report of the town of Dunstable, in the Northern
Middlesex Regional Planning Council area:
It was another year of frustration in the Water Board'sstruggle to keep the [water distribution] system in operation.The well and system maintenance expenses reflect the majorproblems. Limited funds allow only the minimum correctiveaction at today's costs (Robert W. Flynn, 1983).
SUMMARY
The current and expected revenues and expenditures on water-supply
infrastructure are presented in Table 4-9. Because local government data
were not readily available, it was not possible to determine the potential
gap between expected revenues and needs. If no revenues were forthcoming
from either the federal or local levels, the shortfall may be as great
as $844 million. A more detailed discussion of these estimates is provided
in Part 6.

117
Table 4-9
SUMMARY OF CAPITAL INVESTMENT NEEDSAND REVENUES IN MASSACHUSETTS
(millions of 1982 dollars)
Water Supply
Needs for Selected Periods
Period 1983-1990
Total Need $520a'b
Average Annual Need $65
Need to Year 2000 $1,150
Average Annual Expenditures $17
Total Expected Revenue to Year 2000P
Total $306
Federal
State $306
Local n.a.
Expected Revenue Minus Expected Need to Year 2000 n.a.
SOURCE: Refer to Table 6-1.
aCalculation based on maintenance of safe yield and guarantee of 150to 200 gallons/capita/day. (The EPA standard is 100 gpd; overestimate accounts for distribution within state and for annualvariations.) The present system's yield of 215 gpd is for 87 percentof population. If 90 percent of population (6.7 million) served in2000, then require a maximum of 131 MGD safe yield additional supply.Supply estimates are $2 million/MGD or $260 million.
bIncludes estimated $357.5 million over 10 years for water-supplyimprovements under Chapter 286.
Part 5
ENVIRONMENTAL INFRASTRUCTURE--SEWERAGE SYSTEM
Just as in the case of the infrastructure for water, the sewerage
system infrastructure can be analyzed in two parts, one a system for
collection of sewage from sources, and another a system for treatment of
that sewage with the goal of reducing or eliminating sewage as a source
of water pollution. As in the previous section on water, analysis of
the infrastructure for sewerage will proceed in two parts. First, exis-
ting water-pollution control/sewage-treatment facilities in the state
will be discussed, and the needs of this system as projected by the
state's Division of Water Pollution Control will be presented. Next,
the little information availrable about the sewerage system will be
presented, and the need for more data collection will be reviewed.
The sewage-treatment portion of the infrastructure is fairly well
documented both in terms of existing facilities and projected needs, but
the locally funded and administered sewage-collection systems in the
cities and towns (outside the MDC system) are almost completely
undocumented and unstudied, except for those municipalities that have
applied for construction grants for pollution control.
Although the needs of local systems have been studied, there is
no one source for answering the question of how many miles of sewer
exist in each municipality, and what condition they are in. Some of the
information could be analyzed if the 201 facilities' plans were obtained,
but there was insufficient time to conduct this analysis for the present
report. The state only has responsibility for administering grants to
municipalities and sewer districts to defray the capital costs of con-
struction of wastewater treatment plants, interceptor sewers, and pump-
(118)

119
ing stations. Local connections between interceptors and homes or
commercial buildings are under the planning and financial jurisdiction
of the cities and towns, and their condition is not routinely monitored
(Interview with Paul Taurasi, Department of Environmental Quality
Engineering, March 1983).
Sewage Treatment
Water-pollution abatement in all municipalities is the
responsibility of the state's Division of Water Pollution Control in the
Department of Environmental Quality Engineering (DEQE). This office
administers all grants to municipalities and sewer districts for water
pollution control.
According to the Chief Engineer of the Construction Grants
Program at the DEQE, the biggest problem of the sewerage infrastructure
is not its pipes, but funding the multitude of new facilities needed for
water-pollution control (interview, March 1, 1983). Over the past ten
years, according to this source, about $1.5 billion has been spent on
water-pollution cleanup, building or renovating 40 to 50 wastewater
treatment plants. This massive cleanup program has resulted in a
significant improvement in the quality of many of the Commonwealth's
bodies of water. In 1970, just 16 percent of the state's rivers,
streams, and lakes were swimmable or fishable, but by 1983 fully half
were suitable for these recreational uses. Particular improvements were
noted in the Merrimack and Connecticut rivers.
For example, in the Northern Middlesex Regional Planning Council
area, which includes the city of Lowell that was a major contributor to
pollution of the Merrimack River,

120
the communities . . . have recently been coming to terms with
the issues of municipal sewage collection and treatment.
Until the 1970s, only the city of Lowell had a municipal
sewerage system, with all of the suburban communities relying
on septic tanks and cesspools. Even within the City,
however, the collected sewage was discharged directly into
the local waterways without any sort of treatment. There are
now three plants operating within the region, covering parts
of six of our nine communities (Robert W. Flynn, 1983).
These construction programs were financed largely by the U.S.
Environmental Protection Agency (EPA), which provided 75 percent
matching grants to fund construction of these projects. The state put
up 15 percent of the funding, and the municipalities contributed 10
percent of the cost.
Existing Facilities and Age
All of the wastewater treatment facilities in the state as of
1980 are published in Massachusetts Division of Water Pollution Control
(1980). This listing shows that the oldest operating wastewater
treatment facility in the state was built in 1929 on Nantucket Island.
A few facilities still in use were built during the 1940s, such as the
one in Falmouth on Cape Cod, one was built in 1959 in Milford, and one
in Millis in 1967, but most facilities were built during the 1970s. The
two major sewage treatment plans in the state, the Deer Island and Nut
Island facilities, serving the MDC sewerage district, were built in 1967
and 1952 respectively. See Table 4-8 for the ages of some treatment
plants in the SRPEDD region.
Current Conditions
The major issue in sewage treatment in Massachusetts today is the
clean-up of Boston Harbor. During 1981 the MDC Sewerage Division began
several projects aimed at cleaning up the Harbor and the neighboring
waters of the Charles, Mystic, and Neponset Rivers. However, action by
the MDC alone cannot completely solve the problem because combined

121
Table 5-1
SRPEDD District Sewage Treatment Facilities
YearTreatmentPlant Annual 0/M
Community Built Capacity Self-rating Expenditures
Attleboro 1980 Excellent $500,0001North Attleboro/Plainville 1980 Excellent $300,000Fairhaven 1971 na naFall River 19822 31 mgd ExcellentMarion 1973 .67 mgd na naMiddleborough 1975 goodNew Bedford 19743 goodTaunton 1978 5 mgd excellent
Source: MIS survey questionnaires
1 100% increase in annual maintenance expenditures in year new plantbrought on line.
2 Sewer lagoons
Primary treatment only; secondary treatment needed, especially whenconsidering needs to year 2000. Also needs to separate CSO systems.Expected costs of these needs: $100 million or more. Expectrevenues to come from user charges.

122
sewage overflows from cities and towns all along the shoreline
contribute tremendous volumes of pollutants to the harbor's waters
(Elizabeth Kline, Executive Office of Environmental Affairs, personal
communication).
The multi-million dollar program undertaken by the MDC is the
outgrowth of recommendations made in a study completed in 1976 (Eastern
Massachusetts Metropolitan Area, or EMMA, study). The principle
recommendations of the EMMA study that are now being pursued are the
upgrading of the Deer Island and Nut Island sewage-treatment plants; the
elimination of sludge discharge into the harbor waters; an area-wide
combined sewer-overflow abatement program; and extensions, repairs, and
improvements to the MDC sewerage system. Many of the ongoing projects
are financed in part by federal and state funds, under the Federal Water
Pollution Control Act Amendments of 1972 (U.S. Congress, PL 92-500),
enforced by the EPA.
The Charles River Marginal Conduit Project began in 1976 and was
completed in 1981. This facility is designed to treat combined sewage
flow from storms, and discharges the flow into Boston Harbor below the
Charles River Dam. Two other combined sewer-overflow treatment
facilities in the Charles River, in Cambridge and in Somerville, have
helped to reduce the amount of solids and harmful bacteria discharged
into the basin, and will make an appreciable difference in the upgrading
of the Boston Harbor waters (MDC, 1981).
Other facilities (Relief of the Millbrook Valley Sewer and Relief
of the Framingham Extension Sewer) are underway to rehabilitate or
replace interceptor sewers and pumping stations in the Metropolitan
Sewerage District (MDC, 1981).

123
Maintenance Costs
The Northern Middlesex Regional Planning Council provided the
following current annual maintenance expenditures for four of their six
treatment facilities:
AnnualMaintenance
Community Expenditures Capacity
Billerica $ 434,000 1.6 mgdDracut 157,000 naLowell 2,300,000 32 mgdPepperell 113,000 0.7 mgd
No estimates could be obtained on the maintenance cost of other
water-pollution abatement facilities.
Construction Costs
Over the past ten years, $1.5 billion has been spent in the state
to improve the sewage-treatment system. Of this cost, 75 percent has
come from the U.S. Environmental Protection Agency (EPA) and 15 percent
from the state. The state funded its portion from two bond issues, one
for $150 million issued in 1969 and one for $250 million issued in 1970,
for a total of $400 million to date. This money is nearly exhausted,
but the recent passage of Chapter 286 of the Acts of 1982 authorized an
additional $358 million bond issue, of which $250 million is earmarked
for water-pollution control (DEQE, Memorandum, January 1983a).
Construction Needs
The DEQE has prepared a prioritized list of projects (see Exhibit
4-1) that are eligible for matching funds from the EPA for the purposes
of water-pollution control. This list, which totals $1.6 billion of new
projects over the next 4 to 5 years (according to the Chief Engineer of
the Construction Grants Program at the DEQE), includes 208 projects in
localities from Boston to Pittsfield, and Lowell to Nantucket.
31-895 0 - 84 - 10

124
The clean-up of Boston Harbor is a major need in the state.
According to the DEQE, "Boston Harbor may well be the state's single
most important resource and involves a broad spectrum of activities from
commercial shipping to shellfishing" (Massachusetts DEQE, Memorandum:
Boston Harbor Cleanup, February, 1983). It is estimated that cleaning
up the harbor can double the present annual yield of 20,000 bushels of
clams, increase the use of beaches along the shore, and increase both
the recreational and development value of both the waterfront and the
harbor islands.

125
Exhibit 5-1
COMMONWEALTH OF MASSACHUSETTSDEPARTMENT OF ENVIRONMENTAL QUAUTY ENGINEERING
DIVISION OF WATER POLLUTION CONTROLONE WINTER STREET. BOSTON. MASSACHUSETTS
Porsotn to Sertior 106 of to. Feceiea INSIST Polltion Contral At of 1972. ddamerrc.ec NOTICE is IIeOy 901Ni that* Puaie=Huna bet tc IMtHo F. Mat9Olenus-nts 3.eturmem of E--ormosnodto Ty t DY tngtomng.Doon of W80e, POlltuonCoqtrol. on T-sd00y. A.o"s 31. 1982 i In tetl0n nOOr Cooteetc. RPom,. Ore WibtmeStreif. Eqston, Man- lo. a at lO30 am.0. Tne ,owpo O Itt n. Is to receneerntnts ot the Cootto Nth. s Fecere C oMOUtistii C.tts Pro0t( Priority L.i1to, Ftal Ye 1993. 0IN.h i.80t00if eomuTrntY proj001 eSCtd to receto. Fdea8grtts Cunng tNe y5.
Tni Witl 0b 0ased Won 8a0d"0 RrndS erNrd 01 front Fr.l Ye.r. 1981 008t9892 8S0 ST a mtd Nat900n AmoPro.u. of $2.4 bifiO tor Focal Yer 1993. (0aj0saChusollo oioson to, FY-93 oIUNJ b 583.5lo.0 o to.e $2.4 b000n. b .0o1d be70o00ORttoS4ly dU0C00 aS tm. Nali0n Awoo0ri.t Tion0Cr. Propicts b0. th.NesYy firN, or0 rne0, Rab0e LA Ill 04P0ob0t(. rot be 0R0CJ tott toe Nat8onat Applo-51(01100.
It snoulc o0. tuttN otoeC tioo to. Prioriy Systm eotitteN to strr9 anC 80a 00.9 POr1Oty to 0ro01ct$000h Wittl gilatly i(10o01 tn. qoSfity ot toe Wate8 s o tt.C,0oo.th -50l005rd0pu80 (00t0 m10 mO otecetIFm
By Ord., of Thooos C. MCMWn80 Dire. o,CO.OMOEALT. OF UASSC>IUSETTS. D01- 0S 00 OC WATER POLUT.O. CONTROL. CRITE- P._ r. btRiA FOR ESTABLISHING PRIORITIES FOR A ,,0O01 0100 01 N n8 1S 808G .N.IS UNDER FEDERAL WATER POLLUTION r9 d 0 00105101o po.CONTROL ACT A*0 THE AIASSACOUSES05 -5- n1,. St~b TnO P0400Y d 0 0) aCLEAN WATERS ACT. FISCAL YEAR 083. r 00 08010 IN0-5 ,.1(
0: 1(18 100 10. 0480 4 (Oi` FY&I.I 1. E198 P8 0 I-0n O- T10 .1902 to S0titt 30. 19Ot. 1_fnes _n nt, r0n I u m to neG- WIl u n rol, P.
10001 01 toltR T Pnon1801 C_(ra .,8 nlo t 1r Mh 0 IPT FY FY00. FYss, FY87.(001 ( d 0 01 G 11 10 I-n - TO. 0(000 40 0 o1n0t Irpm hn0l 0(01819(08905 00 00 000000 Pnm l o. OCIO Tan 0.0(0.00 FY82 0loo0 51000
A""0 ((00 000 (00089( (1 1001 0901000 010150*080(0 an 800(15100 TtoR 0. *010 ( I P b n a
AI (00 ((01 t00uen1t 01 80 an F 0PT The Y00 80 (11o r-t rY N
1480 0n.8 _0( g0 I. 0w (0 000 * III A(Oa t ht 1800080088 8noc,-oatoo F 100s (0 -uA.04e c00on(l8oo0b081 Amng - -0d lo pn 0_ T P 8M1 0 P ol rt 08A.9(81 n. 0 0(01 80o0(11 (080,50( a P 0:ii I 00. 0N -W 02. C-ukd-1 plwnre tty www AP o V~.H_
To De0 8 C01 00(00(9 0mg010. Oo)4l. 0 IN m e S 00801 .Elho1t IN, U_0180001010. 1 8 (0000000( ((1 0 ,no v 08 8y 00(-1 It
J0(0y . - IN0 n8-0omrod n80(080,10r: ols oT. ( r.0 100 T800TP00( *s 00800010.81 r0005 IOwgan ny. T05~ Iql00 PP110800PO8401000(80180400
80.0101 0 I0 IN 0t 0 10000, To. 0 l001f- IP8 FY82 _81 S480(00(( SI.. 300SW0111Pt~S5001000
IP0,1 08 _ 01 g (N0 I 10 0(0(0 p 0o 1 2 "9SHIP 3o0,- 0 d 8P0 (C0-
Tne Wz - m,_P YW o' .FToean.080c80801(0 n0000 D0 h00(0-dr oean Tno 08,50(:00 Tn(u D r 977(09000100(1me0081001(00010 POWt P1100prly 10(018PT881 - 58.0081 W10000 RT 0(11 Tr 0n 1 C 080io
8 (1n"" G0000 W1 d 1081 0008 0n010A. P,0(41 -000 W 0 008 (0 0 PrYP SySI m 800d0): A
-90(00- 00 , 001 0 0 A(1010N,03. Cru S"N WT _w PNNwr, _ a eokp - Wt rA a8. 0 P 1.000508 o 01*008 0100 "'T,00l
90 ( W:10 1 80001
q- SNI 01 St.' 2 pr510 0__lo W0 r N00,55l0. ns r-.P r,itu W. Td Pl -IO= IE kw,,H000 10( 0:0 -0 (10801100 .Sbgoo 110..(8080 St.'I 10(0
CrO PI e. r~n T1 erl ln_00000 1100 9000 (0 qu0510 08 5tVIC 9 000 . 5*080e 000p000 TOS
01(10IN 0185008(5(1,001W.0(.0- P 000(80 PHNN .NINN, 111 P0(0=~~~~~~ RW, P.; _ __a " P_,niaFr ¢5tw v PI UR, dNRo it- vii, D. dr -w yl
-- Iron11 1 510001 (118 o(o0810 010 NA, T rooct 0 8 08 v (1 r .
",iii"- 1 OP NI IN wr po, AddIO I Aelkz cpr roiNuI Ne tta11e rd*"~~N omoTOC Pl s hD.- rn rqn e C-nl n nepo,
JUT IN m- "_ny.Ts T-r
(0 00801010.( I 1050 00050 1005 009(510 N.8, .000( (08 W
(I0(pn 0 d 10((000 0(001500010 11rT nrd5000 10:801(101o(001(000r0_(_N5T_ _
c00( 00 110 000 -0100(0 , ( A0 f-0 Tno C(01 0 n0080150 01 W- ( ua 0111- 5(... .1 d r_0 ( SWP 0i0
IN0
m'y0r
1 . 0a
08To
0* 1 a8 8 T o r
iro cu9_.. _o m i _rTr baTwAt pn.Ffo FN - II InT #RT ",~ sw-r t o sr .qid Id- P- W iN F5 I
nr A X m ga i. m9o- T5 PloTNl ctnnD.ca1972 mst- loINOrl ~ hn-,.1. Tn rnaW-wPPnCn
_ _ _g. t ne ex "sn"Ir Tlld- Wn tn R -O~WP.z WNu-' ad rFI_S,m pnoiINON -PtN- T mmRomo in volbateinrXRdII
P, Ii~ed Gcow1 92Ar noe-NdA~lC nvD neOPu U IN Co-n AoSyjtXRfo b yheOP Niii-N0 0.0 1, 500 0 T u hl, 0) 8 P WO'H. p0n aoo
ur_1(0o.00(00000(4(*111 1(r 010808891 8a(100 8re 011. Iri
08(010 Troy 08m0.0(810 no( 081 (0 1811 0010 1100(8000( Tdrnh OTPo054910((05100088(01:1(1(4. 0((8( 1000 OtO s0_ 09(804 1010 0
2004T.(01 00 0 -I00W(0IN0010. 0.-0-0-
ToN n I DW ~_N Wo W INo~ ufti Io P, INo
2. IN 10( 01511000(0 W :80
3. 10 C8. (u "-001 (05 0( or
( DWPC 0W01- m18 015(
T"c, m- W h ro emNI
SUN, ._TO N RP-W wA& Ye ror ,i,1
(051 .0,(0(01110880088 (0(1htnra- o, C n o De a[ Tws*Cae, VoW eO ona
PI Y "M I-a Mq Of Io-w *_ d. -n - IN PINO. IIIfo
(...a P04-00 8 o a 0
50o8.o NO40.0.005Spss. - IlNNO Y
a(0 E19 Rql A(0"01 d EPA (n(n
1 0 T. 05918 000h( R0U 71.
E10(108M( M (01114l0 SUP(0 (0 01 G00*C d ,
D,, I N otlt lo, INq tmPa_ wo wow>>m
D wetn P W MPN oniS-
4om ((80000100 50100 001101( S_ 1n
_0(8(101_ 3II8 01 (880 (0910 00051*8on Af S,"3 HN or- or c- -oEPon o~l -g - m . - l`
The OUK hl- *00 008(00(8*O (40n0Wi.
T"n Z 11, d - Wo OUK , lo en*vI'M=Z P, olo WDE INcomlv^
008(A 001 (0, 00000 . ( * nI 0 .
IN~ - gen~zbm -n - X. Tn0(00 I0 (8 ,,0 0(80 (0 8011(1000(1 (00
51100000(00000000.09100.T-
I. An Wn T -fd- w-P",rs-o _hNlepP-a .v M lO O-
I0010I000 588 t wr-Do dt~ 2914008
(1 -w(01. pa." 0o0. 08 A1n8
S.Wm - L a mU DOW noo
008 5 St.' 3 (00518l 0(00 (01 00081101(EPA 088 01808 88000 01 0880 or1d(or
alD> (018 10400 0 S0
T- 1(01 018- 81, 00 (01
Tn Sva Ro o~~~~~l 1es qmal
(p00 01 . Tmr 01 oc Ot0 :(51- Cq 9( 0 *. 0
(1 Sdts to 080( 001 v00 90(108R05
0.,- T08 HO 0_,. 0 111110:,( . 0 0 90000180:IhT0wr-00 1*vl00010(04t 1n85(80. 00 *08
pfi So ~e r moo n
(on0800(040(5105180 n0 ITJ080008008180080 000
0(10 Tne d M AOlIon~lO Pv5(8800( (% I 110 (08518 880000t t- 00
0 m1 (0 o 0110 00110000 U_40000W8 04) w8( 11101811 *n 10558 000
_(0 0 wr(1 _0801 0 0500180 0(00000(058(0084000511S 0
00(0 (01 800l 80904 00(I11501( 00 1491 0un1500100(000(.00 (90a2i
TAL A n EUh
* TyR 0101080 nl 0008In_ vo,108 100085 Tbe *
m10 11090(1810(000581 0v05 0(00000 o

126
Exhibit 5-1 (continued
S Cot W cl -4r0mm-5n
p 4 0 6 l o 4 m W n 4 n a R C o t t t 6
p.ptY W04 a Rt t at O-
,Yt,, -t OrO - 4 a S 5
a m08 P406 0t 423 trw C0 tO 4.a Oe 04
C -t aa . S -.. O aa 4 ta 6? C on d ntnRahr
.44.0 trw n 4 04 atI d _ tfr a St
t at .44 m t. S 40 4 R t 4t 4 3S. Cncn
.0 0 p V 1 6 t 4
4 0ob4 0 4 t R a a
a t nr nt. 8 t t 0 0 6 0 4 4 1 4m ut C d 6n n 6 4I I U d
m Woso-Inly --c0n 4tntt s ta ot a r a 51 .111
lt ha Du aatd. A 2040 C et _t a n e t .81 .4 c a5.
4.*46 0 04w~ I~t p4.4 hr as
0..t 4.u4. to 4064*844 -
Cam - - 0t _t u e a to 4 4 * 4.0 5 4 4a b-n d a, am 01_.0004 06 80 04 ,fl <1wq Utt -
c". Patn _5 a0_
004440 .t~diaha 0u
B . a Stat. W t t a da .06Iftmarb06y atoo utt .wc0
W. A.-*~
.qna1 .r 4 a 20 30
0*94005 a~t~tt~tO 4.50la
42 C o to at g r 8 4 48
6. EP44 040 64
.Pto 0Pct _ mtaot at
ntg uw ta_ to U Y 4 20 30
40 20 303. P4OtR8 -1 4n0 0tt1 6
584.04 Abao ha .4An6l
5 40 45* P4ORCt -1 hV_ b l.4t
P40It .411 .0818605 0
040404 t atntattat Cu
6 MAD4 Fq0
a t -a dN R
400.000 30p rn1450-440.000 260pan4
50.00 t0P16t4
-NG HUMBER-
S W OES P F P o 9440644 P 0404
rno40055 ttaS Sto0n .n r0mD AdatCb
t a u t n 4 4 0 4 0 0 4 4 N O M P 1. S ta d
P40 44 Stab
S W. 2 -444 4 -S t a o - a t O b tStab 3-0t0400
Ga,4 Cut t4hC Kn 0046 64un P,0 l IrO 0t.t s by DW PC 46 EPA tat .
WWTP _ W .~4u T.t4 PWItAWT - Ad.I-I W _II 74.16.4C5O -C_,- S- O..0-
TV.
FM. - F- M-I
A 0. SYAl.4h S4 CFat SW 2 3 o. 2 3 3 Wol. 0
-~~~~~~~I An An-_ 4 o a o64 7361.60 0 a 4 d a t 3 400 . 4
tat _1140 *00 * O W d30 50 0 r .16
A- P t ot at t14 A .02 at 404 n0 . .f
501.00. Cot ,444 4W daab at0 004, 08 30St at taa taOt
*r Ct Wt.N t8- P4.4l l_ 404 tI- .1a IU tD
A04 -adiaat44ap.
C- P-.t a PoPr l0atapt
C-The a Wt 0 Y 4 at. t IC
Y- tt.p904 t uttw .00. Vt0- Pattt at at. mt a an oayy
PaaOr. Po at80 ta to na .6. saba
tt 0 i.n m ad a..-
PF.Cat by 5-0,6 C.4.604CA0
Fat Stab 23aCt 24. 3 IYOi~ a *1a a. Oa
C-ter ty -Snta Mm ott
Cotqr tb-rT patCr Bs*-AWT 0,,,-
C~~aty 1I4Atttt s 04/t44t.fZt.D~ro 48-Sawavw
C.tay IVA-N- oaata*PW
C4.at'nr lab-Spa Ottu0.ptan
Ct.garf V-Cattrtat d como
PttttY Li.atWat SOty t Ptn R.m.q (WOW4 Cad)l
*.0 00040 - "' Oc-at2 Sta 004 nol. a n-Wrd mOM
P4104at ata S astt_ tb ha
3 Sta. tmas ano_ CS on o440
FISCAL YEAR t983 FULEA LIST SUM-
$EPA FUNDSTa4 Futat 1a1 PrqtW t28 5000,CatitvntYoatn 43.766.39.Pat Maa.u 6.113.20.ItttanatraJA~ttnrnatta. RO13 420
Sta t O 2 z- 2
Ta,,, IFtfatanttag- SIS&6.t 606
FISCAL YEAR tSO COMMONWEALTH OF MOISSC TTSCORSTRUCTON GRAMTS PROJECT PRIORITY LIST fUNOARLP PORTION
PRIORaTY PFROJECT PROJECT ENFORCEABLE t. EPA"O4NTSAPPLCANT NUMBER STEP DESCaIPTION REOUIR4MENTS FUNDS 10001
465 aN Rcotad T47.04 3 P.S. PaAt Wo-ata. 6 57.606
160 2oat 265.03 3 WWTP At. A 2.Z 2I55 BYSC 341.05 3 CtVt 3 . 2.60I53 4-0584 63703 3 Po0,3 8 9 6t506D tD 0.103 3 t. PS .6 737W s o U O 8 * 0 3 Fa.;,wt CSO A z .063
,W T-1-ta 479023 3 It..PS A.l 17*4445 9t"Y 346.05 0 64.. 3 a a 0 3.525405 MDC Us.02 3 Cottat8096 A 13643 1.4lMno 30802 3 AWT a 9 4400
tA. 6 43202 243 WWTP. I... I/1 R-. A 9103 whmroo 687.02 213 PtatY. Ott b. P.S. C .200
40 CRWPCD 48703 3 Bta06_Ptt A I.3064 400t 38603 3 WWTF but A 0W300tQd MDC S4.02 3 StW" 89rI h l. A 1.03'40 MDC 642.02 30 St UM CSO A 255tO0 M .. 03 3 06. P.S A 300440 5_.p 431.0 243 WWTP. 06. A 3.750140 WNW n- .W3 3 VL B fi
140 Wt t 34T07 3 CaL /5.tt A 8.506;35 Ab9 = 3 -hL 200
435 datt l 302 2/3 CatS.0 Sty A S 70I33 Cbout 649.03 0/3 0 6 72435 F..a.4t 323.03 2/3 /tR46 268t35 F.0at6 32503 3 WWTP. M. P.S.. F 8..I t12.0Dt35 MDC 620.04 3 MIm-a VW. t. a A6.50t35 _M.pt. 700.4 3 CSO . A I.200353N t8lt80 473.03 2/3RWVTP-SddR, & A 40.6P0
43504 S0ES 3 tS- 34E A 75035 S- 6841.02 2n3 VI RAI. .. C 390
I30 Aa 362.W 3 WWTP ""-".no A I.2004303CR. atM- 54701 2/3 t.P .tMR.0t 6 33S
230 L2 t 27 3 h . C 4.630130 #SWBI9 3 . R d . 8 3.55t30 O-,C 404.03 3 F-oa Pu P.S. hL C 3.960430 T a0t 2n3 WWTPA A 646430 W686 4t5 .03 3 Aw _ A 230043 0
R_ 5W604 3 4.65 C 2.70030W44 60002 2/3 -t.t 4O. A 750

127
Exhibit 5-1 (continued)
'lsa 4440 A 4l14
' a. 70 A 5.1504Al - A72 4A'u . 4tAO A At 45
0XF> Al.I 544 1 At70A
0 A__. 4570 27 _07110 A
'l'17 o 040 21 ^10 A 0. A
'SI;n C. 1 3 107 5 A4 A
AS 'n-s 711 A -4
-.17 'A5ADt 447 A 0l.700s41I c
44 Sav n 744 412Cl'. S..S..1.03 '00 01 44443 A s totWA '0450440 770AA
4o10a AXU_
703 75444400 4770 Ai U477
70441 477 o7 I' AnX U ~40Q 70 0._71 070 Al i__16. 1 C
740 'O n 400 2 74'A- i 41OIl C.s.
747 '.a. 444 1q '0400744,4AA 4
404 'n AAzl 412n 754°
''" 47144.- 444 Az 520.117.04
i .'7 5 In Cr
544S 1100e- oI. i, _704 S ih~Is10 47 52417714SOXS-I C
IA- 772l AA 030 As $0400 740? i
7171 __4474 100i~ A u _i47n 71.3 Ar l 1_ 14503407 A c
ni_ *-1 w404.2 477 A A.7 f- C
7cn i7aA 004- P1244777 A
40 7017 7120 A, apS. A
7400 '070 375 7 An 1704 Ac _17n 7040 - A~ a. Au
'10 '00i- 70l. 4s a. A
71.51 4140 04 A a77 O n 70 5 0
� T.IIZI=In; M.
11;l.
I'll
IN;M
; M
I�mIt1.
: 91.I .1�9I-11II=I.-
'M:11.1".I=
;fg"I1.
.M

128
One major planned project is upgrading Deer and Nut Islands, the
MDC sewage treatment plants in the Boston Harbor. This pollution-
abatement project has already cost over $149 million for planning,
design, and construction of new pollution-abatement facilities; another
$19 million for construction and $12 million for planning and design
will be spent this fiscal year. In the next three years, $177 million
will be spent on planning or construction of projects in the Boston
Harbor area. However, the estimated need for the total clean-up effort
is $848 million, of which just $588 is likely to be allocated by the EPA
to the state as a whole over the next ten years (Massachusetts DEQE,
Memorandum: Boston Harbor Cleanup, February 1983).
In addition to the need to clean up Boston Harbor, which is
jeopardized by reductions in funding from the EPA, the EPA itself
publishes an annual assessment of the costs necessary for the states to
comply with the Clean Water Act. The 1982 EPA needs assessment is based
on data provided by the Division of Water Pollution Control of the DEQE.
This survey concludes that Massachusetts has a backlog of $4.7 billion
in construction needs, in categories as shown in Table 4-9.
For example, according to the Northern Middlesex Regional
Planning Commission (NMRPC):
the major physical need of the regional treatment system is
treatment of combined sewer overflows which currently exist
and will continue to exist. Since the system is a combinedone, storm events necessitate direct discharges of sewage into
the [Merrimack] river in order to relieve the plant ofexcessive flows. A study of treatment methods is currently
underway (memorandum from Robert W. Flynn, April, 1983).
The NMRPC estimates that the cost to correct or treat the CSO

129
Table 5-2
1982 EPA Assessment of Backlog Costs, inMillions of 1982 Dollars
Category of Backlog Dollars
Secondary Treatment $1,233Advanced Secondary Treatment 85Advanced Treatment 17Infiltration/Inflow Correction 20Major Sewer System Rehabilitation 18New Collectors and Appurtenances 806New Interceptors and Appurtenances 574Correction of Combined Sewer Overflows 1,990
Total $4,743
…_______________________________________________________________________
Source: 1982 EPA needs survey, Table 1, p. 43. Estimates of cost ofproviding treatment services to the 1980 population as estimated by the1980 U. S. Census for abatement of existing pollution problems.

130
problem in Lowell could be as high as $80 to 90 million.
Construction Plans
The EPA plans to reduce the amount of funding available to the
states for water-pollution control. This would severely impede the pro-
gress of the state towards its goal of providing safe waters that both
protect the health and safety of the citizens, and increase recreational
uses of rivers, lakes, and streams, which contribute to the economic
vitality of the state's tourist industry. EPA estimates (Table 4-10)
that the state will need to spend over $3 billion for sewers and treatment
just to accommodate population growth needs by the year 2000; nearly $8
billion for all waste-water needs (Tables 4-9 and 4-10).
Sewage Collection Systems
The estimates for new collectors and appurtenances shown in
Tables 4-9 and 4-10 are the major indicators available of the cost of
the construction needs of local sewerage systems. The need is
estimated at $806 million in 1982 and $885 million in 2000.
Existing Facilities and Age
The major available physical measurements of sewerage lines are
from the MDC. This system maintains 277 miles of trunk sewers, with
more under construction as part of the MDC's program to improve and
extend the system and provide overall pollution control. Over 5,345
miles of local sewage collection lines flow into MDC trunk sewers, with
415,177 house connections (MDC, 1981). The MDC Sewerage Division has 10
pumping stations, two treatment plants, four pretreatment headworks, a
detention and chlorination station for combined stormwater and sewage
overflows along the Charles River Basin.
Forty-three cities and towns covering 406 square miles with

131
Table 5-3
1982 Estimates of Year 2000 Needs, in millions of 1982 dollars
Category of Backlog Dollars
Secondary Treatment $1,375Advanced Secondary Treatment 98Advanced Treatment 23Infiltration/Inflow Correction 20Major Sewer System Rehabilitation 18New Collectors and Appurtenances 885New Interceptors and Appurtenances 740Correction of Combined Sewer Overflows na
Total $3,259
Source: 1982 EPA Needs Survey, Table 21, p. 63. These estimatesaddress treatment needs, including those of new growth areas, forprojection population of the year 2000. The projected population ofMassachusetts in 2000 is 6.7 million, based on Bureau of EconomicAnalysis projections (Table 32, p. 74).

132
2,185,855 inhabitants and a contributing population of 1,881,805 are
members of the MDC Sewerage District. Per capita cost of sewerage
operations in 1981 was $11.69, of which $7.40 was spent on maintenance
and operation and $4.29 on debt service (MDC, 1981). Average daily
sewage load was 379 million gallons and the 24-hour maximum flow was 716
million gallons per day passing through primary treatment and
chlorination at Deer Island and Nut Island plants before discharge by
outfalls into outer Boston Harbor (MDC, 1981).
Of the 351 towns and cities in the state, 153, or about 44
percent, have no central sewer system. There is no information
available on the proportion of these 153 nonsewered communities that
need a sewerage system but cannot afford to build one (derived from
Massachusetts Division of Water Pollution Control, 1980). Some of that
information could be obtained from the 208 plans, drawn up in the 1970s.
Only two regional planning agencies, the Old Colony Planning
Council (OCPC) and Southeastern Regional Planning and Economic
Development District (SRPEDD) provided detailed information on the
sewerage systems in their regions.
In the OCPC district, information is available for the Brockton,
Bridgewater, Plymouth,Stoughton, Abington and West Bridgewater sewerage
systems (see Table 4-11). The rest of the OCPC communities rely on
private, on-site underground septic systems (this section is based on
OCPC, 1983).
Brockton is sewered and rates its system as fair, but one area of
the city (Ward 6) has a "substantial" water infiltration problem.
Funding to replace pipe in that area is tied in with reconstruction of a
new Brockton sewage treatment facility.
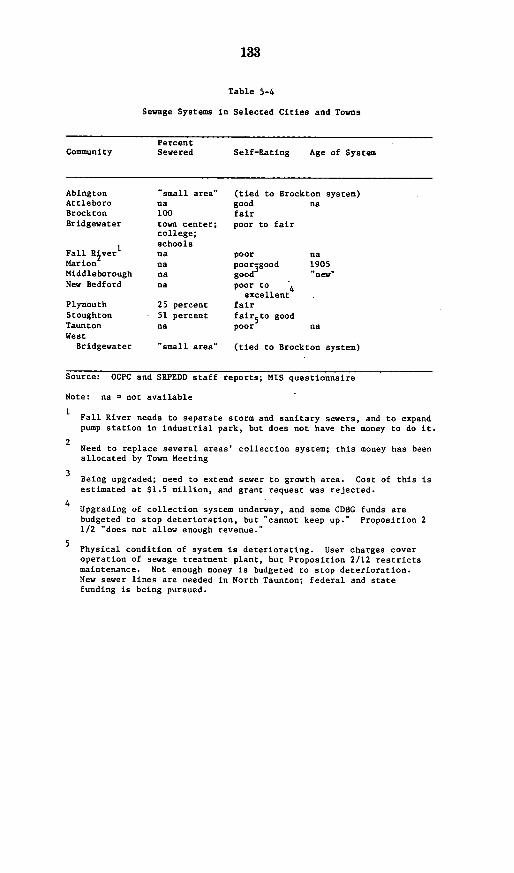
133
Table 5-4
Sewage Systems in Selected Cities and Towns
PercentCommunity Sewered Self-Rating Age of System
Abington "small area" (tied to Brockton system)Attleboro na good naBrockton 100 fairBridgewater town center; poor to fair
college;Fall R e1 schools
Fall River na poor naMarion na poor-good 1905Middleborough na good "new"
New Bedford na poor to 4excellent
Plymouth 25 percent fairStoughton 51 percent fair5 to goodTaunton na poor naWest
Bridgewater "small area" (tied to Brockton system)
Source: OCPC and SRPEDD staff reports; MIS questionnaire
Note: na = not available
Fall River needs to separate storm and sanitary sewers, and to expandpump station in industrial park, but does not have the money to do it.
Need to replace several areas' collection system; this money has beenallocated by Town Meeting
Being upgraded; need to extend sewer to growth area. Cost of this isestimated at $1.5 million, and grant request was rejected.
4Upgrading of collection system underway, and some CDBG funds arebudgeted to stop deterioration, but "cannot keep up." Proposition 21/2 "does not allow enough revenue."
Physical condition of system is deteriorating. User charges coveroperation of sewage treatment plant, but Proposition 2/12 restrictsmaintenance. Not enough money is budgeted to stop deterioration.New sewer lines are needed in North Taunton; federal and statefunding is being pursued.

134
Bridgewater's town center, Bridgewater State College, and other
schools are sewered, and this system was rated poor to fair. They hope
to expand their old plant to double the present flow capacity of 1.5 mgd
and upgrade it from secondary to tertiary treatment.
Plymouth is about 25 percent sewered, and the system was rated
fair. Stoughton is 51 percent sewered, with a rating of fair to good.
Both Abington and West Bridgewater have small areas contiguous with the
Brockton town line that are tied in with the Brockton system (above from
SRPEDD response to Massachusetts Infrastructure Study questionnaire).
Needs
In the suburban communities of the Northern Middlesex RPC, sewer
extensions to include additional areas of the town in the distribution
and treatment system are generally the major needs. The cost of sewer
extensions in the suburban communities were estimated, in 1978, to be
(Robert W. Flynn, April, 1983):
Dracut $20,000,000
Tewksbury 44,000,000
Tyngsborough 6,700,000
Chelmsford 8,160,000
In Lowell, the needs of the sewerage collection system was
estimated by the NMRPC at $3 to 5 million annually. No other
information was provided by other regional planning commissions.
Construction Plans
The NMRPC provided the following expansion plans for towns and
cities in that area. In Billerica, a facility plan is underway to
upgrade the level of treatment and expand coverage of the system. In

135
Dracut, the second phase of sewerage-system planning is now underway,
and construction is expected to begin next year. In Tyngsborough and
Pepperell, the second phase of sewerage-system expansion is currently in
design, and construction is expected in one to two years in Pepperell
and two to three years in Tyngsborough. In Lowell, a major interceptor
is half constructed and the other half is in final design. A combined
sewer study is underway, with construction expected over the next five
to seven years. No other information was available from the regional
planning commissions for other localities in the state.
HAZARDOUS WASTE
According to state law, hazardous waste is:
a waste, or combination of wastes, which because ofits quantity, concentration, or physical, chemical,or infectious characteristics may cause, orsignificantly contribute to an increase in mortalityor an increase in serious, irreversible, orincapacitating reversible, illness or pose asubstantial present or potential hazard to humanhealth, safety, or welfare or to the environment whenimpropertly treated, stored, transported, or disposedof, or otherwise managed. . . (Massachusetts GeneralLaws of the Commonwealth. 1979. Chapter 21 C).
In 1979, the Massachusetts legislature passed Chapter 21C, which
gave the DEQE broad authority to regulate hazardous waste activity. In
1982, Chapter 21D established a Hazardous Waste Facility Site Safety
Council to determine the needs for new facilities. In March 1983
Chapter 21E established a $25 million bond fund so that the state can
take remedial actions where parties responsible for spills or
uncontrolled sites cannot be identified or do not have sufficient
resources to pay cleanup costs. In addition, Chapter 21E gives DEQE
substantial authority to exact corrective actions by assessing treble

136
damages and establishing liens. These three laws form the framework
within which the Massachusetts Hazardous Waste infrastructure can be
assessed.
Existing Facilities
Massachusetts currently has limited capacity to process the
hazardous waste that is generated in the state. Of the approximately
190,000 tons of waste reported to be generated annually in the state,
only about 30 percent is treated in Massachusetts. The remaining 70
percent is exported to out-of-state facilities for treatment, storage,
and disposal. If waste oil is excluded from the reported waste,
approximately 83 percent is transported out of state, primarily to the
neighboring states of New York, New Jersey, and Connecticut (most of the
information in this section is from Massachusetts Depar-tment of
Environmental Management, 1982).
The 190,000 figure represents a minimum estimate; some
transporters may not be submitting any or all of their monthly hauler
reports, and some generators may not be using licensed transporters.
However, the extent of illegal disposal is unknown (Mass. DEM, 1982).
As of late February 1983, there were 38 existing, licensed
facilities for off-site treatment and storage of hazardous wastes. In
addition, there were 330 "interim status facilities," mostly at the site
of generation. A listing of these facilities can be found in
Massachusetts DEQE, Division of Hazardous Wastes (undated, untitled
memorandum).
Five licensed solvent recovery facilities can process a total of
25,000 tons per year; one facility can incinerate some organic liquids
and neutralize some caustic aqueous wastes; several large generators

137
have their own on-site treatment facilities. However, only one of these
firms has any treatment capability other than oil or solvent recovery,
and this one cannot treat aqueous solutions containing large quantities
of heavy metals (Mass. DEM, 1982).
There are approximately 160 transporters licensed to transport
hazardous waste in Massachusetts (Mass. DEM, 1982).
Needs
To safely treat and dispose of hazardous waste generated in
Massachusetts, the state would need the following additional facilities,
according to Mass. DEM (1982):
1. Two solvent recovery facilities, each capable of treating20,000 tons per year;
2. At least one 50,000 ton per year aqueous treatment facility(the need for more than one aqueous treatment facility isdependent on the extent of waste pretreatment undertaken byMassachusetts generators);
3. Approximately an acre of landfill per year; and
4. One rotary kiln incinerator capable of handling at least22,000 tons per year with a potential requirment of 31,000to 52,000 tons per year.
Construction Costs
There are no estimates of construction costs for hazardous waste
facilities.
SUMMARY
The current and expected revenues and expenditures on wastewater
infrastructure are presented in Table 5-5. Given the information available
at this point, it appears that expected revenues from all governmental

138
Table 5-5
SUMMARY OF CAPITAL INVESTMENT NEEDS
AND REVENUES IN MASSACHUSETTS
(millions of 1982 dollars)
Wastewater
Needs for Selected Periods
Period 1983-2000
Total Need $5,100a
Average Annual Need $280
Need to Year 2000 $5,100
Average Annual Expenditures0 $28
Total Expected Revenue to Year 2000P
Total $2,331
Federal $1,494
State $504b
Local $333
Expected Revenue Minus Expected Need to Year 2000 $-2,769
SOURCE: Refer to Table 6-1.
aBased upon EPA needs survey to the year 2000, including combined
sewer overflow capital requirementst which are no longer eligible
for federal funds.
bBased upon current state general revenue-bond requirements.
CAssumes continuous proportion two-thirds of state for capital
projects.

139
.sources may fall short of.anticipated needs by as much as $2,769 million
I by the year 2000. A more detailed discussion of these estimates is provided
in Part 6.
31-895 0 - 84 - 11

Part 6
SUMMARY OF NEEDS AND REVENUES: MASSACHUSETTS
Table 6-1 presents a summary of anticipated needs and revenues for
infrastructure capital within the Commonwealth of Massachusetts to the year
2000. The reader is urged to use this table with extreme caution and to pay
particular attention to the footnotes to each of the entries in the table.
The research staff have attempted to summarize the capital requirements for
the state by individual categories, using the best available data for the near
term. In some instances, needs data were available for two to five years into
the future, while in other cases, data were available for even shorter time
periods. In still other circumstances, accurate data were available for
project needs, but the timing was uncertain. Actual revenue data were
obtained for fiscal 1982 only.
NEEDS
For highways, only relatively subjective data were available for
needs, though considerable data were available in a number of forms for
projects requiring attention and for expected annual levels of federal funds
available for project implementation. The major highway project under
consideration at the present time is the depression of the central portion of
the Central Artery. This project could not be included in the table at the
time of writing (May 1983), because no firm cost estimates were available.
Bridge projects within the state offered one of the more concrete sets
of numbers because it is unlikely that any new bridges will be built at new
locations. As a result, there can be a relatively accurate estimate of annual
maintenance requirements.
There is only one tunnel project under consideration and that is the
(140)

Table 6-1
SUMMARY OF CAPITAL INVESTMENT NEEDS AND REVENUES IN MASSACHUSETTS(millions of 1982 dollars)
ExpectedAverage RevenueAnnual Total Expected Revenue Minus Ex_
Needs for Selected Periods Average Need to Expendi- to Year 2000P pected NeedInvestment Period Total Need Annual Need Year 2000 tures
0Total Federal State Local to Year 2000
Highways, Bridges,and Tunnels
Highways 1983 300 . 250-350 5,400Bridges 1980-2000 1.000 50 900 100 9.458-9,818 5,8584 3,600-3.960 n.a. 2.158-2.518Tunnels --
1 ,0 0 0 -- 1,000 [3,339)
Railways 1983-1987 2 2 0 c 43 780 9 162 n.a. n.a. n.a. (518)
PublicTransportation
MBTA 1983-1987 (1993) 1.400-1,600 150-400 2,700-7,200 70 1,260 n.a. n.a. n.a. (1,440)-(5.940)Other 1983-1988
2 8e 5-6 100 n.a. n.a. n.a. n.a. n.a. n.a.
AirportsI
Logan 1983-1988 550 110 2,300 n.a. n.a. n.a. n.a. n.a. na.Other 1983-1984
1 2h 5 90 n.a. n.a. n.a. n.a. n.a. n.a.
Seapor tan
Boston inOther
Water Supply 1983-1990 5 2 0Jk 65 1,150 17 306 -- 306 n.a. n.a.
Wastewater 1983-2000 5,100, 280 5,100 28 2,331 1,494 504s 333' (2,769)TOTAL 958-1.309 19,520-24.020 n.a. n.a.
SOURCE: Summry of needs presented in varitos sections of this report. Sources of data are provided in each section.Figures in ( ) are negative.

142
Notes to Summary Table of Capital Investments
n.a. - not available
aBased upon current needs independent of availability of federal funds.
Does not include depression of the central portion of the central
artery currently under consideration.
Boston harbor third tunnel estimate of $1 billion.
Based upon 1983 to 1987 commuter rail investment plan ($200 million)
plus estimate of annual expenditures on grade crossings.
dRepresents total project needs. Timing uncertainty reflects both
ability to implement projects and likely flow of federal funds.
Based upon 5-year plans (RTA) for replacement of bus fleet and other
system rehabilitation.
fTotal dollar requirements of which federal share is expected to remain
at 90 percent.
gDoes not include estimated/planned expansion program of $300 million
for new runway, new cargo terminal, new commercial complex, etc.
hIncludes $2 million for renovation of Westfield airport as well as
estimated annual capital requirements.
Includes $43 million in 1983 for Phase 3 of the Boston Harbor Plan.
Includes South Boston container facility development.
Calculation based on maintenance of safe yield and guarantee of 150
to 200 gallons/capita/day. (The EPA standard is 100 gpd; over
estimate accounts for distribution within state and for annual
variations.) The present system's yield of 215 gpd is for 87 percent
of population. If 90 percent of population (6.7 million) served in
2000, then require a maximum of 131 MGD safe yield additional supply.
Supply estimates are $2 million/MGD or $260 million.
Includes estimated $357.5 million over 10 years for water-supply
improvements under Chapter 286.
Based upon EPA needs survey to the year 2000, including combined sewer
overflow capital requirements, which are no longer eligible for
federal funds.
Seaport data not available at time of table preparation.
Average Annual Expenditures is based on identifiable annual infrastructure
project expenditures contained within the Massachusetts state budget and
upon annual interest and principal charges paid for project bonds.
PAssumes revenue stream is constant for 18 years.

143
Notes to Summary Table of Capital Investments (continued)
Represents Department of Transportation obligated funds throughthe year 2000.
rIdentifies portion of obligated funds actually utilized, based uponhistorical trends, for earmarked projects.aBased upon current state general revenue-bond requirements.tAssumes continuous proportion two-thirds of state for capital projects.

144
Third Harbor Tunnel Project. While the final decision on proceeding with
construction of the tunnel has not been made, cost estimates appear firm;
therefore, the costs of the project have been included in this summary.
For the MBTA, a detailed list of future need-based projects is
available with relatively accurate estimates of their total costs. The time
horizon is less certain, as reflected in the table. As a result, the projects
were estimated to be completed over an 8-year period.
Environmental infrastructure projects were more difficult to estimate
than other of the projects. As will be seen from the table notes,
water-supply requirements are uncertain. In general, Massachusetts is not in
a severe deficit position with respect to water supplies, but is in need of
additional capital for maintenance and refurbishment of distribution systems.
The Commonwealth has begun a capital-expensive program for refurbishment of
supply systems. These figures are included in the table.
Wastewater capital requirements are based upon requirements set by the
federal government and enumerated in the annual survey. The research team has
added the combined sewer overflow requirements to the other waste-water
capital requirements, as these represent a major need in Massachusetts.
- Both airports and seaports present special problems in Massachusetts.
Air and sea commerce focuses on Boston. Those facilities have therefore been
separated from the remainder of state facilities. Logan airport has a clear
plan for maintenance of the capital stock for the next five years. This has
been included in the table. In addition, there is a plan for significant
expansion of the airport facilities. These have not been included in the
table. The other airports in the state are of less commercial significance,
but will require attention during the period to the year 2000.
It has been difficult to estimate the capital requirements for seaport
145
facilities in the Commonwealth. Boston Harbor is in the midst of a major
renovation process, which includes expansion of specific facilities--container
port facilities--and essentially elimination through abandonment of privately
held traditional dock facilities. The capital development needs of the port
and the new container facilities have been included in the estimates, but any
other port-related commercial development has not been included.
As a final caveat, the reader should see this summary table as a
relatively clear picture of the capital requirements for the next few years.
For specific sectors, the picture is more clear out five to ten years. Beyond
1990, however, the picture is clouded at best. To estimate future capital
requirements to the year 2000. it was necessary to assume that the annual
requirements will remain constant, an assumption with which the staff members
were extremely uncomfortable, yet one that was necessary to create at least a
first approximation of the overall capital requirements to the turn of the
century. In defense of the procedure, only one relatively weak argument can
be made, and that is that Massachusetts is not expected to see significant
growth in population to the turn of the century. Incomes, as well as
high-technology and service jobs, are expected to grow in the Commonwealth in
the next two decades. But these increases are unlikely to place dramatic
growth requirements on the infrastructure in the state. Instead, demands will
be placed upon the reliability and service of the infrastructure.
REVENUES
The Governor must, by law, submit a balanced budget. Thus, all agency
expenditures must be limited to the anticipated level of revenues. The
proposed FY1984 budget totals $7.36 billion, 8.3 percent larger than FY1983
revenues and 7.8 percent larger than FY1983 appropriations. Of the total

146
budget, approximately 1.9 percent or ($140 million) represents recommendations
for the Executive Office of Environmental Affairs, which is responsible for
the construction and maintenance of sewer, water, wastewater, hazardous, and
solid waste facilities. Another 4.5 percent (or $329 million) represents
recommendations for the Executive Office of Transportation, which is
responsible for the construction and maintenance of the state's bridges,
highways, tunnels, public transit, and rail facilities. (These figures do not
include federal funds such as the Federal Capital Improvements Fund and the
Federal Highway Construction Fund.) When combined with the expected FY1983
surplus of $57.2 million, the total amount of financial resouces expected to
be available for FY1984 are $7,397.4 million.
State revenues are generated from three major sources: taxes and
excises, federal reimbursements, and departmental revenues.
About 74 percent or $5,521 million of the state's revenues are
expected to be generated through taxes and excises. Of this projected total,
S131 million are expected to result from the Revenue Enforcement and
Protection Program, a new initiative intended to improve revenue collection.
The second largest source of revenues is federal reimbursement.
Reimbursements are expected to total $1,089.6 million or 15 percent of FY1984
revenues. The reimbursements, which finance state expenditures for programs
for which the federal government bears a portion of the cost, have declined in
response to changes in federal laws pertaining to aid to states. In FY1984,
federal reimbursements are expected to be $64 million less than they would
have been under previous reimbursement formulas. Federal grants, which are
distinct from reimbursements, are expected to be reduced by $77 million in
FY1984. Therefore, the total reduction in federal receipts for the upcoming
year is expected to exceed $141 million.

147
- The third largest-source of state-revenues is departmental revenue, or
fees charged by operatingragencies for services rendered, including
assessments for services to cities, towns, and districts. Departmental
revenues are expected to reach $714.2 million or 9 percent of anticipated
state revenues. More than $73 million are expected to result from the new
revenue collection measures.
The remaining 2 percent or $15.5 million is expected to be generated
through interfund transfers from nonbudgetary funds, that is, revenues that
are not part of the general appropriations process and do not relate to any
line-item recommendation in the budget. The nonbudgetary funds are created to
receive revenues generated through state borrowing or bond issues. The funds
include the Federal Highway Construction Program Fund and the Federal Capital
Improvements Fund by which capital programs are financed through a combination
of state borrowing and federal reimbursements; and the Freight Rail Fund and
the Passenger Rail Fund by which the acquisition, preservation,
reconstruction, and other improvements to rail facilities and equipment are
financed.
The Commonwealth has the authority to issue debt, or to borrow, in
order to finance legislatively approved capital projects. The Commonwealth
issues three types of debt: general obligation debt, contingent liability
debt, and guaranteed debt. General obligation debt consists of direct debt
used to finance highway.and pollution.projects, district debt used to finance
Metropolitan Sewer and Water Districts, and transit debt used to finance MBTA
deficits. Contingent liability debt arises from statutory obligations for
state payment of working capital and debt service of the MBTA and other
regional authorities. Guaranteed debt consists largely of liabilities arising
out of State guarantees of the obligations of local housing authorities and

148
higher education building authorities.
The revenues raised by the state are credited to several funds from
which expenditures are made. The Operating Fund receives about two-thirds of
the revenues, and funds all strictly state functions. The General Fund and
the Highway Fund are two such funds. The Local Aid Fund receives about 40
percent of all taxes and funds all payments (except those made by the General
and Highway Funds) made to cities, towns, and districts. The Assessments
Funds are used to provide asssessments to cities and towns that benefit from
services provided by the state. Among the Assessment Funds are the
Metropolitan District's Water and Sewer Funds. There is also a General
Federal Grants Fund which receives all federal grant monies obtained by any
state agency. All federal grant funds must be distributed through this fund.
There are, apparently, no comprehensive sector-specific fund-raising efforts.
(Source: Executive Budget Recommendations, 1984, pp. I-2 and IV-2.)
As indicated in Table 6-1, the revenues do not meet the needs either
for the current period or for the future. The potential variability of future
federal aid and the preliminary nature of these estimates must be stressed.

APPENDIX A
Massachusetts Regional Transit Authorities
THE COMMON WEALTH OF MASSACHUSETTS
I BERKSHIRE REGIONAL TRANSIT AUTHORITY 'f-d 52 PIONEER VALLEY TRANSIT AUTHORITY Sr f- S -3 GREENFIELD & MONTAGUE TRANSPORTATION AREA4 WORCESTER REGIONAL TRANSIT AUTHORITY5 LOWELL REGIONAL TRANSIT AUTHORITY6 MERRIMACK VALLEY REGIONAL TRANSIT AUTHORITY AHsyI&W-7 CAPE ANN TRANSPORTATION AUTHORITY Ad
-8 SOUTHEASTERN REGIONAL TRANSIT AUTHORITY f 1,t9 GREATER ATTLEBORO-TAUNTON REGIONAL TRANSIT AUTHORITY10 CAPE COO REGIONAL TRANSIT AUTHORITY11 BROCKTON TRANSPORTATION AUTHORITY12 MASSACHUSETTS BAY TRANSPORTATION AUTHORITY13 MONTACHUSETTS REGIONAL TRANSIT AUTHORITY F14 FRANKLIN REGIONAL TRANSIT AUTHORITYIS RMARTHAAS VINEVARD TRANSITAUTHORITYFor more Information, call Massachusetts.
-Executive Office of Transportation, "State Transit Staff. 727-2373.
Source: Executive Office of Transportation and Construction
/1 I!1
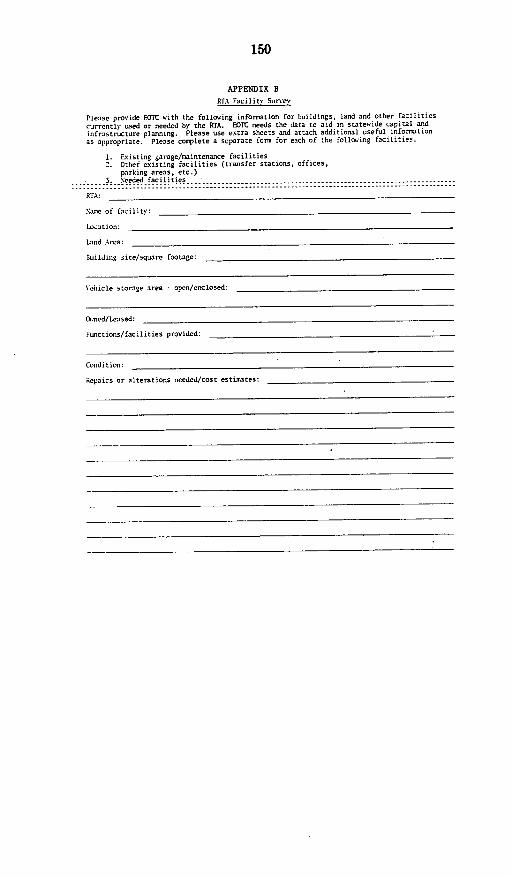
150
APPENDIX B
REA Facilit, Survey
Please provide EOTC With the following information for buildings, land and other facilitiescurrently used or needed by the RTA. BOTC needs the data to aid in statewide capital andinfrastructure planning. Please use extra sheets and attach additional useful informationas appropriate. Please complete a separate form for each of the following facilities.
1. Existing garage/maintenance facilities2. Other existing facilities (transfer stations, offices,
parking areas, etc.)3. Needed facilities
RIA:
Name of facility:
LIdation:
Lind Area:
Building site/square footage:
Vehicle storage area - open/enclosed:
Oned/Leased:
Functions/facil ities provided:
Condition:
Repairs or alterations needed/cost estimates:

Appendix C
MASSACHUSETTS tNFRASTRUCTURE STUDY, 1983: QUALITY OF INFORMATION AVAILABLE
costPhysical Age Quality Construction Maintenance Needs Plans
BusesBostonNo. of routesNo. of busesNo. of garages
Other AreasNo. of buses
Rapid Transit/Green LineMiles of trackBridge track milesNo. of StationsRoute milesNo. of carsCar houses, yards mileage
Trackless TrolleysBostonNo. of routesRoute milesVehicles
Commuter RailTrack milesRoute milesCrossingsOverhead bridgesUnderground track bridgesStationsVehicles
GGG
G
CGGCCG
CGG
GGGGCGC
G
P
F
P
n.a. n.a.n.a. n.a.
P P
G
P
P
P
n.a. n.a.n.a. n.a.
C
n.a.
n.a.n.a.n.ea.n.a.
C
Pn.n.n.a.n.a.n.a.
GF
G
n.a.n.a.
F
Fn.a.
n.a.n.a.
p
GFFFF
F
P
F
FP
P
P F P
n.a. P Pn.a. n.a. n.a.P F F
P F Fn.a. P P
n.a. n.a. n._ .n.a. n.a. n.a.
p
Pn.a.n.a.n.a.n.a.
G
FFFFF
C
FFFFF

Appendix C (continued)
Cost
Physical Age Quality Construction Maintenance Needs Plans
Railways (State-owned)Grades and crossings G P F G C P P
Bridges and tunnels G P G P P P P
Highway Bridges
AirportsLoganOther 50
_eaport FacilitiesBostonFall RiverNew Bedford
HighwaysStateLocal
MDPWTurnpike
Tunnels
WaterSupplyDistribution
SewerTreatment plants
Pipes (collection)
G G G
G F G
F F F
GPP
GGGG
F F
P F
P. P
PPPC
FPFF
F G F
G G G
P G F
F G G
P P P
C
F
GPP
PPP
P
F
FP
FP
P P F
F P P
GPp
PPPP
G GP PP P
P PP PP PP P
C F G
F P P
P G P
P P P
01
GG

Appendix C (continued)
CostPhysical Age Quality Construction Maintenance Needs Plans
Hazardous WasteTreatment facilities G F P n.a. n.a. F P
P = poorF = fairC = goodMDPW = Massachusetts Department of Public Works-- = not applicablen.a. = not available
SOURCE: Judgments made by research staff as to quality of data collected.
-

APPENDIX D
I Berkshire Regional Planning Commission2 FranklinCowilyDepaolmeniol PlanningS Lower PioneerVolley ReginnolPlnningC4 Monlachusell RcgionolPlonnibgCmis5 Ccnral Mossasannsqlls Regional Planning6 Norllsen Middlesex Arco Commission7 Menisnack Volley1Rgional Planning ConsR M.1-opolilnn Arso Plkniing Cooncil9 Old Colony Pluaiognh Coun6il
.10 So.dimeslern RegionolPIo.sing oindicone11 CopuCodPkn.i.,nas
1i Deoelopmenl Core
12 MuslIm's Vineya.d Ca.....isson13 N-Lat-cket n'l d niLs ans icossosic D.
Regional Planning Districts
* U N ITIECOMMUNITIES NOTipI~ .'Kat9- PARTICIPATING
Sion lrJ~~Commission .
smission
onc Developmeni Disirkinmission
velopseer Consisslon a�Z�Kq�

155
APPENDIX E
INTERVIEW GUIDELINESMASSACHUSETTS INFRASTRUCTURE STUDY
February 14, 1983
Type of Infrastructure
I. Background, history of the problem/system.
Get information pertinent to this study--history of development,some idea of the constraints under which the system operates.
II. Current Condition.
A. What is there in terms of the following:
1. Physical Plant?
2. Economic function within Commonwealth (only if available)?
3. Current annual maintenance expenditures
a. Most recent year?
b. Average annual increase or decrease (past 10 years)?
c. What is budgeted for 1984?
4. What is past capital investment? What is system worth?
B. What are the perceived present needs to keep the system ator to bring it up to "required" standards of performance?
1. Physical?
31-895 0 - 84 - 12

156
2. Capital costs?
a. Expected expenditures?
b. Expected/needed revenues?
C. Upgrade/Deterioriation
1. What is the physical condition of the system?
2. Is the system being upgraded or is it deteriorating?At what rate?
3. What would be the minimum investment necessary tostop deterioration?
4. What would be the minimum investment necessaryjust to maintain the status quo?
5. What is the fiscal capacity required to stop deterioration?

157
a. Is money to stop deterioration budgeted?
b. What are the expected revenues?
c. What are the sources of the expected revenues?
III. Needs
A. Short-run needs: 5-year plan
1. Needed maintenance for current and expanded facilities:
a. Physical?
b. Fiscal?
i. expected expenditures?
ii. expected revenues?

158
2. Expansion of system/facilities:
a. For population changes:
i. physical capacity?
ii. fiscal capacity?
b. For economic growth
i. physical capacity?
ii. fiscal capacity?
3. Stage of planning for these expansions?
a. Expected expenditures?
b. Projected revenues?
c. Sources?
B. Long-run needs to year 2000?

159
1. Needed maintenance for current and expanded facilities:
a. Physical
b. Fiscal
i. expected expenditures?
ii. expected revenues?
2. Expansion of system/facilities?
a. For population changes:
i. physical capacity?
ii. fiscal capacity?
b. For economic growth
i. physical capacity?

160
ii. fiscal capacity?
3. Stage of planning for these expansions?
a. Expected expenditures?
b. Projected revenues?
c. Sources?
each estimate obtained, ask:
How accurate are these actual or estimated data?
Ranges:
1. 0-10%
2. 11-25%
3. 26-50%
4. 51-100%
2. How are these estimates derived? Wherever possible, getwritten data sources, e.g., publications, to refer towhen writing report.
For
1.

161
3. Inflation factor-what is the base year of these estimates?
4. What are the major constraints on planning and implementationof these/this project? (fiscal, political, environmental)

162
. Interviewee
'Position
Address
Phone Number
Interviewer
Date
Others who can assist
.

163
LIST OF REFERENCES
Louis Berger and Associates, Inc. 1980. New England Ports and HarborsProgram: Inventory of Existing Port Facilities. New Jersey.
Bewick, John A. 1979. "Questionnaire to Document Extent of A.ed inMassachusetts." (April).
Byrd, Tallamy, MacDonald, and Lewis. 1982. A Report to the MassachusettsSpecial Commission on Highways. Virginia (April).
Central Transportation Planning Staff. 1979. Plan Refinement Study FinalReport (Commuter Rail Improvement Program) (January).
Central Transportation Planning Staff. 1982a. Transportation ImprovementProgram, 1982-1986. (January 31).
Central Transportation Planning Staff. 1982b. Transportation Plan forthe Boston Region, FY 1982 (June).
Comptroller General, Report to the Congress of the United States. 1980."Additional Federal Aid for Urban Water Distribution Systems ShouldWait Until Needs are Clearly Established." CED-81-17 (November 24).
Downs, Margaret, Abigail Egan, David Merkowitz, and Arthur Magida. 1982.Building A Water Policy Concensus: Key Issues for the Eighties.Washington, DC: Northeast-Midwest Institute (June).
Flynn, Robert. 1983. "Memorandum," Northern Middlesex Area Commission(April).
Fogarty, Bill. 1983. "Facing Up to Our Hazardous Waste Dilemma,"Professional Engineer (Spring).
Joint Center for Urban Studies of the Massachusetts Institute ofTechnology and Harvard University. 1983. "MassachusettsInfrastructure Study: Survey Questionnaire."
Masnick, George, and John Pitkin. 1982. "Cohort Projections ofSchool-Age Populations for States and Regions: 1985 to 2000."Cambridge, MA: MIT-Harvard Joint Center For Urban Studies.
Massachusetts Laws of the Commonwealth. 1979. Ch. 21, Sec. C (West).
Massachusetts Aeronautics Commission. 1980. Massachusetts Airport SystemPlan. Boston, MA (November).
Massachusetts Bay Transportation Authority. 1981a. Commuter Rail SummarySheet (November 16).
Massachusetts Bay Transportation Authority. 1981b. Commuter RailroadOperation Study. 3 Volumes (June 15).
Massachusetts Bay Transportation Authority. 1982a. Annual Report 1981.

164
Massachusetts Bay Transportation Authority. 1982b. Budget 1983/FY1984(October 1).
Massachusetts Bay Transportation Authority. 1982c. "DepreciationSchedule, June 30, 1981 to June 30, 1982."
Massachusetts Bay Transportation Authority. 1982d. Rail Equipment 1983 &FY1984 Budget Request (August 6).
Massachusetts Bay Transportation Authority. 1982e. "Railroad/HighwayGrade Crossing Projects (1982-1983)," Summary Sheet (Revised).
Massachusetts Bay Transportation Authority. 1982f. Title VI Assessmentfor Capital and Operating Assistance (December).
Massachusetts Bay Transportation Authority. 1983a. "Track and StructuresReport."
Massachusetts Bay Transportation Authority. 1983b. "Federal FundingSummary Sheet."
Massachusetts Bay Transportation Authority. 1983c. Management Report(January 21).
Massachusetts Bay Transportation Authority. 1983d. "1983 Commuter RailImprovements to Existing Services Program."
Massachusetts Bay Transportation Authority. 1983e. "Railroad OperationsDirectorate."
Massachusetts Bay Transportation Authority. 1983f. "$10 Million BondProgram." Exhibit B.
Massachusetts Bay Transportation Authority. 1983g. "Treasurer's OfficeDepartment Costs." (Summary).
Massachusetts Department of Environmental Management, Bureau of SolidWaste Disposal. 1982. "Hazardous Waste Management in Massachusetts:1982 Statewide Environmental Impact Report." Boston, MA (August).
Massachusetts Department of Environmental Quality Engineering, Division ofHazardous Wastes. 1982. "A Listing of Firms which have been Licensedto Collect, Store, and/or Dispose of Hazardous Waste inMassachusetts." Boston, MA (December).
Massachusetts Department of Environmental Quality Engineering, Division ofWater Pollution Control. 1980. "Wastewater Treatment Facilities."Boston, MA.
Massachusetts Department of Environmental Quality Engineering, Division ofWater Pollution Control. 1982. "Federal Construction Grants ProjectPriority List for Fiscal Year 1983." Boston, MA.

165
Massachusetts Department of Environmental Quality Engineering, Division ofWater Pollution Control. 1983a. "Memorandum: Boston HarborClean-Up." Boston, MA (February).
Massachusetts Department of Environmental Quality Engineering, Division ofWater Supply, 1983b. "Leak Detection Grants (Summary Sheet)."Boston, MA (January).
Massachusetts Department of Environmental Quality Engineering, Division ofWater Supply. 1983c. "System Rehabilitation." Boston, MA (January).
Massachusetts Department of Public Works. 1983. "Computer Printout:Rail Bridges and Tunnels." (April 15).
Massachusetts Division of Water Pollution Control. 1980. "WastewaterTreatment Facilities."
Massachusetts Executive Office of Transportation and Construction. 1977.Technical Supplement to the PMT, Vol. II (April).
Massachusetts Executive Office of Transportation and Construction. 1981.State Rail Plan 1980 Update (February).
Massachusetts Executive Office of Transportation and Construction. 1982a.Regional Transit Authority Operations Report 1981-1982.
Massachusetts Executive Office of Transportation and Construction. 1982b.State Rail Plan 1981-1982 Update (November).
Massachusetts Legislature. 1979. Massachusetts Acts 805.
Massachusetts Legislature. 1982. Massachusetts Acts 286.
Massachusetts Port Authority. 1981. The Port of Boston: A MaritimeStrategy. Boston, MA.
Massachusetts Senate, Committee on Ways and Means. 1982a. "BudgetRecommendations, Fiscal Year 1983: Policy Report 2, Management ofWater Resources." Senate No. 1900, Boston, MA.
Massachusetts Senate, Committee on Ways and Means. i982b. "Memorandum,Chapter 286 of the Acts of 1982." Boston, MA.
Massachusetts Special Legislative Commission on the Adequacy of WaterSupply in the Commonwealth. 1979. "Report." House No. 5596.Boston, MA.
Massachusetts Special Legislative Commission on Water Supply. 1982."Memorandum, Chapter 286, 1982." Boston, MA (July).
Massachusetts Turnpike Authority. 1981. Annual Report. Boston, MA.

166
Massachusetts Water Resources Commission, Division of Water Resources.1982a. "Analysis of the Water Resources of the Commonwealth."Boston, MA (June).
Massachusetts Water Resources Commission, Division of Water Resources,1982b. "Massachusetts Water Supply Systems: Source of Supply, SafeYield, Type of Supply, Proposed Sources." Boston, MA (June).
Metropolitan District Commission. 1975. the EMMA Plan for Water andWastewater.
Metropolitan District Commission. 1981. Annual Report, Fiscal YearEnding June 30, 1981. Boston, MA.
New England River Basin Commission. 1981a. Harbor Management Strategiesfor New England. Boston, MA.
New England River Basin Commission. 1981b. Prospects and Strategies forNew England Ports. Boston, MA.
The Nova Institute. 1979a. The Northeast Water Resources Project, VolumeI: Water Resource Priorities for the Northeast. Prepared for theConsortium of Northeast Organizations. New York, NY (September).
The Nova Institute. 1979b. The Northeast Water Resources Project, VolumeIII: The Economic Impact of Water Projects. Prepared for theConsortium of Northeast Organizations. New York, NY (September).
Old Colony Planning Council. 1983. "Response to MassachusettsInfrastructure Study Questionnaire."
The President's Intergovernmental Water Policy Task Force, Subcommittee onUrban Water Supply. 1980. "Urban Water Systems: Problems andAlternative Approaches to Solutions." Washington, DC (June).
The Road Information Program. 1982. "An Analysis of the EconomicBenefits of a Highway Repair Program in Massachusetts." Washington,DC (August).
Southeastern Regional Planning and Economic Development District. 1983."Response to Massachusetts Infrastructure Study Questionnaire."
Tabors, Richard D. 1979. "Utility Services." In The Practice of LocalGovernment Planning, edited by Frank S. So, Israel Stollman, FrankBeal, and David S. Arnold., International City ManagementAssociation. Washington, DC.
U.S. Bureau of the Census. 1982. 1980 Census of Population. Volume 1,Characteristics of the Population, Chapter B. General PopulationCharacteristics Part 23, Massachusetts. PC30-1-B23 (June).
U.S. Congress. 1974. Clean Water Act. PL92-500.

167
U.S. Department of Transportation, Federal Highway Administration. 1979.Recording and Coding Guide for the Structure Inventory and Appraisalof the Nation's Bridges. Washington, DC (January).
U.S. Environmental Protection Agency, Priority Needs Assessment Branch,Facility Requirements Division, Office of Water Program Operations.1982. 1982 Needs Survey: Cost Estimates for Construction ofPublicly-Owned Wastewater Treatment Facilities. Washington, DC(December).
Wallace, Floyd, Ellenzweig, Moore, Inc. 1978. "Massachusetts WaterSupply Policy Statement." Prepared for the Commonwealth ofMassachusetts, Executive Office of Environmental Affairs. Cambridge,MA (May).
0