Embed Size (px)
Citation preview

1
Brookhart et al. (2016) A Century of Grading Research
A Century of Grading Research: Meaning and Value in the Most Common Educational Measure
1
Susan M. Brookhart
Duquesne University
Thomas R. Guskey University of Kentucky
Alex J. Bowers Teachers College,
Columbia University
James H. McMillan Virginia Commonwealth
University
Jeffrey K. Smith University of Otago
Lisa F. Smith University of Otago
Michael T. Stevens University of
California at Davis
Megan E. Welsh University of
California at Davis
ABSTRACT:1
Grading refers to the symbols assigned to individual pieces
of student work or to composite measures of student
performance on report cards. This review of over 100
years of research on grading considers five types of
studies: (a) early studies of the reliability of grades, (b)
quantitative studies of the composition of K-12 report card
grades, (c) survey and interview studies of teachers’
perceptions of grades, (d) studies of standards-based
grading, and (e) grading in higher education. Early 20th
century studies generally condemned teachers’ grades as
unreliable. More recent studies of the relationships of
grades to tested achievement and survey studies of
teachers’ grading practices and beliefs suggest that grades
assess a multidimensional construct containing both
cognitive and non-cognitive factors reflecting what
teachers value in student work. Implications for future
research and for grading practices are discussed.
Keywords: grading, classroom assessment, educational
measurement
Grading refers to the symbols assigned to individual pieces
of student work or to composite measures of student
performance on student report cards. Grades or marks, as
they were referred to in the first half of the 20th century,
were the focus of some of the earliest educational research.
Grading research history parallels the history of
educational research more generally, with studies
becoming both more rigorous and sophisticated over time.
1 This document is a pre-print of this manuscript, published
in the journal Review of Educational Research. Citation:
Brookhart, S. M., Guskey, T. R., Bowers, A. J., McMillan,
J. H., Smith, J. K., Smith, L. F., Stevens, M.T., Welsh, M.
E. (2016). A Century of Grading Research: Meaning and
Value in the Most Common Educational Measure. Review
of Educational Research, 86(4), 803-848.
doi: 10.3102/0034654316672069
http://doi.org/10.3102/0034654316672069
Grading is important to study because of the centrality of
grades in the educational experience of all students.
Grades are widely perceived to be what students “earn” for
their achievement (Brookhart, 1993, p.139), and have
pervasive influence on students and schooling (Pattison,
Grodsky, & Muller, 2013). Furthermore, grades predict
important future educational consequences, such as
dropping out of school (Bowers, 2010a; Bowers & Sprott,
2012; Bowers, Sprott, & Taff, 2013), applying and being
admitted to college, and college success (Atkinson &
Geiser, 2009; Bowers, 2010a; Thorsen & Cliffordson,
2012). Grades are especially predictive of academic
success in more open admissions higher education
institutions (Sawyer, 2013).
Purpose of This Review and Research Question This review synthesizes findings from five types of grading
studies: (a) early studies of the reliability of grades on
student work, (b) quantitative studies of the composition of
K-12 report card grades and related educational outcomes,
(c) survey and interview studies of teachers’ perceptions of
grades and grading practices, (d) studies of standards-based
grading (SBG) and the relationship between students’
report card grades and large-scale accountability
assessments, and (e) grading in higher education. The
central question underlying all of these studies is “What do
grades mean?” In essence, this is a validity question (Kane,
2006; Messick, 1989). It concerns whether evidence
supports the intended meaning and use of grades as an
educational measure. To date, several reviews have given
partial answers to that question, but none of these reviews
synthesize 100 years of research from five types of studies.
The purpose of this review is to provide a more
comprehensive and complete answer to the research
question “What do grades mean?”
BACKGROUND: The earliest research on grading concerned mostly the
reliability of grades teachers assigned to students’ work.
The earliest investigation of which the authors are aware

2
Brookhart et al. (2016) A Century of Grading Research
was published in the Journal of the Royal Statistical
Society. Edgeworth (1888) applied the “Theory of Errors”
(p. 600) based on normal curve theory to the case of
grading examinations. He described three different sources
of error: (a) chance; (b) personal differences among
graders regarding the whole exam (severity or leniency and
speed) and individual items on the exam, now referred to
as task variation; and (c) “taking his [the examinee’s]
answers as representative of his proficiency” (p. 614), now
referred to as generalizing to the domain. In parsing these
sources of error, Edgeworth went beyond simple chance
variation in grades to treat grades as subject to multiple
sources of variation or error. This nuanced view, which
was quite advanced for its time, remains useful today.
Edgeworth pointed out the educational consequences of
unreliability in grading, especially in awarding diplomas,
honors and other qualifications to students. He used this
point to build an argument for improving reliability.
Today, the existence of unintended adverse consequences
is also an argument for improving validity (Messick,
1989).
During the 19th century, student progress reports were
presented to parents orally by the teacher during a visit to a
student’s home, with little standardization of content. Oral
reports were eventually abandoned in favor of written
narrative descriptions of how students were performing in
certain skills like penmanship, reading, or arithmetic
(Guskey & Bailey, 2001). In the 20th
century, high school
student populations became so diverse and subject area
instruction so specific that high schools sought a way to
manage the increasing demands and complexity of
evaluating student progress (Guskey & Bailey, 2001).
Although elementary schools maintained narrative
descriptions, high schools increasingly favored percentage
grades because the completion of narrative descriptions
was viewed as time-consuming and lacking cost-
effectiveness (Farr, 2000). One could argue that this move
to percentage grades eliminated the specific
communication of what students knew and could do.
Reviews by Crooks (1933), Smith and Dobbin (1960), and
Kirschenbaum, Napier, and Simon (1971) debated whether
grading should be norm- or criterion-referenced, based on
clearly defined standards for student learning. Although
high schools tended to stay with norm-referenced grades to
accommodate the need for ranking students for college
admissions, some elementary school educators transitioned
to what was eventually called mastery learning and then
standards-based education. Based on studies of grading
reliability (Kelly, 1914; Rugg, 1918), in the 1920’s
teachers began to adopt grading systems with fewer and
broader categories (e.g., the A–F scale). Still, variation in
grading practices persisted. Hill (1935) found variability
in the frequency of grade reports, ranging from 2–12 times
per year, and a wide array of grade reporting practices. Of
443 schools studied, 8 percent employed descriptive
grading, 9 percent percentage grading, 31 percent
percentage-equivalent categorical grading, 54 percent
categorical grading that was not percentage-equivalent, and
2 percent “gave a general rating on some basis such as
‘degree to which the pupil is working to capacity’” (Hill,
1935, p. 119). By the 1940s, more than 80 percent of U. S.
schools had adopted the A–F grading scale. A–F remained
the most commonly used scale until the present day.
Current grading reforms move in the direction of SBG, a
relatively new and increasingly common practice
(Grindberg, 2014) in which grades are based on standards
for achievement. In SBG, work habits and other non-
achievement factors are reported separately from
achievement (Guskey & Bailey, 2010).
METHOD: Literature searches for each of the five types of studies
were conducted by different groups of co-authors, using
the same general strategy: (a) a keyword search of
electronic databases, (b) review of abstracts against criteria
for the type of study, (c) a full read of studies that met
criteria, and (d) a snowball search using the references
from qualified studies. All searches were limited to
articles published in English.
To identify studies of grading reliability, electronic
searches using the terms “teachers’ marks (or marking)”
and “teachers’ grades (or grading)” were conducted in the
following databases: ERIC, the Journal of Educational
Measurement (JEM), Educational Measurement: Issues
and Practice (EMIP), ProQuest’s Periodicals Index Online,
and the Journal of Educational Research (JER). The
criterion for inclusion was that the research addressed
individual pieces of student work (usually examinations),
not composite report card grades. Sixteen empirical
studies were found (Table 1).
To identify studies of grades and related educational
outcomes, search terms included “(grades OR marks) AND
(model* OR relationship OR correlation OR association
OR factor).” Databases searched included JSTOR, ERIC,
and Educational Full Text Wilson Web. Criteria for
inclusion were that the study (a) examined the relationship
of K-12 grades to schooling outcomes, (b) used
quantitative methods, and (c) examined data from actual
student assessments rather than teacher perspectives on
grading. Forty-one empirical studies were identified
(Tables 2, 3, and 4).
For studies of K-12 teachers’ perspectives about grading
and grading practices, the search terms used were
“grade(s),” “grading,” and “marking” with “teacher
perceptions,” “teacher practices,” and “teacher attitudes.”
Databases searched included ERIC, Education Research
Complete, Dissertation Abstracts, and Google Scholar.

3
Brookhart et al. (2016) A Century of Grading Research
Table 1
Early Studies of the Reliability of Grades
Study Method Sample Main Findings
Ashbaugh
(1924)
Descriptive
statistics
55 seniors and grad students
in Education grading 1 7th
grade arithmetic paper
Grading the same paper on 3 occasions, the mean remained
constant but the distribution narrowed
Grader inconsistency over time; grades more variable on
occasion 2 than occasion 3
After presenting results to the class and discussing the problems
and the student’s work, graders devised a point scheme for each
problem and grading variability decreased
Bolton
(1927)
Descriptive
statistics
22 6th
grade teachers of
arithmetic in one district,
grading 24 papers
Teachers are consistent with one another in their ratings
Average deviation was 5.1 (out of 100)
Greater variability for lowest-quality work (level of work as a
source of variation)
Brimi (2011) Descriptive
statistics
73 English teachers grading
one essay Range of scores was 46 points and covered all five letter grade
levels (ABCDF)
Eells (1930) Intra-rater
reliability;
correlation of
time 1 and time
2, 11-week
interval
61 teachers in a
measurement course,
grading 3 elementary
geography and 2 history
questions
Teacher inconsistency over time a major source of variation
Estimated reliability ranged from 0.25 to 0.51
Variability lowest for one very poor paper (level of work as a
source of variation)
Healy (1935) Descriptive
statistics
175 sixth grade
compositions from 50
different teachers, one each
of Excellent, Superior,
Average, Poor, Failure, re-
analyzed by trained judges
Format and usage errors weighed more heavily in teachers’
grades than the quality of ideas (relative emphasis of criteria as
a source of variation in grades)

4
Brookhart et al. (2016) A Century of Grading Research
Hulten
(1925)
Intra-rater
reliability;
descriptive
statistics for time
1 and time 2, 2-
month interval
30 English teachers grading
5 compositions Teacher inconsistency over time
20% of compositions changed from pass to fail or vice versa on
the second marking
Jacoby
(1910)
Descriptive
statistics
6 astronomy professors
marking 11 exams Little variability in grades
Student work quality was high
Lauterbach
(1928)
Descriptive
statistics
57 teachers grading 120
papers (30 papers per
teacher, half handwritten
and half typed)
Student work quality was a source of variation in grades
In absolute terms, there was much variation by teacher for each
paper
In relative terms, teachers’ marks reliably ranked students
Shriner
(1930)
Descriptive
statistics
25 high school English
teachers and 25 algebra
teachers, grading 25 exams
each (English and algebra,
respectively)
Teachers’ grading was reliable
Median correlations of each teacher’s grade with the average
grade for each paper were .946 (algebra) and .917 (English)
Greater teacher variability in grades for the poorer papers
Silberstein
(1922)
Descriptive
statistics
31 teachers grading 1
English paper that originally
passed in high school (73%)
but failed by Regents (59%)
When teachers re-graded the same paper, they changed their
grade
Variation in scores on individual questions on the exam were
very variable and explained the overall grading variation, except
for one question about syntax, where grades were more uniform
Sims (1933) Descriptive
statistics
reanalysis of four data sets:
21 teachers grading 24
arithmetic papers; 25
teachers grading 25 algebra
papers; 25 teachers grading
25 high school English
exams; and 9 readers
grading 20 psychology
exams
Two kinds of variability in teachers’ grades: (a) differences in
students’ work quality, and (b) “differences in the standards of
grading found among school systems and among teachers
within a system” (p. 637)
Teacher variability in assigning grades was large
Variability in marks was reduced by converting scores to grades

5
Brookhart et al. (2016) A Century of Grading Research
Starch (1913) Descriptive
statistics
10 instructors grading 10
freshman English exams Teacher variability was large, and largest for the two poorest
papers
Isolated four sources of variation and reported probable error (p.
632, total probable error=5.4 out of 100): 1) Differences among
the standards of different schools (probable error almost 0), (2)
Differences among the standards of different teachers (pe=1.0),
(3) Differences in the relative values placed by different
teachers upon various elements in a paper, including content
and form (pe=2.1), and (4) Differences due to the pure inability
to distinguish between closely allied degrees of merit (pe=2.2).
Starch (1915) Descriptive
statistics
12 teachers grading 24 6th
and 7th
grade compositions Average teacher variability of 4.2 (out of 100) was reduced to
2.8 by forcing a normal distribution using a 5-category scale
(Poor, Inferior, Medium, Superior, and Excellent)
Starch and
Elliott (1912)
Descriptive
statistics
142 high school English
teachers grading 2 exams Teacher variability in assigning grades was large (a range of 30-
40 out of 100 points, probable error of 4.0 and 4.8, respectively)
Teacher variability in the relative sense, as well
Starch and
Elliott
(1913a)
Descriptive
statistics
138 high school
mathematics teachers
grading 1 geometry exam
Teacher variability was larger than for the English papers in
Starch and Elliott (1912): probable error of 7.5
Grade for 1 answer varies about as widely as composite grade
for the whole exam
Starch and
Elliott
(1913b)
Descriptive
statistics
122 high school history
teachers grading 1 exam Teacher variability was larger than for the English or math
exams (Starch & Elliott, 1912, 1913a): probable error of 7.7
Concluded that variability isn’t due to subject, but “the
examiner and method of examination” (p. 680)

6
Brookhart et al. (2016) A Century of Grading Research
Criteria for inclusion were that the study topic was K-12
teachers’ perceptions of grading and grading practices and
were published since 1994 (the date of Brookhart’s
previous review). Thirty-five empirical studies were found
(31 are presented in Table 5, and four that investigated
SBG are in Table 6).
The search for studies of standards-based grading used the
search terms “standards” and (“grades” or “reports) and
“education.” Databases searched included Psychinfo,
Psycharticles, ERIC, and Education Source. The criterion
for inclusion was that articles needed to address SBG.
Eight empirical studies were identified (Table 6).
For studies of grading in higher education, search terms
included “grades” or “grading,” combined with
“university,” “college,” and “higher education” in the title.
Databases searched included EBSCO Education Research
Complete, ERIC, and ProQuest (Education Journals). The
inclusion criterion was that the study investigated grading
practices in higher education. University websites in 12
different countries were also consulted to allow for
international comparisons. Fourteen empirical studies
were found (Table 7).
RESULTS: Summaries of results from each of the five types of studies,
along with tables listing those results, are presented in this
section. The Discussion section that follows synthesizes
the findings and examines the meaning of grades based on
that synthesis.
Grading Reliability Table 1 displays the results of studies on the reliability of
teachers’ grades. The main finding was that great variation
exist in the grades teachers assign to students’ work
(Ashbaugh, 1924; Brimi, 2011; Eells, 1930; Healy, 1935;
Hulten, 1925; Kelly, 1914; Lauterbach, 1928; Rugg, 1918;
Silberstein, 1922; Sims, 1933; Starch, 1913, 1915; Starch
& Elliott, 1912, 1913a,b). Three studies (Bolton, 1927;
Jacoby, 1910; Shriner, 1930) argued against this
conclusion, however, contending that teacher variability in
grading was not as great as commonly suggested.
As the work of Edgeworth (1888) previewed, these studies
identified several sources of the variability in grading.
Starch (1913), for example, determined that three major
factors produced an average probable error of 5.4 on a 100-
point scale across instructors and schools. Specifically,
“Differences due to the pure inability to distinguish
between closely allied degrees of merit” (p. 630)
contributed 2.2 points, “Differences in the relative values
placed by different teachers upon various elements in a
paper, including content and form” (p. 630) contributed 2.1
points, “Differences among the standards of different
teachers” (p. 630) contributed 1.0 point. Although
investigated, “Differences among the standards of different
schools” (p. 630) contributed practically nothing toward
the total (p. 632).
Other studies listed in Table 1 identify these and other
sources of grading variability. Differences in grading
criteria, or lack of criteria, were found to be a prominent
source of variability in grades (Ashbaugh, 1924; Brimi,
2011; Eells, 1930; Healy, 1935; Silberstein, 1922), akin to
Starch’s (1913) difference in the relative values teachers
place on various elements in a paper. Teacher severity or
leniency was found to be another source of variability in
grades (Shriner, 1930; Silberstein, 1922; Sims, 1933),
similar to Starch’s differences in teachers’ standards.
Differences in student work quality were associated with
variability in grades, but the findings were inconsistent.
Bolton (1927), for example, found greater grading
variability for poorer papers. Similarly, Jacoby (1910)
interpreted his high agreement as a result of the high
quality of the papers in his sample. Eells (1930), however,
found greater grading consistency in the poorer papers.
Lauterbach (1928) found more grading variability for
typewritten compositions than for handwritten versions of
the same work. Finally, between-teacher error was a
central factor in all of the studies in Table 1. Studies by
Eells and Hulten (1925) demonstrated within-teacher
error, as well.
Given a probable error of around 5 in a 100-point scale,
Starch (1913) recommended the use of a 9-point scale (i.e.,
A+, A-, B+, B-, C+, C-, D+, D-, and F) and later tested the
improvement in reliability gained by moving to a 5-point
scale based on the normal distribution (Starch, 1915). His
and other studies contributed to the movement in the early
20th century away from a 100-point scale. The ABCDF
letter grade scale became more common and remains the
most prevalent grading scale in schools in the U.S today.
Grades and Related Educational Outcomes
Quantitative studies of grades and related educational
outcomes moved the focus of research on grades from
questions of reliability to questions of validity. Three
types of studies investigated the meaning of grades in this
way. The oldest line of research (Table 2) looked at the
relationship between grades and scores on standardized
tests of intelligence or achievement. Today, those studies
would be seen as seeking concurrent evidence for validity
under the assumption that graded achievement should be
the same as tested achievement (Brookhart, 2015). As the
20th century progressed, researchers added non-cognitive
variables to these studies, describing grades as
multidimensional measures of academic knowledge,
engagement, and persistence (Table 3). A third group of
more recent studies looked at the relationship between
grades and other educational outcomes, for example
dropping out of school or future success in school

7
Brookhart et al. (2016) A Century of Grading Research
Table 2
Studies of the Relation of K-12 Report Card Grades and Tested Achievement
Study Method Sample Main Findings
Brennan, Kim,
Wenz-Gross, and
Siperstein (2001)
Correlation 736 eighth-grade students Compared the Massachusetts MCAS standardized state reading
test scores to grades in mathematics, English, and science
r=0.54 to 0.59
Carter (1952) Correlation 235 high school students Grades and standardized algebra achievement scores r=0.52
Duckworth,
Quinn, and
Tsukayama
(2012)
Structural
Equation
Modeling
a) 1,364 ninth grade students
b) 510 eighth grade students Standardized reading and mathematics test scores compared
to GPA r=0.62 to 0.66
Engagement and persistence is mediated through teacher
evaluations of student conduct and homework completion
Duckworth and
Seligman (2006)
Correlation 140 eighth-grade students GPA and 2003 TerraNova Second Edition/California
Achievement Test; r=0.66
McCandless,
Roberts, and
Starnes (1972)
Correlation 433 seventh grade students Grades and Metropolitan Achievement Test scores r=0.31,
accounting for socio-economic status, ethnicity, and gender
Moore (1939) Correlation 200 fifth and sixth grade
students
Grades and Stanford Achievement Test r=0.61
Pattison,
Grodsky, and
Muller (2013)
Correlation U.S. Nationally representative
datasets of over 10,000
students each:
National Longitudinal
Study of the High School
Class of 1972 (NLS72)
High School and Beyond
sophomore cohort (HS&B)
National Educational
Longitudinal Study of 1988
(NELS)
Educational Longitudinal
High school GPA compared to reading (r=0.46 to 0.54) and
mathematics standardized tests (r=0.52 to 0.64)

8
Brookhart et al. (2016) A Century of Grading Research
Study of 2002 (ELS)
Unzicker (1925) Correlation 425 seventh through ninth
grade students
Average grades across English, mathematics and history
correlated 0.47 with the Otis intelligence test
Woodruff and
Ziomek (2004)
Correlation About 700,000 high schools
students each year, 1991–2003
Self-reported GPA and ACT composite scores r=0.56 to 0.58
Self-reported mathematics grades and ACT scores r=0.54 to
0.57
Self-reported English grades and ACT scores r=0.45 to 0.50

9
Brookhart et al. (2016) A Century of Grading Research
Table 3
Studies of K-12 Report Card Grades as Multidimensional Measures of Academic Knowledge, Engagement, and Persistence
Study Method Sample Main Findings
Bowers (2009) Multi-
dimensional
scaling
195 students high school
students
Grades were multidimensional, separating core subject and non-
core grades versus state standardized assessments in science
mathematics and reading and the ACT
Bowers (2011) Multi-
dimensional
scaling
4,520 high school students
from the Educational
Longitudinal Study of 2002
(ELS)
Three factor structure: (a) a cognitive factor that describes the
relationship between tests and core subject grades, (b) an
engagement factor between core subject grades and non-core
subject grades, and (c) a factor that described the difference
between grades in art and physical education
Casillas et al.
(2012)
Correlation;
Hierarchical
linear
modeling
4,660 seventh and eighth
graders
25% of the explained variance in GPAs was attributable the
standardized assessments. Academic discipline and commitment
to school were strongly related to GPA
Farkas, Grobe,
Sheehan, and
Shaun (1990)
Regression 486 eighth graders and their
teachers
Student work habits were the strongest non-cognitive predictors
of grades
Kelly (2008) Hierarchical
linear
modeling
1,653 sixth, seventh, and eighth
grade students
Positive and significant effects of students’ substantive
engagement on subsequent grades but no relationship with
procedural engagement
Klapp Lekholm
and Cliffordson
(2008)
Structural
Equation
Modeling
99,070 Swedish students Grades consisted of two major factors 1) a cognitive achievement
factor and s) a non-cognitive “common grade dimension”
Klapp Lekholm
and Cliffordson
(2009)
Klapp Lekholm
(2011)
Factor
Analysis;
Structural
Equation
Modelling
99,070 Swedish students Cognitive achievement factor of grades consists of student self-
perception of competence, self-efficacy, coping strategies, and
subject-specific interest. Non-cognitive factor consists of
motivation and a general interest in school

10
Brookhart et al. (2016) A Century of Grading Research
Miner (1967) Factor
Analysis
671 high school students Examined academic grades in first, third, sixth, ninth, and twelfth
grade; achievement tests in fifth, sixth, and ninth grades; and
citizenship grades in first, third, and sixth grades. A three factor
solution was identified: three factor solution: (a) objective
achievement, (b) behavior factor, and (c) high school
achievement as measured through grades.
Sobel (1936) Descriptive Not reported Students categorized into three groups based on comparing
grades and achievement test levels; grade-superior, middle-
group, mark-superior
Thorsen and
Cliffordson
(2012)
Structural
Equation
Modeling
All grade 9 students in Sweden,
99,085 (2003), 105,697 (2004),
108,753 (2005)
Generally replicated Klapp Lekholm and Cliffordson (2009)
Thorsen (2014) Structural
Equation
Modeling
3,855 students in Sweden Generally replicated Klapp Lekholm and Cliffordson (2009) in
examining norm-referenced grades
Willingham,
Pollack, and
Lewis (2002)
Regression 8,454 students from 581schools A moderate relationship between grades and tests was identified
as well as strong positive relationships between grades and
student motivation, engagement, completion of work assigned,
and persistence

11
Brookhart et al. (2016) A Century of Grading Research
Table 4
Studies of Grades as Predictors of Educational Outcomes
Study Method Sample Main Findings
Alexander,
Entwisle, and
Kabbani (2001)
Regression 301 grade 9 students Student background, grade retention, academic performance and
behavior strongly related to dropping out
Allensworth and
Easton (2007)
Descriptive;
Regression
24,894 first time ninth grades
students in Chicago
GPA and failing a course in early high school strongly predict
dropout
Allensworth,
Gwynne, Moore,
and de la Torre
(2014)
Descriptive;
Regression
19,963 grade 8 Chicago
students
Middle school grades and attendance are stronger predictors of
high school performance in comparison to test scores, and
middle school grades are a strong predictor of students on or off
track for high school success
Balfanz, Herzog,
and MacIver
(2007)
Regression 12,972 sixth grade students
from Philadelphia
Predictors of dropping out of high school included failing
mathematics or English, low attendance, a poor behavior
Barrington and
Hendricks (1989)
ANOVA;
Correlation
214 high school students GPA, number of low grades, intelligence test scores, and student
mobility significantly predicted dropout.
Bowers (2010a) Cluster
analysis
188 students tracked from
grade 1 through high school
Longitudinal low grade clusters across all types of course
subjects correlated with dropping out and not taking the ACT
Bowers (2010b) Regression 193 students tracked from
grade 1 through high school
Receiving low grades (D or F) and being retained in grade
strongly related to dropping out
Bowers and
Sprott (2012)
Growth
mixture
modeling
5400 grade 10 Education
Longitudinal Study of 2002
students
Non-cumulative GPA trajectories in early high school were
strongly predictive of dropping out
Bowers, Sprott,
and Taff (2013)
Receiver
operating
characteristic
analysis
110 dropout flags from 36
previous studies
Dropout flags focusing on GPA were some of the most accurate
dropout flags across the literature

12
Brookhart et al. (2016) A Century of Grading Research
Cairns, Cairns,
and Neckerman
(1989)
Cluster
analysis;
regression
475 grade 7 students Beyond student demographics, student aggressiveness and low
levels of academic performance associated with dropping out
Cliffordson
(2008)
Two-level
modeling
164,106 Swedish students Grades predict achievement in higher education more strongly
than SweSAT (Swedish Scholastic Aptitude Test), and criterion-
referenced grades predict slightly better than norm-referenced
grades
Ekstrom, Goertz,
Pollack, and
Rock (1986)
Regression High School and Beyond
survey, 30,000 high school
sophomores
Grades and problem behavior identified as the most important
variables for identifying dropping out, higher than test scores.
Ensminger and
Slusarcick
(1992)
Regression 1,242 first graders from
historically disadvantaged
community
Low grades and aggressive behavior related to eventually
dropping out, with low SES negatively moderating the
relationships.
Fitzsimmons,
Cheever,
Leonard, and
Macunovich
(1969)
Correlation 270 high school students Students receiving low grades (D or F) in elementary or middle
school were at much higher risk of dropping out.
Jimerson,
Egeland, Sroufe,
and Carlson
(2000)
Regression 177 children tracked from birth
through age 19
Home environment, quality of parent caregiving, academic
achievement, student problem behaviors, peer competence and
intelligence test scores significantly related with dropping out.
Lloyd (1978) Regression 1532 third grade students Dropping out significantly predicted with grades and marks
Morris, Ehren,
and Lenz (1991)
Correlation;
chi-square
785 in grades 7 through 12 Dropping out predicted by Absences, low grades (D or F),
mobility.
Roderick and
Camburn (1999)
Regression 27,612 Chicago ninth graders Examined significant predictors of course failure, including low
attendance, and found failure rates varied significantly at the
school level
Troob (1985) Descriptive 21,000 New York city high
school students
Low grades and high absences corresponded to higher levels of
dropping out

13
Brookhart et al. (2016) A Century of Grading Research
(Table 4). These studies offer predictive evidence for
validity under the assumption that grades measure school
success.
Correlation of grades and other assessments. Table 2
describes studies that investigated the relationship between
grades (usually grade-point average, GPA) and
standardized test scores in an effort to understand the
composition of the grades and marks that teachers assign to
K-12 students. Despite the enduring perception that the
correlation between grades and standardized test scores is
strong (Allen, 2005; Duckworth, Quinn, & Tsukayama,
2012; Stanley & Baines, 2004), this correlation is and
always has been relatively modest, in the .5 range. As
Willingham, Pollack, and Lewis (2002) noted:
Understanding these characteristics of grades is
important for the valid use of test scores as well as
grade averages because, in practice, the two
measures are often intimately connected… [there
is a] tendency to assume that a grade average and
a test score are, in some sense, mutual surrogates;
that is, measuring much the same thing, even in
the face of obvious differences (p.2).
Research on the relationship between grades and
standardized assessment results is marked by two major
eras: early 20th century studies and late 20th into 21st
century studies. Unzicker (1925) found that average
grades across subjects correlated .47 with intelligence test
scores. Ross and Hooks (1930) reviewed 20 studies
conducted from 1920 through 1929 on report card grades
and intelligence test scores in elementary school as
predictors of junior high and high school grades. Results
showed that the correlations between grades in seventh
grade and intelligence test scores ranged from .38 to .44.
Ross and Hooks concluded: Data from this and other studies indicate that the
grade school record affords a more reliable or
consistent basis of prediction than any other
available, the correlations in three widely-scattered
school systems showing remarkable stability; and
that without question the grade school record of the
pupil is the most usable or practical of all bases for
prediction, being available wherever cumulative
records are kept, without cost and with a minimum
expenditure of time and effort (p. 195).
Subsequent studies moved from correlating grades and
intelligence test scores to correlating grades with
standardized achievement results (Carter, 1952, r = .52;
Moore, 1939, r = .61). McCandless, Roberts, and Starnes
(1972) found a smaller correlation (r = .31) after
accounting for socio-economic status, ethnicity, and
gender. Although the sample selection procedures and
methods used in these early investigations are problematic
by current standards, they represent a clear desire on the
part of researchers to understand what teacher-assigned
grades represent in comparison to other known
standardized assessments. In other words, their focus was
criterion validity (Ross & Hooks, 1930).
Investigations from the late 20th century and into the 21st
century replicated earlier studies but included larger, more
representative samples and used more current standardized
tests and methods (Brennan, Kim, Wenz-Gross, &
Siperstein, 2001; Woodruff & Ziomek, 2004). Brennan
and colleagues (2001), for example, compared reading
scores from the Massachusetts MCAS state test to grades
in mathematics, English, and science and found
correlations ranging from .54 to .59. Similarly, using GPA
and 2003 TerraNova Second Edition/California
Achievement Tests, Duckworth and Seligman (2006)
found a correlation of .66. Subsequently, Duckworth et al.
(2012) examined standardized reading and mathematics
test scores to GPA and found correlations between .62 and
.66.
Woodruff and Ziomek (2004) compared GPA and ACT
composite scores for all high school students who took the
ACT college entrance exam between 1991 and 2003. They
found moderate but consistent correlations ranging from
.56 to .58 over the years for average GPA and composite
ACT scores, from .54 to .57 for mathematics grades and
ACT scores, and from .45 to .50 in English. Student GPAs
were self-reported, however. Pattison and colleagues
(2013) examined four decades of achievement data on tens
of thousands of students using national databases to
compare high school GPA to reading and mathematics
standardized tests. The authors found GPA correlations
consistent with past research, ranging from .52 to .64 in
mathematics and from .46 to .54 in reading
comprehension.
Although some variability exists across years and subjects,
correlations have remained moderate but remarkably
consistent in studies based on large, nationally-
representative datasets. Across 100 years of research,
teacher-assigned grades typically correlate about .5 with
standardized measures of achievement. In other words, 25
percent of the variation in grades teachers assign is
attributable to a trait comparable to the trait measured by
standardized tests (Bowers, 2011). The remaining 75
percent is attributable to something else. As Swineford
(1947) noted in a study on grading in middle and high
school, “the data [in the study] clearly show that marks
assigned by teachers in this school are reliable measures of
something but there is apparently a lack of agreement on
just what that something should be” (p.47) [author’s
emphasis]. A correlation of .5 is neither very weak—
countering arguments that grades are completely subjective
measures of academic knowledge; nor is it very strong—
refuting arguments that grades are a strong measure of

14
Brookhart et al. (2016) A Century of Grading Research
fundamental academic knowledge, and remains consistent
despite large shifts in the educational system, especially in
relation to accountability and standardized testing (Bowers,
2011; Linn, 1982).
Grades as multi-dimensional measures of academic
knowledge, engagement, and persistence. Investigations
of the composition of K-12 report card grades consistently
find them to be multidimensional, comprising minimally
academic knowledge, substantive engagement, and
persistence. Table 3 presents studies of grades and other
measures, including many non-cognitive variables. The
earliest study of this type, Sobel (1936) found that students
with high grades and low test scores had outstanding
penmanship, attendance, punctuality, and effort marks, and
their teachers rated them high in industry, perseverance,
dependability, co-operation, and ambition. Similarly,
Miner (1967) factor analyzed longitudinal data for a
sample of students, including their grades in first, third,
sixth, ninth, and twelfth grade; achievement tests in fifth,
sixth, and ninth grades; and citizenship grades in first,
third, and sixth grades. She identified a three-factor
solution: (a) objective achievement as measured through
standardized assessments, (b) early classroom citizenship
(a behavior factor), and (c) high school achievement as
measured through grades, demonstrating that behavior and
two types of achievement could be identified as separate
factors.
Farkas, Grobe, Sheehan, and Shaun (1990) showed that
student work habits were the strongest non-cognitive
predictors of grades. They noted: “Most striking is the
powerful effect of student work habits upon course
grades… teacher judgments of student non-cognitive
characteristics are powerful determinants of course grades,
even when student cognitive performance is controlled” (p.
140). Likewise, Willingham et al. (2002), using large
national databases, found a moderate relationship between
grades and tests as well as strong positive relationships
between grades and student motivation, engagement,
completion of work assigned, and persistence. Relying on
a theory of a conative factor of schooling—focusing on
student interest, volition, and self-regulation (Snow,
1989)—the authors suggested that grades provide a useful
assessment of both conative and cognitive student factors
(Willingham et al., 2002).
Kelly (2008) countered a criticism of the conative factor
theory of grades, namely that teachers may award grades
based on students appearing engaged and going through
the motions (i.e., a procedural form of engagement) as
opposed to more substantive engagement involving
legitimate effort and participation that leads to increased
learning. He found positive and significant effects of
students’ substantive engagement on subsequent grades but
no relationship with procedural engagement, noting “This
finding suggests that most teachers successfully use grades
to reward achievement-oriented behavior and promote a
widespread growth in achievement” (Kelly, 2008, p.45).
Kelly also argued that misperceptions that teachers do not
distinguish between apparent and substantive engagement
lends mistaken support to the use of high-stakes tests as
inherently more “objective” (p. 46) than teacher
assessments.
Recent studies have expanded on this work, applying
sophisticated methodologies. Bowers (2009, 2011) used
multi-dimensional scaling to examine the relationship
between grades and standardized test scores in each
semester in high school, in both core subjects
(mathematics, English, science, and social studies) and
non-core subjects (foreign/non-English languages, art, and
physical education). Bowers (2011) found evidence for a
three factor structure: (a) a cognitive factor that describes
the relationship between tests and core subject grades, (b) a
conative and engagement factor between core subject
grades and non-core subject grades (termed a “Success at
School Factor, SSF,” p. 154), and (c) a factor that
described the difference between grades in art and physical
education. He also showed that teachers’ assessment of
students’ ability to negotiate the social processes of
schooling represents much of the variance in grades that is
unrelated to test scores. This points to the importance of
substantive engagement and persistence (Kelly, 2008;
Willingham et al., 2002) as factors that help students in
both core and non-core subjects. Subsequently,
Duckworth et al. (2012) used structural equation modeling
(SEM) for 510 New York City fifth through eighth graders
to show that engagement and persistence is mediated
through teacher evaluations of student conduct and
homework completion.
Casillas and colleagues (2012) examined the
interrelationship among grades, standardized assessment
scores, and a range of psychosocial characteristics and
behavior. Twenty-five percent of the explained variance in
GPAs was attributable to the standardized assessments; the
rest was predicted by a combination of prior grades (30%),
psychosocial factors (23%), behavioral indicators (10%),
demographics (9%), and school factors (3%). Academic
discipline and commitment to school (i.e., the degree to
which the student is hard working, conscientious, and
effortful) had the strongest relationship to GPA.
A set of recent studies focused on the Swedish national
context (Cliffordson, 2008; Klapp Lekholm, 2011; Klapp
Lekholm & Cliffordson, 2008, 2009; Thorsen, 2014;
Thorsen & Cliffordson, 2012), which is interesting because
report cards are uniform throughout the country and
require teachers to grade students using the same
performance level scoring system used by the national
exam. Klapp Lekholm and Cliffordson (2008) showed that

15
Brookhart et al. (2016) A Century of Grading Research
grades consisted of two major factors: a cognitive
achievement factor and a non-cognitive “common grade
dimension” (p. 188). In a follow-up study, Klapp Lekholm
and Cliffordson (2009) reanalyzed the same data,
examining the relationships between multiple student and
school characteristics and both the cognitive and non-
cognitive achievement factors. For the cognitive
achievement factor of grades, student self-perception of
competence, self-efficacy, coping strategies, and subject-
specific interest were most important. In contrast, the most
important student variables for the non-cognitive factor
were motivation and a general interest in school. These
SEM results were replicated across three full population-
level cohorts in Sweden representing all 99,085 9th grade
students in 2003, 105,697 students in 2004, and 108,753 in
2005 (Thorsen & Cliffordson, 2012), as well as in
comparison to both norm-referenced and criterion-
referenced grading systems, examining 3,855 students in
Sweden (Thorsen, 2014). Klapp Lekholm and Cliffordson
(2009) wrote: The relation between general interest or motivation
and the common grade dimension seems to
recognize that students who are motivated often
possess both specific and general goals and
approach new phenomena with the goal of
understanding them, which is a student
characteristic awarded in grades (p. 19).
These findings, similar to those of Kelly (2008), Bowers
(2009, 2011), and Casillas et al. (2012), support the idea
that substantive engagement is an important component of
grades that is distinct from the skills measured by
standardized tests. A validity argument that expects grades
and standardized tests to correlate highly therefore may not
be sound because the construct of school achievement is
not fully defined by standardized test scores. Tested
achievement represents one dimension of the results of
schooling, privileging “individual cognition, pure
mentation, symbol manipulation, and generalized learning”
(Resnick, 1987, pp. 13-15).
Grades as predictors of educational outcomes.
Table 4 presents studies of grades as predictors of
educational outcomes. Teacher-assigned grades are well-
known to predict graduation from high school (Bowers,
2014), as well as transition from high school to college
(Atkinson & Geiser, 2009; Cliffordson, 2008).
Satisfactory grades historically have been used as one of
the means to grant students a high school diploma
(Rumberger, 2011). Studies from the second half of the
20th century and into the 21st century, however, have
focused on using grades from early grade levels to predict
student graduation rate or risk of dropping out of school
(Gleason & Dynarski, 2002; Pallas, 1989).
Early studies in this domain (Fitzsimmons, Cheever,
Leonard, & Macunovich, 1969; Lloyd, 1974, 1978; Voss,
Wendling, & Elliott, 1966) identified teacher-assigned
grades as one of the strongest predictors of student risk for
failing to graduate from high school. Subsequent studies
included other variables such as absence and misbehavior
and found that grades remained a strong predictor
(Barrington & Hendricks, 1989; Cairns, Cairns, & Necker,
1989; Ekstrom, Goertz, Pollack, & Rock, 1986;
Ensminger & Slusarcick, 1992; Finn, 1989; Hargis, 1990;
Morris, Ehren, & Lenz, 1991; Rumberger, 1987; Troob,
1985). More recent research using a life course
perspective showed low or failing grades have a
cumulative effect over a student’s time in school and
contribute to the eventual decision to leave (Alexander,
Entwisle, & Kabbani, 2001; Jimerson, Egeland, Sroufe, &
Carlson, 2000; Pallas, 2003; Roderick & Camburn, 1999).
Other research in this area considered grades in two ways:
the influence of low grades (Ds and Fs) on dropping out,
and the relationship of a continuous scale of grades (such
as GPA) to at-risk status and eventual graduation or
dropping out. Three examples are particularly notable.
Allensworth and colleagues have shown that failing a core
subject in ninth grade is highly correlated with dropping
out of school, and thus places a student off track for
graduation (Allensworth, 2013; Allensworth & Easton,
2005, 2007). Such failure also compromises the transition
from middle school to high school (Allensworth, Gwynne,
Moore, & de la Torre, 2014). Balfanz, Herzog, and
MacIver (2007) showed a strong relationship between
failing core courses in sixth grade and dropping out.
Focusing on modeling conditional risk, Bowers (2010b)
found the strongest predictor of dropping out after grade
retention was having D and F grades.
Few studies, however, have focused on grades as the sole
predictor of graduation or dropping out. Most studies
instead examine longitudinal grade patterns, using either
data mining techniques such as cluster analysis of all
course grades K-12 (Bowers, 2010a) or mixture modeling
techniques to identify growth patterns or decline in GPA in
early high school (Bowers & Sprott, 2012). A recent
review of the studies on the accuracy of dropout predictors
showed that along with the Allensworth Chicago on-track
indicator (Allensworth & Easton, 2007), longitudinal GPA
trajectories were among the most accurate predictors
identified (Bowers et al., 2013).
Teachers’ Perceptions of Grading and Grading
Practices
Systematic investigations of teachers’ grading practices
and perceptions about grading began to be published in the
1980s and were summarized in Brookhart’s (1994) review
of 19 empirical studies of teachers grading practices,
opinions, and beliefs. Five themes were supported. First,
teachers use measures of achievement, primarily tests, as

16
Brookhart et al. (2016) A Century of Grading Research
major determinants of grades. Second, teachers believe it
is important to grade fairly. Views of fairness included
using multiple sources of information, incorporating effort,
and making it clear to students what is assessed and how
they will be graded. This suggests teachers consider
school achievement to include the work students do in
school, not just the final outcome. Third, in 12 of the
studies teachers included non-cognitive factors in grades,
including ability, effort, improvement, completion of work,
and, to a small extent, other student behaviors. Fourth,
grading practices are not consistent across teachers, either
with respect to purpose or the extent to which non-
cognitive factors are considered, reflecting differences in
teachers’ beliefs and values. Finally, grading practices
vary by grade level. Secondary teachers emphasize
achievement products, such as tests; whereas, elementary
teachers use informal evidence of learning along with
achievement and performance assessments. Brookhart’s
(1994) review demonstrated an upswing in interest in
investigating grading practices during this period, in which
performance-based and portfolio classroom assessment
was emphasized and reports of the unreliability of
teachers’ subjective judgments about student work also
increased. The findings were in accord with policy-
makers’ increasing distrust of teachers’ judgments about
student achievement.
Teachers’ reported grading practices. Empirical studies
of teachers’ grading practices over the past twenty years
have mainly used surveys to document how teachers use
both cognitive and non-cognitive evidence, primarily
effort, and their own professional judgment in determining
grades. Table 5 shows most studies published since
Brookhart’s 1994 review document that teachers in
different subjects and grade levels use “hodgepodge”
grading (Brookhart, 1991, p. 36), combining achievement,
effort, behavior, improvement, and attitudes (Adrian, 2012;
Bailey, 2012; Cizek, Fitzgerald, & Rachor, 1995; Cross &
Frary, 1999; Duncan & Noonan, 2007; Frary, Cross, &
Weber, 1993; Grimes, 2010; Guskey, 2002, 2009b;
Imperial, 2011; Liu, 2008a; Llosa, 2008; McMillan, 2001;
McMillan & Lawson, 2001; McMillan, Myran, &
Workman, 2002; McMillan & Nash, 2000; Randall &
Engelhard, 2009, 2010; Russell & Austin, 2010; Sun &
Cheng, 2013; Svennberg, Meckbach, & Redelius, 2014;
Troug & Friedman, 1996; Yesbeck, 2011). Teachers’
often make grading decisions with little school or district
guidance.
Teachers distinguish among non-achievement factors in
grading. They view “academic enablers” (McMillan,
2001, p. 25), including effort, ability, work habits,
attention, and participation, differently from other non-
achievement factors, such as student personality and
behavior. McMillan, consistent with earlier research,
found that academic performance and academic enablers
were by far most important in determining grades. These
findings have been replicated (Duncan & Noonan, 2007;
McMillan et al., 2002). In a qualitative study, McMillan
and Nash (2000) found that teaching philosophy and
judgments about what is best for students’ motivation and
learning contributes to variability of grading practices,
suggesting that an emphasis on effort, in particular,
influences these outcomes. Randall and Engelhard (2010)
found that teacher beliefs about what best supports students
are important factors in grading, especially using non-
cognitive factors for borderline grades, as Sun and Cheng
(2013) also found with a sample of Chinese secondary
teachers. These studies suggest that part of the reason for
the multidimensional nature of grading reported in the
previous section is that teachers’ conceptions of “academic
achievement” include behavior that supports and promotes
academic achievement, and that teachers evaluate these
behaviors as well as academic content in determining
grades. These studies also showed significant variation
among teachers within the same school. That is, the
weight that different teachers give to separate factors can
vary a great deal within a single elementary or secondary
school (Cizek et al., 1995; Cross & Frary, 1999; Duncan &
Noonan, 2007; Guskey, 2009b; Troug & Friedman, 1996;
U.S. Department of Education, 1999; Webster, 2011).
Teacher perceptions about grading. Compared to the
number of studies about teachers’ grading practices,
relatively few studies focus directly on perceptual
constructs such as importance, meaning, value, attitudes,
and beliefs. Several studies used Brookhart’s (1994)
suggestion that Messick’s (1989) construct validity
framework is a reasonable approach for investigating
perceptions. This focuses on both the interpretation of the
construct (what grading means) and the implications and
consequences of grading (the effect it has on students).
Sun and Cheng (2013) used this conceptual framework to
analyze teachers’ comments about their grading and the
extent to which values and consequences were considered.
The results showed that teachers interpreted good grades as
a reward for accomplished work, based on both effort and
quality, student attitude toward achievement as reflected by
homework completion, and progress in learning. Teachers
indicated the need for fairness and accuracy, not just
accomplishment, saying that grades are fairer if they are
lowered for lack of effort or participation, and that grading
needs to be strict for high achievers. Teachers also
considered consequences of grading decisions for students’
future success and feelings of competence.
Fairness in an individual sense is a theme in several studies
of teacher perceptions of grades (Bonner & Chen, 2009;
Grimes, 2010; Hay & MacDonald, 2008; Kunnath, 2016;
Sun & Cheng, 2013; Svennberg et al., 2014; Tierney,
Simon, & Charland, 2011). Teachers perceive grades to
have value according to what they can do for individual

17
Brookhart et al. (2016) A Century of Grading Research
Table 5
Studies of Teachers’ Grading Practices and Perceptions
Study Method Sample Main Findings
Adrian
(2012)
Mixed methods 86 elementary teachers Approximately 20% of teachers thought that effort, behavior, and
homework should be included in standards-based grading
Few thought that it was not appropriate to reduce grades for late
assignments
Bailey
(2012)
Survey;
descriptive
307 secondary teachers Teachers used a variety of factors in grading, with social studies and
male teachers emphasizing effort more than other groups, science
teachers emphasizing effort least, and female teachers emphasizing
behavior more than male teachers
Bonner and
Chen (2008)
Survey;
scenarios;
descriptive
222 teacher candidates Grading perceptions, based on instructional style, focused on equity,
consistency, accuracy, and fairness, using non-achievement factors to
obtain highest grades possible
Cizek,
Fitzgerald,
and Rachor
(1995)
Survey;
descriptive
143 elementary and
secondary teachers With few differences based on grade level or years of experience,
teachers used both objective and subjective factors, synthesizing
information to enhance the likelihood of achieving high grades.
Significant diversity in grading practices
Little awareness of district grading policies
Cross and
Frary (1999)
Survey;
descriptive
307 middle and high
school teachers Teachers variously combined achievement, effort, behavior,
improvement, and attitudes to assign grades, and reported that
“ideal” grading should include non-cognitive factors
Most teachers agreed that effort, conduct and achievement should
be reported separately
Duncan and
Noonan
(2007)
Survey; factor
analysis
77 high school math
teachers Achievement and academic enabling factors, such as effort and
ability, were identified as most important for grading, with
significant variation among teachers
Non-achievement factors considered by most teachers
Frame of reference for grading was mixed; mostly criterion-
referenced, some self-referenced based on improvement, some

18
Brookhart et al. (2016) A Century of Grading Research
norm-referenced
Frary, Cross,
and Weber
(1993)
Survey;
descriptive
536 secondary teachers Up to 70% of teachers agreed that ability, effort, and improvement
should be used for grading
Grimes
(2010)
Survey;
descriptive
199 middle school
teachers
Grades should be based on both achievement and non-achievement
factors, including improvement, mastery, and effort
Guskey
(2002)
Survey;
descriptive
94 elementary and 112
secondary teachers 70% of teachers reported an ideal grade distribution of 41% As,
29%Bs, and 19% Cs, but with significant variation
Teachers wanted students to obtain the highest grade possible
Highest ranked purpose was to communicate to parents, then to use
as feedback to students
Multiple factors used to determine grades, including homework,
effort, and progress
Guskey
(2009b)
Survey;
descriptive
513 elementary and
secondary teachers. Significant variation in grading practices and issues were reported
Most agreed learning occurs without grading
50% averaged multiple scores to determine grades
73% based grades on criteria, not norm
Grades used for communication with students and parents
Hay and
MacDonald
(2008)
Interviews and
observations
Two high school
teachers
Teachers’ values and experience influenced internalization of criteria
important for grading, resulting in varied practices
Imperial
(2011)
Survey;
descriptive
411 high school
teachers Teachers reported a wide variety of grading practices; whereas the
primary purpose was to indicate achievement, about half used non-
cognitive factors
Grading was unrelated to training received in recommended
grading practices
Kunnath
(2016)
Mixed methods 251 high school
teachers Teachers used both objective achievement results and subjective
factors in grading
Teachers incorporated individual circumstances to promote the
highest grades possible
Grading was based on teachers’ philosophy of teaching

19
Brookhart et al. (2016) A Century of Grading Research
Liu (2008a) Survey;
multivariate
analyses
52 middle and 55 high
school teachers
Most teachers used effort, ability, and attendance/participation in
grading, with few differences between grade levels
40% used classroom behavior
90% used effort
65% used ability
75% used attendance/participation
Liu (2008b) Survey; factor
analysis
300 middle and high
school teachers
Six components in grading were confirmed: importance/value,
feedback for motivation, instruction, and improvement,
effort/participation, ability and problem solving, comparisons/extra
credit, and grading self-efficacy/ease/confidence/accuracy
Llosa (2008) Survey; factor
analysis; verbal
protocol analysis
1,224 elementary
teachers While showing variations in interpreting English proficiency
standards, teachers’ grading supported valid summative judgments
though weak formative use for improving instruction
Teachers incorporated student personality and behavior in grading
McMillan
(2001)
Survey;
descriptive;
factor analysis
1,483 middle and high
school teachers Significant variation in weight given to different factors, with a
high percentage of teachers using non-cognitive factors
Four components of grading were identified: academic enabling
non-cognitive factors, achievement, external comparisons, use of
extra credit, with significant variation among teachers
McMillan
and Lawson
(2001)
Survey;
descriptive
213 secondary science
teachers
Teachers reported use of both cognitive and non-cognitive factors in
grading, especially effort
McMillan,
Myran, and
Workman
(2002)
Survey; factor
analysis
901elementary school
teachers Five components were confirmed, including academic enablers
such as improvement and effort, extra credit, achievement,
homework, and external comparisons
70% indicated use of effort, improvement and ability
No differences between math and language arts teachers
High variability in how much different factors are weighted

20
Brookhart et al. (2016) A Century of Grading Research
McMillan
and Nash
(2000)
Interviews 24 elementary and
secondary math and
English teachers
Found that teaching philosophy and student effort that improves
motivation and learning were very important considerations for
grading
Randall and
Engelhard
(2009)
Survey;
scenarios;
descriptive;
Rasch modeling
800 elementary, 800
middle, and 800 high
school teachers
Achievement was the most important factor; effort and behavior
provided as feedback; little emphasis on ability
Randall and
Engelhard
(2010)
Survey;
scenarios;
descriptive
79 elementary, 155
middle, and 108 high
school teachers
Achievement was the most important factor; use of effort and
classroom behavior for borderline cases
Russell and
Austin
(2010)
Survey;
descriptive
352 secondary music
teachers Non-cognitive factors, such as performance/skill,
attendance/participation, attitude, and practice/effort weighted as
much or more than achievement.
In high school there was a greater emphasis on attendance; middle
school more on practice.
Simon,
Tierney,
Forgette-
Giroux,
Charland,
Noonan, and
Duncan
(2010)
Case study One high school math
teacher
Found standardized grading policies conflicted with professional
judgments
Sun and
Cheng
(2013)
Survey
scenarios;
descriptive
350 English language
secondary teachers Found emphasis on individualized use of grades for motivation and
extensive use of non-cognitive factors and fairness, especially for
borderline grades and for encouragement and effort attributions to
benefit students
Teachers placed more emphasis on non-achievement factors, such
as effort, homework and study habits, than achievement

21
Brookhart et al. (2016) A Century of Grading Research
Svennberg,
Meckbach,
and Redelius
(2014)
Interviews Four physical education
teachers
Identified knowledge/skills, motivation, confidence, and interaction
with others as important factors
Tierney,
Simon, and
Charland
(2011)
Mixed methods 77 high school math
teachers Most teachers believed in fair grading practices that stressed
improvement, with little emphasis on attitude, motivation, or
participation, with differences individualized to students
Effort was considered for borderline grades
Troug and
Friedman
(1996)
Mixed methods 53 high school teachers Found significant variability in grading practices and use of both
achievement and non-achievement factors
Webster
(2011)
Mixed methods 42 high school teachers Teachers reported multiple purposes and inconsistent practices while
showing a clear desire to focus most on achievement consistent with
standards
Wiley (2011) Survey;
scenarios;
descriptive
15 high school teachers Teachers varied in how much non-achievement factors were used
for grading
Found greater emphasis on non-achievement factors, especially
effort for low ability or low achieving students
Yesbeck
(2011)
Interviews 10 middle school
language arts teachers
Found that a multitude of both achievement and non-achievement
factors were included in grading
22
Brookhart et al. (2016) A Century of Grading Research
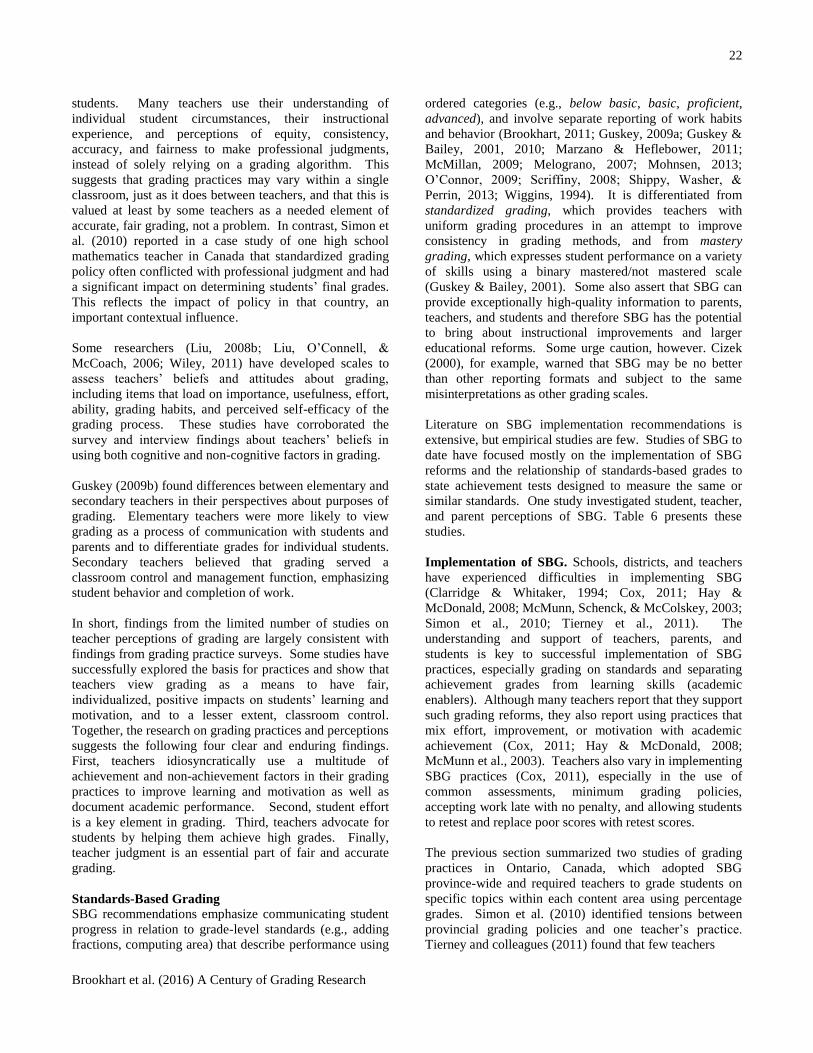
students. Many teachers use their understanding of
individual student circumstances, their instructional
experience, and perceptions of equity, consistency,
accuracy, and fairness to make professional judgments,
instead of solely relying on a grading algorithm. This
suggests that grading practices may vary within a single
classroom, just as it does between teachers, and that this is
valued at least by some teachers as a needed element of
accurate, fair grading, not a problem. In contrast, Simon et
al. (2010) reported in a case study of one high school
mathematics teacher in Canada that standardized grading
policy often conflicted with professional judgment and had
a significant impact on determining students’ final grades.
This reflects the impact of policy in that country, an
important contextual influence.
Some researchers (Liu, 2008b; Liu, O’Connell, &
McCoach, 2006; Wiley, 2011) have developed scales to
assess teachers’ beliefs and attitudes about grading,
including items that load on importance, usefulness, effort,
ability, grading habits, and perceived self-efficacy of the
grading process. These studies have corroborated the
survey and interview findings about teachers’ beliefs in
using both cognitive and non-cognitive factors in grading.
Guskey (2009b) found differences between elementary and
secondary teachers in their perspectives about purposes of
grading. Elementary teachers were more likely to view
grading as a process of communication with students and
parents and to differentiate grades for individual students.
Secondary teachers believed that grading served a
classroom control and management function, emphasizing
student behavior and completion of work.
In short, findings from the limited number of studies on
teacher perceptions of grading are largely consistent with
findings from grading practice surveys. Some studies have
successfully explored the basis for practices and show that
teachers view grading as a means to have fair,
individualized, positive impacts on students’ learning and
motivation, and to a lesser extent, classroom control.
Together, the research on grading practices and perceptions
suggests the following four clear and enduring findings.
First, teachers idiosyncratically use a multitude of
achievement and non-achievement factors in their grading
practices to improve learning and motivation as well as
document academic performance. Second, student effort
is a key element in grading. Third, teachers advocate for
students by helping them achieve high grades. Finally,
teacher judgment is an essential part of fair and accurate
grading.
Standards-Based Grading
SBG recommendations emphasize communicating student
progress in relation to grade-level standards (e.g., adding
fractions, computing area) that describe performance using
ordered categories (e.g., below basic, basic, proficient,
advanced), and involve separate reporting of work habits
and behavior (Brookhart, 2011; Guskey, 2009a; Guskey &
Bailey, 2001, 2010; Marzano & Heflebower, 2011;
McMillan, 2009; Melograno, 2007; Mohnsen, 2013;
O’Connor, 2009; Scriffiny, 2008; Shippy, Washer, &
Perrin, 2013; Wiggins, 1994). It is differentiated from
standardized grading, which provides teachers with
uniform grading procedures in an attempt to improve
consistency in grading methods, and from mastery
grading, which expresses student performance on a variety
of skills using a binary mastered/not mastered scale
(Guskey & Bailey, 2001). Some also assert that SBG can
provide exceptionally high-quality information to parents,
teachers, and students and therefore SBG has the potential
to bring about instructional improvements and larger
educational reforms. Some urge caution, however. Cizek
(2000), for example, warned that SBG may be no better
than other reporting formats and subject to the same
misinterpretations as other grading scales.
Literature on SBG implementation recommendations is
extensive, but empirical studies are few. Studies of SBG to
date have focused mostly on the implementation of SBG
reforms and the relationship of standards-based grades to
state achievement tests designed to measure the same or
similar standards. One study investigated student, teacher,
and parent perceptions of SBG. Table 6 presents these
studies.
Implementation of SBG. Schools, districts, and teachers
have experienced difficulties in implementing SBG
(Clarridge & Whitaker, 1994; Cox, 2011; Hay &
McDonald, 2008; McMunn, Schenck, & McColskey, 2003;
Simon et al., 2010; Tierney et al., 2011). The
understanding and support of teachers, parents, and
students is key to successful implementation of SBG
practices, especially grading on standards and separating
achievement grades from learning skills (academic
enablers). Although many teachers report that they support
such grading reforms, they also report using practices that
mix effort, improvement, or motivation with academic
achievement (Cox, 2011; Hay & McDonald, 2008;
McMunn et al., 2003). Teachers also vary in implementing
SBG practices (Cox, 2011), especially in the use of
common assessments, minimum grading policies,
accepting work late with no penalty, and allowing students
to retest and replace poor scores with retest scores.
The previous section summarized two studies of grading
practices in Ontario, Canada, which adopted SBG
province-wide and required teachers to grade students on
specific topics within each content area using percentage
grades. Simon et al. (2010) identified tensions between
provincial grading policies and one teacher’s practice.
Tierney and colleagues (2011) found that few teachers

23
Brookhart et al. (2016) A Century of Grading Research
Table 6
Studies of Standards-Based Grading
Study Method Sample Main Findings
Cox (2011) Focus group;
interview
16 high school teachers Although a district policy limited the impact of non-achievement
factors on grades, teachers varied a great deal in their
implementation.
High implementers:
substituted end-of-course assessment and high stakes assessment
scores for grades when students performed better on these exams
than on other assessments,
allowed students to retake exams and would record the highest
score,
assigned a score of 50 to all failing grades, and
accepted late work without penalty
Guskey, Swan,
and Jung
(2010)
Survey;
descriptive
24 elementary and
secondary teachers and 117
parents
Teachers and parents believed that a standards-based report card
provided high quality, clear, and more understood information
Howley,
Kusimo, and
Parrott (1999)
Interviews;
surveys; test
scores; grade
point average
52 middle school girls and
52 of their teachers
Half of the variance in grade point average could be explained by
test scores, but the relationship between grades and test scores
varied by school. Teachers differed in the extent to which non-
cognitive factors like effort were used to determine grades
McMunn,
Schenck, and
McColskey
(2003)
Interviews;
focus groups;
observations;
surveys;
document
analysis
241 teachers, all levels Teachers who volunteered to participate in a standards-based
grading effort reported changing their grading practices to be more
standards-based after participating in professional development
However, classroom observations and student focus group data
indicated that implementation of standards-based practice was not
as widespread as teachers reported
Ross and
Kostuch
(2011)
Grades; test
scores; student
demographics
15,942 students randomly
sampled from the
population of students in
Ontario
Moderate correlations were observed between grades and test
scores
The magnitude of the grade-test score relationship did not vary by
gender or grade, but was stronger in mathematics than in reading
or writing

24
Brookhart et al. (2016) A Century of Grading Research
Grades tended to be higher than test scores, except for in writing
Swan, Guskey,
and Jung
(2014)
Survey 115 parents, 383 teachers
Both in a district in which
grades and traditional
report cards were
concurrently generated
Both teachers and parents preferred standards-based over
traditional report cards, with teachers indicated the greatest
preference. Teachers also reported that although standards-based
grades took more time to generate, the effort was worthwhile due
to improvements in the quality of information provided
Welsh and
D’Agostino
(2009);
Welsh,
D’Agostino,
and Kaniskan
(2013)
Interviews; 2
years of
standards-based
grades; 2 yearas
of test scores
37 elementary teachers
were interviewed, 80
elementary classrooms
provided student-level
grades and test scores
Interviews were quantitatively coded to generate an Appraisal Style
scale that captured the use of high-quality standards-based grading
practices
The convergence between spring grades and test scores, both
expressed in terms of performance levels, was estimated for each
teacher in each year. Teachers tended to grade more rigorously in
mathematics and less rigorously in reading and writing
Appraisal Style was moderately correlated with convergence rates
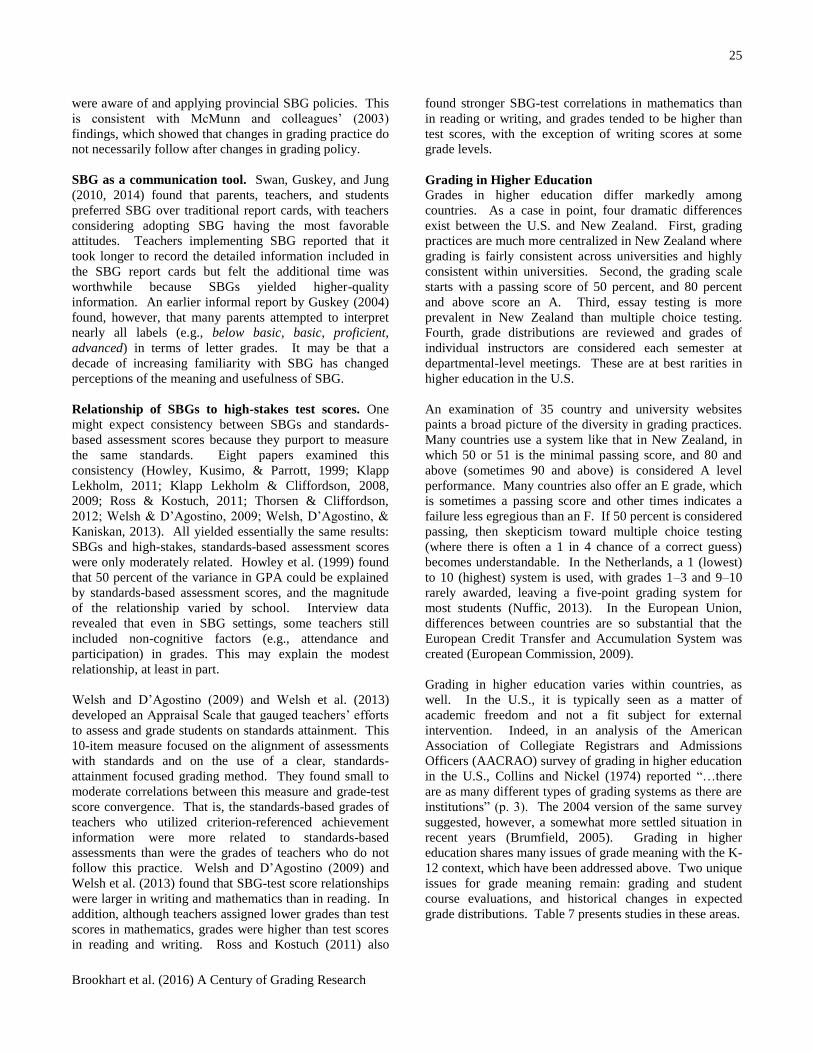
25
Brookhart et al. (2016) A Century of Grading Research
were aware of and applying provincial SBG policies. This
is consistent with McMunn and colleagues’ (2003)
findings, which showed that changes in grading practice do
not necessarily follow after changes in grading policy.
SBG as a communication tool. Swan, Guskey, and Jung
(2010, 2014) found that parents, teachers, and students
preferred SBG over traditional report cards, with teachers
considering adopting SBG having the most favorable
attitudes. Teachers implementing SBG reported that it
took longer to record the detailed information included in
the SBG report cards but felt the additional time was
worthwhile because SBGs yielded higher-quality
information. An earlier informal report by Guskey (2004)
found, however, that many parents attempted to interpret
nearly all labels (e.g., below basic, basic, proficient,
advanced) in terms of letter grades. It may be that a
decade of increasing familiarity with SBG has changed
perceptions of the meaning and usefulness of SBG.
Relationship of SBGs to high-stakes test scores. One
might expect consistency between SBGs and standards-
based assessment scores because they purport to measure
the same standards. Eight papers examined this
consistency (Howley, Kusimo, & Parrott, 1999; Klapp
Lekholm, 2011; Klapp Lekholm & Cliffordson, 2008,
2009; Ross & Kostuch, 2011; Thorsen & Cliffordson,
2012; Welsh & D’Agostino, 2009; Welsh, D’Agostino, &
Kaniskan, 2013). All yielded essentially the same results:
SBGs and high-stakes, standards-based assessment scores
were only moderately related. Howley et al. (1999) found
that 50 percent of the variance in GPA could be explained
by standards-based assessment scores, and the magnitude
of the relationship varied by school. Interview data
revealed that even in SBG settings, some teachers still
included non-cognitive factors (e.g., attendance and
participation) in grades. This may explain the modest
relationship, at least in part.
Welsh and D’Agostino (2009) and Welsh et al. (2013)
developed an Appraisal Scale that gauged teachers’ efforts
to assess and grade students on standards attainment. This
10-item measure focused on the alignment of assessments
with standards and on the use of a clear, standards-
attainment focused grading method. They found small to
moderate correlations between this measure and grade-test
score convergence. That is, the standards-based grades of
teachers who utilized criterion-referenced achievement
information were more related to standards-based
assessments than were the grades of teachers who do not
follow this practice. Welsh and D’Agostino (2009) and
Welsh et al. (2013) found that SBG-test score relationships
were larger in writing and mathematics than in reading. In
addition, although teachers assigned lower grades than test
scores in mathematics, grades were higher than test scores
in reading and writing. Ross and Kostuch (2011) also
found stronger SBG-test correlations in mathematics than
in reading or writing, and grades tended to be higher than
test scores, with the exception of writing scores at some
grade levels.
Grading in Higher Education
Grades in higher education differ markedly among
countries. As a case in point, four dramatic differences
exist between the U.S. and New Zealand. First, grading
practices are much more centralized in New Zealand where
grading is fairly consistent across universities and highly
consistent within universities. Second, the grading scale
starts with a passing score of 50 percent, and 80 percent
and above score an A. Third, essay testing is more
prevalent in New Zealand than multiple choice testing.
Fourth, grade distributions are reviewed and grades of
individual instructors are considered each semester at
departmental-level meetings. These are at best rarities in
higher education in the U.S.
An examination of 35 country and university websites
paints a broad picture of the diversity in grading practices.
Many countries use a system like that in New Zealand, in
which 50 or 51 is the minimal passing score, and 80 and
above (sometimes 90 and above) is considered A level
performance. Many countries also offer an E grade, which
is sometimes a passing score and other times indicates a
failure less egregious than an F. If 50 percent is considered
passing, then skepticism toward multiple choice testing
(where there is often a 1 in 4 chance of a correct guess)
becomes understandable. In the Netherlands, a 1 (lowest)
to 10 (highest) system is used, with grades 1–3 and 9–10
rarely awarded, leaving a five-point grading system for
most students (Nuffic, 2013). In the European Union,
differences between countries are so substantial that the
European Credit Transfer and Accumulation System was
created (European Commission, 2009).
Grading in higher education varies within countries, as
well. In the U.S., it is typically seen as a matter of
academic freedom and not a fit subject for external
intervention. Indeed, in an analysis of the American
Association of Collegiate Registrars and Admissions
Officers (AACRAO) survey of grading in higher education
in the U.S., Collins and Nickel (1974) reported “…there
are as many different types of grading systems as there are
institutions” (p. 3). The 2004 version of the same survey
suggested, however, a somewhat more settled situation in
recent years (Brumfield, 2005). Grading in higher
education shares many issues of grade meaning with the K-
12 context, which have been addressed above. Two unique
issues for grade meaning remain: grading and student
course evaluations, and historical changes in expected
grade distributions. Table 7 presents studies in these areas.
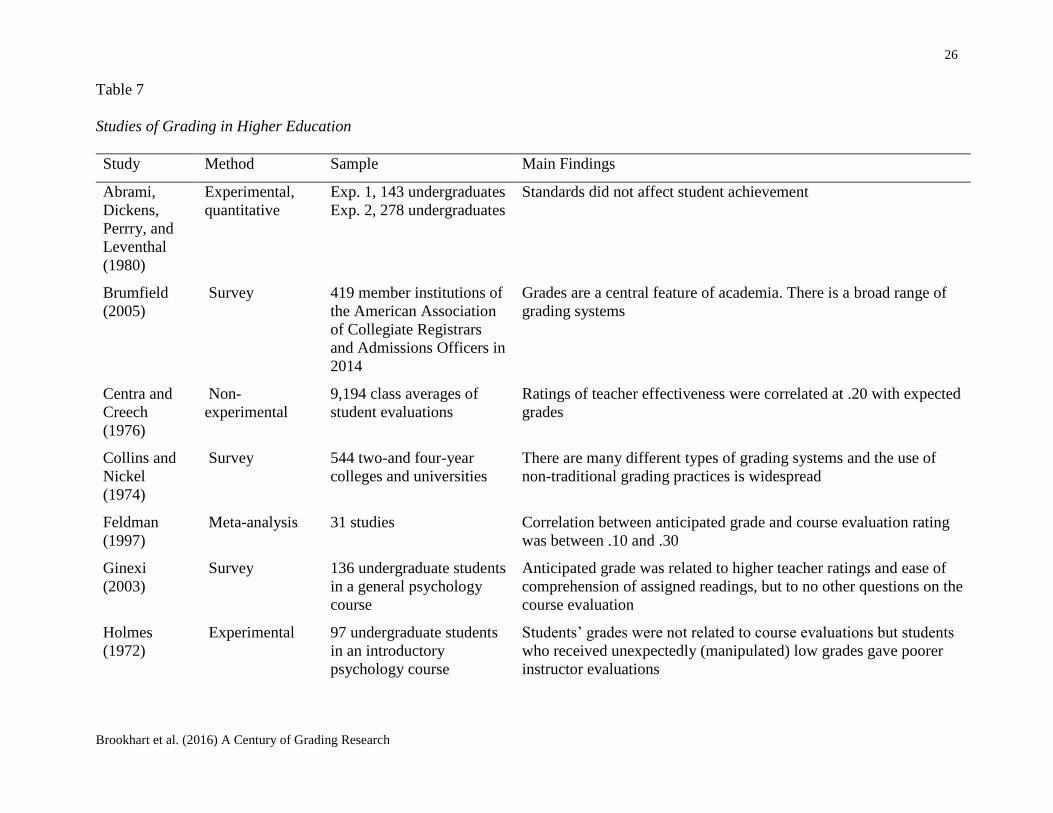
26
Brookhart et al. (2016) A Century of Grading Research
Table 7
Studies of Grading in Higher Education
Study Method Sample Main Findings
Abrami,
Dickens,
Perrry, and
Leventhal
(1980)
Experimental,
quantitative
Exp. 1, 143 undergraduates
Exp. 2, 278 undergraduates
Standards did not affect student achievement
Brumfield
(2005)
Survey 419 member institutions of
the American Association
of Collegiate Registrars
and Admissions Officers in
2014
Grades are a central feature of academia. There is a broad range of
grading systems
Centra and
Creech
(1976)
Non-
experimental
9,194 class averages of
student evaluations
Ratings of teacher effectiveness were correlated at .20 with expected
grades
Collins and
Nickel
(1974)
Survey 544 two-and four-year
colleges and universities
There are many different types of grading systems and the use of
non-traditional grading practices is widespread
Feldman
(1997)
Meta-analysis 31 studies Correlation between anticipated grade and course evaluation rating
was between .10 and .30
Ginexi
(2003)
Survey 136 undergraduate students
in a general psychology
course
Anticipated grade was related to higher teacher ratings and ease of
comprehension of assigned readings, but to no other questions on the
course evaluation
Holmes
(1972)
Experimental 97 undergraduate students
in an introductory
psychology course
Students’ grades were not related to course evaluations but students
who received unexpectedly (manipulated) low grades gave poorer
instructor evaluations

27
Brookhart et al. (2016) A Century of Grading Research
Kasten and
Young
(1983)
Experimental 77 graduate students in 5
educational administration
classes
Random assignment to 3 purposes for the course evaluation
(personal decision, instructor’s use, or no purpose stated) yielded no
significant differences in ratings
Kulick and
Wright
(2008)
Monte Carlo
simulation
Series of simulations based
on 400 students
Normal distributions of test scores do not necessarily provide
evidence of the efficacy of the evaluation of the quality of the test
Maurer
(2006)
Experimental 642 students in 17
(unspecified) classes taught
by the same instructor
Students were randomly assigned to 3 conditions (personnel
decision, course improvement, or control group) and asked for
expected grades; expected grade was related to course evaluations
but stated purpose of the evaluation was not
Mayo (1970) Survey 3 instructors of an
undergraduate introductory
measurement course
In a mastery learning context, active participation with course
material appear to be superior to only doing the reading and
receiving lectures
Nicolson
(1917)
Survey 64 colleges approved by
the Carnegie Foundation
36 of the colleges used a 5-division marking scale for grading
purposes
Salmons
(1993)
Non-
experimental
444 introductory
psychology students from
Radford University
Students were given a course evaluation prior to the first exam and
again after receiving their final grades. From pre to post, students
anticipating a low grade lowered their evaluation of the course and
students anticipating a high grade raised their evaluation of the
course
Smith and
Smith (2009)
Experimental 240 introductory
psychology students
Students were randomly assigned to 1 of 3 approaches to university
grading: a 100-point system, a percentage system, and an open point
system. Significant differences were found for motivation,
confidence, and effort, but not for perceptions of achievement or
accuracy
28
Brookhart et al. (2016) A Century of Grading Research
Grades and student course evaluations. Students in
higher education routinely evaluate the quality of their
course experiences and their instructors’ teaching. The
relationship between course grades and course evaluations
has been of interest for at least 40 years (Abrami, Dickens,
Perry, & Leventhal, 1980; Holmes, 1972) and is a sub-
question in the general research about student evaluations
of courses (e.g., Centra, 1993; Marsh, 1984, 1987;
McKeachie, 1979; Spooren, Brockx, & Mortelmans,
2013). The hypothesis is straightforward: students will
give higher course evaluations to faculty who are lenient
graders. This grade-leniency theory (Love & Kotchen,
2010; McKenzie, 1975) has long been lamented,
particularly by faculty who perceive themselves as
rigorous graders and do not enjoy favorable student
evaluations. This assumption is so prevalent that it is close
to accepted as settled science (Ginexi, 2003; Marsh, 1987;
Salmons, 1993). Ginexi posited that the relationship
between anticipated grades and course evaluation ratings
could be a function of cognitive dissonance (between the
student’s self-image and an anticipated low grade), or of
revenge theory (retribution for an anticipated low grade).
Although Maurer (2006) argued that revenge theory is
popular among faculty receiving low course evaluations,
both his study and an earlier study by Kasten and Young
(1983) did not find this to be the case. These authors
therefore argued for the cognitive dissonance model, where
attributing poor teaching to the perceived lack of student
success is an intrapersonal face-saving device.
A critical look at the literature presents an alternative
argument. First, the relationship between anticipated
grades and course evaluation ratings is moderate at best.
Meta-analytic work (Centra & Creech, 1976; Feldman,
1997) suggests correlations between .10 and .30, or that
anticipated grades account for less than 10 percent of the
variance in course evaluations. It therefore appears that
anticipated grades have little influence on student
evaluations. Second, the relationship between anticipated
grades and course evaluations could simply reflect an
honest assessment of students’ opinions of instruction,
which varies according to the students’ experiences of the
course (Smith & Smith, 2009). Students who like the
instructional approach may be expected to do better than
students who do not. Students exposed to exceptionally
good teaching might be expected to do well in the course
and to rate the instruction highly (and vice versa for poor
instruction). Although face-saving or revenge might occur,
a fair amount of honest and accurate appraisal of the
quality of teaching might be reflected in the observed
correlations.
Historical changes in expectations for grade
distributions. The roots of grading in higher education
can be traced back hundreds of years. In the 16th
century,
Cambridge University developed a three tier grading
system with 25 percent of the grades at the top, 50 percent
in the middle, and 25 percent at the bottom (Winter, 1993).
Working from European models, American universities
invented systems for ranking and categorizing students
based both on academic performance and on progress,
conduct, attentiveness, interest, effort, and regular
attendance at class and chapel (Cureton, 1971; Rugg, 1918;
Schneider & Hutt, 2014). Grades were ubiquitous at all
levels of education at the turn of the 20th century, but were
idiosyncratically determined (Schneider & Hutt, 2014), as
described earlier.
To resolve inconsistencies, educators turned to the new
science of statistics, and a concomitant passion for
measuring and ranking human characteristics (Pearson,
1930). Inspired by the work of his cousin, Charles Darwin,
Francis Galton pioneered the field of psychometrics,
extending his efforts to rank one’s fitness to produce high
quality offspring on an A to D scale (Galton & Galton,
1998). Educators began to debate how normal curve
theory and other scientific advances should be applied to
grading. As with K–12 education, the consensus was that
the 0–100 marking system led to an unjustified implication
of precision, and that the normal curve would allow for
transformation of student ranks into A-F or other
categories (Rugg, 1918).
Meyer (1908) argued for grade categories as follows:
excellent (3 percent of students), superior (22 percent),
medium (50 percent), inferior (22 percent), and failure (3
percent). He argued that a student picked at random is as
likely to be of medium ability as not. Interestingly,
Meyer’s terms for the middle three grades (superior,
medium, and inferior) are norm-referenced; whereas, the
two extreme grades (excellent and failure) are criterion-
referenced. Roughly a decade later, Nicolson (1917) found
that 36 out of 64 colleges were using a 5-point scale for
grading, typically A–F. The questions debated at the time
were more over the details of such systems as opposed to
the overall approach. As Rugg (1918) stated: Now the term inherited capacity practically defines
itself. By it we mean the “start in life;” the sum
total of nervous possibilities which the infant has at
birth and to which, therefore, nothing that the
individual himself can do will contribute in any
way whatsoever. (p. 706)
Rugg went on to say that educational conditions interact
with inherited capacity, resulting in what he called “ability-
to-do” (p. 706). He recommended basing teachers’ marks
on observations of students’ performance that reflect those
abilities, and that grades should form a normal distribution.
That is, the normal distribution should form a basis for
checking the quality of the grades that teachers assign.
This approach reduces grading to determining the number
of grading divisions and the number of students who

29
Brookhart et al. (2016) A Century of Grading Research
should fall into each category. Thus, there is a shift from a
decentralized and fundamentally haphazard approach to
assigning grades to one that is based on “scientific” (p.
701) principle. Furthermore, Rugg argued that letter
grades were preferable to percentage grades as they more
accurately represented the level of precision that was
possible.
Another interesting aspect of Rugg’s (1918) and Meyer’s
(1908) work is the notion that grades should simply be a
method of ranking students, and not necessarily used for
making decisions about achievement. Although Meyer
argued that three percent should fail a typical course (and
he feared that people would see this as too lenient), he was
less certain about what to do with the “inferior” group,
stating that grades should solely represent a student’s rank
in the class. In hindsight, these approaches seem
reductionist at best. Although the notion of grading “on
the curve” remained popular through at least through the
early 1960s, a categorical (A-F) approach to assigning
grades was implemented. This system tended to mask
keeping a close eye on the notion that not too many As nor
too many Fs were handed out (Guskey, 2000; Kulick &
Wright, 2008). The normal curve was the “silent partner”
of the grading system.
In the U.S. in the 1960s, a confluence of technical and
societal events led to dramatic changes in perspectives
about grading. These were criterion-referenced testing
(Glaser, 1963), mastery learning and mastery testing
(Bloom, 1971; Mayo, 1970), the Civil Rights movement,
and the war in Vietnam. Glaser brought forth the
innovative idea that sense should be made out of test
performance by “referencing” performance not to a
norming group, but rather to the domain whence the test
came; students’ performance should not be based on the
performance of their peers. The proper referent, according
to Glaser, was the level of mastery on the subject matter
being assessed. Working from Carroll’s model of school
learning (Carroll, 1963), Bloom developed the underlying
argument for mastery learning theory: that achievement in
any course (and by extension, the grade received) should
be a function of the quality of teaching, the perseverance of
the student, and the time allowed for the student to master
the material (Bloom, 1971; Guskey, 1985).
It was not the case that the work of Bloom (1971) and
Glaser (1963) single-handedly changed how grading took
place in higher education, but ideas about teaching and
learning partially inspired by this work led to a substantial
rethinking of the proper aims of education. Bring into this
mix a national reexamination of status and equity, and the
time was ripe for a humanistic and social reassessment of
grading and learning in general. The final ingredient in the
mix was the war in Vietnam. The U.S. had its first
conscription since World War II, and as the war grew
increasingly unpopular, so did the pressure on professors
not to fail students and make them subject to the draft. The
effect of the draft on grading practices in higher education
is unmistakable (Rojstaczer & Healy, 2012). The
proportion of A and B grades rose dramatically during the
years of the draft; the proportion of D and F grades fell
concomitantly.
Grades have risen again dramatically in the past 25 years.
Rojstaczer and Healy (2012) argued that this resulted from
new views of students as consumers, or even customers,
and away from viewing students as needing discipline.
Others have contended that faculty inflate grades to vie for
good course ratings (the grade-leniency theory, Love &
Kotchen, 2010). Or, perhaps students are higher-achieving
than they were and deserve better grades.
Discussion: What Do Grades Mean?
This review shows that over the past 100 years teacher-
assigned grades have been maligned by researchers and
pyschometricians alike as subjective and unreliable
measures of student academic achievement (Allen, 2005;
Banker, 1927; Carter, 1952; Evans, 1976; Hargis, 1990;
Kirschenbaum et al., 1971; Quann, 1983; Simon &
Bellanca, 1976). However, others have noted that grades
are a useful indicator of numerous factors that matter to
students, teachers, parents, schools, and communities
(Bisesi, Farr, Greene, & Haydel, 2000; Folzer-Napier,
1976; Linn, 1982). Over the past 100 years, research has
attempted to identify the different components of grades in
order to inform educational decision making (Bowers,
2009; Parsons, 1959). Interestingly, although standardized
assessment scores have been shown to have low criterion
validity for overall schooling outcomes (e.g., high school
graduation and admission to post-secondary institutions),
grades consistently predict K-12 educational persistence,
completion, and transition from high school to college
(Atkinson & Geiser, 2009; Bowers et al., 2013).
One hundred years of quantitative studies of the
composition of K-12 report card grades demonstrate that
teacher-assigned grades represent both the cognitive
knowledge measured in standardized assessment scores
and, to a smaller extent, non-cognitive factors such as
substantive engagement, persistence, and positive school
behaviors (e.g., Bowers, 2009, 2011; Farkas et al., 1990;
Klapp Lekholm & Cliffordson, 2008, 2009; Miner, 1967;
Willingham et al., 2002). Grades are useful in predicting
and identifying students who may face challenges in either
the academic component of schooling or in the socio-
behavioral domain (e.g., Allensworth, 2013; Allensworth
& Easton, 2007; Allensworth et al., 2014; Atkinson &
Geiser, 2009; Bowers, 2014).
The conclusion is that grades typically represent a mixture
of multiple factors that teachers value. Teachers recognize

30
Brookhart et al. (2016) A Century of Grading Research
the important role of effort in achievement and motivation
(Aronson, 2008; Cizek et al., 1995; Cross & Frary, 1999;
Duncan & Noonan, 2007; Guskey, 2002, 2009b; Imperial,
2011; Kelly, 2008; Liu, 2008a; McMillan, 2001; McMillan
& Lawson, 2001; McMillan et al., 2002; McMillan &
Nash, 2000; Randall & Engelhard, 2009, 2010; Russell &
Austin, 2010; Sun & Cheng, 2013; Svennberg et al., 2014;
Troug & Friedman, 1996; Yesbeck, 2011). They
differentiate academic enablers (McMillan, 2001, p. 25)
like effort, ability, improvement, work habits, attention,
and participation, which they endorse as relevant to
grading, from other student characteristics like gender,
socioeconomic status, or personality, which they do not
endorse as relevant to grading.
This quality of graded achievement as a multidimensional
measure of success in school may be what makes grades
better predictors of future success in school than tested
achievement (Atkinson & Geiser, 2009; Barrington &
Hendricks, 1989; Bowers, 2014; Cairns et al., 1989;
Cliffordson, 2008; Ekstrom et al., 1986; Ensminger &
Slusarcick, 1992; Finn, 1989; Fitzsimmons et al., 1969;
Hargis, 1990; Lloyd, 1974, 1978; Morris et al., 1991;
Rumberger, 1987; Troob, 1985; Voss et al., 1966),
especially given known limitations of achievement testing
(Nichols & Berliner, 2007; Polikoff, Porter, & Smithson,
2011). In the search for assessments of non-cognitive
factors that predict educational outcomes (Heckman &
Rubinstein, 2001; Levin, 2013), grades appear to be useful.
Current theories postulate that both cognitive and non-
cognitive skills are important to acquire and build over the
course of life. Although non-cognitive skills may help
students to develop cognitive skills, the reverse is not true
(Cunha & Heckman, 2008).
Teachers’ values are a major component in this
multidimensional measure. Besides academic enablers,
two other important teacher values work to make graded
achievement different from tested achievement. One is the
value that teachers place on being fair to students (Bonner,
2016; Bonner & Chen, 2009; Brookhart, 1994; Grimes,
2010; Hay & MacDonald, 2008; Sun & Cheng, 2013;
Svennberg et al., 2014; Tierney et al., 2011). In their
concept of fairness, most teachers believe that students
who try should not fail, whether or not they learn. Related
to this concept is teachers’ wish to help all or most students
be successful (Bonner, 2016; Brookhart, 1994).
Grades, therefore, must be considered multidimensional
measures that reflect mostly achievement of classroom
learning intentions and also, to a lesser degree, students’
efforts at getting there. Grades are not unidimensional
measures of pure achievement, as has been assumed in the
past (e.g., Carter, 1952; McCandless et al., 1972; Moore,
1939; Ross & Hooks, 1930) or recommended in the present
(e.g., Brookhart, 2009, 2011; Guskey, 2000; Guskey &
Bailey, 2010; Marzano & Hefflebower, 2011; O’Connor,
2009; Scriffiny, 2008). Although measurement experts
and professional developers may wish grades were
unadulterated measures of what students have learned and
are able to do, strong evidence indicates that they are not.
For those who wish grades could be a more focused
measure of achievement of intended instructional
outcomes, future research needs to cast a broader net. The
value teachers attach to effort and other academic enablers
in grades and their insistence that grades should be fair
point to instructional and societal issues that are well
beyond the scope of grading. Why, for example, do some
students who sincerely try to learn what they are taught not
achieve the intended learning outcomes? Two important
possibilities include intended learning outcomes that are
developmentally inappropriate for these students (e.g.,
these students lack readiness or prior instruction in the
domain), and poorly designed lessons that do not make
clear what students are expected to learn, do not instruct
students in appropriate ways, and do not arrange learning
activities and formative assessments in ways that help
students learn well. Research focusing solely on grades
typically misses antecedent causes. Future research should
make these connections. For example, does more of the
variance in grades reflect achievement in classes where
lessons are high-quality and appropriate for students? Is a
negatively skewed grade distribution, where most students
achieve and very few fail, effective for the purposes of
certifying achievement, communicating with students and
parents, passing students to the next grade, or predicting
future educational success? Do changes in instructional
design lead to changes in grading practices, in grade
distributions, and in the usefulness of grades as predictors
of future educational success?
This review suggests that most teachers’ grades do not
yield a pure achievement measure, but rather a
multidimensional measure dependent on both what the
students learn and how they behave in the classroom. This
conclusion, however, does not excuse low quality grading
practices or suggest there is no room for improvement.
One hundred years of grading research have generally
confirmed large variation among teachers in the validity
and reliability of grades, both in the meaning of grades and
the accuracy of reporting.
Early research found great variation among teachers when
asked to grade the same examination or paper. Many of
these early studies communicated a “what’s wrong with
teachers” undertone that today would likely be seen as
researcher bias. Early researchers attributed sources of
variation in teachers’ grades to one or more of the
following sources: criteria (Ashbaugh, 1924; Brimi, 2011;
Healy, 1935; Silberstein, 1922; Sims, 1933, Starch, 1915;
Starch & Elliott, 1913a,b), students’ work quality (Bolton,

31
Brookhart et al. (2016) A Century of Grading Research
1927; Healy, 1935; Jacoby, 1910; Lauterbach, 1928;
Shriner, 1930; Sims, 1933), teacher severity/leniency
(Shriner, 1930; Silberstein, 1922; Sims, 1933; Starch,
1915; Starch & Elliott, 1913b), task (Silberstein, 1922;
Starch & Elliott, 1913a), scale (Ashbaugh, 1924; Sims,
1933; Starch 1913, 1915), and teacher error (Brimi, 2011;
Eells, 1930; Hulten, 1925; Lauterbach, 1928, Silberstein,
1922; Starch & Elliott, 1912, 1913a,b). Starch (1913,
Starch & Elliott 1913b) found that teacher error and
emphasizing different criteria were the two largest sources
of variation.
Regarding sources of error, Smith (2003) suggested
reconceptualizing reliability for grades as a matter of
sufficiency of information for making the grade
assignment. This recommendation is consistent with the
fact that as grades are aggregated from individual pieces of
work to report card or course grades and grade-point
averages, reliability increases. The reliability of overall
college grade-point average is estimated at .93 (Beatty,
Walmsley, Sackett, Kuncel, & Koch, 2015).
In most studies investigating teachers’ grading reliability,
teachers were sent examination papers without specific
grading criteria and simply asked to assign grades. Today,
this lack of clear grading criteria would be seen as a
shortcoming in the assessment process. Most of these
studies thus confounded teachers’ inability to judge student
work consistently and random error, considering both
teacher error. Rater training offers a modern solution to
this situation. Research has shown that with training on
established criteria, individuals can judge examinees’ work
more accurately and reliably (Myford, 2012).
Unfortunately, most teachers and professors today are not
well trained, typically grade alone, and rarely seek help
from colleagues to check the reliability of their grading.
Thus, working toward clearer criteria, collaborating among
teachers, and involving students in the development of
grading criteria appear to be promising approaches to
enhancing grading reliability.
Considering criteria as a source of variation in teachers’
grading has implications for grade meaning and validity.
The attributes upon which grading decisions are based
function as the constructs the grades are intended to
measure. To the extent teachers include factors that do not
indicate achievement in the domain they intend to measure
(e.g., when grades include consideration of format and
surface level features of an assignment), grades do not give
students, parents, or other educators accurate information
about learning. Furthermore, to the extent teachers do not
appropriately interpret student work as evidence of
learning, the intended meaning of the grade is also
compromised. There is evidence that even teachers who
explicitly decide to grade solely on achievement of
learning standards sometimes mix effort, improvement,
and other academic enablers when determining grades
(Cox, 2011; Hay & McDonald, 2008; McMunn et al.,
2003).
Future research in this area should seek ways to help
teachers improve the criteria they use to grade, their skill at
identifying levels of quality on the criteria, and their ability
to effectively merge these assessment skills and
instructional skills. When students are taught the criteria
by which to judge high-quality work and are assessed by
those same criteria, grade meaning is enhanced. Even if
grades remain multidimensional measures of success in
school, the dimensions on which grades are based should
be defensible goals of schooling and should match
students’ opportunities to learn.
No research agenda will ever entirely eliminate teacher
variation in grading. Nevertheless, the authors of this
review have suggested several ways forward. Investigating
grading in the larger context of instruction and assessment
will help focus research on important sources and causes of
invalid or unreliable grading decisions. Investigating ways
to differentiate instruction more effectively, routinely, and
easily will reduce teachers’ feelings of pressure to pass
students who may try but do not reach an expected level of
achievement. Investigating the multidimensional construct
of “success in school” will acknowledge that grades
measure something significant that is not measured by
achievement tests. Investigating ways to help teachers
develop skills in writing or selecting and then
communicating criteria, and recognizing these criteria in
students’ work, will improve the quality of grading. All of
these seem reachable goals to achieve before the next
century of grading research. All will assuredly contribute
to enhancing the validity, reliability, and fairness of
grading.
Suggested Citation Format: Brookhart, S. M., Guskey, T. R., Bowers, A. J., McMillan,
J. H., Smith, J. K., Smith, L. F., Stevens, M.T., Welsh, M.
E. (2016). A Century of Grading Research: Meaning and
Value in the Most Common Educational Measure. Review
of Educational Research, 86(4), 803-848.
doi: 10.3102/0034654316672069
http://doi.org/10.3102/0034654316672069
REFERENCES: Abrami, P. C., Dickens, W. J., Perry, R. P., & Leventhal,
L. (1980). Do teacher standards for assigning grades
affect student evaluations of instruction? Journal of
Educational Psychology, 72, 107–118.
doi:10.1037/0022-0663.72.1.107
Adrian, C. A, (2012). Implementing standards-based
grading: Elementary teachers’ beliefs, practices and
concerns. (Doctoral dissertation). Retrieved from

32
Brookhart et al. (2016) A Century of Grading Research
ProQuest. (1032540669)
Aronson, M. J. (2008). How teachers' perceptions in the
areas of student behavior, attendance and student
personality influence their grading practice (Doctoral
dissertation). Retrieved from ProQuest. (304510267)
Alexander, K. L., Entwisle, D. R., & Kabbani, N. S.
(2001). The dropout process in life course perspective:
Early risk factors at home and school. The Teachers
College Record, 103, 760–822. doi:10.1111/0161-
4681.00134
Allen, J. D. (2005). Grades as valid measures of academic
achievement of classroom learning. The Clearing
House, 78, 218–223. doi:10.3200/TCHS.78.5.218-223
Allensworth, E. M. (2013). The use of ninth-grade early
warning indicators to improve Chicago Schools.
Journal of Education for Students Placed at Risk
(JESPAR), 18, 68–83.
doi:10.1080/10824669.2013.745181 Allensworth, E. M., & Easton, J. Q. (2005). The on-track
indicator as a predictor of High School graduation
(Vol. 2006). Chicago, IL: University of Chicago
Consortium on Chicago School Research. Allensworth, E. M., & Easton, J. Q. (2007). What matters
for staying on-track and graduating in Chicago public
high schools: A close look at course grades, failures,
and attendance in the freshman year. Chicago, IL:
University of Chicago Consortium on Chicago School
Research. Allensworth, E. M., Gwynne, J. A., Moore, P., & de la
Torre, M. (2014). Looking forward to high school and
college: Middle grade indicators of readiness in
Chicago Public Schools. Chicago, IL: University of
Chicago Consortium on Chicago School Research. Ashbaugh, E. J. (1924). Reducing the variability of
teachers’ marks. Journal of Educational Research, 9,
185–198. doi:10.1080/00220671.1924.10879447
Atkinson, R. C., & Geiser, S. (2009). Reflections on a
century of college admissions tests. Educational
Researcher, 38, 665–676.
doi:10.3102/0013189x09351981 Balfanz, R., Herzog, L., & MacIver, D. J. (2007).
Preventing student disengagement and keeping
students on the graduation path in urban middle-grades
schools: Early identification and effective
interventions. Educational Psychologist, 42, 223–235.
doi:10.1080/00461520701621079 Bailey, M. T. (2012). The relationship between secondary
school teacher prerceptions of grading practices and
secondary school teacher perceptions of student
motivation. (Doctoral dissertation) Retrieved from
ProQuest. (1011481355)
Banker, H. J. (1927). The significance of teachers’ marks.
The Journal of Educational Research, 16, 159–171.
doi:10.1080/00220671.1927.10879778 Barrington, B. L., & Hendricks, B. (1989). Differentiating
characteristics of high school graduates, dropouts, and
nongraduates. Journal of Educational Research, 82,
309–319. doi:10.1080/00220671.1989.10885913
Beatty, A. S., Walmsley, P. T., Sackett, P. R., Kuncel, N.
R., & Koch, A. J. (2015). The reliability of college
grades. Educational Measurement: Issues and
Practice, 34(4), 31–40. doi:10.1111/emip.12096
Bisesi, T., Farr, R., Greene, B., & Haydel, E. (2000).
Reporting to parents and the community. In E.
Trumbull & B. Farr (Eds.), Grading and reporting
student progress in an age of standards (pp. 157–184).
Norwood, MA: Christopher-Gordon. Bloom, B. S. (1971). Mastery learning. In J. H. Block
(Ed.), Mastery learning: Theory and practice (pp. 47–
63). New York, NY: Holt, Rinehart & Winston. Bolton, F. E. (1927). Do teachers’ marks vary as much as
supposed? Education, 48, 28–39. Bonner, S. M. (2016). Teacher perceptions about
assessment: Relationship to practice and policy. In G.
T. Brown, & L. Harris (Eds.), Human factors and
social conditions of assessment. London, United
Kingdom: Routledge. Bonner, S. M., & Chen, P. P. (2009). Teacher candidates'
perceptions about grading and constructivist
teaching. Educational Assessment, 14, 57–77.
doi:10.1080/10627190903039411 Bowers, A. J. (2009). Reconsidering grades as data for
decision making: More than just academic knowledge.
Journal of Educational Administration, 47, 609–629.
doi:10.1108/09578230910981080 Bowers, A. J. (2010a). Analyzing the longitudinal K-12
grading histories of entire cohorts of students: Grades,
data driven decision making, dropping out and
hierarchical cluster analysis. Practical Assessment
Research and Evaluation, 15(7), 1–18. Retrieved from
http://pareonline.net/pdf/v15n7.pdf
Bowers, A. J. (2010b). Grades and graduation: A
longitudinal risk perspective to identify student
dropouts. Journal of Educational Research, 103, 191–
207. doi:10.1080/00220670903382970 Bowers, A. J. (2011). What's in a grade? The
multidimensional nature of what teacher-assigned
grades assess in high school. Educational Research
and Evaluation, 17, 141–159.
doi:10.1080/13803611.2011.597112 Bowers, A. J. (2014). Student risk factors. In D. J. Brewer
& L. O. Picus (Eds.), Encyclopedia of education
economics and finance. Thousand Oaks, CA: Sage.
Bowers, A. J., & Sprott, R. (2012). Examining the multiple
trajectories associated with dropping out of high
school: A growth mixture model analysis. Journal of
Educational Research, 105, 176–195.
doi:10.1080/00220671.2011.552075 Bowers, A. J., Sprott, R., & Taff, S. (2013). Do we know
who will drop out? A review of the predictors of
dropping out of high school: Precision, sensitivity and
specificity. The High School Journal, 96, 77–100.

33
Brookhart et al. (2016) A Century of Grading Research
doi:10.1353/hsj.2013.0000 Brennan, R. T., Kim, J., Wenz-Gross, M., & Siperstein, G.
N. (2001). The relative equitability of high-stakes
testing versus teacher-assigned grades: An analysis of
the Massachusetts Comprehensive Assessment System
(MCAS). Harvard Educational Review, 71, 173–215.
doi:10.17763/haer.71.2.v51n6503372t4578 Brimi, H. M. (2011). Reliability of grading high school
work in English. Practical Assessment, Research &
Evaluation, 16(17). Retrieved from
http://pareonline.net/getvn.asp?v=16&n=17 Brookhart, S. M. (1991). Grading practices and validity.
Educational Measurement: Issues and Practice, 10(1),
35–36. doi:10.1111/j.1745-3992.1991.tb00182.x
Brookhart, S. M. (1993). Teachers' grading practices:
Meaning and values. Journal of Educational
Measurement, 30, 123–142. doi:10.1111/j.1745-
3984.1993.tb01070.x
Brookhart, S. M. (1994). Teachers' grading: Practice and
theory. Applied Measurement in Education, 7, 279–
301. doi:10.1207/s15324818ame0704_2
Brookhart, S. M. (2009). Grading (2nd
ed.). New York,
NY: Merrill Pearson Education.
Brookhart, S. M. (2011). Grading and learning: Practices
that support student achievement. Bloomington, IN:
Solution Tree Press. Brookhart, S. M. (2013). Grading. In J. H. McMillan
(Ed.), Sage handbook of research on classroom
assessment (pp. 257–271). Thousand Oaks, CA: Sage
Publications, Inc. Brookhart, S. M. (2015). Graded achievement, tested
achievement, and validity. Educational Assessment,
20, 268–296. doi:10.1080/10627197.2015.1093928
Brumfield, C. (2005). Current trends in grades and
grading practices in higher education: Results of the
2004 AACRAO survey. Retrieved from database
(ED489795). Cairns, R. B., Cairns, B. D., & Neckerman, H. J. (1989).
Early school dropout: Configurations and
determinants. Child Development, 60, 1437–1452.
doi:10.2307/1130933
Carroll, J. (1963). A model of school learning. The
Teachers College Record, 64, 723–723.
Carter, R. S. (1952). How invalid are marks assigned by
teachers? Journal of Educational Psychology, 43,
218–228. doi:10.1037/h0061688 Casillas, A., Robbins, S., Allen, J., Kuo, Y. L., Hanson, M.
A., & Schmeiser, C. (2012). Predicting early academic
failure in high school from prior academic
achievement, psychosocial characteristics, and
behavior. Journal of Educational Psychology, 104,
407–420. doi:10.1037/a0027180 Centra, J. A. (1993). Reflective faculty evaluation. San
Francisco, CA: Jossey-Bass. Centra, J. A., & & Creech, F. R. (1976). The relationship
between student, teacher, and course characteristics
and student ratings of teacher effectiveness. Report
PR-76–1. Princeton, NJ: Educational Testing Service. Cizek, G. J. (2000). Pockets of resistance in the assessment
revolution. Educational
Measurement: Issues and Practice, 19(2), 16–23.
doi:10.1111/j.1745-3992.2000.tb00026.x
Cizek, G. J., Fitzgerald, J. M., & Rachor, R. A. (1995).
Teachers' assessment practices: Preparation, isolation,
and the kitchen sink. Educational Assessment, 3, 159–
179. doi:10.1207/s15326977ea0302_3 Clarridge, P. B. & Whitaker, E. M. (1994). Implementing a
new elementary progress report. Educational
Leadership, 52(2), 7–9. Retrieved from
http://www.ascd.org/publications/educational-
leadership/oct94/vol52/num02/Implementing-a-New-
Elementary-Progress-Report.aspx Cliffordson, C. (2008). Differential prediction of study
success across academic programs in the Swedish
context: The validity of grades and tests as selection
instruments for higher education. Educational
Assessment, 13, 56–75.
doi:10.1080/10627190801968240 Collins, J. R. & Nickel, K. N. (1974). A study of grading
practices in institutions of higher education. Retrieved
from ERIC database (ED 097 846). Cox, K. B. (2011). Putting classroom grading on the table,
a reform in progress. American Secondary Education,
40(1), 67–87. Crooks, A. D. (1933). Marks and marking systems: A
digest. Journal of Educational Research, 27, 259–272. doi:10.1080/00220671.1933.10880402
Cross, L. H., & Frary, R. B. (1999). Hodgepodge grading:
Endorsed by students and teachers
alike. Applied Measurement in Education, 12, 53–
72.doi:10.1207/s15324818ame1201_4
Cunha, F., & Heckman, J. J. (2008). Formulating,
identifying and estimating the technology of cognitive
and noncognitive skill formation. Journal of Human
Resources, 43, 738–782. doi:10.3368/jhr.43.4.738 Cureton, L. W. (1971). The history of grading practices.
NCME measurement in education 2(4). 1–8. Duckworth, A. L., Quinn, P. D., & Tsukayama, E. (2012).
What No Child Left Behind leaves behind: The roles of
IQ and self-control in predicting standardized
achievement test scores and report card grades.
Journal of Educational Psychology, 104, 439–451.
doi:10.1037/a0026280 Duckworth, A. L., & Seligman, M. E. P. (2006). Self-
discipline gives girls the edge: Gender in self-
discipline, grades, and achievement test scores.
Journal of Educational Psychology, 98, 198–208.
doi:10.1037/0022-0663.98.1.198 Duncan, R. C., & Noonan, B. (2007). Factors affecting
teachers' grading and assessment practices. Alberta
Journal of Educational Research, 53, 1–21. Edgeworth, F. Y. (1888). The statistics of examinations.

34
Brookhart et al. (2016) A Century of Grading Research
Journal of the Royal Statistical Society, 51, 599–635. Eells, W. C. (1930). Reliability of repeated grading of
essay type examinations. Journal of Educational
Psychology, 21, 48–52. Ekstrom, R. B., Goertz, M. E., Pollack, J. M., & Rock, D.
A. (1986). Who drops out of high school and why?
Findings from a national study. Teachers College
Record, 87, 356–373. Ensminger, M. E., & Slusarcick, A. L. (1992). Paths to
high school graduation or dropout: A longitudinal
study of a first-grade cohort. Sociology of Education,
65, 91–113. doi:10.2307/2112677
European Commission. (2009). ECTS user’s guide.
Luxembourg, Belgium: Office for Official
Publications of the European Communities.
doi:10.2766/88064
Evans, F. B. (1976). What research says about grading. In
S. B. Simon & J. A. Bellanca (Eds.), Degrading the
grading myths: A primer of alternatives to grades and
marks (pp. 30–50). Washington, DC: Association for
Supervision and Curriculum Development. Farkas, G., Grobe, R. P., Sheehan, D., & Shuan, Y. (1990).
Cultural resources and school success: Gender,
ethnicity, and poverty groups within an urban school
district. American Sociological Review, 55, 127–142.
doi:10.2307/2095708 Farr, B. P. (2000). Grading practices: An overview of the
issues. In E. Trumbull & B. Farr (Eds.), Grading and
reporting student progress in an age of standards (pp.
1–22). Norwood, MA: Christopher-Gordon. Feldman, K. A. (1997). Identifying exemplary teachers and
teaching: Evidence from student ratings. In R. P. Perry
& J. C. Smart (Eds.), Effective teaching in higher
education: Research and practice (pp. 93–143). New
York, NY: Agathon Press.
Finn, J. D. (1989). Withdrawing from school. Review of
Educational Research, 59, 117–142.
doi:10.3102/00346543059002117
Fitzsimmons, S. J., Cheever, J., Leonard, E., &
Macunovich, D. (1969). School failures: Now and
tomorrow. Developmental Psychology, 1, 134–146.
doi:10.1037/h0027088 Folzer-Napier, S. (1976). Grading and young children. In
S. B. Simon & J. A. Bellanca (Eds.), Degrading the
grading myths: A primer of alternatives to grades and
marks (pp. 23–27). Washington, DC: Association for
Supervision and Curriculum Development. Frary, R. B., Cross, L. H., & Weber, L. J. (1993). Testing
and grading practices and opinions of secondary
teachers of academic subjects: Implications for
instruction in measurement. Educational
Measurement: Issues & Practice, 12(3), 23–30.
doi:10.1111/j.1745-3992.1993.tb00539.x
Galton, D. J., & Galton, C. J. (1998). Francis Galton: and
eugenics today. Journal of Medical Ethics, 24, 99–
105.
Ginexi, E. M. (2003). General psychology course
evaluations: Differential survey response by
expected grade. Teaching of Psychology, 30, 248–251. Glaser, R. (1963). Instructional technology and the
measurement of learning outcomes: Some questions.
American Psychologist, 18, 519. doi:10.1111/j.1745-
3992.1994.tb00561.x
Gleason, P., & Dynarski, M. (2002). Do we know whom to
serve? Issues in using risk factors to identify dropouts.
Journal of Education for Students Placed at Risk, 7,
25–41. doi:10.1207/S15327671ESPR0701_3 Grimes, T. V. (2010). Interpreting the meaning of grades:
A descriptive analysis of middle school teachers'
assessment and grading practices. (Doctoral
dissertation). Retrieved from ProQuest. (305268025)
Grindberg, E. (2014, April 7). Ditching letter grades for a
‘window’ into the classroom. Cable News Network.
Retrieved from:
http://www.cnn.com/2014/04/07/living/report-card-
changes-standards-based-grading-schools/ Guskey, T. R. (1985). Implementing mastery learning.
Belmont, CA: Wadsworth. Guskey, T. R. (2000). Grading policies that work against
standards…and how to fix them. IASSP Bulletin,
84(620), 20–29. doi:10.1177/019263650008462003
Guskey, T. R. (2002, April). Perspectives on grading and
reporting: Differences among teachers, students, and
parents. Paper presented at the Annual Meeting of the
American Educational Research Association, New
Orleans, LA. Guskey, T. R. (2004). The communication challenge of
standards-based reporting. Phi Delta Kappan, 86,
326–329. doi:10.1177/003172170408600419 Guskey, T. R. (2009a). Grading policies that work against
standards… And how to fix them. In T.R. Guskey
(Ed.), Practical solutions for serious problems in
standards-based grading (pp. 9–26). Thousand Oaks,
CA: Corwin. Guskey, T. R. (2009b, April). Bound by tradition:
Teachers' views of crucial grading and reporting
issues. Paper presented at the Annual Meeting of the
American Educational Research Association, San
Francisco, CA. Guskey, T., & Bailey, J. (2001). Developing grading and
reporting systems for student learning. Thousand
Oaks, CA: Corwin. Guskey, T.R. & Bailey, J.M. (2010). Developing standards
based report cards. Thousand Oaks, CA: Corwin. Guskey, T. R., Swan, G. M. & Jung, L. A. (2010,
April). Developing a statewide, standards-based
student report card: A review of the Kentucky
initiative. Paper presented at the Annual Meeting of
the American Educational Research Association,
Denver, CO.
Hargis, C. H. (1990). Grades and grading practices:
Obstacles to improving education and helping at-risk

35
Brookhart et al. (2016) A Century of Grading Research
students. Springfield, MA: Charles C. Thomas. Hay, P. J., & Macdonald, D. (2008). (Mis)appropriations
of criteria and standards-referenced assessment in a
performance-based subject. Assessment in Education:
Principles, Policy & Practice, 15, 153–168. doi:10.1080/09695940802164184
Healy, K. L. (1935). A study of the factors involved in the
rating of pupils’ compositions. Journal of
Experimental Education, 4, 50–53. doi:10.1080/00220973.1935.11009995
Heckman, J. J., & Rubinstein, Y. (2001). The importance
of noncognitive skills: Lessons from the GED testing
program. The American Economic Review, 91, 145–
149. doi:10.2307/2677749 Hill, G. (1935). The report card in present practice.
Educational Method, 15, 115–131. Holmes, D. S. (1972). Effects of grades and disconfirmed
grade expectancies on students’ evaluations of their
instructor. Journal of Educational Psychology, 63,
130–133. Howley, A., Kusimo, P. S. & Parrott, L. (1999). Grading
and the ethos of effort. Learning Environments
Research, 3, 229–246. doi:10.1023/A:1011469327430 Hulten, C. E. (1925). The personal element in teachers’
marks. Journal of Educational Research, 12, 49–55. doi:10.1080/00220671.1925.10879575
Imperial, P. (2011). Grading and reporting purposes and
practices in catholic secondary schools and grades'
efficacy in accurately communicating student
learning (Doctoral dissertation). Retrieved from
ProQuest. (896956719)
Jacoby, H. (1910). Note on the marking system in the
astronomical course at Columbia College, 1909–1910.
Science, 31, 819–820. doi:10.1126/science.31.804.819 Jimerson, S. R., Egeland, B., Sroufe, L. A., & Carlson, B.
(2000). A prospective longitudinal study of high
school dropouts examining multiple predictors across
development. Journal of School Psychology, 38, 525–
549. doi:10.1016/S0022-4405(00)00051-0
Kane, M. T. (2006). Validation. In R. L. Brennan (Ed.),
Educational Measurement (4th
ed., pp. 17–64).
Westport, CT: American Council on
Education/Praeger. Kasten, K. L., & Young, I. P. (1983). Bias and the intended
use of student evaluations of university
faculty. Instructional Science, 12, 161–169.
doi:10.1007/BF00122455 Kelly, F. J. (1914). Teachers’ marks: Their variability and
standardization. Contributions to Education No. 66.
New York, NY: Teachers College, Columbia
University. Kelly, S. (2008). What types of students' effort are
rewarded with high marks? Sociology of Education,
81, 32–52. doi:10.1177/003804070808100102 Kirschenbaum, H., Napier, R., & Simon, S. B. (1971).
Wad-ja-get? The grading game in American
education. New York, NY: Hart. Klapp Lekholm, A. (2011). Effects of school
characteristics on grades in compulsory school.
Scandinavian Journal of Educational Research, 55,
587–608. doi:10.1080/00313831.2011.555923 Klapp Lekholm, A., & Cliffordson, C. (2008).
Discrepancies between school grades and test scores at
individual and school level: effects of gender and
family background. Educational Research and
Evaluation, 14, 181–199.
doi:10.1080/13803610801956663
Klapp Lekholm, A., & Cliffordson, C. (2009). Effects of
student characteristics on grades in compulsory
school. Educational Research and Evaluation, 15, 1–
23. doi:10.1080/13803610802470425 Kulick, G., & Wright, R. (2008). The impact of grading on
the curve: A simulation analysis. International Journal
for the Scholarship of Teaching and Learning, 2(2), 5.
Kunnath, J. P. (2016). A critical pedagogy perspective of
the impact of school poverty level on the teacher
grading decision-making process (Doctoral
dissertation). Retrieved from ProQuest. (10007423)
Lauterbach, C. E. (1928). Some factors affecting teachers’
marks. Journal of Educational Psychology, 19, 266–
271. Levin, H. M. (2013). The utility and need for incorporating
noncognitive skills into large-scale educational
assessments. In M. von Davier, E. Gonzalez, I. Kirsch
& K. Yamamoto (Eds.), The role of international
large-scale assessments: Perspectives from
technology, economy, and educational research (pp.
67–86). Dordrecht, Netherlands: Springer. Linn, R. L. (1982). Ability testing: Individual differences,
prediction, and differential prediction. In A. K.
Wigdor & W. R. Garner (Eds.), Ability testing: Uses,
consequences, and controversies (pp. 335–388).
Washington, DC: National Academy Press. Liu, X. (2008a, October). Measuring teachers’ perceptions
of grading practices: Does school level make a
difference? Paper presented at the Annual Meeting of
the Northeastern Educational Research Association,
Rocky Hill, CT. Liu, X. (2008b, October). Assessing measurement
invariance of the teachers’ perceptions of grading
practices scale across cultures. Paper presented at the
Annual Meeting of the Northeastern Educational
Research Association, Rocky Hill, CT. Liu, X., O'Connell, A. A., & McCoach, D. B. (2006,
April). The initial validation of teachers' perceptions
of grading practices. Paper presented at the Annual
Meeting of the American Educational Research
Association, San Francisco, CA. Llosa, L. (2008). Building and supporting a validity
argument for a standards-based classroom assessment
of English proficiency based on teacher judgments.
Educational Measurement: Issues and Practice, 27(3),
36
Brookhart et al. (2016) A Century of Grading Research
32–42. doi:10.1111/j.1745-3992.2008.00126.x
Lloyd, D. N. (1974). Analysis of sixth grade characteristics
predicting high school dropout or graduation. JSAS
Catalog of Selected Documents in Psychology, 4, 90. Lloyd, D. N. (1978). Prediction of school failure from
third-grade data. Educational and Psychological
Measurement, 38, 1193–1200.
doi:10.1177/001316447803800442
Love, D. A., & Kotchen, M. J. (2010). Grades, course
evaluations, and academic incentives. Eastern
Economic Journal, 36, 151–163.
doi:10.1057/eej.2009.6 Marsh, H. W. (1984). Students' evaluations of university
teaching: Dimensionality, reliability, validity, potential
biases, and utility. Journal of Educational Psychology,
76, 707–754. doi:10.1016/0883-0355(87)90001-2 Marsh, H. W. (1987). Students’ evaluations of university
teaching: Research findings, methodological issues,
and directions for future research. International
Journal of Educational Research, 11, 253–288.
doi:10.1016/0883-0355(87)90001-2 Marzano, R. J. & Heflebower, T. (2011). Grades that show
what students know. Educational Leadership, 69(3),
34–39. Maurer, T. W. (2006). Cognitive dissonance or revenge?
Student grades and course evaluations. Teaching of
Psychology, 33, 176–179. doi:10.1207/s15328023top3303_4
Mayo, S. T. (1970). Trends in the teaching of the first
course in measurement. National Council of
Measurement in Education Symposium Paper. Loyola
University, Chicago. Retrieved from ERIC database.
(ED047007)
McCandless, B. R., Roberts, A., & Starnes, T. (1972).
Teachers' marks, achievement test scores, and aptitude
relations with respect to social class, race, and sex.
Journal of Educational Psychology, 63, 153–159.
doi:10.1037/h0032646 McKeachie, W. J. (1979). Student ratings of faculty: A
reprise. Academe, 65, 384–397. doi:10.2307/40248725 McKenzie, R.B. (1975). The economic effects of grade
inflation on instructor evaluations: A theoretical
approach. Journal of Economic Education, 6, 99–105. doi:10.1080/00220485.1975.10845408
McMillan, J. H. (2001). Secondary teachers' classroom
assessment and grading practices.
Educational Measurement: Issues and Practice, 20(1), 20–
32. doi:10.1111/j.1745-3992.2001.tb00055.x
McMillan, J. H. (2009). Synthesis of issues and
implications for practice. In T.R. Guskey (Ed.),
Practical solutions for serious problems in standards-
based grading (pp. 105–120). Thousand Oaks, CA:
Corwin. McMillan, J. H., & Lawson, S. R. (2001). Secondary
science teachers' classroom assessment and grading
practices. Retrieved from ERIC database (ED 450
158). McMillan, J. H., Myran, S., & Workman, D. (2002).
Elementary teachers' classroom assessment and
grading practices. Journal of Educational Research,
95, 203–213. doi:10.1080/00220670209596593
McMillan, J. H., & Nash, S. (2000, April). Teacher
classroom assessment and grading decision
making. Paper presented at the Annual Meeting of the
National Council of Measurement in Education, New
Orleans, LA. McMunn, N., Schenck, P., & McColskey, W. (2003,
April). Standards-based assessment, grading, and
reporting in classrooms: Can district training and
support change teacher practice? Paper presented at
the Annual Meeting of the American Educational
Research Association, Chicago, IL. Melograno, V. J. (2007). Grading and report cards for
standards-based physical education. Journal of
Physical Education, Recreation, and Dance, 78(6),
45–53. doi:10.1080/07303084.2007.10598041
Messick, S. (1989). Validity. In R. L. Linn
(Ed.), Educational measurement (3rd ed.) (pp. 13–
103). New York, NY: American Council of Education
and Macmillan. Meyer, M. (1908). The grading of students. Science, 28,
243–252. doi:10.1126/science.28.712.243 Miner, B. C. (1967). Three factors of school achievement.
The Journal of Educational Research, 60, 370–376.
doi:10.2307/27531890 Mohnsen, B. (2013). Assessment and grading in physical
education. Strategies: A journal for physical and
sports educators, 20(2), 24–28. doi:10.1080/08924562.2006.10590709
Moore, C. C. (1939). The elementary school mark. The
Pedagogical Seminary and Journal of Genetic
Psychology, 54, 285–294.
doi:10.1080/08856559.1939.10534336 Morris, J. D., Ehren, B. J., & Lenz, B. K. (1991). Building
a model to predict which fourth through eighth graders
will drop out in high school. Journal of Experimental
Education, 59, 286–293.
doi:10.1080/00220973.1991.10806615
Myford, C. (2012). Rater cognition research: Some
possible directions for the future. Educational
Measurement: Issues and Practice, 31(3), 48–49. doi:10.1111/j.1745-3992.2012.00243.x
Nichols, S. L., & Berliner, D. C. (2007). Collateral
damage: How high stakes testing corrupts America's
schools. Cambridge, MA: Harvard Education Press.
Nicolson, F. W. (1917). Standardizing the marking system.
Educational Review, 54, 225–237. Nuffic. (2013). Grading systems in the Netherlands, the
United States and the United Kingdom. The Hague,
Netherlands: Author. O’Connor, K. (2009). How to grade for learning: Linking
grades to standards. (3rd ed.). Glenview, IL: Pearson

37
Brookhart et al. (2016) A Century of Grading Research
Professional Development. Pallas, A. M. (1989). Conceptual and measurement issues
in the study of school dropouts. In K. Namboodiri &
R. G. Corwin (Eds.), Research in the sociology of
education and socialization (Vol. 8, pp. 87–116).
Greenwich, CT: JAI. Pallas, A. M. (2003). Educational transitions, trajectories,
and pathways. In J. T. Mortimer & M. J. Shanahan
(Eds.), Handbook of the life course. New York, NY:
Kluwer Academic/Plenum. Parsons, T. (1959). The school class as a social system:
Some of its functions in American society. Harvard
Educational Review, 29, 297–318. Pattison, E., Grodsky, E., & Muller, C. (2013). Is the sky
falling? Grade inflation and the signaling power of
grades. Educational Researcher, 42, 259–265.
doi:10.3102/0013189x13481382 Pearson, K. (1930). Life of Francis Galton. London, UK:
Cambridge University Press. Polikoff, M. S., Porter, A. C., & Smithson, J. (2011). How
well aligned are state assessments of student
achievement with state content standards? American
Educational Research Journal, 48, 965–995.
doi:10.3102/0002831211410684
sQuann, C. J. (1983). Grades and grading: Historical
perspectives and the 1982 AACRAO study.
Washington, DC: American Association of Collegiate
Registrars and Admissions Officers. Randall, J., & Engelhard, G. (2009). Examining teacher
grades using Rasch measurement theory. Journal of
Educational Measurement, 46, 1–18.
doi:10.1111/j.1745-3984.2009.01066.x Randall, J., & Engelhard, G. (2010). Examining the
grading practices of teachers. Teaching and Teacher
Education, 26, 1372–1380.
doi:10.1016/j.tate.2010.03.008 Resnick, L. B. (1987). The 1987 presidential address:
Learning in school and out. Educational Researcher,
16, 13–20 + 54. doi:10.3102/0013189X016009013 Roderick, M., & Camburn, E. (1999). Risk and recovery
from course failure in the early years of High School.
American Educational Research Journal, 36, 303–
343. doi:10.3102/00028312036002303 Rojstaczer, S., & Healy, C. (2012). Where A is ordinary:
The evolution of American college and university
grading, 1940–2009. Teachers College Record,
114(7), 1–23.
Ross, C. C., & Hooks, N. T. (1930). How shall we predict
high-school achievement? The Journal of Educational
Research, 22, 184–196. doi:10.2307/27525222 Ross, J. A., & Kostuch, L. (2011). Consistency of report
card grades and external assessments in a Canadian
province. Educational Assessment, Evaluation, and
accountability, 23, 158–180. doi:10.1007/s11092-011-
9117-3 Rugg, H. O. (1918). Teachers’ marks and the
reconstruction of the marking system. The Elementary
School Journal, 18, 701–719. doi:10.1086/454643
Rumberger, R. W. (1987). High school dropouts: A review
of issues and evidence. Review of Educational
Research, 57, 101–121.
doi:10.3102/00346543057002101
Rumberger, R. W. (2011). Dropping out: Why students
drop out of high school and what can be done about it.
Cambridge, MA: Harvard University Press. Russell, J. A., & Austin, J. R. (2010). Assessment practices
of secondary music teachers. Journal of Research in
Music Education, 58, 37–54.
doi:10.1177/0022429409360062 Salmons, S. D. (1993). The relationship between students’
grades and their evaluation of instructor performance.
Applied H.R.M. Research, 4, 102–114. Sawyer, R. (2013). Beyond correlations: Usefulness of
high school GPA and test scores in making college
admissions decisions. Applied Measurement in
Education, 26, 89–112. doi:10.1080/08957347.2013.765433
Schneider, J., & Hutt, E. (2014). Making the grade: A
history of the A-F marking scheme. Journal of
Curriculum Studies, 46, 201–224.
doi:10.1080/00220272.2013.790480. Scriffiny, P. L. (2008). Seven reasons for standards-based
grading. Educational Leadership, 66(2), 70–74.
Retrieved from
http://www.ascd.org/publications/educational_leadersh
ip/oct08/vol66/num02/Seven_Reasons_for_Standards-
Based_Grading.aspx Shriner, W. O. (1930). The comparison factor in the
evaluation of examination papers. Teachers College
Journal, 1, 65–74. Shippy, N., Washer, B. A., & Perrin, B. (2013). Teaching
with the end in mind: The role of standards-based
grading. Journal of Family and Consumer Sciences,
105(2), 14–16. doi: 10.14307/JFCS105.2.5
Silberstein, N. (1922) The variability of teachers' marks.
English Journal, 11, 414–424. Simon, S. B., & Bellanca, J. A. (1976). Degrading the
grading myths: A primer of alternatives to grades and
marks. Washington, DC: Association for Supervision
and Curriculum Development. Simon, M., Tierney, R. D., Forgette-Giroux, R., Charland,
J., Noonan, B., & Duncan, R. (2010). A secondary
school teacher’s description of the process of
determining report card grades. McGill Journal of
Education, 45, 535–554. doi:10.7202/1003576ar
Sims, V. M. (1933). Reducing the variability of essay
examination marks through eliminating variations in
standards of grading. Journal of Educational
Research, 26, 637–647. doi:10.1080/00220671.1933.10880358
Smith, A. Z., & Dobbin, J. E. (1960). Marks and marking
systems. In C. W. Harris (Ed.), Encyclopedia of

38
Brookhart et al. (2016) A Century of Grading Research
educational research (3rd ed.) (pp. 783–791). New
York, NY: Macmillan. Smith, J. K. (2003). Reconsidering reliability in classroom
assessment and grading. Educational Measurement:
Issues and Practice, 22(4), 26–33. doi:10.1111/j.1745-
3992.2003.tb00141.x
Smith, J. K., & Smith, L. F. (2009). The impact of framing
effect on student preferences for university grading
systems. Studies in Educational Evaluation, 35, 160–
167. doi:10.1016/j.stueduc.2009.11.001 Snow, R. E. (1989). Toward assessment of cognitive and
conative structures in learning. Educational
Researcher, 18(9), 8–14.
doi:10.3102/0013189x018009008 Sobel, F. S. (1936). Teachers' marks and objective tests as
indices of adjustment. Teachers College Record, 38,
239–240. Spooren, P. Brockx, B, & Mortelmans, D. (2013). On the
validity of student evaluation of teaching: The state of
the art. Review of Educational Research, 83, 598–642. doi:10.3102/0034654313496870
Stanley, G., & Baines, L. (2004). No more shopping for
grades at B-Mart: Re-establishing grades as indicators
of academic performance. The Clearing House: A
Journal of Educational Strategies, Issues and Ideas,
77, 101–104. doi:10.1080/00098650409601237 Starch, D. (1913). Reliability and distribution of grades.
Science, 38, 630–636. doi:10.1126/science.38.983.630 Starch, D. (1915). Can the variability of marks be reduced?
School and Society, 2, 242–243. Starch, D., & Elliott, E. C. (1912). Reliability of the
grading of high-school work in English. School
Review, 20, 442–457. Starch, D., & Elliott, E. C. (1913a). Reliability of grading
work in mathematics. School Review, 21, 254–259. Starch, D., & Elliott, E. C. (1913b). Reliability of grading
work in history. School Review, 21, 676–681. Sun, Y., & Cheng, L. (2013). Teachers' grading practices:
Meaning and values assigned. Assessment in
Education: Principles, Policy & Practice, 21, 326–
343. doi:10.1080/0969594.2013.768207 Svennberg, L., Meckbach, J., & Redelius, K. (2014).
Exploring PE teachers' 'gut feelings': An attempt to
verbalise and discuss teachers' internalised grading
criteria. European Physical Education Review, 20,
199–214. doi:10.1177/1356336X13517437 Swan, G. M., Guskey, T. R., & Jung, L. A. (2014).
Parents’ and teachers’ perceptions of standards-based
and traditional report cards. Educational Assessment,
Evaluation and Accountability, 26, 289–299.
doi:10.1007/s11092-014-9191-4 Swineford, F. (1947). Examination of the purported
unreliability of teachers' marks. The Elementary
School Journal, 47, 516–521. doi:10.2307/3203007 Thorsen, C. (2014). Dimensions of norm-referenced
compulsory school grades and their relative
importance for the prediction of upper secondary
school grades. Scandinavian Journal of Educational
Research, 58, 127–146.
doi:10.1080/00313831.2012.705322 Thorsen, C., & Cliffordson, C. (2012). Teachers' grade
assignment and the predictive validity of criterion-
referenced grades. Educational Research and
Evaluation, 18, 153–172.
doi:10.1080/13803611.2012.659929 Tierney, R. D., Simon, M., & Charland, J. (2011). Being
fair: Teachers’ interpretations of principles for
standards-based grading. The Educational Forum, 75,
210–227. doi:10.1080/00131725.2011.577669
Troob, C. (1985). Longitudinal study of students entering
high school in 1979: The relationship between first
term performance and school completion. New York,
NY: New York City Board of Education. Troug, A. J., & Friedman, S. J. (1996). Evaluating high
school teachers’ written grading policies from a
measurement perspective. Paper presented at the
annual meeting of the National Council on
Measurement in Education, New York.
Unzicker, S. P. (1925). Teachers’ marks and intelligence.
The Journal of Educational Research, 11, 123–131.
doi:10.1080/00220671.1925.10879537 U. S. Department of Education. (1999). What Happens in
Classrooms? Instructional Practices in Elementary
and Secondary Schools, 1994–95, NCES 1999–348,
by R. R. Henke, X. Chen, G. Goldman, M. Rollefson,
& K. Gruber. Washington, DC: Author. Retrieved
from http://nces.ed.gov/pubs99/1999348.pdf Voss, H. L., Wendling, A., & Elliott, D. S. (1966). Some
types of high school dropouts. The Journal of
Educational Research, 59, 363–368. Webster, K. L. (2011). High school grading practices:
Teacher leaders’ reflections, insights, and
recommendations (Doctoral dissertation). Retrieved
from ProQuest. (3498925)
Welsh, M. E., & D'Agostino, J. (2009). Fostering
consistency between standards-based grades and large-
scale assessment results. In T. R. Guskey
(Ed.), Practical solutions for serious problems in
standards-based grading (pp. 75–104). Thousand
Oaks, CA: Corwin. Welsh, M. E., D’Agostino, J. V., & Kaniskan, R. (2013).
Grading as a reform effort: Do standards-based grades
converge with test scores? Educational Measurement:
Issues and Practice, 32(2), 26–36. doi:10.1111/emip.12009
Wiggins, G. (1994). Toward better report cards.
Educational Leadership, 52(2), 28–37. Retrieved
from: http://www.ascd.org/publications/educational-
leadership/oct94/vol52/num02/Toward-Better-Report-
Cards.aspx Wiley, C. R. (2011). Profiles of teacher grading practices:
Integrating teacher beliefs, course criteria, and

39
Brookhart et al. (2016) A Century of Grading Research
student characteristics (Doctoral dissertation).
Retrieved from ProQuest. (887719048)
Willingham, W. W., Pollack, J. M., & Lewis, C. (2002).
Grades and test scores: Accounting for observed
differences. Journal of Educational Measurement, 39,
1–37. doi:10.1002/j.2333-8504.2000.tb01838.x
Winter, R. (1993). Education or grading? Arguments for a
non-subdivided honours degree. Studies in Higher
Education, 18, 363–377. doi:10.1080/03075079312331382271
Woodruff, D. J., & Ziomek, R. L. (2004). High school
grade inflation from 1991 to 2003. (Research report
series 2004–04). Iowa City, IA: ACT. doi:10.1.1.409.9896
Yesbeck, D. M. (2011). Grading practices: Teachers'
considerations of academic and non-academic
factors (Doctoral dissertation). Retrieved from
ProQuest. (913076079)


![THE MEANING OF PROPORTIONALITY IN …1994] The Meaning ofProportionality in Sentencing 491 The efforts of the United Kingdom Criminal Law Commissioners in the mid nineteenth century](https://img.pdfslide.net/doc/110x75/5e4278bf508faa2e0e07cf70/the-meaning-of-proportionality-in-1994-the-meaning-ofproportionality-in-sentencing.jpg)