Embed Size (px)
Citation preview
Bi-Level Technologies
From the SelectedWorks of Ron D. Katznelson
November 17, 2014
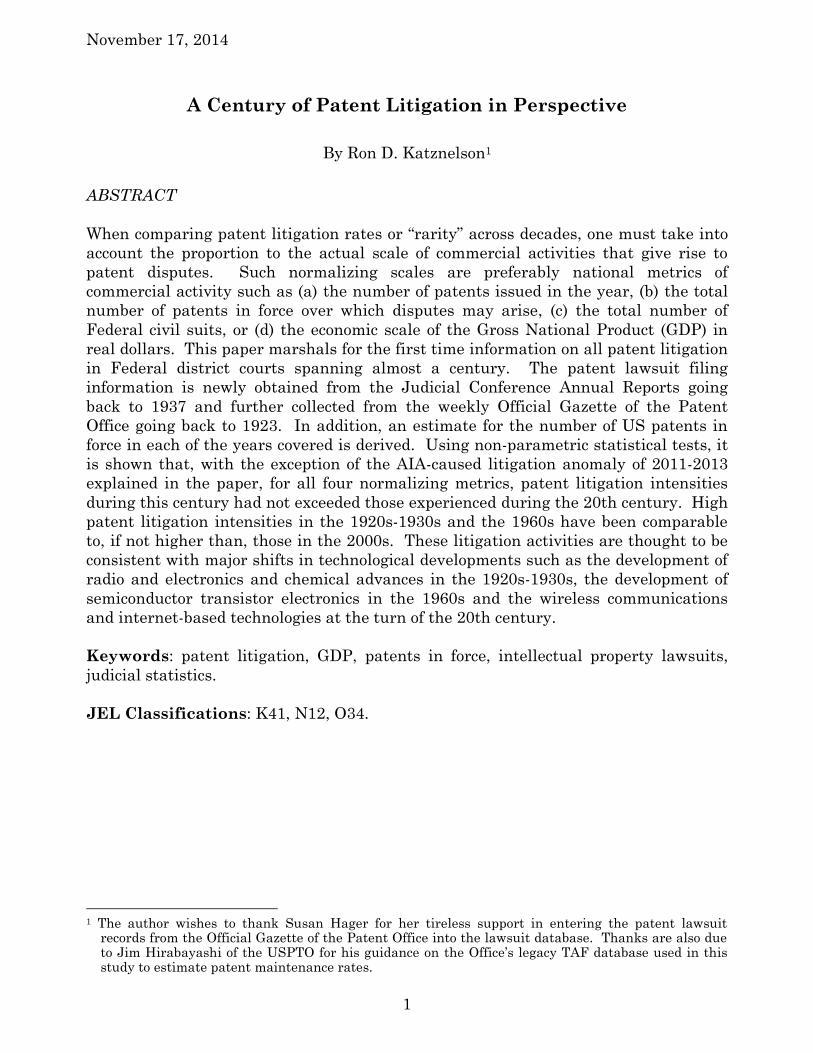
A Century of Patent Litigation in PerspectiveRon D Katznelson, Bi-Level Technologies
Available at: https://works.bepress.com/rkatznelson/77/
November 17, 2014
1
A Century of Patent Litigation in Perspective
By Ron D. Katznelson1
ABSTRACT
When comparing patent litigation rates or “rarity” across decades, one must take into
account the proportion to the actual scale of commercial activities that give rise to
patent disputes. Such normalizing scales are preferably national metrics of
commercial activity such as (a) the number of patents issued in the year, (b) the total
number of patents in force over which disputes may arise, (c) the total number of
Federal civil suits, or (d) the economic scale of the Gross National Product (GDP) in
real dollars. This paper marshals for the first time information on all patent litigation
in Federal district courts spanning almost a century. The patent lawsuit filing
information is newly obtained from the Judicial Conference Annual Reports going
back to 1937 and further collected from the weekly Official Gazette of the Patent
Office going back to 1923. In addition, an estimate for the number of US patents in
force in each of the years covered is derived. Using non-parametric statistical tests, it
is shown that, with the exception of the AIA-caused litigation anomaly of 2011-2013
explained in the paper, for all four normalizing metrics, patent litigation intensities
during this century had not exceeded those experienced during the 20th century. High
patent litigation intensities in the 1920s-1930s and the 1960s have been comparable
to, if not higher than, those in the 2000s. These litigation activities are thought to be
consistent with major shifts in technological developments such as the development of
radio and electronics and chemical advances in the 1920s-1930s, the development of
semiconductor transistor electronics in the 1960s and the wireless communications
and internet-based technologies at the turn of the 20th century.
Keywords: patent litigation, GDP, patents in force, intellectual property lawsuits,
judicial statistics.
JEL Classifications: K41, N12, O34.
1 The author wishes to thank Susan Hager for her tireless support in entering the patent lawsuit
records from the Official Gazette of the Patent Office into the lawsuit database. Thanks are also due to Jim Hirabayashi of the USPTO for his guidance on the Office’s legacy TAF database used in this study to estimate patent maintenance rates.
November 17, 2014
2
1 Introduction
Recent years brought a proliferation of articles that describe and quantify a purported
“explosion” in patent litigation.2 The causes for this purported explosive rise are often
attributed to technological change, the Federal Circuit “patent-friendly” court, the
growth of patenting, poor “patent quality,” and to litigation tactics of non-practicing
entities (NPE), or the illdefined “Patent Assertion Entities” (PAEs), pejoratively called
“patent trolls.”3 A recent White House report on PAEs states without supporting
sources that “[t]he increased prevalence of PAE suits, and patent suits in general, in
recent years stands in contrast to the 20th century, when suits for patent infringement
were relatively rare.”4 However, without the context of the general scale of commercial
activity, this statement is meaningless because the number of all federal civil suits “in
recent years stands in contrast to the 20th century,” when civil suits “were relatively
rare:” about 283,000 Federal civil suits were filed in 2010 compared to only about
54,600 filed in 1950;5 in Federal district courts, about 3,700 trademark suits were filed
in 2010 compared to only about 200 filed in 1950;6 and about 2,000 copyright suits
were filed in 2010 compared to only 165 filed in 1950.7
Therefore, when comparing patent litigation “rates” across decades, one should cover
periods of major technological change, and one must take into proportional account the
actual scale of the economy and the commercial activities that give rise to patent
disputes. Normalization measures for the number of patent suits are preferably the
growing user base of new technologies as manifested by commercial activity indicia
such as (a) the number of issued patents in the year, (b) the total number of patents in
force over which disputes may arise, (c) the total number of Federal civil suits, and (d)
the Gross National Product (GDP) in real dollars. All four of these normalizing
measures are used in this study.
Previous studies on historical numbers of patent lawsuits relied on the limited data
from the Federal Judicial Center, Federal Court Cases Integrated Database8 which
unfortunately does not cover the years before 1970. As a result, these studies do not
cover some major technological development eras of the 20th century.9 Moreover,
2 James Bessen and Michael J. Meurer, “The Patent Litigation Explosion,” 45 Loyola U. Chi. L. J. 401
(2014); Adam. B. Jaffe and Josh Lerner, Innovation and its discontents: How our broken patent system is endangering innovation and progress, and what to do about it. Princeton University Press, (2004) p13.
3 Colleen Chien, “Patent Trolls by the Numbers,” Patently-O Blog (March 14, 2013), available at www.patentlyo.com/patent/2013/03/chien-patent-trolls.html.
4 The White House, “Patent Assertion and U.S. Innovation,” (June 4, 2013), p 5, (emphasis added), available at www.whitehouse.gov/sites/default/files/docs/patent_report.pdf.
5 Annual Report of the Director of the Administrative Office of the United States Courts (1950; 2010). 6 Id. 7 Id. 8 Database available from the Inter-University Consortium for Political and Social Research (ICPSR) in
Ann Arbor, MI. www.icpsr.umich.edu. 9 Studies of patent litigation statistics covering periods beginning on or later than 1970 include: Alan C.
Marco, Shawn P. Miller, and Ted M. Sichelman, “Do Economic Downturns Dampen Patent Litigation?” (October 27, 2014). 5th Annual Conference on Empirical Legal Studies paper. Available at SSRN: http://ssrn.com/abstract=1641425; John L. Turner, “In Defense of the Patent Friendly Court Hypothesis: Theory and Evidence,” (April 2005). Available at http://ssrn.com/abstract=713601; Deepak Somaya, “Firm Strategies and Trends in Patent Litigation in the United States.” In: Gary D.
November 17, 2014
3
most of these studies report the absolute number of filed patent cases without
normalization to relevant economic activity measures.
A recent study by Zorina Khan10 covered the period 1790 to 2000 with a temporal
granularity of a decade, using patent lawsuit data from Lexis and from published
volumes of reports of patent cases. Although published judicial opinions may be a
good way to track the development of case law, they are deficient proxies for the actual
number of historical patent disputes. Cases litigated to a decision were only a small
subset of all lawsuits filed, and reported decisions, even a smaller subset of that, with
reporting coverage that varied over time.11 Indeed, Khan acknowledged the
limitations of reported decisions count as a source, but her results are nevertheless
qualitatively highly instructive.
Khan’s study of the number of reported patent lawsuits over two centuries reveals
that historically, as a fraction of issued patents, reported litigation rates in the first
part of the 19th century exceeded that of the last two decades by about a factor of five.12
She finds that high litigation rates in given technological fields were correlated with
the advent of disruptive technologies13 and observes that “vexatious and costly
litigation about all areas of law—patents, property, contracts, and torts alike—were
inevitably associated with the advent of important disruptive innovations.”14
Importantly, Khan also documents the robust NPE activity and patent litigation,
finding that it is not new and tracing such activity to the patent “wars” of the 19th and
early 20th centuries.15
This present study aims to fill the void in studies on the national aggregate statistics
of all patent lawsuit filings before 1970. The contributions of this study are twofold:
first, sources for such litigation information are identified and data compiled for the
fiscal years beginning in 1923 through 2013. It is recognized with virtual certainty
that, short of collecting individual archival records prior to 1923 from each district
court, no national compilation of patent lawsuit filings earlier than 1923 likely exists.
Second, in order to derive the important normalizing measure of the total number of
patents in force each year, a detailed analysis of this measure is provided which
factors for each year (a) the number of issued patents, (b) the number of patents
Libecap (Ed.), Advances in the Study of Entrepreneurship, Innovation and Economic Growth. (G. Libecap, ed), JAI Press, Greenwich, CT. (2004) pp. 103–148; William Landes, "An Empirical Analysis of Intellectual Property Litigation: Some Preliminary Results,” 41 Houston Law Review 749 (2004); Gauri.Prakash-Canjels, "Trends in Patent Cases: 1990-2000." 41 Idea 283 (2001); .Jon F. Merz, and Nicholas M. Pace, “Trends in Patent Litigation: The Apparent Influence of Strengthened Patents Attributable to the Court of Appeals for the Federal Circuit,” 76 J. Patent and Trademark Office Society, 579 (1994).
10 Zorina B. Khan, “Trolls and Other Patent Inventions: Economic History and The Patent Controversy in the Twenty-First Century,” 21 Geo. Mason L. Rev. 825 (2014).
11 Matthew Henry, Thomas P. McGahee, and John L. Turner, “Dynamics of Patent Precedent and Enforcement: An Introduction to the UGA Patent Litigation Datafile,” (March 4, 2013). Available at http://ssrn.com/abstract=2228103
12 Id., at 861, Figure 3. 13 Id., at 862-863 (showing the effects on litigation rates in the telegraph, telephone and automobile
industries). 14 Id., at 842. 15 Id., at 833-835, 839-842.
November 17, 2014
4
expired at the end of their term, (c) the number of patents expired earlier than their
term for failure to pay maintenance fees, (d) the distribution of post-GATT patents
having patent term greater than 17 years (but no more than 20 years) based on
prosecution pendency time.
Finally, a statistical analysis of patent lawsuit filing rates normalized by the four
normalizing measures described above is presented. It is shown that, with the
exception of the AIA-caused litigation anomaly of 2011-2013 explained in the paper,
for all four normalizing metrics, patent litigation intensities in recent years had not
exceeded those experienced during the 20th century.
2 Data and methods
2.1 Patent litigation data
Beginning in 1873, national compilation and reporting of civil cases filed in Federal
district courts were published in the Annual Reports of the Attorney General of the
United States.16 Unfortunately, no breakdown of the number of civil suits by the
nature of suit was reported and thus the number of patent suits cannot be obtained
from these annual reports. It was not until January 1935 that the Justice Department
inaugurated a new system for compiling Federal court statistics. Under this system,
individual reports of civil and criminal cases were furnished monthly by court officials
by means of punch cards and a central IBM Hollerith tabulating machine was used to
compile the annual statistics.17 For fiscal years 1935-1936, the Annual Reports of the
Attorney General reported the total number of intellectual property suits (patent,
copyright, and trademark suits) in a single table entry. The first fiscal year for which
those counts are available separately is 1937, although they were not reported until
after 1940, when the Administrative Office of the United States Courts was organized
and had taken over the Department of Justice's system.18 Separate numbers for suits
filed in patent, copyright, and trademark cases are therefore available from fiscal year
1937 onwards in Table C-2 and its predecessors in the Annual Report of the Director of
the Administrative Office of the United States Courts, which this study relies upon.
No appeal cases were included in these counts.
Fortunately, patent lawsuit filing events for earlier years since fiscal year 1923 have
been reported on a weekly basis in the weekly Official Gazette of the US Patent Office,
albeit requiring laborious week-by-week and case-by-case collection and data entry. In
the Act of February 18, 1922, Congress codified in R.S. §4921, the predecessor of 35
U.S.C. §290, a Federal court reporting requirement: “it shall be the duty of the clerks
of such courts within one month after the filing of any action, suit, or proceeding
arising under the patent laws to give notice thereof in writing to the Commissioner of
Patents…”19 In turn, the US Patent Office published these notices shortly thereafter
16 Will Shafroth, “Federal Judicial Statistics,” 13 Law & Contemp. Probs. 200, 204 (1948). See also Will
Shafroth, “A Short Bibliography of Judicial Statistics,” 38 Law Libr. J. 37 (1945). 17 Annual Report of the Attorney General of the United States for the Fiscal Year 1935, Washington, D.C.
(1935) p183; Shafroth (1948) note 16 supra, at 205. 18 Id. 19 Revised Statutes § 4921, Ch. 58, § 8, 42 Stat. 392 (Feb. 18, 1922).
November 17, 2014
5
in its weekly Official Gazette,20 identifying the patents involved, the inventor(s), the
suit filing date, the parties’ names, and the court docket number.
Copies of the weekly “Patent Suits” sections appearing in the Official Gazette of the
United States Patent Office during the years 1922-1937 were obtained, from which a
total of 14,617 suit records from district courts (excluding circuit court appeals) were
manually entered in a database of filed patent cases. Of these cases, 14,155 have
filing dates between July 1, 1922 and June 30, 1937, corresponding to Fiscal Years
1923 through 1937.21 In addition, 14 cases were reported with no filing date and for
the purpose of this study, these were recorded as having been filed in the fiscal year in
which the respective notice was published in the Official Gazette.
In a check for the completeness of the Patent Office “Patent Suits” data, it was found
that the number of filed cases reported for FY 1937 (870 cases) was about 87% of that
reported by the Administrative Office of the United States Courts for that fiscal year
(1,004 cases). This under-reporting by the courts to the Patent Office appears
consistent with similar comparisons of more recent data elsewhere.22 Therefore, the
data in this study for the fiscal years 1923-1936 likely underestimate by more than
10% the actual numbers of patent suits during those years.
2.2 Derivation of the number of patents in force
The number of utility patents in force by the end of each fiscal year is derived as
follows. The number of issued patents each fiscal year was obtained from the US
Patent and Trademark Office’s (PTO) annual reports starting from 1905. To begin,
two important legal changes affecting patent term must be considered. The first is the
establishment of the patent maintenance fee system that came into effect in 1981.23
Failure to pay maintenance fees during any of the maintenance windows at 4, 8 and
12 years after issue results in early patent expiration. Initial effects of this law
occurred in 1985 for patents issued in 1981 that expired at the first maintenance
window for failure to pay maintenance fees. The second key legal change is that
Congress enacted in the Uruguay Round Agreements Act24 implementing the General
Agreement on Tariffs and Trade (GATT). Under this legislation, the 17-year patent
term was changed and 35 U.S.C. § 154(a)(2) since provides that patents filed on or
after June 8, 1995 have a term of 20 years from the priority application date.
Moreover, under § 154(c)(1) the term of a patent that was in force on or that results
from an application filed before June 8, 1995 is the greater of the 20-year term, or 17
years from grant.
Finally, relevant legal changes that have had no effect on the present analysis are as
follows: Patent term adjustments under 35 U.S.C. § 154(b) began taking effect only for
20 Official gazette of the United States Patent Office, (starting in 1922). 21 This fiscal year choice was made for want of consistency with the fiscal year reporting system of the
later data from the Annual Report of the Director of the Administrative Office of the United States Courts.
22 Somaya (2004), note 9 supra, at 108. 23 P.L. 96-517, 94 Stat 3015 (Dec. 12, 1980); 35 U.S.C. §41(b). 24 Pub. Law 103-465, 108 Stat 4809, December 8, 1994.
November 17, 2014
6
patents issued after 2000 and as such, the effects are not manifested in patent
expirations for patents issued to date. Moreover, the number of patents having terms
extended due to the FDA approval process under 35 U.S.C. § 156 is negligible for the
purposes of this analysis, as PTO data shows that the terms of only about 70 such
patents per year are extended.25
Accordingly, three separate counting treatments of issued patents were used: the first
is for all “Old Patents” issued between 1905 and June 8, 1978. These have had a
simple term of 17 years from issue as they were subject to neither maintenance fees
nor GATT effects. A simple running 17-year “leaky” accumulation establishes the
number of patents in force for this category. The second treatment is for all patents
with priority application dates later than June 7, 1975, as they are subject to GATT
effects under § 154(c)(1). The third is the maintenance effects affecting all patents
issued since 1981 and overlapping the second treatment.
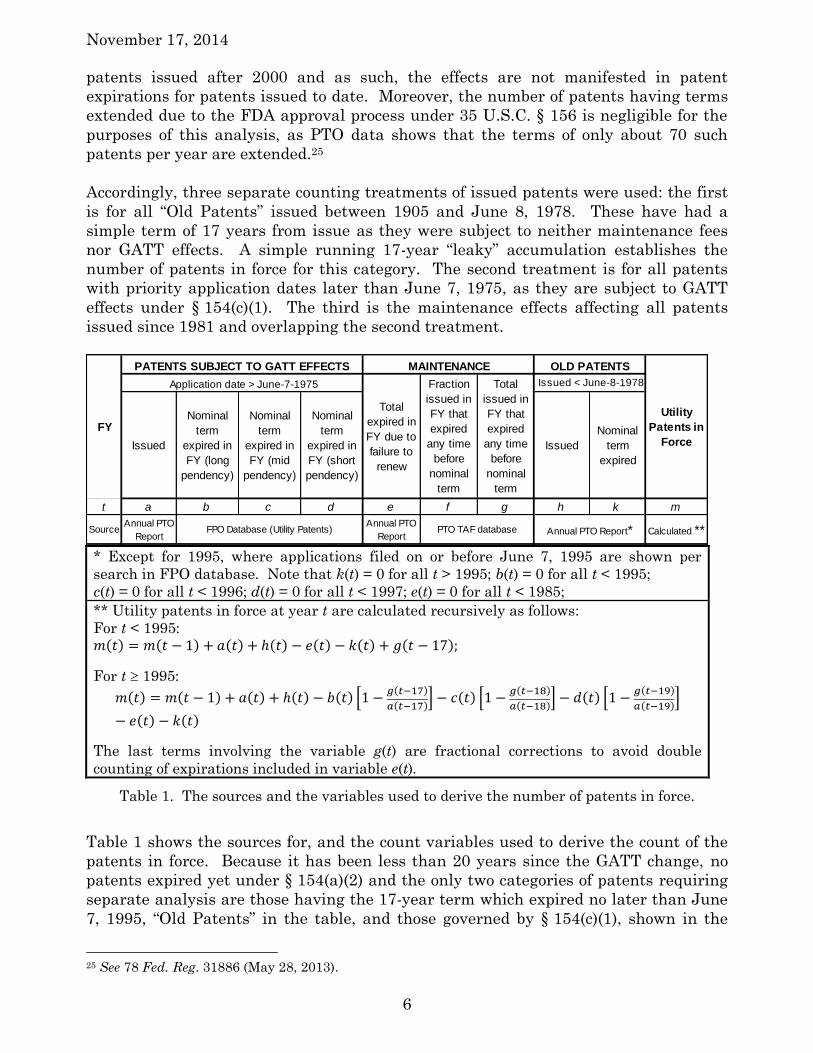
* Except for 1995, where applications filed on or before June 7, 1995 are shown per
search in FPO database. Note that k(t) = 0 for all t > 1995; b(t) = 0 for all t < 1995;
c(t) = 0 for all t < 1996; d(t) = 0 for all t < 1997; e(t) = 0 for all t < 1985;
** Utility patents in force at year t are calculated recursively as follows:
For t < 1995: 𝑚(𝑡) = 𝑚(𝑡 − 1) + 𝑎(𝑡) + ℎ(𝑡) − 𝑒(𝑡) − 𝑘(𝑡) + 𝑔(𝑡 − 17);
For t 1995:
𝑚(𝑡) = 𝑚(𝑡 − 1) + 𝑎(𝑡) + ℎ(𝑡) − 𝑏(𝑡) [1 −𝑔(𝑡−17)
𝑎(𝑡−17)] − 𝑐(𝑡) [1 −
𝑔(𝑡−18)
𝑎(𝑡−18)] − 𝑑(𝑡) [1 −
𝑔(𝑡−19)
𝑎(𝑡−19)]
− 𝑒(𝑡) − 𝑘(𝑡)
The last terms involving the variable g(t) are fractional corrections to avoid double
counting of expirations included in variable e(t).
Table 1. The sources and the variables used to derive the number of patents in force.
Table 1 shows the sources for, and the count variables used to derive the count of the
patents in force. Because it has been less than 20 years since the GATT change, no
patents expired yet under § 154(a)(2) and the only two categories of patents requiring
separate analysis are those having the 17-year term which expired no later than June
7, 1995, “Old Patents” in the table, and those governed by § 154(c)(1), shown in the
25 See 78 Fed. Reg. 31886 (May 28, 2013).
Issued
Nominal
term
expired in
FY (long
pendency)
Nominal
term
expired in
FY (mid
pendency)
Nominal
term
expired in
FY (short
pendency)
Issued
Nominal
term
expired
t a b c d e f g h k m
SourceAnnual PTO
Report
Annual PTO
ReportCalculated **
FY
FPO Database (Utility Patents) Annual PTO Report*
OLD PATENTS
Issued < June-8-1978 Application date > June-7-1975
PATENTS SUBJECT TO GATT EFFECTS MAINTENANCE
Fraction
issued in
FY that
expired
any time
before
nominal
term
Total
issued in
FY that
expired
any time
before
nominal
term
Total
expired in
FY due to
failure to
renew
PTO TAF database
Utility
Patents in
Force
November 17, 2014
7
table as “patents subject to GATT effects.” Expirations from both categories were
combined. In addition, the numbers of early expirations under the maintenance
system were derived from the PTO’s Technology Assessment and Forecast (“TAF”)
database, from which count variables f and g were derived.
Patents subject to GATT effects were divided into three coarse indicator sets (count
variables a, b and c) depending on their pendency in prosecution. These were
determined by selective search on FreePatentsOnline.com (FPO) for the number of
patents filed 20 years prior to the focal fiscal year t and issued within 3-4 years (b), 2-3
years (c), and 1-2 years (d) from their filing window. These were used to estimate a
proportional correction and shorten the otherwise 20-year term of the patents as
shown in the second equation in Table 1.
Noteworthy is the fact that the results obtained in this analysis for US utility patents
in force are within 1% of the limited results published by the World Intellectual
Property Organization for the years 2004-2012.26
2.3 Civil suits data
The numbers of civil lawsuits filed over the years manifest trends in the overall scale
of all disputes taken up by the Federal district courts. As one of the normalizing
measures for patent litigation, the annual total numbers of civil suits filed in federal
district courts were obtained from Table C-2 and its predecessors in the Annual Report
of the Director of the Administrative Office of the United States Courts for fiscal years
1937-2013. The rest of the data for the years 1923-1936 were obtained from the
Annual Reports of the Attorney General, wherein all civil cases were included in the
tally with the exception of cases brought by the government under the National
Prohibition Act of 1919.27 As a control for civil suits related to patents, the numbers
for copyright and trademark suits were separately obtained from Table C-2 for the
Fiscal Years 1937-2013.
2.4 Real GDP data
The US Bureau of Economic Analysis (BEA) is the official government source for Gross
Domestic Product (GDP) information. It now reports GDP in “real” dollars based on
chain-weighted indexes. These indexes use updated weights in order to provide a
more accurate picture of the economy, to better capture changes in spending patterns
and in prices, and to eliminate the bias present in fixed-weighted indexes.28 However,
BEA’s GDP data coverage begins at 1929. Fortunately, the BEA real chained dollar
index was extended to cover US GDP starting at 1790 by MeasuringWorth.com.29 For
26 See “WIPO IP Statistics Data Center,” Patents In Force Indicator. Available at
www.wipo.int/ipstats/en/statistics/patents/. 27 Civil prohibition cases artificially inflated the count until the Act’s repeal in December of 1933.
According to the Annual Reports of the Attorney General, 1932 saw a record high of 15,455 prohibition cases brought by the government.
28 J. Steven Landefeld, Brent R. Moulton, and Cindy M. Vojtech, “Chained-Dollar Indexes, Issues, Tips on Their Use, and Upcoming Changes,” Bureau of Economic Analysis (November 2003). Available at www.bea.gov/scb/pdf/2003/11November/1103%20Chain-dollar.pdf.
29 See www.measuringworth.com/usgdp/.
November 17, 2014
8
this study, this source was used to obtain the GDP data in Real 2009 chained dollars
for 1923 to 2013.
2.5 Statistical Analysis
The annual numbers of patent lawsuits (shown in Figure 1) were normalized by (a) the
number of issued patents in the year (result shown in Figure 2); (b) the total number
of patents in force at the end of the year (result shown in Figure 3); (c) the total
number of Federal civil suits in the year (result shown in Figure 4), and (d) the Gross
National Product (GDP) in real dollars (result shown in Figure 5).
The White House assertion described in the introduction, that the increased
prevalence of patent suits “in recent years stands in contrast to the 20th century,
when suits for patent infringement were relatively rare” is tested here. As explained
above this statement is meaningless without considering economic scales and thus the
terms “prevalence” and “relatively rare” are taken to mean as the lawsuit filing rate
relative to other relevant economic activity rates – such as the four normalizing time-
series discussed above. These four normalized litigation time series as shown in
Figure 2 through Figure 5 form the set, which we define as “litigation intensities.”
Because litigation intensities are always positive (asymmetric, bounded from below)
and because the magnitudes of their temporal fluctuations are not sufficiently small
compared to their mean values, their distributions cannot be taken as normal.
Therefore, statistical inferences should rely on non-parametric methods used when the
distributions are unknown. Accordingly, the two hypotheses consistent with the
White House assertion to be tested are formulated non-parametrically as follows:
HA: Patent litigation intensity after the year 2000 had a maximum excursion that
exceeded any of the excursions in the period 1923-2000.
HB: Patent litigation intensity distribution after the year 2000 differed from the
distribution in the period 1923-2000.
It follows that the alternative to Hypothesis HB is a null hypothesis H0:
H0: The patent litigation intensity distributions of both time periods are identical,
so that there is a 50% probability that an intensity value randomly selected
from one time period exceeds an observation randomly selected from the other
time period.
Hypothesis HA and its logical complement are readily tested by a simple peak
excursion test, comparing maximum intensities in both periods. The testing of H0
against HB is accomplished by using the non-parametric Mann-Whitney test, also
called the Wilcoxon rank sum test. The results of these tests are tabulated in Table 2
below.
3 Discussion of Results
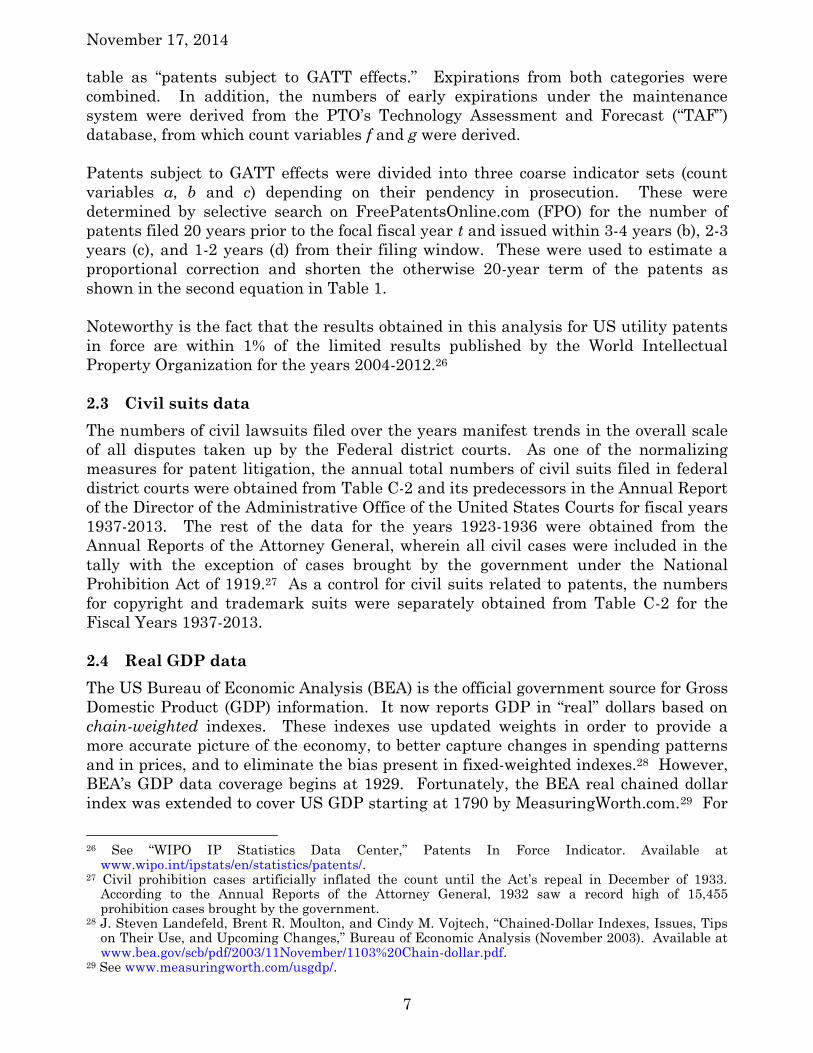
The annual numbers of patent lawsuits are shown in Figure 1. The normalization by
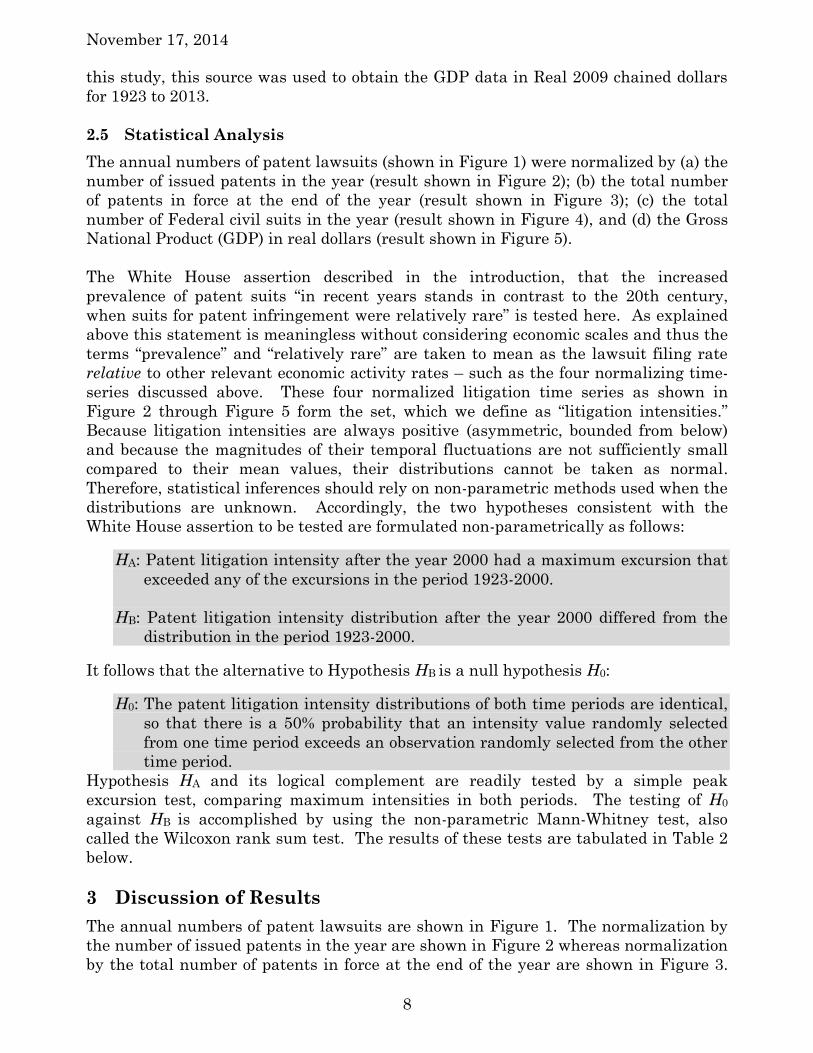
the number of issued patents in the year are shown in Figure 2 whereas normalization
by the total number of patents in force at the end of the year are shown in Figure 3.

November 17, 2014
9
Normalization by the total number of Federal civil suits in the year is shown in Figure
4 and the normalization by the GDP is shown in Figure 5.
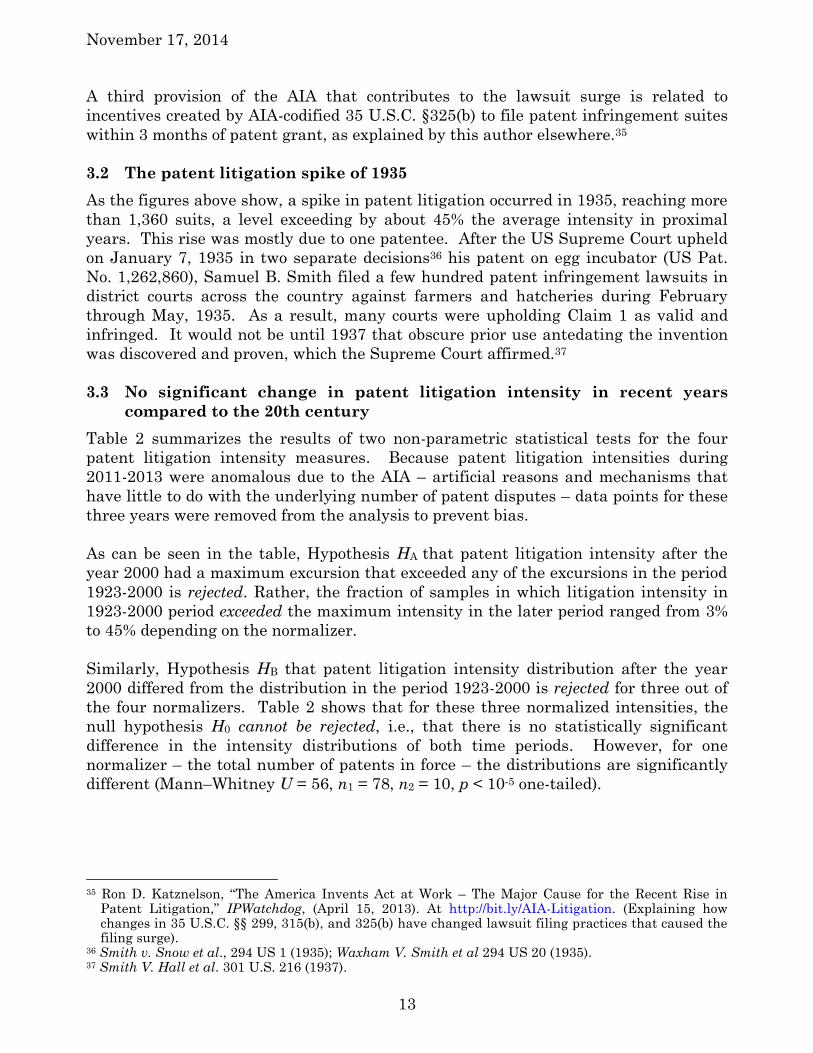
Several observations can be made: substantial reduction in patent litigation intensity
occurred during World War II. Figure 5 shows that this decline also occurred in
copyright and trademark litigation. A preliminary examination of the types of patents
asserted during the relatively high patent litigation period of the 1920s and 1930s
indicates substantial rise of the chemical technologies and particularly in the new field
called electronics. These recorded cases show a large share of lawsuits involving
patents on radio and vacuum tube electronics, consistent with historical reports of
litigation surge involving such patents30 Indeed, litigation followed years of brisk
patenting and development in the vacuum tube electronics and radio fields.31 This
suggests that further studies should examine the degree to which such surges of
patent litigation activities shown in the figures are related to major shifts in
technological developments such as the development of radio and vacuum tube
electronics in the 1920s-1930s, the development of semiconductor transistor
electronics in the 1960s and the wireless communications and internet-based
technologies at the turn of the 20th century
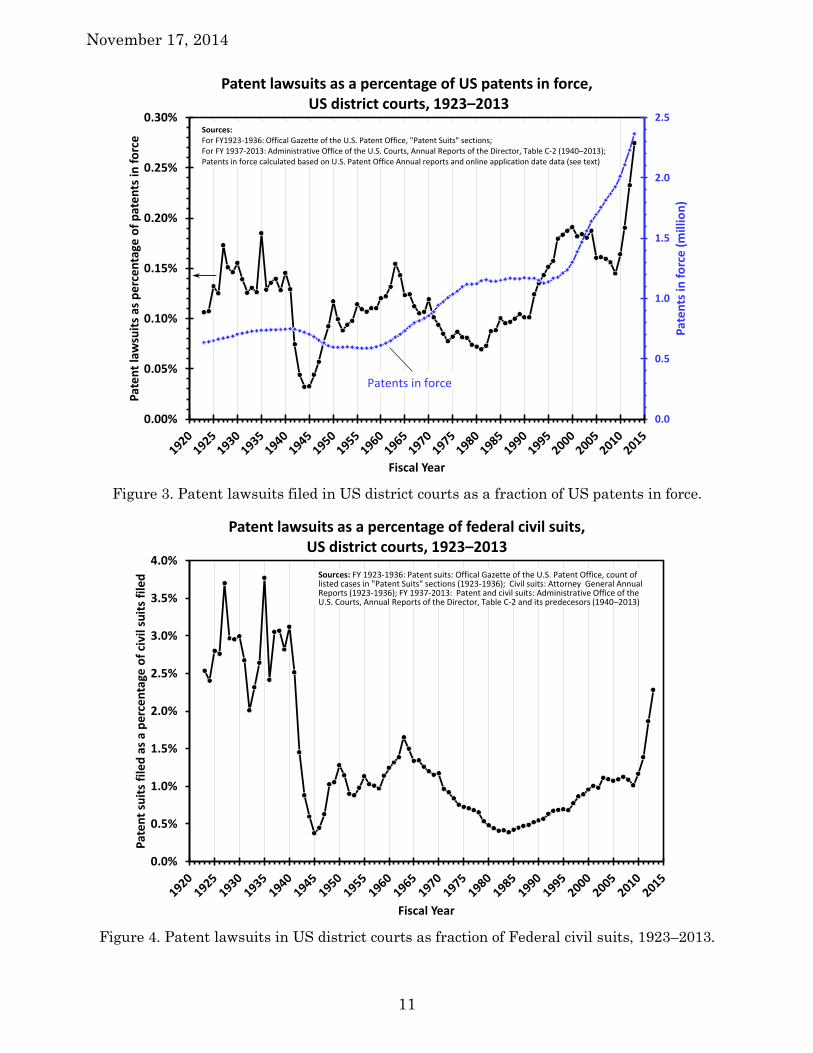
Figure 3 shows a substantial rise in the number of patents in force after 1995. This
trend is attributable to three factors: (a) the effective extension of patent term due to
GATT for patents having prosecution pendency shorter than 3 years, (b) the steady
increase in patent maintenance rate, prolonging the average patent life,32 and (c) an
increase volume of new patent issued. All figures show that the number of patent
lawsuits surged in 2011-2013. As discussed below, this is directly attributable to the
America Invents Act (AIA) and is not reflective of an underlying increase in the
number of litigated patent disputes.
3.1 The AIA lawsuit filing surge
Several factors created by the AIA caused, and will likely continue to cause, increased
rate of lawsuit filings. The effects of these factors were building up even before
passage of the AIA in September 2011, as patentees acted in anticipation of more
adverse legal conditions at various phases of the AIA implementation. As codified by
the AIA, 35 U.S.C. § 299 substantially curtails joinder of multiple defendants in a
single case, requiring multiple lawsuits where one would have been filed before
September 2011. Thus, the AIA forced patentees to file more lawsuits, each naming
only one defendant.
30 W. Maclaurin, Radio Patent Litigation, Appendix II in Invention and Innovation in the Radio
Industry, pp. 268-287. Arno Press and the New York Times, New York (1971). 31 John Howells and Ron D. Katznelson, “The Coordination of Independently-Owned Vacuum Tube
Patents in the Early Radio Alleged Patent 'Thicket',” (June 13, 2014). Available at SSRN: http://ssrn.com/abstract=2450025 (describing the brisk development of vacuum tube inventions from 1912 to 1920 that were later litigated in the 1920s and 1930s); K. R. Thrower, “Evolution of circuit design for A.M. broadcast receivers: 1900-1935,” 56 Journal of the Institution of Electronic and Radio Engineers, pp. 325-341, (October/December 1986).
32 Dennis Crouch, “Patent Maintenance Fees,” Patently-O Blog, (September 26, 2012). At http://patentlyo.com/patent/2012/09/patent-maintenance-fees.html.
November 17, 2014
10
Figure 1. Patent lawsuit filings in US district courts, 1923-2013.
Figure 2. Patent lawsuits in US district courts as percentage of patents issued in the year.
100
1,000
10,000
Pat
en
t la
wsu
it f
ilin
gs in
fis
cal y
ear
Fiscal Year
Patent lawsuit filings, US district courts, 1923–2013
Sources: FY 1923-1936: Patent suits: Offical Gazette of the U.S. Patent Office, count of listed cases in "Patent Suits" sections (1923-1937); FY 1937-2013: Patent and civil suits: Administrative Office of the U.S. Courts, Annual Reports of the Director, Table C-2 and its predecesors (1940–2013)
0.0%
0.5%
1.0%
1.5%
2.0%
2.5%
3.0%
3.5%
4.0%
Pat
en
t su
its
file
d r
ela
tive
to
pat
en
ts is
sue
d
Fiscal Year
Patent lawsuits as a percentage of patents issued in the year, US district courts, 1923–2013
Sources: Issued patents: Commissioner of Patents and USPTO Annual Reports, (1923-2013);. Patent suits: Offical Gazette of the U.S. Patent Office, (1923-1937); FY 1937-2013: Administrative Office of the U.S. Courts, Annual Reports of the Director, Table C-2 and its predecesors (1940–2013).
November 17, 2014
11
Figure 3. Patent lawsuits filed in US district courts as a fraction of US patents in force.
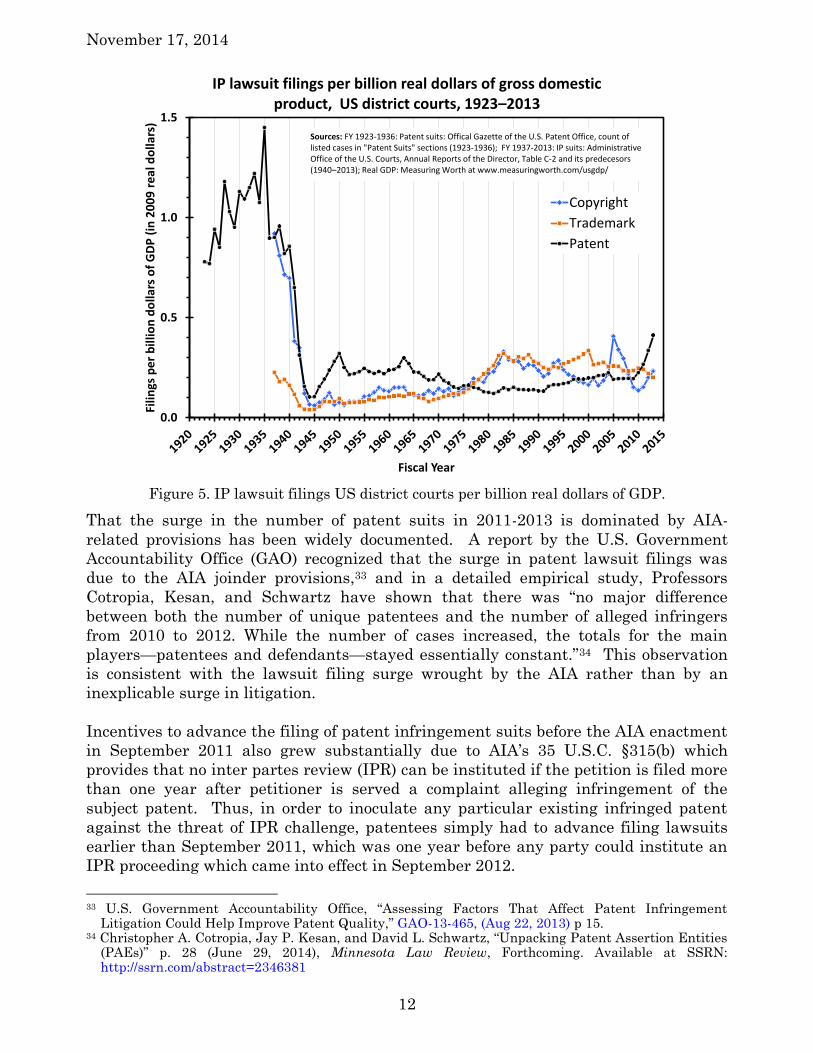
Figure 4. Patent lawsuits in US district courts as fraction of Federal civil suits, 1923–2013.
0.0
0.5
1.0
1.5
2.0
2.5
0.00%
0.05%
0.10%
0.15%
0.20%
0.25%
0.30%
Pat
en
ts in
fo
rce
(m
illio
n)
Pat
en
t la
wsu
its
as p
erc
en
tage
of
pat
en
ts in
fo
rce
Fiscal Year
Patent lawsuits as a percentage of US patents in force,US district courts, 1923–2013
Sources:For FY1923-1936: Offical Gazette of the U.S. Patent Office, "Patent Suits" sections;For FY 1937-2013: Administrative Office of the U.S. Courts, Annual Reports of the Director, Table C-2 (1940–2013);Patents in force calculated based on U.S. Patent Office Annual reports and online application date data (see text)
Patents in force
0.0%
0.5%
1.0%
1.5%
2.0%
2.5%
3.0%
3.5%
4.0%
Pat
en
t su
its
file
d a
s a
pe
rce
nta
ge o
f ci
vil s
uit
s fi
led
Fiscal Year
Patent lawsuits as a percentage of federal civil suits, US district courts, 1923–2013
Sources: FY 1923-1936: Patent suits: Offical Gazette of the U.S. Patent Office, count of listed cases in "Patent Suits" sections (1923-1936); Civil suits: Attorney General Annual Reports (1923-1936); FY 1937-2013: Patent and civil suits: Administrative Office of the U.S. Courts, Annual Reports of the Director, Table C-2 and its predecesors (1940–2013)
November 17, 2014
12
Figure 5. IP lawsuit filings US district courts per billion real dollars of GDP.
That the surge in the number of patent suits in 2011-2013 is dominated by AIA-
related provisions has been widely documented. A report by the U.S. Government
Accountability Office (GAO) recognized that the surge in patent lawsuit filings was
due to the AIA joinder provisions,33 and in a detailed empirical study, Professors
Cotropia, Kesan, and Schwartz have shown that there was “no major difference
between both the number of unique patentees and the number of alleged infringers
from 2010 to 2012. While the number of cases increased, the totals for the main
players—patentees and defendants—stayed essentially constant.”34 This observation
is consistent with the lawsuit filing surge wrought by the AIA rather than by an
inexplicable surge in litigation.
Incentives to advance the filing of patent infringement suits before the AIA enactment
in September 2011 also grew substantially due to AIA’s 35 U.S.C. §315(b) which
provides that no inter partes review (IPR) can be instituted if the petition is filed more
than one year after petitioner is served a complaint alleging infringement of the
subject patent. Thus, in order to inoculate any particular existing infringed patent
against the threat of IPR challenge, patentees simply had to advance filing lawsuits
earlier than September 2011, which was one year before any party could institute an
IPR proceeding which came into effect in September 2012.
33 U.S. Government Accountability Office, “Assessing Factors That Affect Patent Infringement
Litigation Could Help Improve Patent Quality,” GAO-13-465, (Aug 22, 2013) p 15. 34 Christopher A. Cotropia, Jay P. Kesan, and David L. Schwartz, “Unpacking Patent Assertion Entities
(PAEs)” p. 28 (June 29, 2014), Minnesota Law Review, Forthcoming. Available at SSRN: http://ssrn.com/abstract=2346381
0.0
0.5
1.0
1.5
Filin
gs p
er
bill
ion
do
llars
of
GD
P (
in 2
00
9 r
eal
do
llars
)
Fiscal Year
IP lawsuit filings per billion real dollars of gross domestic product, US district courts, 1923–2013
Copyright
Trademark
Patent
Sources: FY 1923-1936: Patent suits: Offical Gazette of the U.S. Patent Office, count of listed cases in "Patent Suits" sections (1923-1936); FY 1937-2013: IP suits: Administrative Office of the U.S. Courts, Annual Reports of the Director, Table C-2 and its predecesors (1940–2013); Real GDP: Measuring Worth at www.measuringworth.com/usgdp/
November 17, 2014
13
A third provision of the AIA that contributes to the lawsuit surge is related to
incentives created by AIA-codified 35 U.S.C. §325(b) to file patent infringement suites
within 3 months of patent grant, as explained by this author elsewhere.35
3.2 The patent litigation spike of 1935
As the figures above show, a spike in patent litigation occurred in 1935, reaching more
than 1,360 suits, a level exceeding by about 45% the average intensity in proximal
years. This rise was mostly due to one patentee. After the US Supreme Court upheld
on January 7, 1935 in two separate decisions36 his patent on egg incubator (US Pat.
No. 1,262,860), Samuel B. Smith filed a few hundred patent infringement lawsuits in
district courts across the country against farmers and hatcheries during February
through May, 1935. As a result, many courts were upholding Claim 1 as valid and
infringed. It would not be until 1937 that obscure prior use antedating the invention
was discovered and proven, which the Supreme Court affirmed.37
3.3 No significant change in patent litigation intensity in recent years
compared to the 20th century
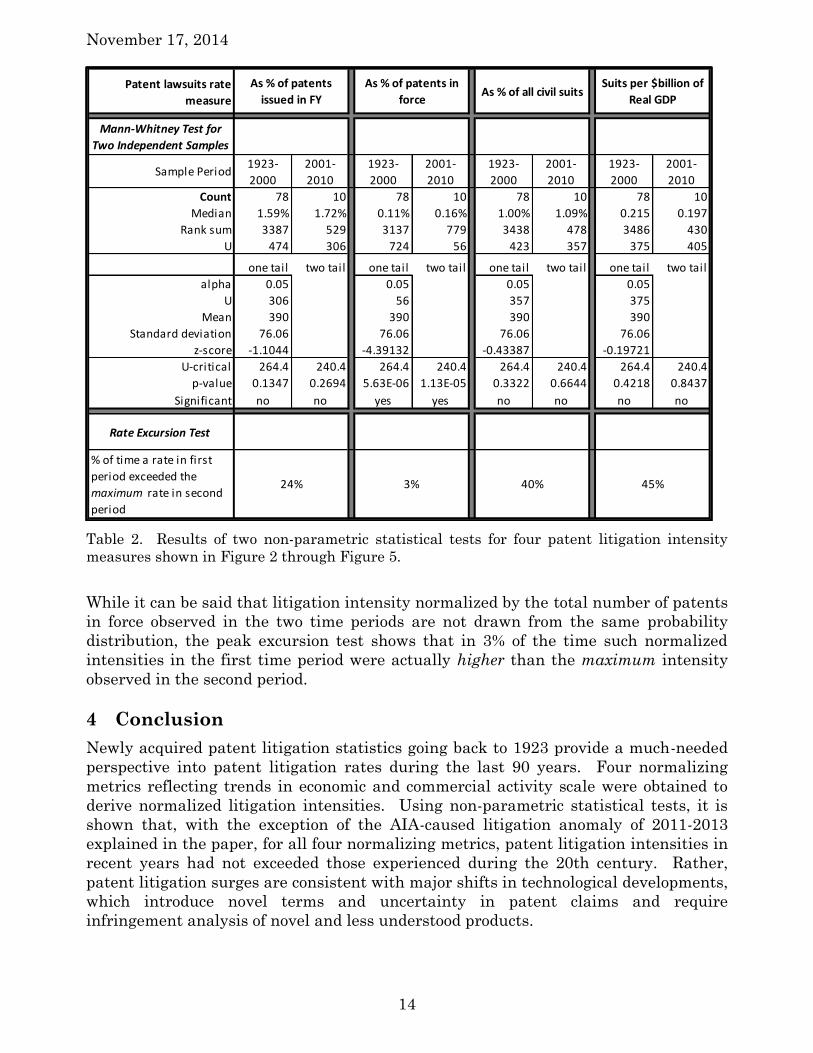
Table 2 summarizes the results of two non-parametric statistical tests for the four
patent litigation intensity measures. Because patent litigation intensities during
2011-2013 were anomalous due to the AIA – artificial reasons and mechanisms that
have little to do with the underlying number of patent disputes – data points for these
three years were removed from the analysis to prevent bias.
As can be seen in the table, Hypothesis HA that patent litigation intensity after the
year 2000 had a maximum excursion that exceeded any of the excursions in the period
1923-2000 is rejected. Rather, the fraction of samples in which litigation intensity in
1923-2000 period exceeded the maximum intensity in the later period ranged from 3%
to 45% depending on the normalizer.
Similarly, Hypothesis HB that patent litigation intensity distribution after the year
2000 differed from the distribution in the period 1923-2000 is rejected for three out of
the four normalizers. Table 2 shows that for these three normalized intensities, the
null hypothesis H0 cannot be rejected, i.e., that there is no statistically significant
difference in the intensity distributions of both time periods. However, for one
normalizer – the total number of patents in force – the distributions are significantly
different (Mann–Whitney U = 56, n1 = 78, n2 = 10, p < 10-5 one-tailed).
35 Ron D. Katznelson, “The America Invents Act at Work – The Major Cause for the Recent Rise in
Patent Litigation,” IPWatchdog, (April 15, 2013). At http://bit.ly/AIA-Litigation. (Explaining how changes in 35 U.S.C. §§ 299, 315(b), and 325(b) have changed lawsuit filing practices that caused the filing surge).
36 Smith v. Snow et al., 294 US 1 (1935); Waxham V. Smith et al 294 US 20 (1935). 37 Smith V. Hall et al. 301 U.S. 216 (1937).
November 17, 2014
14
Table 2. Results of two non-parametric statistical tests for four patent litigation intensity
measures shown in Figure 2 through Figure 5.
While it can be said that litigation intensity normalized by the total number of patents
in force observed in the two time periods are not drawn from the same probability
distribution, the peak excursion test shows that in 3% of the time such normalized
intensities in the first time period were actually higher than the maximum intensity
observed in the second period.
4 Conclusion
Newly acquired patent litigation statistics going back to 1923 provide a much-needed
perspective into patent litigation rates during the last 90 years. Four normalizing
metrics reflecting trends in economic and commercial activity scale were obtained to
derive normalized litigation intensities. Using non-parametric statistical tests, it is
shown that, with the exception of the AIA-caused litigation anomaly of 2011-2013
explained in the paper, for all four normalizing metrics, patent litigation intensities in
recent years had not exceeded those experienced during the 20th century. Rather,
patent litigation surges are consistent with major shifts in technological developments,
which introduce novel terms and uncertainty in patent claims and require
infringement analysis of novel and less understood products.
Patent lawsuits rate
measure
Mann-Whitney Test for
Two Independent Samples
Sample Period1923-
2000
2001-
2010
1923-
2000
2001-
2010
1923-
2000
2001-
2010
1923-
2000
2001-
2010
Count 78 10 78 10 78 10 78 10
Median 1.59% 1.72% 0.11% 0.16% 1.00% 1.09% 0.215 0.197
Rank sum 3387 529 3137 779 3438 478 3486 430
U 474 306 724 56 423 357 375 405
one tail two tail one tail two tail one tail two tail one tail two tail
alpha 0.05 0.05 0.05 0.05
U 306 56 357 375
Mean 390 390 390 390
Standard deviation 76.06 76.06 76.06 76.06
z-score -1.1044 -4.39132 -0.43387 -0.19721
U-critical 264.4 240.4 264.4 240.4 264.4 240.4 264.4 240.4
p-value 0.1347 0.2694 5.63E-06 1.13E-05 0.3322 0.6644 0.4218 0.8437
Significant no no yes yes no no no no
Rate Excursion Test
% of time a rate in first
period exceeded the
maximum rate in second
period
As % of patents
issued in FY
As % of patents in
forceAs % of all civil suits
24% 3% 40% 45%
Suits per $billion of
Real GDP