Embed Size (px)
Citation preview

ww.sciencedirect.com
b i o s y s t em s e ng i n e e r i n g 1 4 7 ( 2 0 1 6 ) 1 9 3e2 0 5
Available online at w
ScienceDirect
journal homepage: www.elsevier .com/ locate/ issn/15375110
Research Paper
A CFD study on improving air flow uniformity inindoor plant factory system
Ying Zhang, Murat Kacira*, Lingling An
Department of Agricultural and Biosystems Engineering, The University of Arizona, Tucson, AZ, USA
a r t i c l e i n f o
Article history:
Received 23 January 2016
Received in revised form
17 April 2016
Accepted 22 April 2016
Published online 12 May 2016
Keywords:
Boundary layer
CFD
Lettuce
Plant factory
Tipburn
Uniformity
* Corresponding author.E-mail address: [email protected]
http://dx.doi.org/10.1016/j.biosystemseng.201537-5110/Published by Elsevier Ltd on beha
Indoor plant factories are one of the alternative ways to meet the demands of food pro-
duction for the increased urban dwellers. It enables growers to grow food crops consis-
tently and locally with high quality. In an indoor plant factory, a forced convection based
ventilation and circulation system is used to control the growing environment and
maintain climate uniformity. Lettuce is a common leafy crop grown in indoor plant fac-
tories and an improper design could cause the tip burn of lettuces which usually occurs at
inner and newly developing leaves with low transpiration rate due to the existence of a
stagnant boundary layer under high transpiration demand. A three-dimensional compu-
tational fluid dynamics (CFD) model was developed and validated through simulating the
growing environment in a single shelf production system. An improved air circulation
system was designed and proposed to help providing a dynamic and uniform boundary
layer which could help preventing tip burn occurrences in lettuce production. A perforated
air tube with three rows of air jets was designed to provide vertical air flow down to the
crop canopy surface. Four cases with the perforated air tubes were compared with a control
treatment. The results indicated that the case with two perforated air tubes was able to
provide an average air velocity of 0.42 m s�1 with a coefficient of variation of 44%, which
was recommended as the optimal design of air circulation system among four cases in this
study.
Published by Elsevier Ltd on behalf of IAgrE.
1. Introduction
Population expansion, climate change, and limited natural
resources all require the development of innovative agricul-
tural technologies to meet the rising global demand for food
and agricultural sustainability. Controlled environment agri-
culture (CEA) combines various agricultural technologies and
enables growers to control environmental variables to opti-
mise crop growing systems, crop yield and quality, as well
du (M. Kacira).16.04.012lf of IAgrE.
resource use efficiency (Jones, 2005). As a new form of CEA, an
indoor plant factory is typically placed in a multi-story
building or a warehouse around an urban area. It enables
growers to grow crop consistently year around and locally
with high food quality (Kozai, 2013; Kozai, Chun, & Ohyama,
2004).
In indoor plant factories, ventilation systems play an
important role to replace air in the controlled environment
food production systems to provide favourable growing
Nomenclature
r fluid density (kg m�3)
t time (s)
x Cartesian coordinates (m)
i Cartesian coordinates index
u Velocity component (m s�1)
j Cartesian coordinates index
d Kroneckor delta
m dynamic viscosity (kg m�1 s�1)
g acceleration due to gravity (m s�2)
Ca specific heat capacity (W kg�1 K�1)
T temperature (K)
ST thermal sink or source (W m�3)
E heat load (W)
h convection heat transfer coefficient
(W m�2 K�1)
Ts surface temperature (K)
T∞ fluid temperature (K)
q00cond conductive heat transfer rate (W m�2)
k thermal conductivity coefficient (W m�1 K�1)
q00rad radiant heat flux (W m�2)
ε Emissivity
s StefaneBoltzmann constant (W m�2 K�4)
q volumetric heat generation (W m�3)
q00conv convective heat flux (W m�2)
Vhs heat source volume (m3)
uout outlet air velocity (m s�1)
Q outlet flow rate (m3 s�1)
Aout outlet opening area (m2)
Ks roughness height (m)
Cs roughness constant
hc height of the crop (m)
b i o s y s t em s e n g i n e e r i n g 1 4 7 ( 2 0 1 6 ) 1 9 3e2 0 5194
environment and desirable air movement. The importance of
airflow control for promoting the photosynthesis and tran-
spiration of plants has been demonstrated by previous
research (Kitaya, Tsuruyama, Shibuya, Yoshida, & Kiyota,
2003; Korthals, Knight, Christianson, & Spomer, 1994;
Shibuya & Kozai, 1998). Compared to the maturity of ventila-
tion technologies for greenhouses, few studies have been
conducted to study ventilation, climate and air flow unifor-
mity characteristics in an indoor plant factory and the design
guidelines are still lacking. The improper design of air condi-
tioning and air distribution systems in an indoor plant factory
can cause non-uniform environmental condition and airflow
patterns, leading to non-uniform crop growth, uneven quality
and crop disorders.
Tip burn in lettuce crop is a calcium deficiency induced
disorder and it is characterized by browning margins in let-
tuces (Aloni, Pashkar, & Libel, 1986; Shear, 1975). It usually
occurs at inner and newly developing leaves with low tran-
spiration rate due to the existence of a stagnant boundary
layer under high transpiration demand conditions (Barta &
Tibbitts, 1991; Clarkson, 1984). In order to prevent or reduce
lettuce tip burn, one of themethods is to increase air supply to
the leaf surfaces of lettuce. The principle is to enhance the
transpiration rate of lettuce by accelerating air movement at
leaf surface to decrease the boundary layer resistance both at
leaf or at crop canopy scale (Downs & Krizek, 1997; Fitter &
Hay, 1981; Yabuki, 1990). Kitaya (2005) reported the effect of
air velocity (horizontal direction) less than 1.3m s�1 on the net
photosynthetic rate and transpiration rate on a seedlings
canopy and single leaves of cucumber. For the cucumber
seedlings canopy, the net photosynthetic rate and transpira-
tion rate increased respectively by 1.2 and 2.8 times when the
air velocity was increased from 0.02 to 1.3 m s�1. For the single
leaves of cucumber, the net photosynthetic rate and transpi-
ration rate increased respectively by 1.7 and 2.1 times when
the air velocity was increased from 0.005 to 0.8 m s�1. The
results showed that enhancing the wind velocity has a posi-
tive effect on photosynthesis and transpiration. The pro-
motions of the net photosynthetic rate and transpiration rate
by enhancing air velocity (horizontal direction) around crops
for other crops were also reported, such as a dwarferice plant
canopy with air current speed increased from 0.01 to 0.8 m s�1
(Kitaya, Tsuruyama, Kawai, Shibuya, & Kiyota, 2000) and
sweet potato leaveswith air current speed increased from 0.01
to 1 m s�1 (Kitaya et al., 2003). The effects of providing hori-
zontal airflow to lettuce for preventing tipburn in an indoor
plant factory were studied (Lee et al., 2013). Although a stable
horizontal airflow of 0.28 m s�1 significantly reduced the
incidence of tip burn of lettuce, tip burn was still detected in
the inner leaves near harvest at the centre of the cultivation
bed, where there was high light intensity and less air flow due
to the enclosure effect of outer leaves (Chang & Miller, 2004).
Compared to horizontal airflow, vertical airflow is more
effective for suppressing the occurrence of tip burn by blowing
airflow into the lower and inner part of leaves (Goto &
Takakura, 1992; Shibata, Iwao, & Takano, 1995). Vertical
downwards air currents with airspeeds higher than 0.3 m s�1
around plants were suggested for promoting the photosyn-
thetic and transpiration rates of plants in plant culture sys-
tems (Kitaya et al., 2000).
Interactions of environmental variables in a multi-layer
indoor plant factory system are complex involving a number
of physical and chemical properties of overall system and
various system configurations that are challenging to model
numerically, time consuming and cost prohibitive. Compu-
tational fluid dynamics (CFD) has been shown to be an effec-
tive tool in simulating physical complex phenomena with
reasonable accuracy and analysing environmental uniformity
in controlled environments. The CFD technology has been
shown to be an effective and mature tool to be used in
controlled environment agriculture for analysing aero-
dynamics, and climate and complex fluid phenomena (Baeza
et al., 2009; Bournet, Ould Khaoua, & Boulard, 2007; Fatnassi,
Poncet, Bazzano, Brun, & Bertin, 2015; Fidaros, Baxevanou,
Bartzanas, & Kittas, 2010; Lee & Short, 2000; Majdoubi,
Boulard, Fatnassi, & Bouirden, 2009; Tamimi, Kacira, Choi, &
An, 2013). Therefore, it was decided to investigate if CFD
could be an effective engineering tool to evaluate and enhance
system designs for improved air conditioning and microcli-
mate uniformity within multi-tier crop growing systems.
The objectives of this study contain 1) to develop a vali-
dated three dimensional CFD model to simulate growing
environment in a single shelf production system, and 2) to
b i o s y s t em s e ng i n e e r i n g 1 4 7 ( 2 0 1 6 ) 1 9 3e2 0 5 195
design and propose an improved air circulation system that
can provide a desired average uniform airspeed of 0.3e1m s�1
at the crop canopy surface level to help preventing lettuce tip
burn in the production shelf system.
2. Materials and methods
2.1. Experimental setup for model validation
In this study, numerical simulations have been conducted to
verify the capability of CFD to predict air velocity and tem-
perature distribution in a single shelf of a multi-tier food
production system equipped with a forced ventilation system
and with fluorescent lamps (energy source). The experiment
for model validation study was performed on a single shelf of
a small multi-tier vertical food production system prototype
as a test-bed with dimensions of 0.46 m (Width) � 0.86 m
(Length) � 0.33 m (Height). Two fluorescent lamps (901621-T5,
24 W, Spectralux, Sunlight Supply Inc., Vancouver, WA, USA)
were installed in an aluminium housing with a reflector at the
centre area close to the ceiling of the shelf. Four exhaust fans
(Ari flow: 0.013 m3 s�1, AD0812LB-A70GL, ADDA, Mouser
Electronics, Mansfield, TX, USA) were placed evenly (with the
distance between the centres of two neighbouring fans set at
0.21 m) on the back side wall. One air inlet
(0.14 m W � 0.33 m H) on front side wall was created as a
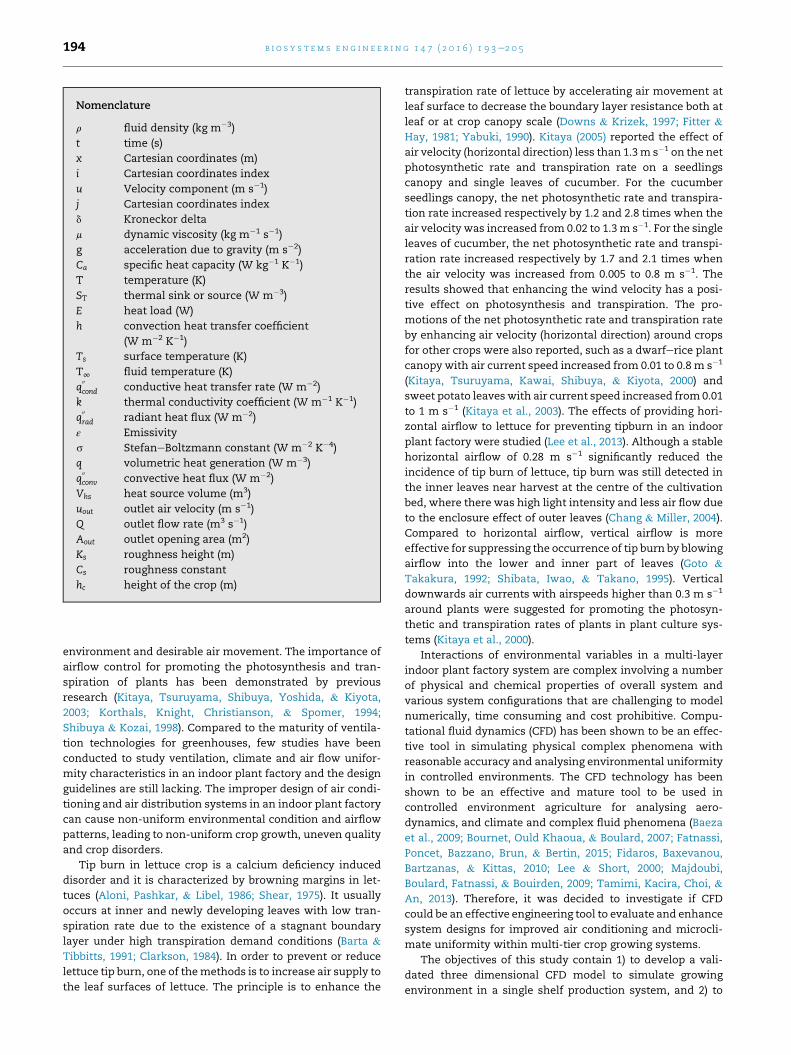
pressure-inlet. Two hot-wire anemometers (FMA-905-V-R,
Range: 0e25 m s�1, Accuracy: ±1.5% of full scale at room
temperature, OMEGA Engineering, Stamford, CA, USA) were
used to measure average horizontal air speed at five different
coordinates with different heights and distances to the
exhaust fans (Fig. 1). Fine thermocouples (T-type) were used to
Fig. 1 e Sensor locations for measurements a) Front view b) Sid
shelf. ¼ hot wire anemometer (air velocity), ¼ fine thermocou
temperature and RH).
measure the average surface temperature on the lamp surface
(3 points) and on the reflector (1 point) and the air temperature
(the point close to the exhaust fans) (Fig. 1). Two capacitance
sensors (HMP60, Measurement range: �40 �C to þ60 �C, Ac-curacy: ±0.6 �C, Vaisala, Woburn, MA, USA) were used to
measure air temperature and relative humidity (Measurement
range: 0e100% non-condensing, Accuracy at 0 �C to þ40 �C:±3% RH (0e90% Relative Humidity)) at two points (Fig. 1). All
sensors were connected to a data logger (CR 1000, Campbell
Scientific, Logan, UT, USA). Surface temperature data were
recorded every second for 5 min, air temperature/relative
humidity data were recorded every second for 15 min, as with
the airspeed. For each measurement, the data were averaged
and were used for comparisons between measured and CFD
simulated data.
2.2. CFD model
A commercial CFD software (FLUENT, Ver. 16.1, ANSYS Inc.,
Canonsburg, PA) was used for simulations. The fluid flow in
the problem domain was assumed to be a steady-state,
incompressible, and three dimensional turbulent flow. The
numerical calculation of airflow can be considered as math-
ematical formulations of the conservation laws of fluid me-
chanics. By applying the mass, momentum, and energy
conservation, the fundamental governing equations of fluid
dynamics; the mass (1), momentum (NaviereStokes) (2), and
energy (3) equation can be written as follows (Norton & Sun,
2006):
vr
vtþ v
vxi
�ruj
� ¼ 0 (1)
e view c) Top view d) 3D view of the prototype production
ple (lamp surface temperature), ¼ capacitance sensor (air
b i o s y s t em s e n g i n e e r i n g 1 4 7 ( 2 0 1 6 ) 1 9 3e2 0 5196
v
vtðruiÞ þ v
vxj
�ruiuj
� ¼ v
vxi
�� rdij þ m
�vui
vxjþ vuj
vxi
��þ rgi (2)
v
vtðrCaTÞ þ v
vxj
�rujCaT
�� v
vxj
�lvTvxj
�¼ ST (3)
The two-equation k-epsilon model was employed to
compute the contributions of turbulence to the mean flow by
solving two additional governing equations for turbulent
kinetic energy (k) and turbulent dissipation (ε). It is one of the
most common two equation models for specifying a turbu-
lent flow (Jiru & Bitsuamlak, 2010). This model has been
widely used in agricultural engineering (Bustamante et al.,
2013) as well as in describing the turbulent nature of fluid
flow in greenhouse models (Bournet et al., 2007; Kacira, Sase,
& Okushima, 2004; Kim et al., 2008; Mistriotis, Bot, Picuno, &
Scarascia-Mugnozza, 1997; Rohdin & Moshfegh, 2007;
Tamimi et al., 2013). In this study, the realizable k-epsilon
model was used to compute the turbulent effect of air flow.
This turbulence model has shown substantial improvements
over the standard k-epsilon model where the flow features
include strong streamline curvature, vortices, and rotation
(Posner, Buchanan, & Dunn-Rankin, 2003; Shih, Liou, Shab-
bir, Yang, & Zhu, 1994) and has shown to be more accurate
for predicting the spreading rate of both planar and round
jets (Fluent User's Guide, 2012), which is the case in the
current study with the jets created by the perforated air tube
design. It is also likely to provide superior performance for
flows involving rotation, boundary layers under strong
adverse pressure gradients, separation, and recirculation
(Shih et al., 1994). The realizable k-epsilon model has been
successfully used to simulate indoor wall-bounded air flows
for ventilation system design in a mushroom house (Han
et al., 2009) and airflow pattern in a plant factory (Lim &
Kim, 2014).
3. Numerical simulation: model validation
3.1. Numerical model and boundary conditions
A three-dimensional computational model was created based
on the measured dimensions of a single prototype production
shelf. There are three heat transfer mechanisms for the T5
fluorescent lamps in the model: convection, conduction, and
radiation. The energy use efficiencies of lamps vary between
different models andmanufacturers (Thimijan&Heins, 1983).
Thimijan and Heins (1983) reported that for a 46 W of cool-
white fluorescent lamp, 22 W of energy was lost by heat and
14W of energy was emitted as thermal radiation. Thus, 78% of
total energy was converted into heat and about 50% of total
energy was lost through conduction and convection. Simi-
larly, Gilani, Montazeri, and Blocken (2013) defined light bulbs
as energy source with 50% of total power used for heat gen-
eration. In the boundary conditions, the heat loss due to
convection was set at lamp surfaces. The heat loss due to
infrared radiation and conduction from the lamps was
assigned to the topwall of the shelf and the wall of the canopy
surface. The heat source with 50% of total power lost by
volumetric convection from T5 fluorescent lamp surface was
defined as the energy term with a constant heat generation of
114,833 W m�3 according to Eq. (4) (Gilani et al., 2013):
q ¼ EVhs
(4)
where q is the volumetric heat generation (W m�3), E is the
heat load (W), and Vhs is the heat source volume (m3).
Table 1 summarises the boundary conditions and the nu-
merical parameters used for three-dimensional CFD simula-
tion. The operating air temperature for the simulations was
set to 297 K which was the air temperature in the roomwhere
the experiments were conducted. The thermal properties of
glass for the fluorescent lamp and aluminium for the lamp
housing, the reflector and the shelf were defined and assigned
to the walls according to thematerial properties (Table 2). The
walls were assumed to be smooth. Since the air temperature
difference in the shelf is small, the Boussinesq approximation
for airflow was used in order to achieve a faster convergence
(Lau & Liu, 2003). This approximation assumes that the air
density is constant and it considers the influence of buoyancy
on air movements in the momentum equation. The air ve-
locity as boundary condition at the exhaust fan was set to
3.1 m s�1, based on the volumetric flow rate of the fan, and it
was calculated as:
uout ¼ Q
Aout(5)
where uout is the air velocity (m s�1) at the exhaust fan
boundary,Q is the outlet volumetric flow rate (m3 s�1), andAout
is the outlet opening area (m2).
The computational grid had 593,511 cells with three-
dimensional elements of combined tetrahedron, pyramid,
and hexahedronmeshing. A finermesh was imposed near the
fluorescent lamps and exhaust fans, where the thermal and
pressure gradients were steeper. Furthermore, mesh quality
was confirmed by evaluating the skewness (0.3 ± 0.1), aspect
ratio (1.9 ± 0.5), and orthogonal quality (0.8 ± 0.1) to improve
accuracy and stability of numerical computations.
3.2. Solver settings
In this study, the SIMPLE algorithm was used for pressur-
eevelocity coupling (Patankar, 1980). For spatial discretisa-
tion, least square cell based scheme was employed for
gradient term. The standard scheme was applied for the
pressure term. First order discretisation schemes were used
for momentum, energy and viscous terms of the governing
equations for a better convergence of calculations (Mirade &
Daudin, 2006). The convergence criterion was set to 10�6 on
energy term and 10�3 on all other terms to evaluate if the
solution is converged or not.
4. Numerical simulation: design of aircirculation system for a single cultivation shelf
4.1. Geometry of the computational model
The computational model for an air circulation system design
with dimensions 1.52 m (W) � 1.52 m (L) � 0.3 m (H) was

Table 1 e Boundary conditions summary for CFD simulations for model validation.
Fluid: Aira
Operating air temperature in the production domain: 297 K
Gravitational acceleration: 9.81 m s�2
Energy source (T5 fluorescent lamps): 114,833 W m�3
Models Property
Energy model Activated
Viscous model Realizable k-epsilon model with standard wall functions and full buoyancy
effect
Parameter Boundary conditions Property
Exhaust fans Velocity-inlet 3.1 m s�1
Inlet-vent Pressure-inlet Gauge pressure: 0 Pa
Lamp-wall Wall Thermal property of glassb
Lamp housing, reflector, shelf walls Wall Thermal property of aluminium
a From Doxon (2007).b From Brunberg and Aspelin (2011).
Table 2 e Thermal properties of matter used in the CFD model.
Thermal property Air Glass Plastic Leaf Aluminium
Density (kg m�3) 1.225 2500 1430 1078 2719
Specific heat (J kg�1 K�1) 1005 830 1150 3100 871
Thermal conductivity (W m�1 K�1) 2.53 � 10�3 1.3 0.52 0.55 202.4
Dynamic viscosity (kg m�1 s�1) 1.783 � 10�5
Thermal expansion coefficient (K�1) 3.43 � 10�3
b i o s y s t em s e ng i n e e r i n g 1 4 7 ( 2 0 1 6 ) 1 9 3e2 0 5 197
created based on the size of a representative single shelf from
a commercial scale indoor plant factory with the width of
1.52 m and a height of 0.3 m from the top wall to the lettuce
canopy surface. Because the replicated phenomenon for fluid
flow along the shelf was expected in this study, themodel was
assumed to be a slice of the shelf with the length of 1.52 m.
Two side walls of the shelf were defined as symmetry walls in
the simulations. In order to achieve a desired photosynthetic
photon flux density of 230 mmol m�2 s�1 at the bottom wall of
the geometry (assumed to be crop canopy surface level), eight
T8 fluorescent lamps (T8, 32W, Photon flux: 48 mmol s�1, Phi-
lips) for a production area of 1.74 m2 were added and evenly
distributed in the model with the distance of 0.15 m between
the centreline of two neighbouring lamps.
In order to enhance air movement and to help preventing
tip burn symptoms of lettuces in an indoor plant factory,
inserting relevant parallel lines on the existing lighting sys-
tems close to the top wall to provide a vertical air flow to crop
canopy surface was recommended as one of the methods of
installing an air flow apparatus (Lee et al., 2013). A poly-
ethylene perforated air tube was designed as part of the air
circulation system to provide vertical air flow to lettuce can-
opy surface in this study. The target air current speed at the
canopy surface was set between 0.3 m s�1 (Kitaya et al., 2000)
and 1 m s�1 (Wells & Amos, 1994).
The perforated polyethylene air tube had a diameter of
0.05 m with a length of 1.52 m based on the layout and size of
the shelf. Instead of placing an air tube between each two
lamps, a perforated air tube with three rows of jets was
designed for a wider airflow coverage at the canopy surface.
Although the aperture ratio, defined as the total hole area to
the tube cross-sectional area, less than 1.5 is suggested to
have a uniform air jet along perforated air tube (Wells&Amos,
1994), the small diameter of air tube restricts the application of
this principle with. A smaller aperture ratio for a fixed diam-
eter of a perforated tube means that a decreased hole size or
decreased number of holes with increased distance between
two holes has to be applied for having a smaller total hole
area. This can also cause a non-uniform air flow distribution
at the target surface due to possible stagnant air zones be-
tween two holes where air jets from the tube cannot reach.
Therefore, the design of the perforated air tube was adjusted
by changing aperture ratio and maintaining the space be-
tween two holes to be no less than 1.5 times of the maximum
hole diameter, so that this would also help preventing a
weakened air tube (Wells & Amos, 1994). A final design of the
perforated air tube with the aperture ratio of 1.9 is shown in
Fig. 2. The perforations were extended with the length of
0.017m in order to correct the air jets angles so that they were
almost perpendicular to the floor. The air tube had seventeen
sets of evenly spaced perforations numbered from one to
seventeen (one being the closest to the inlet). Each of these
sets was 0.076 m from the next and consisted of three holes
which were placed at 30� from each other. The sets from one
to eleven had hole diameter of 0.01m and the diameter for the
remaining sets of holes was 0.009 m. The distance from the
first hole to the tube head and the last hole to the end of the
tube was 0.05 m.
Five cases were studied and compared in this study (Fig. 3):
Case 0 e control treatment (no air supply, flow is driven by
natural convection); Case 1 e one air tube; Case 2 e two air
tubes with same air flow direction (distance between two
pipes: 0.59 m); Case 3 e two air tubes with reversed airflow
direction (distance between two pipes: 0.59 m), and Case 4 e

Fig. 2 e Proposed overhead perforated air tube design.
b i o s y s t em s e n g i n e e r i n g 1 4 7 ( 2 0 1 6 ) 1 9 3e2 0 5198
four air tubes with same air flow direction. The samemethods
were used to generate the computational mesh for each case.
4.2. Numerical model and boundary conditions
The computational grids for each case had around 3.5 million
of cells with three-dimensional elements of combined tetra-
hedron, pyramid, and hexahedron meshing. Finer meshes
were imposed near the fluorescent lamps and perforated air
tubes, where the thermal or pressure gradients were steeper.
Table 3 shows the boundary conditions and the numerical
parameters used for three-dimensional CFD simulation. It
was assumed that the initial operating air temperature in the
production domain was 297 K in an indoor plant factory. The
temperature of cool air injected into the air tubes was set to
288 K. The gravitational effect was included and the Boussi-
nesq approximation for airflow was applied. The energy
source from T8 fluorescent lamps was calculated according to
Eq. (4) with the assumption that 50% of the total power input
was lost as convective heat from the lamp surfaces (Gilani
et al., 2013; Thimijan & Heins, 1983). The other 50% was
assigned to the wall surfaces at the shelf. It was assumed that
the wall surface temperature had the same temperature as
the initial temperature of surrounding air, which was 294 K.
The thermal properties of glass, aluminium, and a poly-
ethylene air tube were assigned to the walls according to the
material properties (Table 2). The top wall of the shelf was
assumed to be smooth. The roughness effects for turbulent
flow were assigned with roughness height (Ks) and a rough-
ness constant (Cs) for the wall representing the lettuce canopy
surface at the bottom of the problem domain. The roughness
constant Cs ¼ 0.5 represents a uniform roughness at the wall
surface. The roughness height (m) for lettuce was calculated
according to Eq. (6) (Alves, Perrier, & Pereira, 1998):
Ks ¼ 0:126hc (6)
where hc is the height of crop canopy (m) and the value
hc ¼ 0.15 was used.
Combinations of hexahedron and tetrahedron mesh were
used in the simulations. Finer meshes were imposed near the
fluorescent lamps and perforated air tubes. Furthermore, for
all cases mesh quality was confirmed by evaluating the
skewness, aspect ratio, and orthogonal quality to improve
accuracy and stability of numerical computations. The values
of mesh quality for skewness, aspect ratio, and orthogonal
quality were 0.2 ± 0.1, 1.9 ± 0.5, and 0.9 ± 0.1, respectively.
4.3. Solver settings
The SIMPLE algorithm was used for pressureevelocity
coupling (Patankar, 1980). For spatial discretization, a least
square cell based scheme was employed for gradient term.
Second order discretisation schemes were used for pressure,
momentum and energy term for more accurate results
compared to first order discretization schemes. First order
upwind discretisation schemes were used for viscous terms of
the governing equations for a better convergence of calcula-
tions because of the problemof transient characteristics of the
airflow. The convergence criterion was 10�6 on the energy,
momentum, and continuity term and 10�3 on the viscous term
(Mondaca & Choi, 2014) to monitor the residuals and to
confirm whether a solution is converged or not.
5. Results and discussions
5.1. Numerical simulation: model validation
The simulated air temperature, surface temperature and air
velocity at twelve points were compared to those corre-
sponding points from the experimental measurements in the
single shelf interior domain. Model prediction accuracy was
evaluated by comparing the percentage errors for each indi-
vidual points between the measured and simulated data
(Table 4). The results indicated that the prediction accuracy of
3D CFDmodel for air temperature and air velocities were with
the average percentage errors of 8.9% and 7.5%, respectively,
when compared to measured values. Airflow patterns within
the system were also traced using a smoke generator (Smoke
pencil, Chimney Balloon, Mauldin, Hampshire, UK) and the air
flow was recorded using a digital camera. Similar air flow
patterns were observed between the flow patterns generated
by the smog generator and those obtained from the CFD
simulation (data not shown).
5.2. Numerical simulation: design of air circulationsystem
5.2.1. Combining data for average velocityThe air flow uniformity at the lettuce canopy surface was
evaluated with the coefficient of variation (CV). The CV is
defined as the ratio of the standard deviation to themean. The
CV indicates the extent of variability in relation to themean of
the population. Therefore, a low value indicates a lower

Fig. 3 e Cases with 3D computational model for air circulation system design: a) Case 0 with only natural convection no air
tube, b) Case 1 with only single perforated air tube, c) Case 2 with two perforated air tube with the same direction for air
flow, d) Case 3 with two perforated air tube with the flow in opposite direction, e) Case 4 with four perforated air tubes with
the same flow direction.
b i o s y s t em s e ng i n e e r i n g 1 4 7 ( 2 0 1 6 ) 1 9 3e2 0 5 199
variability in the data set. The air velocity at canopy surface
lower than 0.3 m s�1 or higher than 1 m s�1 should be avoided
in the shelf for lettuce crop in a multi-tier production system.
Therefore, this criterion was used to assess the goodness of
the designs by evaluating the percentages of cells in total at
canopy surface with air velocities falling into this range. Thus,
the average air velocities at the crop canopy surface plane in
the simulation domain were calculated using 20,000 cells
located at crop canopy surface in each case. The values of the
maximum air velocity, the minimum air velocity, the average
air velocity, the percentage of cells with air velocity lower than
0.3 m s�1, the percentage of cells with air velocity between 0.3
and 1 m s�1, the percentage of cells with air velocity higher
than 1 m s�1, and the coefficient of variation for four cases
with perforated air tubes are present in the Table 5.
Although the smaller size of air jet outlet at the closed end
of the air tube improved the general airflow uniformity along
the perforated air tube, a slight difference in air velocity closed

Table 3 e Boundary conditions summary for CFD simulation for air circulation system design cases.
Fluid: Aira
Operating air temperature in the production domain: 297 K
Gravitational acceleration: 9.81 m s�2
Energy source (T8 fluorescent lamps): 25,912 W m�3
Models Property
Energy model Activated
Viscous model Realizable k-epsilon model with standard wall functions and full buoyancy effect
Parameter Boundary conditions Property
Air-tube inlet Velocity-inlet 8 m s�1
Shelf-two-side-wall-1 Pressure-outlet Gauge pressure: 0 Pa
Shelf-two-side-wall-2 Symmetry Default
Lamp-wall Wall Thermal property of glassb
Air-tube-wall Wall Thermal property of plasticb
Shelf-top-wall Wall Thermal property of aluminium
Shelf-bottom-wall Wall roughness height: 0.019 m, roughness constant: 0.5
a From Doxon (2007).b From Brunberg and Aspelin (2011).
Table 4 e Summary of simulated and measured data formodel validation.
Point#
Measured lampsurface
temperature (�C)
Simulated lampsurface
temperature (�C)
Percentageerror (%)
1 35.7 ± 0.3 37.0 3.6
2 52.9 ± 2.2 60.5 14.4
3 48.8 ± 2.2 56.9 16.6
4 27.3 ± 1.9 25.0 8.4
Measured Air
Temperature (�C)Simulated Air
Temperature (�C)Percentage
Error (%)
5 26.1 ± 0.6 24.1 7.7
6 25.8 ± 0.5 23.9 7.4
7 25.0 ± 0.3 24.0 4.0
Measured Air velocity
(m s�1)
Simulated Air velocity
(m s�1)
Percentage
Error (%)
8 0.78 ± 0.08 0.73 6.4
9 0.78 ± 0.09 0.70 10.3
10 0.49 ± 0.17 0.55 12.2
11 0.81 ± 0.06 0.78 3.7
12 0.81 ± 0.09 0.77 4.9
b i o s y s t em s e n g i n e e r i n g 1 4 7 ( 2 0 1 6 ) 1 9 3e2 0 5200
to the two ends of the air tube was still observed due to the
nonlinearly increased static pressure along the air tube (Fig. 4).
Therefore, the results showed that the design of the perfo-
rated air tube has effect on the air flow distribution at crop
canopy surface. The air velocity contour diagrams at crop
canopy surface were generated for each case (Fig. 5).
Without supplying any air into the shelf with flow mainly
under natural convection (Case 0), the air velocities at crop
canopy surface were stagnant and close to zero. A small air
Table 5 e Summary of air velocity at crop canopy surface for e
MAX (m s�1) MIN (m s�1) AVG (m s�1) PCT
Case 1 1.02 0.01 0.41
Case 2 1.27 0.02 0.42
Case 3 1.15 0.03 0.42
Case 4 0.73 0.02 0.28
circulation and slightly higher air velocities compared to the
centre of the shelf (still close to zero air velocities) were
observed towards the edges of the production shelf. This slow
airflow and circulation is mainly induced by air temperature
difference and air density gradient caused by the heat gener-
ated from the fluorescent lamps. In Case 1 with one air tube,
the highest air velocity was observed at the centre of the shelf.
With the three rows of air jets, at crop canopy surface, 68% of
the cells can achieve the air velocity higher than 0.3m s�1. The
average air velocity at crop canopy surface was
0.41 ± 0.21 m s�1 and the coefficient of variation was 51%. The
stagnant areas with air velocity lower than 0.1 m s�1 were
observed along the margins of the shelf, as well as the stag-
nant zone at the inter-jet spacing.
Case 2 and Case 3were designed to improve the air velocity
at the stagnant areas in Case 1. A compensation effect using
the reversed direction of air tubes in Case 3 was expected to
improve the air flow uniformity at the lettuce canopy surface.
With the increased volumetric flow rate, a higher momentum
exchange between air jets and quiescent fluid helped to
decrease the stagnant areas and have a more uniform air flow
distribution. From the results, a smaller stagnant area and a
more uniform airflow distribution were observed with two air
tubes in Case 2 and Case 3 with coefficients of variation of 44%
and 46%, respectively. Based on the values analysed from
20,000 cell points on the crop canopy surface, the percentage
of cells with air velocity lower than 0.3 m s�1 was decreased
from 32% to 26% in Case 2 and 28% in Case 3. The percentage
of cells with air velocity higher than 1 m s�1 was increased up
to 10%. In general, the average air velocity in Case 2 and Case 3
was 0.42 ± 0.19m s�1. The percentages of cells with air velocity
between 0.3 and 1 m s�1 were 64% and 66%, respectively. Due
ach case in the design of air circulation system.
(<0.3 m s�1) PCT (0.3e1 m s�1) PCT (>1 m s�1) CV
32% 67% <1% 51%
26% 64% 10% 44%
28% 66% 6% 46%
59% 41% 0% 45%

Fig. 4 e Air jets distribution and pattern along the perforated air tube.
b i o s y s t em s e ng i n e e r i n g 1 4 7 ( 2 0 1 6 ) 1 9 3e2 0 5 201
to the non-normality of the data, a non-parametric method,
the Wilcoxon signed rank test, was used for testing whether
samples from Case 2 and Case 3 originate from the same
distribution. The results showed that there is no difference (p-
value¼ 0.72) between Case 2 and Case 3 in terms of air velocity
at significant level of a¼ 0.05. The slightly higher coefficient of
variation in Case 3 showed that the reversed direction of air
flow in air tubes cannot help to improve the overall air flow
uniformity at the canopy surface.
With four perforated air tubes as in Case 4, the smaller
distance between two air tubes restricted the development of
air jets and caused a more turbulent air flow at canopy sur-
face. The smallest average air velocity (0.28 m s�1) and
maximum air velocity (0.73 m s�1) at canopy surface were
generated compared to other cases. With the decreased
average air velocity, more than half of the cells (59%) had the
air velocity lower than the target lower limit air velocity of
0.3 m s�1. For air flow uniformity, Case 4 had no significant
improvement compared to Case 2 and Case 3 with the coef-
ficient of variation of 45%.
5.2.2. Air jets interactionFigure 6 showed the cross sectional air velocity contour dia-
grams at central plate crossing the fluorescent lamps, where
two side ends were defined as symmetry walls. For Case 0, a
stagnant air with nearly constant air velocity close to zerowas
observed in the production shelf. For the four cases with
perforated air tubes, the range of air velocity was defined as
0e1.3 m s�1 to visualize the air velocity distribution at canopy
boundary layer. The multi-jet configurations were affected by
two types of interactions: the jet-to-jet interaction between
adjacent jets prior to the air jets onto the canopy surface and
the interaction between the air jets and the flow formed by the
spent air of the neighbouring jets (Weigand & Spring, 2009).
The latter dominated the air flow distribution in the air cir-
culation system. For instance, the stagnant zones in the four
cases weremainly caused by the jet-to-jet interference, which
occurred between the adjacent rows of air jet at one air tube
and between two air tubes. When two developed air jets
conflicted with each other, with the obstacle of the canopy
surface, the airflow moved upward and formed a circulating
air flow pattern and zone between two perforated tube
sections. The stagnant zones between each pair of rows of air
jet were observed at merged points.
6. Conclusions
A 3D CFD model was developed to simulate growing envi-
ronment in a single shelf production system and to design and
propose an improved air circulation system that provide a
desired average air current speed at the crop canopy surface
level as an alternative approach to help preventing lettuce tip
burn and contribute to achieving a more uniform air current
speeds at the canopy. A perforated air tube installed between
supplemental lighting fixtures in the production shelf was
designed and proposed to enhance vertical air flow to crop
canopy surface. The designs of air circulation system with
perforated air tubes were able to improve the air movement at
crop canopy surface compared to the control treatment with
only natural convection driven air flow. The three rows of air
jets on the perforated air tube helped to expand the coverage
of air flow at crop canopy surface from one single tube. The
design as described in Case 2, applying two perforated air
tubes in the shelf, is recommended based on the system
evaluated in the current study, because it resulted in smaller
stagnant zones on the crop canopy surface and achievedmore
uniform air flow distribution, with the CV of 44% in Case 2 and
46% in Case 3 compared to 51% in Case 1. From the economics
point of view with materials, installation and energy demand,
the design in Case 2 would be a better design option. In
addition, the reversed direction of air tubes in Case 3 did not
improve the airflow uniformity. Although Case 4 had the
similar air flow uniformity at the canopy surface, the average
air velocities were much lower than 0.3 m s�1. With two air
tubes, the average velocity of 0.42m s�1 can be achieved at the
crop canopy surface. Compared to an air circulation system
with horizontal fans, themulti-jet perforated air tube can help
to overcome the enclosure effect of outer leaves and push air
down to the crop canopy surface, especially at the centre of
the cultivation bed. Based on the overall comparison, the two
air tube design as described in Case 2 is recommended for the
shelf system evaluated in this study. Since the air flow pattern
and air velocities created on the crop canopy surface depend

Fig. 5 e Air velocity contour diagrams at crop canopy surface.
b i o s y s t em s e n g i n e e r i n g 1 4 7 ( 2 0 1 6 ) 1 9 3e2 0 5202
on the air jet angle, total number of holes, and position of air
jets further combination and detailed analysis is also recom-
mended to refine the conceptual design proposed in this
study.
This study illustrated the ability of CFD as an engineering
design tool to predict airflow in a ventilated indoor environ-
ment and demonstrated the concept of using perforated air
tube for the design of the air circulation system in an indoor
plant factory. Further research is necessary to improve the
design of the perforated air tubes for potential use in multi-
tier crop production systems. Alternative designs can inte-
grate combinations of vertical, diagonal, and horizontal
airflow combinations to improve air flow patterns and uni-
formity and to achieve desired air velocities. Instead of using a
perforated air tube design, the ceiling of the production shelve
can be designed in a way to provide vertical air flows on the

Fig. 6 e Air velocity contour diagrams at central plate in the production shelf.
b i o s y s t em s e ng i n e e r i n g 1 4 7 ( 2 0 1 6 ) 1 9 3e2 0 5 203

b i o s y s t em s e n g i n e e r i n g 1 4 7 ( 2 0 1 6 ) 1 9 3e2 0 5204
crop canopy. A more comprehensive study including sub-
models can be conducted, such as: (1) a porous media model
to simulate the ways that a crop canopy will affect airflow, (2)
a radiation model to incorporate the effect of sole-source
lighting systems heat and light input into the production
system and on the crop canopy, and (3) an evapotranspiration
model to include latent and sensible heat exchanges between
crop canopy and the surrounding air, and (4) discrete phase
model to account for CO2 distribution. Such a comprehensive
model can help to study key design features and variables in
further detail and to recommend design optimisation leading
to improved resource use efficiency in indoor plant factory
based multi-tier food production systems. Our research is
ongoing to develop such complex and integrated CFD models
to study environments and various air conditioning and dis-
tribution system design concepts for potential use in indoor
plant production systems.
r e f e r e n c e s
Aloni, B., Pashkar, T., & Libel, R. (1986). The possible involvementof gibberellins and calcium in tipburn of Chinese cabbage:study of intact plants and detached leaves. Journal of PlantGrowth Regulation, 4(1), 3e11.
Alves, I., Perrier, A., & Pereira, L. S. (1998). Aerodynamic andsurface resistance of complete cover crops: how good is the“big leaf”? Journal of American Society of Agricultural Engineers,41(2), 345e351.
Baeza, E. J., P�erez-Parraa, J. J., Montero, J. I., Bailey, B. J.,L�opeza, J. C., & C�azqueza, J. C. (2009). Analysis of the role ofsidewall vents on buoyancy-driven natural ventilation inparral-type greenhouses with and without insect screensusing computational fluid dynamics. Biosystems Engineering,104(1), 86e96. http://www.sciencedirect.com/science/journal/15375110/104/1.
Barta, D. J., & Tibbitts, T. W. (1991). Calcium localization in lettuceleaves with and without tipburn: comparison of controlled-environment and field-grown plants. Journal of the AmericanSociety for Horticultural Science, 116, 870e875.
Bournet, P. E., Ould Khaoua, S. A., & Boulard, T. (2007). Numericalprediction of the effect of vent arrangements on theventilation and energy transfer in multi-span glasshouseusing a bi-band radiation model. Biosystems Engineering, 98,224e234.
Brunberg, J., & Aspelin, M. (2011). CFD modelling of headlampcondensation. Sweden: Department of Applied Mechanics,Chalmers University of Technology.
Bustamante, E., Garcı́a-Diego, F.-J., Calvet, S., Estell�es, F.,Beltr�an, P., Hospitaler, A., et al. (2013). Exploring ventilationefficiency in poultry buildings: the validation of computationalfluid dynamics (CFD) in a cross-mechanically ventilatedbroiler farm. Energies, 6, 2605e2623.
Chang, Y. C., & Miller, W. B. (2004). The relationship between leafenclosure, transpiration, and upper leaf necrosis on Lilium‘Star Gazer’. Journal of the American Society for HorticulturalScience, 129, 128e133.
Clarkson, D. T. (1984). Calcium transport between tissues and itsdistribution in the plant. Plant Cell & Environment, 7, 449e456.
Downs, R. J., & Krizek, D. T. (1997). Air movement. InR. W. Langhans, & T. W. Tibbitts (Eds.), Plant growth chamberhandbook (pp. 87e104). No. 340, Iowa Agr. & Home Econ. Expt.Sta. Spec. Rpt. No. 99, Ames, IA: North Central Regional Res.Publ.
Doxon, J. C. (2007). The shock absorber handbook (2nd ed., p. 375).Hoboken, NJ: John Wiley & Sons, Ltd.
Fatnassi, H., Poncet, J., Bazzano, M. M., Brun, R., & Bertin, N.(2015). A numerical simulation of the photovoltaic greenhousemicroclimate. Solar Energy, 120, 575e584.
Fidaros, D. K., Baxevanou, C. A., Bartzanas, T., & Kittas, C. (2010).Numerical simulation of thermal behavior of a ventilated arcgreenhouse during a solar day. Renewable Energy, 35, 1380e1386.
Fitter, A. H., & Hay, R. K. M. (1981). Environmental physiology ofplants (3rd ed.). San Diego, CA: Acadamic Press, A Division ofHarcourt Inc.
Fluent User's Guide. (2012). Version 13.1. Canonsburg, PA: ANSYS,Inc.
Gilani, S., Montazeri, H., & Blocken, B. (2013). CFD simulation oftemperature stratification for a building space, Validation andsensitivity analysis. In 13th conference of international buildingperformance simulation association, Chambery, France.
Goto, E., & Takakura, T. (1992). Prevention of lettuce tipburn bysupplying air to inner leaves. Transactions of the ASABE, 35,641e645.
Han, J.-H., Kwon, H.-J., Yoon, J.-Y., Kim, K., Nam, S.-W., & Son, J. E.(2009). Analysis of the thermal environment in a mushroomhouse using sensible heat balance and 3-D computationalfluid dynamics. Biosystems Engineering, 104(3), 417e424.
Jiru, T. E., & Bitsuamlak, G. T. (2010). Advances in applications ofCFD to natural ventilation. In The fifth international symposiumon computational wind engineering (CWE2010). North Carolina,USA: Chapel Hill.
Jones, J. B. (2005). Hydroponics e A practical guide for the soillessgrower (2nd ed.). Boca Raton, FL: CRC Press, LCC.
Kacira, M., Sase, S., & Okushima, L. (2004). Optimization of ventconfiguration by evaluating greenhouse and plant canopyventilation rates under wind-induced ventilation. Transactionsof the ASABE, 47(6), 2059e2067.
Kim, K., Yoon, J., Kwon, H., Han, J., Son, J. E., Nam, S., et al. (2008).3-D CFD analysis of relative humidity distribution ingreenhouse with a fog cooling system and refrigerativedehumidifiers. Biosystems Engineering, 100, 245e255.
Kitaya, Y. (2005). Importance of air movement for promoting gasand heat exchanges between plants and atmosphere undercontrolled environments. In K. Omasa, I. Nouchi, & L. J. De Kok(Eds.), Plant response to air pollution and global change (pp.185e193). Tokyo, Japan: Springer-Verlag.
Kitaya, Y., Tsuruyama, J., Kawai, M., Shibuya, T., & Kiyota, M.(2000). Effects of air current on transpiration and netphotosynthetic rates of plants in a closed plant productionsystem. In C. Kubota, & C. Chun (Eds.), Transplant production inthe 21st century (pp. 83e90). Springer Netherlands Publishers.
Kitaya, Y., Tsuruyama, J., Shibuya, T., Yoshida, M., & Kiyota, M.(2003). Effects of air current speed on gas exchange in plantleaves and plant canopies. Advances in Space Research, 31(1),177e182.
Korthals, R. L., Knight, S. L., Christianson, L. L., & Spomer, L. A.(1994). Chambers for studying the effects of airflow velocity onplant growth. Biotronic, 23, 113e119.
Kozai, T. (2013). Plant factory in Japan e current situation andperspectives. Chronica Horticulturae, 53(2), 8e11.
Kozai, T., Chun, C., & Ohyama, K. (2004). Closed systems withlamps for commercial production of transplants usingminimal resources. Acta Horticulturae, 630, 239e254.
Lau, J., & Liu, J. L. (2003). Measurement and CFD simulation of thetemperature stratification in an atrium using a floor level airsupply method. Indoor and Built Environment, 12, 265e280.
Lee, J. G., Choi, C. S., Jang, Y. A., Jang, S. W., Lee, S. G., & Um, Y. C.(2013). Effects of air temperature and air flow rate control onthe tipburn occurrences of leaf lettuce in a closed-type plantfactory system. Horticulture Environment and Biotechnology,54(4), 303e310.

b i o s y s t em s e ng i n e e r i n g 1 4 7 ( 2 0 1 6 ) 1 9 3e2 0 5 205
Lee, I. B., & Short, T. H. (2000). Two-dimensional numericalsimulation of natural ventilation in a multi-span greenhouse.Transactions of ASAE, 43(3), 745e753.
Lim, T.-G., & Kim, Y. H. (2014). Analysis of airflow pattern in plantfactory with different inlet and outlet locations usingcomputational fluid dynamics. Biosystems Engineering, 39(4),310e317.
Majdoubi, H., Boulard, T., Fatnassi, H., & Bouirden, L. (2009).Airflow and microclimate patterns in a one-hectare Canarytype greenhouse: an experimental and CFD assisted study.Agricultural and Forest Meteorology, 149, 1050e1062.
Mirade, P. S., & Daudin, J. D. (2006). Computational fluid dynamicsprediction and validation of gas circulation in a cheeseripening room. International Dairy Journal, 16, 920e930.
Mistriotis, A., Bot, G. P. A., Picuno, P., & Scarascia-Mugnozza, G.(1997). Analysis of the efficiency of greenhouse ventilationusing computational fluid dynamics. Agricultural and ForestMeteorology, 85, 217e228.
Mondaca, M., & Choi, C. Y. (2014). Experimental validation ofcomputational dynamics (CFD) model of perforatedpolyethylene tube ventilation systems in dairy operations. InASABE and CSBE/SCGAB annual international meetingpresentation, paper no: 141912797.
Norton, T., & Sun, D. W. (2006). Computational fluid dynamics(CFD) e an effective and efficient design and analysis tool forthe food industry: a review. Trends in Food Science & Technology,17, 600e620.
Patankar, S. V. (1980). Numerical heat transfer and fluid flow.Washington, WA: Hemisphere Publishing Corporation.
Posner, J. D., Buchanan, D., & Dunn-Rankin, D. (2003).Measurement and prediction of indoor air flow in a modelroom. Energy and Buildings, 35, 515e526.
Rohdin, P., & Moshfegh, B. (2007). Numerical predictions of indoorclimate in large industrial premises. A comparison betweendifferent kee models supported by field measurement.Building and Environment, 42, 3872e3882.
Shear, C. B. (1975). Calcium-related disorders of fruits andvegetables. Hort Science, 10, 361e365.
Shibata, T., Iwao, K., & Takano, T. (1995). Effect of vertical airflowing on lettuce growing in a plant factory. ActaHorticulturae, 399, 175e183.
Shibuya, T., & Kozai, T. (1998). Effects of air velocity on netphotosynthetic and evapo-transpiration rates of a tomato plugsheet under artificial light. Environment Control in Biology, 36,131e136.
Shih, T.-H., Liou, W. W., Shabbir, A., Yang, Z., & Zhu, J. (1994). Anew k-ε eddy viscosity model for high Reynolds numberturbulent flows-model development and validation. Computers& Fluids, 24(3), 227e238.
Tamimi, E., Kacira, M., Choi, C. Y., & An, L. (2013). Analysis ofmicroclimate uniformity in a naturally vented greenhousewith a high-pressure fogging system. Transactions of the ASABE,56(3), 1241e1254.
Thimijan, R. W., & Heins, R. D. (1983). Photometric, radiometric,and quantum light units of measure, a review of proceduresfor interconversion. Journal of the American Society forHorticultural Science, 18(6), 818e822.
Weigand, B., & Spring, S. (2009). Multiple jet impingement e areview. Heat Transfer Research, 42(2).
Wells, C., & Amos, N. (1994). Design of air distribution systems forclosed greenhouses. Acta Horticulturae, 361, 93e102.
Yabuki, K. (1990). Wind and photosynthesis. Correspondence ofenvironment of leaf boundary layer and plants (p. 45). Tokyo,Japan: Nobunkyo Association.