Embed Size (px)
Citation preview
1
A choice experiment to analyse preferences for different profiles of
chicken and honey
Cristina Mora - University of ParmaSplit, 3rd February 2010

2
Overview
• In response to consumers’ increasing concerns aboutfood safety, both supply chain actors and publicauthorities have developed, in the lastdecade, labelling schemes to provide markets withmore information.
• Although some level of traceability is necessary toprovide consumers with valuable information (such ascountry-of-origin, production process, etc.), it is notclear so far if traceability per se is important toconsumers (TRACE EU Project).

3
• The objective of this paper is to analyse consumers’ perception of food traceability with respect to two food products: chicken and honey.
• CE methodology allows to weight the relative importance of any given attribute for consumers, providing an estimation of their marginal willingness to pay (WTP).
• More specifically, it aims to provide more insights for both policy makers and supply chain actors into Italian consumer’s perception and preferences for different attributes connected to traceability.
• Methodology: Choice Based Conjoint Experiment (CBC)

4
Introduction to CBC Choice Based Conjoint Experiment
• Conjoint is not new but methods start to evolve rapidly in the late 1950s and early 1960s.
• CBC, or Choice-Based Conjoint, has become the preferred method, due to it’s ability to truly gauge price elasticity, and it’s easy to comprehend trade-off task.
• Full product combinations (FULL PROFILE) are pitted against each other in “choice sets” (reduced with fractional factorial designs). Respondents choose among the products depicted, or (as an option) can choose none of the products.

5
• A respondent typically receives anywhere from 10 to 20 choice sets, depending on the number of factors and levels in the design.
• It’s modeling capabilities (interactions, special effects, etc.) are seen as an improvement from prior methods.
• Due to relative pricing, elasticity models are more accurate.
• Like Adaptive CA, allows for more factors and levels than traditional method.
• Group utilities may be calculated

6
Stage 1 —Designing the conjoint study:Step 1.1: Select attributes relevant to the product,Step 1.2: Select levels for each attribute, andStep 1.3: Develop the product bundles to be evaluated.
Stage 2 —Obtaining data from a sample of respondents:Step 2.1: Design a data-collection procedure, andStep 2.2: Select a computation method for obtaining part-worth
functions.
Stage 3 —Empirical results
Conjoint Study Process

7
Stage 1How do I know what attributes
and levels to use?

8
Step 1.1. Select attributes (preliminary qualitative phase)
• Literature Review• Focus group and • Means and Chains analysis • Secondary data
The researcher can choosethe attributes that are believed to have the largestimpact on the respondents.
Focus Group (10 pers.) to assess the attributes and the levels to be tested and to elicit new attributes of interest
Market research (on shop)
Quality• Information
(production process, raw material origin, etc.)
Food safety• Recall,
withdrawl of the product

9
Step 1.2. Select levels of attributes
• Choose attribute levels similar to the existing products• As few levels as possible to simplify respondents task• Roughly the same number of level for each attribute• Attributes that are demand-relevant, policy-relevant and measurable
should be used.
Each attribute is given a number of levels, for example high, medium and low.

10
Attributes Levels
Price
a) – 35%b) – 20%c) – 10%d) Average pricee) + 20%
Country of Origina) Nessunob) Product of Italyc) Imported product
Region of Origin a) No b) Sì
Branda) No brandb) retailerc) Big national scale firmd) Local scale firm
Production Process Info a) Nob) Yes
Seal “Traceable product” a) Nob) Yes
Way of comunication of infoa) Noneb) IT based (ID code ID, web site)c) Written
Certification by whoma) Noneb) Supply chainc) Third party d) Public body

11
Step 1.3. Use orthogonal design to develop product bundles
• Presentation and mesaurements scale: in the full profile approach, all 8 attributes are presented to each respondent for evaluation
• To reduce the numbers of profiles for evaluation, fractional factorial orthogonal design was developed by means of SPSS (58 product profiles –subdivided in 32 choice set for chicken and honey- from the full design with 5760 profile)

12
Stage 2
Obtaining Data from respondents
13
Step 2.1 Design a data-collection procedure
o The research use full-profile approach in which all attributes are presented to each respondent for evaluation in a personal interview.
o Visual stimuli: in the study we choose to present the product by providing a picture along with product labels containing the different attributes and levels

14
• Measurement scale– In this choice experiment the respondent is asked to
pick one of presented alternatives.
• 10 choice-sets for each respondent of 3 + 1 (no-choice) options = 8’000 choices
• Time : 15 minutes for each experiment
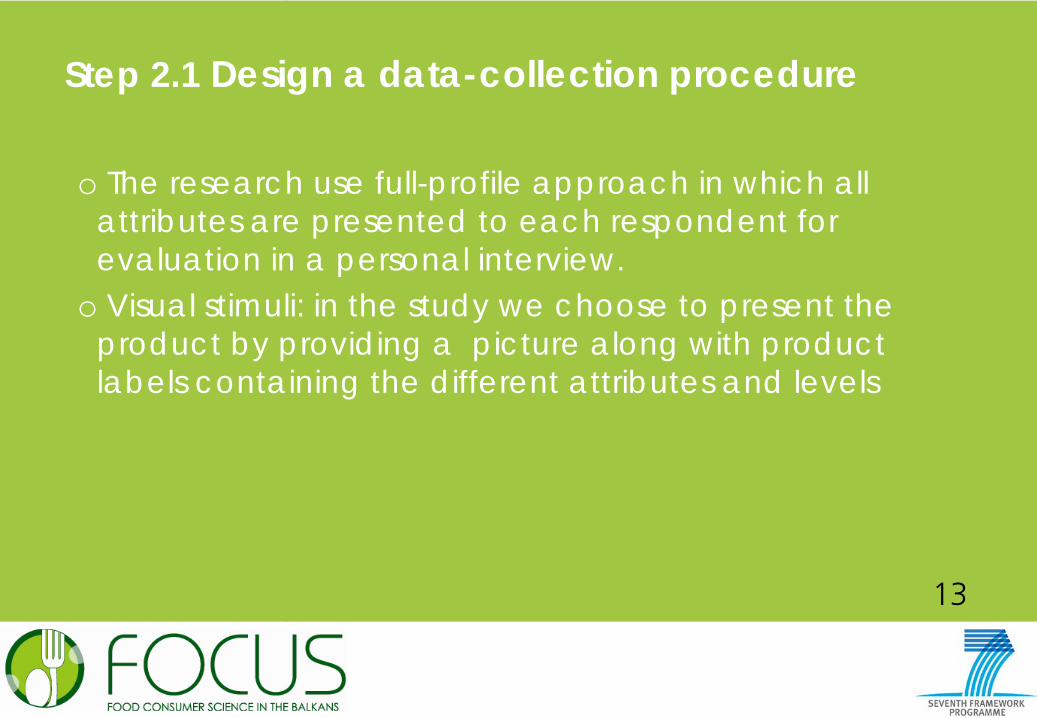
Example of choice set; each respondent received 8 card and approach the stimuli as if they were intending to buy the product being presented.
15
Example of choice set; each respondent received 8 card and approach the stimuli as if they were intending to buy the product being presented.
No chce

16
• Eligible persons: 160 respondents, >18 years in charge of shopping in his/her household or shares it with others in his/her household.
• Recruitment should take primarily place on the basis of gender (male/female) and age groups (younger /older).
• Stratification criteria include geographical area, city size and age groups representative of the general population and geographical spread of Italy .

17
Sample descriptionChicken Honey Total Frequency of purchases Chicken Honey
GenderMale 25,0 23,8 24,4 Every day or almost every day 3,8 0,0Female 75,0 76,3 75,6 Several times a week, but not every day 16,3 0,0Age distribution Once a week 27,5 0,018-24 37,5 17,5 27,5 Several times a month 36,3 2,525-40 15,0 17,5 16,3 Once a month 15,0 13,841-50 26,3 26,3 26,3 Every two months; 1,3 12,551-60 7,5 18,8 13,1 Every three/four
months 0,0 16,360 13,8 20,0 16,9 Twice per year 0,0 25,0
Education Distribution Once per year 0,0 30,0Primary 6,3 12,5 9,4Secondary 31,3 40,0 35,6Post – Secondary 31,3 18,8 25,0Tertiary or higher 31,3 28,8 30,0Members living in thehousehold 2,7 2,4 2,6

18
Step 2.2: Select a computation method for obtaining part-worth functions
• For each attribute the part-worth’s of the respondent is estimated, this means that the researcher estimates a value that explains how important the respondent find each attribute and these values are called part-worth’s or utilities.
• Results can be analysed as additive functions of the attributes.

19
• In choice-based experiment the estimation method is probabilistics, such as LOGIT and PROBIT: the dependent variable is categorical.
• Several discrete choice models have been developed from different statistical assumptions.
– In the study we use Multinomial Logit Model and a latent class (LC) model were applied to estimate the parameters associated to each product’s attribute.
– The LC model, in particular, fitted better the data providing more detailed results able to capture heterogeneity of preferences across the considered products.
– to estimate this model we use the Maximum Likelihood Approach.
– The statistical analysis has been conducted thanks to NLOGIT v.4.0, developed by Prof. William Greene.

20
EMPIRICAL RESULTS
Stage 3
21
Results
• The LC model , in particular, fitted better the data providing more detailed results able to capture heterogeneity of preferences across the considered products.
• Beta coefficients refers to parameters that weight exogenous variables in determining the consumers’ utility.
• A negative Beta coefficient means that increments on that attribute decrease the associated utility level provided by the choice (dislike), whereas a positive value means that the presence of the considered attribute increase the utility (like), zero means “neutral” effect on respondents.

22
Chicken Honey
Price -1,076 (0,280) *** -0,482 (0,077) ***
Product of Italy 2,773 (0,776) *** 2,056 (0,204) ***Region 0,993 (0,526) * 0,480 (0,113) ***Brand Retailer 4,228 (1,539) ** -1,007 (0,266) ***Major firm Brand 2,503 (0,983) ** -0,246 (0,271) n.s.Local firm Brand 6,089 (2,081) ** -2,147 (0,356) ***Production Process Info 3,051 (0,942) *** 0,485 (0,207) *Seal “Traceable” 2,541 (0,697) *** -0,184 (0,135) n.s.IT Information 0,082 (1,080) n.s. 0,815 (0,237) ***Written Information -1,733 (1,311) n.s. 0,754 (0,230) ***Chain certification 5,467 (1,767) ** -0,036 (0,289) n.s.Third part certification 1,732 (1,203) n.s. 0,072 (0,258) n.s.Public institution certification 4,072 (1,748) * 0,935 (0,257) ***

23
CHOICE EXPERIMENT RESULTS FOR TRACEABLE CHICKEN
24
• The price is statistically significant. This shows that when the price increases, the utility of the chicken, even with traceable aspects, decreases.
• The known region of origin of the chicken is st. important. However, the low coefficients show that is not one of the most important aspects of a chicken.
• The production/process information is statistically important.
• The seal “Traceable” appears to be important, with low coefficients though, compared to other attributes of the chicken.

25
• From the three different brands which were used in the experiment, the local firm brand appears to be in a leading position, since it is significant in improving the utility. This aspect is one of the most important for the final choice of the consumers; olaso retailer brand is in an important position.
• “Information technology based” information isn’t statistically significative.
• Italian products are mostly preferred. Their coefficients are high but not so important than expected.
• Certification by producers/supply chain and the European Union increases the utility of the product statistically significantly.

26
CHOICE EXPERIMENT RESULTS FOR TRACEABLE HONEY

27
• The price is statistically significant. This was also the case in the experiment with the chicken. This shows that when the price increases, the utility of the honey, even with traceable aspects, decreases.
• Italian products are mostly preferred. The coefficient is very high, compared to other attributes’ coefficients, making this aspect one of the most important for the final choice of the consumers.
• The known region of origin of the honey is important. The coefficients are low, showing that is not one of the most important aspects of a honey, there are a bit higher than in the results for the chicken though.
• The production/process information is not very important.• The seal appears isn’t s.s.

28
• From the three different brands which were used in the experiment, all the brand represent a dislike.
• “Information technology based” information is equally preferred to written information in general.
• Only the certification by Public Institution increases the utility of the product statistically significantly.

29
Identifying the willingness to pay
• Once the parameters have been estimated, the marginal rates of substitution can be calculated giving an estimation of the rate at which respondents are willing to trade-off one attribute for another.
• Where the attribute being traded is the monetary attribute, this rate estimates the implicit price, or marginal willingness to pay (WTP), of the attribute (with respect to the status quo).

30-6.000
-4.000
-2.000
0.000
2.000
4.000
6.000
8.000
Willingness to pay
Chicken
Honey

31
Design market simulations
• The “ideal” product
8,8 /Kg 2,8 /Kg

32
Validation
• Do the signs of the utilities follow expectations ?• If monetary values are measured in the conjoint
analysis, a comparison with some sort of external monetary value of the same object is a logic validation.
• In the absence of monetary values the internal consistency and validity may be tested from an assumption about which alternative is best. If a respondent chooses a certain alternative in a specific choice set, and if an even better alternative is presented in one of the following choice sets, then this better alternative should be chosen.

33
ConclusionsOne of the findings in this study is that traceability
perception is a product specific issue: italian consumers have more preferences for traceability attributes in the case of chicken than for honey.
This is probably due to a different level of perceived risk and to the higher market penetration of chicken.
Therefore, on the one hand, we suggest supply chain operators to develop traceability-based valorisation strategies per product.
On the other hand, the introduction of vertical public regulations on food traceability, i.e. defined per product category, should be preferred by public authority.

34
Insights for researcher ……
• To be able to evaluate the preference structure of the respondents individually, as well as members of different groups-consumers, and to validate the study, the survey must include a supplementary questions:
– Socio-economic information– Attitude towards food consumption, food habits, product
use or knowledge– Actual conjoint topic
• Group estimation needs a wider sample: at least ….

35
Weaknesses of conjoint analysis
• There is no guarantee that the attributes and levels mirror the true preferences of the respondents, it may be
• The results tend not to be completely repeatable.• Internal problem of the method: pre-test seem to
be invaluable … poor design .. Selection of partecipants … self-selection bias ….
36
References• Alriksson S., Oberg T. (2008): Conjoint Analysis for environmental evaluation. A review of methods and applications,
Environmental Science Pollution Research, 15 (3), 244-257.• McCullough D. (2002): A user’s guide to conjoint analysis. Market Research, 14, 18-23• Giraud G., Halawany R. (2006). “Consumers’ perception of food traceability in Europe”, International Food &
Agribusiness Management Association World Food & Agribusiness Symposium, Buenos Aires (Argentina), 10-11 Giugno 2006.
• Greene W.G. (1997). Econometric Analysis, McMillan, New York.• Greene, W.H. (2002). NLOGIT Version 4.0, Reference Guide. Econometric Software, Inc• Hanley N., MacMillan D., Wright R.E., Bullock C., Simpson I., Parsisson D., Crabtree B. (1998). “Contingent valuation
versus choice experiments: estimating the benefits of environmentally sensitive areas in Scotland”, Journal of Agricultural Economics, Vol. 49 n. 1, 1-15.
• Lancaster K. (1966). “A new approach to consumer theory”, Journal of Political Economy 74, 132–157.• Louriero M.L., Umberger W.J. (2007). “A choice experiment model for beef: what US consumer responses tell us
about relative preferences for food safety, country-of-origin labeling and traceability”, Food Policy 32, 496-514.• Greene, W.H. (2002). NLOGIT Version 4.0, Reference Guide. Econometric Software, Inc. • Loureiro, M.L., Umberger, W.J (2003). “Estimating Consumer Willingness to Pay for Country-of-Origin Labeling”,
Journal of Agricultural and Resource Economics 28 (2), pp. 287-301.• Lusk J.L., Roosen J., Fox J.A. (2003). “Demand for beef from cattle administered growth hormones or fed
genetically modified corn: a comparison of consumers in France, Germany, the United Kingdom, and the United States”, American Journal of Agricultural Economics 85(1), 16–29.
• Lusk J.L., Schroeder T.C. (2004). “Are choice experiments incentive compatible? A test with quality differentiated beef steaks”, American Journal of Agricultural Economics 86(2), 467-482.
• McFadden D. (1974). “Conditional logit analysis of qualitative choice behaviour”, in P. Zarembka (ed.): Frontiers in Econometrics, Academic Press, New York.
• Van Rijswijk W., Frewer L., Menozzi D., Faioli G. (2008). “Consumer perceptions of traceability: a cross-national comparison of the associated benefits”, Food Quality and Preference 19, 452–464.