Embed Size (px)
Citation preview
A Citizen’s Guide to Washington State
K-12 Finance
2014
Table of Contents
Subject ...................................................................................... Page
Introduction ...................................................................................... 1
How do recent basic-education bills affect K-12 funding? .............. 2
How many students attend K-12 schools in the state? ...................... 3
How are public schools in Washington organized? .......................... 3
What does the Washington State Constitution say about
K-12 public school funding? ............................................................ 3
How has this been interpreted by the state courts? ........................... 4
How has the Legislature implemented the court rulings? ................. 5
What is the levy lid act and why was it passed? ............................. 14
How much of the state general fund is spent on K-12
public schools? ............................................................................... 15
How has the amount of the general fund support of K-12
public schools changed since 2001? ............................................... 16
What are other sources of funding used by school districts? .......... 18
How are these funds spent by school districts? .............................. 20
How much is spent per student? ..................................................... 22
How has total per-student spending changed since 1994? .............. 23
How has state per-student funding changed since 1994? ............... 24
How is the salary level of teachers determined? ............................. 24
What is the average salary level of teachers? ................................. 26
How is the salary level of administrators and classified
staff determined? ............................................................................ 26
How does Washington compare to other states? ............................ 27
How does the state lottery support public schools? ........................ 31
What is the role of the federal government in public
elementary and secondary education? ............................................ 33
What are other types of dedicated funding utilized by
school districts? .............................................................................. 35
How is school construction funded in the state? ............................. 35
What is Initiative 732? .................................................................... 36
What was Initiative 728? ................................................................ 36
Appendix A: Maximum Levy Authority ........................................ 38
Appendix B: K-12 Allocation Schedule for Certificated
Instructional Staff ........................................................................... 39
Appendix C: Certificated Instructional Staff Base Salaries ............ 40
1
Introduction A 2014 Citizen’s Guide to K-12 Finance is offered to provide a clear
and simple overview of K-12 financial issues. It provides general
information on K-12 finance by answering frequently asked questions. For
more in-depth information of K-12 finance, see Organization and Financing of Washington Public Schools published by the Office of Superintendent of
Public Instruction. It is available at the following:
http://www.k12.wa.us/safs/PUB/ORG/Org.asp. The information presented
in this document is based on statewide data. For information on a specific
school district, inquire with that school district. Detailed K-12 fiscal data, on
both statewide and district-specific levels, are also reported on the
Washington State fiscal transparency website at:
http://fiscal.wa.gov/k12.aspx.
A 2014 Citizen’s Guide to K-12 Finance was prepared by staff of the
Senate Ways and Means Committee and the Senate Early Learning & K-12
Committee (within Senate Committee Services) with the assistance of staff
of the Legislative Evaluation and Accountability Program (LEAP)
Committee.
Questions regarding the guide or requests for additional copies should
be addressed to:
Senate Ways and Means Committee 311 John A. Cherberg
Olympia, Washington 98504-0482
Telephone: 360-786-7715
Fax: 360-786-7615
http://www.leg.wa.gov/Senate/Committees/WM/Pages/default.aspx
2
How do recent basic-education bills affect K-12 funding? In the 2009-11 biennium, two major pieces of legislation were enacted
to redefine the program of basic education and restructure K-12 funding
formulas. The first was ESHB 2261 (Chapter 548, Laws of 2009) which
added programs to the definition of basic education — including the
program for highly capable students and phasing in all-day kindergarten. It
increased the number of instructional hours, increased the minimum number
of credits for high school graduation, and changed the system for funding
student transportation. The bill also created the framework for a new K-12
funding allocation formula based on prototypical schools. Changes took
effect September 1, 2011 and most enhancements are to be phased in by
2018 on a schedule set by the Legislature.
The second bill, SHB 2776 (Chapter 236, Laws of 2010), enacted in
statute the funding formulas for the new prototypical schools format at levels
that represented what the state was spending on basic education at the time.
It set targets for class-size reduction in the lower grades and established a
timeline for phasing in certain enhancements to the program of basic
education and the new funding levels.
The new funding model is intended to provide greater understanding
about how state funds for K-12 are allocated to school districts, and to
improve accountability. The bills require school-district reporting of actual
staffing and expenditures, compared to the funding provided in the
prototypical model. The comparisons are to be available on a public website
of the Office of the Superintendent of Public Instruction.
The 2014 Citizen's Guide to K-12 Finance uses the descriptions of the
system that took effect September 1, 2011, along with the schedule of when
each future funding enhancement is to take place.
3
How many students attend K-12 schools in the state? In the 2012-13 school year, over 1,004,458 students were enrolled at
2,281 public schools across the state. In addition, it is estimated that about
72,577 students attended private schools and 16,582 students were
homeschooled during the 2012-13 school year.
How are public schools in Washington organized? Washington is largely considered a “local control” state. This means that
local school districts are generally responsible for delivering the actual
instructional programs for the state’s elementary and secondary school-age
population. Each district is governed by a locally-elected school board
whose members serve staggered four-year terms. Each school board hires a
Superintendent who oversees the day-to-day operation of the school district.
Currently, there are a total of 295 school districts.
The public school system in the state of Washington involves various
entities at both the state and local levels, including the Legislature, the
Governor, the State Board of Education, the Office of the Superintendent of
Public Instruction, the federal Department of Education, the State Auditor’s
Office, the Professional Educator Standards Board, Educational Service
Districts, and local school districts. Each of these entities plays a role in
establishing educational policies, implementing these policies, or providing
administrative and financial oversight of the public school system.
What does the Washington State Constitution say about K-12 public school funding?
“It is the paramount duty of the state to make ample
provision for the education of all children residing within its borders, without distinction or preference on account
of race, color, caste or sex.”
—Washington Constitution, article IX, section I
This constitutional provision is unique to Washington. While other
states have constitutional provisions related to education, no other state
makes K-12 education the “paramount duty” of the state.
4
How has this been interpreted in the state courts? Beginning with the 1978 decision in the Seattle School District No. 1 v.
State, 90 Wn.2d 476, 585 P.2d 71, and most recently in 2012 in McCleary v State, 173 Wn.2d 477, 269 P.3rd 227, the Washington Supreme Court has
interpreted Article IX, section 1 of the state constitution to mean that the
state must define a “program of basic education,” within the guidelines of
the Court, distinguished from all other educational programs or services, and
sufficiently and amply fund it from a regular and dependable source that
cannot be dependent on local tax levies.
The Court has found that this paramount duty is superior in rank and
above all others. Neither fiscal crisis nor financial burden changes the
Legislature’s constitutional duty. The state has no duty to fund programs
outside the definition of “basic education.” School districts may use local
levies to fund enrichment programs and programs outside the legislative
definition of basic education. However, the use of local levies cannot reduce
the state’s obligation to fund basic education.
The Court did not require the state to provide a total education or the
offerings of all knowledge, programs, subjects or services; however, the
Court did find that the duty goes beyond mere reading, writing, and
arithmetic. The Court noted that a basic education also “embraces broad
educational opportunities needed in the contemporary setting to equip
children for their role as citizens and as potential competitors in today’s
market as well as in the marketplace of ideas.” Additionally, the Court
found that the education required by the constitution does not reflect a right
to a guaranteed educational outcome.
The Court acknowledged that the Legislature has an obligation to
review the definition of a basic education program as the needs of students
and the demands of society evolve. But any reduction from the basic
education program must be accompanied by an educational policy rational
and not for reasons unrelated to educational policy.
When the state courts originally addressed these issues, there was no
state definition of “basic education,” so the courts considered three
definitions, and the cost of each, to determine whether the state provided
sufficient funds to implement a basic education program. The courts noted
that, in terms of “quantitative inputs,” staffing ratios (the ratio of staff to
students) and staff salaries are the most significant factors in determining the
cost of education.
Most recently the Supreme Court has found that the system of education
defined by the Legislature to comply with the constitution included the Basic Education Act of 1977 (BEA); the special education program for students
with disabilities; the Learning Assistance Program; the Transitional
Bilingual Education program; and portions of the student transportation
program.
5
In January 2012 in the McCleary case, the Supreme Court held that the
state has not complied with its Article IX, section 1 constitutional duty to
make ample provision for the basic education of all children in Washington.
The court did acknowledge the recent enactment of promising reforms under
Chapter 548, Laws of 2009, and acknowledged the current progress toward
implementing those reforms. The Court also noted that, if fully funded, the
reform package will remedy deficiencies in the K-12 funding system. The
Court retained jurisdiction to help "facilitate progress" in the State's plan to
fully implement the reforms by 2018 and later ordered the Legislature to file
reports after each operating budget is enacted summarizing the legislative
actions taken towards compliance with the state constitutional duty. The
Court's review of the report will focus on whether the actions taken by the
Legislature show "real and measurable" progress towards achieving full
compliance by 2018. After its review, the Court will determine whether to
request additional information, direct further fact-finding or take any other
steps. The Court provided that while it is not realistic to measure the steps
taken in each legislative session between 2012 and 2018 against full
constitutional compliance, the State must demonstrate "steady progress"
according to the schedule anticipated by the enactment of the ESHB 2261
(Chapter 548, Laws of 2009) reforms.
The Legislature has filed two reports with the Court, which can be found
at: http://www.leg.wa.gov/jointcommittees/AIXLJSC/Pages/default.aspx
In a December 2012 order, the Court responded to the first legislative report
by finding that the first report fell short and that the Legislature needed to
provide a detailed phase-in plan addressing all areas identified in ESHB
2261 and then follow it.
In January 2014, the Court acknowledged the, "meaningful steps" taken
by the 2013 Legislature, but the Legislature did not provide a plan for how
they will measure their success. The Court ordered the Legislature to
respond by April, 30 2014 with, "a complete plan for fully implementing its
program of basic education for each school year between now and the 2017-
18 school year."
How has the Legislature implemented court rulings? In order to carry out its constitutional responsibility, the Legislature
passed the Basic Education Act of 1977 (BEA), which defined a “basic
education” by establishing goals, minimum program hours, teacher contact
hours, and a mix of course offerings for a school district to provide.
Currently, at least some portion of seven programs (general apportionment; the special education program for students with disabilities;
some pupil transportation; the Learning Assistance Program for remediation
assistance; the Transitional Bilingual Education program; the highly capable
program; and educational programs in juvenile detention centers and state
institutions) fall within the Legislature’s definition of basic education.
6
The Legislature is also proceeding with implementing the reform
package under Chapter 548, Laws of 2009 by putting into place the new
funding formulas and phasing in funding enhancements in specified
programs.
General Apportionment - Foundational state funding to school districts is
provided through the General Apportionment formula and funds basic
education as well as a number of non-basic education adjustments. The
amount received by each school district varies based on certain
characteristics — such as teacher experience and education level, and
historical salary levels. On average, the statewide allocation through the
General Apportionment formula is estimated at approximately $5,552 per
student in the 2013-14 school year.
General Apportionment formula:
Under the new funding structure, which was effective September 1,
2011, the general apportionment formula follows the prototypical school
model. Prototypes illustrate a level of resources to operate a school of a
particular size with particular types and grade levels of students. Allocations
to school districts are based on actual full-time equivalent (FTE) student
enrollment in each grade in the district, adjusted for small schools and
reflecting other factors in the state's biennial budget. Under SHB 2776
(Chapter 236, Laws of 2010), the Legislature designed a funding formula
that allocates funding in three primary groups: schools, district-wide support,
and central administration.
The prototypical model applies staff ratios and an assumed class size for
each school type: elementary, middle, and high school. Each prototype has a
theoretical number of students and designated levels of staffing. The
funding to each district is scaled according to actual enrollment in each of
the grade ranges. For example, an elementary school is assumed to have 400
students in the prototypical model. If a district has 800 elementary-grade
students, it will receive funding for double the numbers of staff positions
shown in Table 2, below. The class sizes represent the levels of funding
associated with assumed ratios of students to teachers, given certain
assumptions about the length of a teacher's day and the amount of time
reserved for planning. Funding is for allocation purposes only (except for the
categorical, or dedicated, programs) and it is up to the school district to
budget the funds at the local level. Beginning with the 2011-12 school year,
the Office of Superintendent of Public Instruction (OSPI) began reporting how school districts are deploying those same state resources through their allocation of staff and other resources to school buildings, so that citizens are
able to compare the state assumptions to district allocation decisions for each
local school building. The information, by school building, is available on an
internet portal hosted by the Office of the Superintendent of Public
Instruction at: http://k12.wa.us/safs/INS/2776/Portal.asp.
7
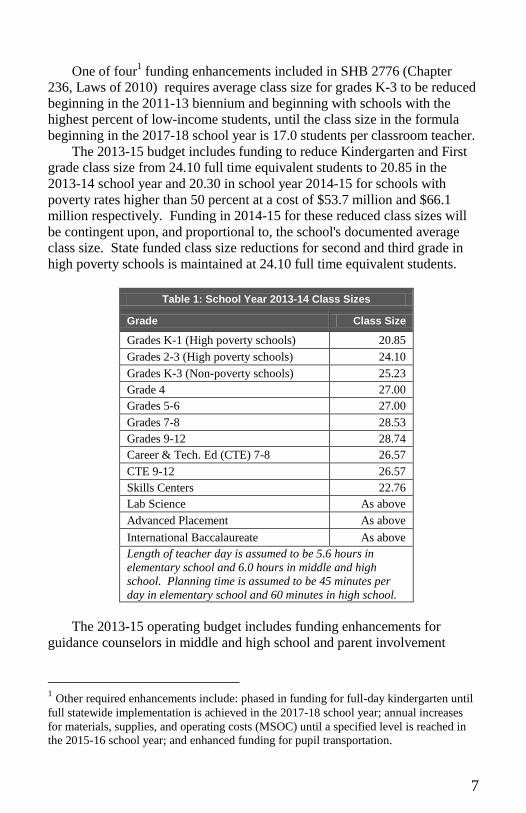
One of four1 funding enhancements included in SHB 2776 (Chapter
236, Laws of 2010) requires average class size for grades K-3 to be reduced
beginning in the 2011-13 biennium and beginning with schools with the
highest percent of low-income students, until the class size in the formula
beginning in the 2017-18 school year is 17.0 students per classroom teacher.
The 2013-15 budget includes funding to reduce Kindergarten and First
grade class size from 24.10 full time equivalent students to 20.85 in the
2013-14 school year and 20.30 in school year 2014-15 for schools with
poverty rates higher than 50 percent at a cost of $53.7 million and $66.1
million respectively. Funding in 2014-15 for these reduced class sizes will
be contingent upon, and proportional to, the school's documented average
class size. State funded class size reductions for second and third grade in
high poverty schools is maintained at 24.10 full time equivalent students.
Table 1: School Year 2013-14 Class Sizes
Grade Class Size
Grades K-1 (High poverty schools) 20.85
Grades 2-3 (High poverty schools) 24.10
Grades K-3 (Non-poverty schools) 25.23
Grade 4 27.00
Grades 5-6 27.00
Grades 7-8 28.53
Grades 9-12 28.74
Career & Tech. Ed (CTE) 7-8 26.57
CTE 9-12 26.57
Skills Centers 22.76
Lab Science As above
Advanced Placement As above
International Baccalaureate As above
Length of teacher day is assumed to be 5.6 hours in
elementary school and 6.0 hours in middle and high
school. Planning time is assumed to be 45 minutes per
day in elementary school and 60 minutes in high school.
The 2013-15 operating budget includes funding enhancements for
guidance counselors in middle and high school and parent involvement
1 Other required enhancements include: phased in funding for full-day kindergarten until
full statewide implementation is achieved in the 2017-18 school year; annual increases
for materials, supplies, and operating costs (MSOC) until a specified level is reached in
the 2015-16 school year; and enhanced funding for pupil transportation.
8
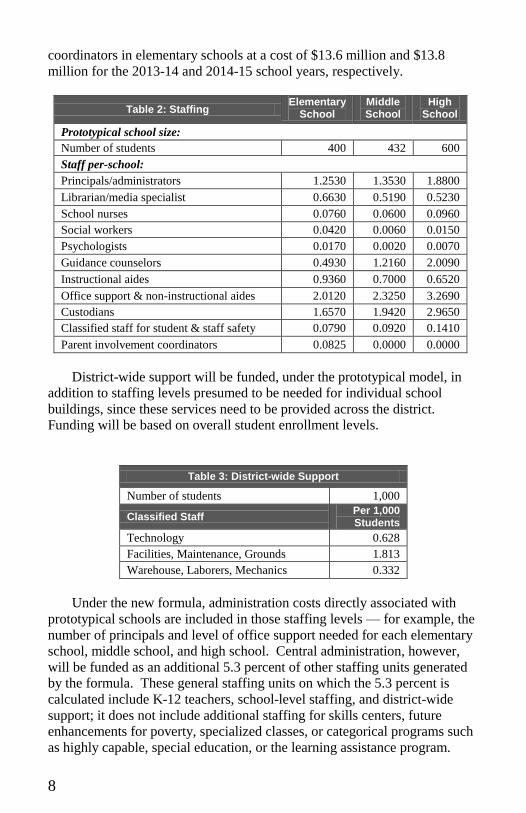
coordinators in elementary schools at a cost of $13.6 million and $13.8
million for the 2013-14 and 2014-15 school years, respectively.
Table 2: Staffing Elementary
School Middle School
High School
Prototypical school size:
Number of students 400 432 600
Staff per-school:
Principals/administrators 1.2530 1.3530 1.8800
Librarian/media specialist 0.6630 0.5190 0.5230
School nurses 0.0760 0.0600 0.0960
Social workers 0.0420 0.0060 0.0150
Psychologists 0.0170 0.0020 0.0070
Guidance counselors 0.4930 1.2160 2.0090
Instructional aides 0.9360 0.7000 0.6520
Office support & non-instructional aides 2.0120 2.3250 3.2690
Custodians 1.6570 1.9420 2.9650
Classified staff for student & staff safety 0.0790 0.0920 0.1410
Parent involvement coordinators 0.0825 0.0000 0.0000
District-wide support will be funded, under the prototypical model, in
addition to staffing levels presumed to be needed for individual school
buildings, since these services need to be provided across the district.
Funding will be based on overall student enrollment levels.
Table 3: District-wide Support
Number of students 1,000
Classified Staff Per 1,000 Students
Technology 0.628
Facilities, Maintenance, Grounds 1.813
Warehouse, Laborers, Mechanics 0.332
Under the new formula, administration costs directly associated with
prototypical schools are included in those staffing levels — for example, the
number of principals and level of office support needed for each elementary
school, middle school, and high school. Central administration, however,
will be funded as an additional 5.3 percent of other staffing units generated by the formula. These general staffing units on which the 5.3 percent is
calculated include K-12 teachers, school-level staffing, and district-wide
support; it does not include additional staffing for skills centers, future
enhancements for poverty, specialized classes, or categorical programs such
as highly capable, special education, or the learning assistance program.
9
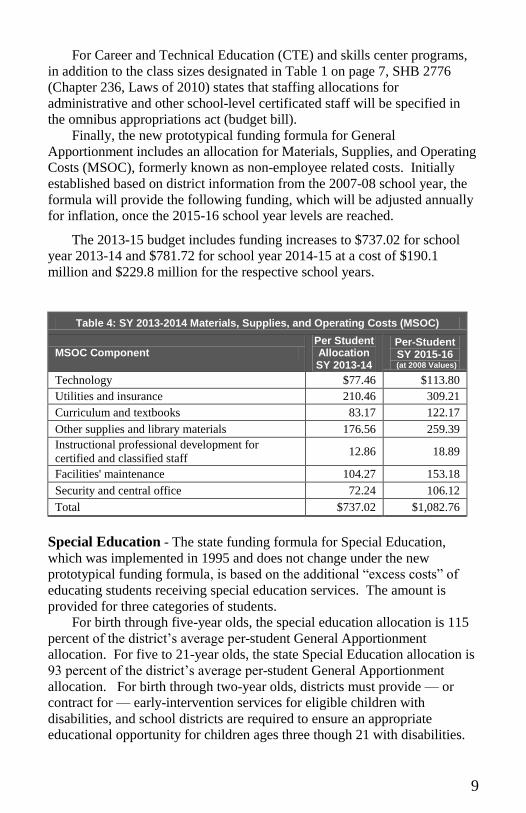
For Career and Technical Education (CTE) and skills center programs,
in addition to the class sizes designated in Table 1 on page 7, SHB 2776
(Chapter 236, Laws of 2010) states that staffing allocations for
administrative and other school-level certificated staff will be specified in
the omnibus appropriations act (budget bill).
Finally, the new prototypical funding formula for General
Apportionment includes an allocation for Materials, Supplies, and Operating
Costs (MSOC), formerly known as non-employee related costs. Initially
established based on district information from the 2007-08 school year, the
formula will provide the following funding, which will be adjusted annually
for inflation, once the 2015-16 school year levels are reached.
The 2013-15 budget includes funding increases to $737.02 for school
year 2013-14 and $781.72 for school year 2014-15 at a cost of $190.1
million and $229.8 million for the respective school years.
Table 4: SY 2013-2014 Materials, Supplies, and Operating Costs (MSOC)
MSOC Component Per Student Allocation SY 2013-14
Per-Student SY 2015-16
(at 2008 Values)
Technology $77.46 $113.80
Utilities and insurance 210.46 309.21
Curriculum and textbooks 83.17 122.17
Other supplies and library materials 176.56 259.39
Instructional professional development for
certified and classified staff 12.86 18.89
Facilities' maintenance 104.27 153.18
Security and central office 72.24 106.12
Total $737.02 $1,082.76
Special Education - The state funding formula for Special Education,
which was implemented in 1995 and does not change under the new
prototypical funding formula, is based on the additional “excess costs” of
educating students receiving special education services. The amount is
provided for three categories of students.
For birth through five-year olds, the special education allocation is 115
percent of the district’s average per-student General Apportionment
allocation. For five to 21-year olds, the state Special Education allocation is
93 percent of the district’s average per-student General Apportionment
allocation. For birth through two-year olds, districts must provide — or
contract for — early-intervention services for eligible children with
disabilities, and school districts are required to ensure an appropriate
educational opportunity for children ages three though 21 with disabilities.
10
In addition to the per-student Special Education allocation, the special
education funding structure includes a safety net for districts that can show
extraordinary special education program costs beyond state and federal
resources. For the 2013-14 school year, the statewide average allocation per
birth-to-five-year old special education student is estimated at $6,266 and
the statewide average allocation per five to 21-year old special education
student is estimated at $5,048 per year. For five to 21-year olds, this amount
is in addition to the General Apportionment allocations described above.
Pupil Transportation - The new transportation formula was effective
September 1, 2011, and phases in funding the transportation of students "to
and from school" as part basic education. The new formula requires the
funding to be calculated using a regression analysis of major cost factors that
are expected to increase (or decrease) the prior year's pupil-transportation
costs, including the count of basic and special-student ridership, district land
area (geography), roadway miles, the average distance to school, and other
statistically-significant coefficients.
Funding in the 2013-15 budget completes the phase-in of the new
transportation formula. Funding in school year 2013-14 provides forty
percent or $42.8 million of the enhancement needed for full funding.
Funding in school year 2014-15 provides 100 percent or $109.7 million to
complete the phase-in of the new transportation formula.
In addition, the state provides funding for school bus replacement costs
using a depreciation schedule. Annual payments are made to districts from
the year a bus is purchased until it reaches the end of its scheduled lifecycle.
State allocations are deposited into the district's Transportation Vehicle Fund
to be used only for the purchase of new buses or for major repairs.
Learning Assistance Program - The Learning Assistance Program (LAP)
provides remediation assistance to students scoring below grade level in
reading, math and language arts. Districts receive LAP allocations based on
the number of students in poverty, as measured by eligibility for free or
reduced-price lunch.
As with other categorical programs, the new funding formula provides a
designated number of hours of instruction per week. (A "categorical"
program is one in which funds may be used for only the dedicated program
and may not be re-allocated for use elsewhere in the school district.) The
new law provides 2.3975 hours of LAP instruction per-week, assuming class
sizes of 15 students per certificated instructional staff. The formula translates
to additional funding of approximately $466 per eligible student in the 2013-14 school year.
Transitional Bilingual Education - The statewide Transitional Bilingual
Instruction Program (TBIP) was created by the Legislature in 1979. State
11
TBIP funding supports school staff and training intended to teach English as
a second language to students in the public K–12 school system.
As with other categorical programs, the funding formula provides a
designated number of hours of instruction. Assuming class sizes of 15
students per certificated instructional staff, the formula provides 4.7780
hours of bilingual instruction per week. The formula translates to additional
funding of approximately $930 per eligible student in the 2013-14 school
year.
New funding for transitional support for up to two years after a student
has exited the TBIP is provided to assist students who have met the
proficiency standards. In school year 2013-14, 3.0 hours of additional
instruction are provided for students who exited the program the immediate
prior year at a cost of $584 per eligible student. Beginning in school year
2014-15, 3.0 hours of additional instruction are provided for students who
exited the program in the immediate prior two years.
Institutional Education Programs - The state funds a 220-day
educational program for children in certain institutions. Institutional
education moneys are allocated to the school districts, educational service
districts, or others that provide the educational programs. While the
amounts vary based on the type and size of program, the current institutional
education allocation is projected to be approximately $12,264 per student in
the 2013-14 school year. The formula for Institutional Education has not
changed under the new funding structure.
Highly Capable Program - The Highly Capable, or gifted, program is
funded under basic education statutes for up to 2.314 percent of enrollment
and, as is the case with other categorical programs, the allocation cannot be
used for other programs. This translates to additional funding of
approximately $420 per student in the 2013-14 school year.
As with other categorical programs, the new funding formula for the
Highly Capable Program provides a designated number of hours of
instruction per week, in this case 2.1590, assuming class sizes of 15 students
per certificated instructional staff.
Full-Day Kindergarten - The definition of basic education provides half-
day instruction for kindergarten students (180 half days, or equivalent, and
450 hours of instruction — compared to 180 full days and 1,000 hours of
instruction for grades 1 through 12), to be increased to 1,000 hours of
instruction for all kindergarten students. The increase is to be phased-in on a
schedule set by the Legislature, and beginning with schools with the highest
percentage of low-income students, until full statewide implementation of
full-day kindergarten is achieved in the 2017-18 school year. Once fully
implemented, full-day kindergarten will be part of the program of basic
education.
12
Funding in the 2013-15 budget increased the state funded full-day
kindergarten from approximately 22 percent in the 2012-13 school year to
43.75 percent in the 2013-14 and 2014-15 school years at a cost of $49.3
million and $50.6 million, respectively. , The additional state funds are
targeted to those schools with the highest percentage of poverty as measured
by the rate of eligibility for free or reduced-price lunch. A list of schools eligible for state funding for full-day kindergarten is
published by the Office of Superintendent of Public Instruction and can be
found at the following site:
http://www.k12.wa.us/EarlyLearning/FullDayKindergartenResearch.aspx
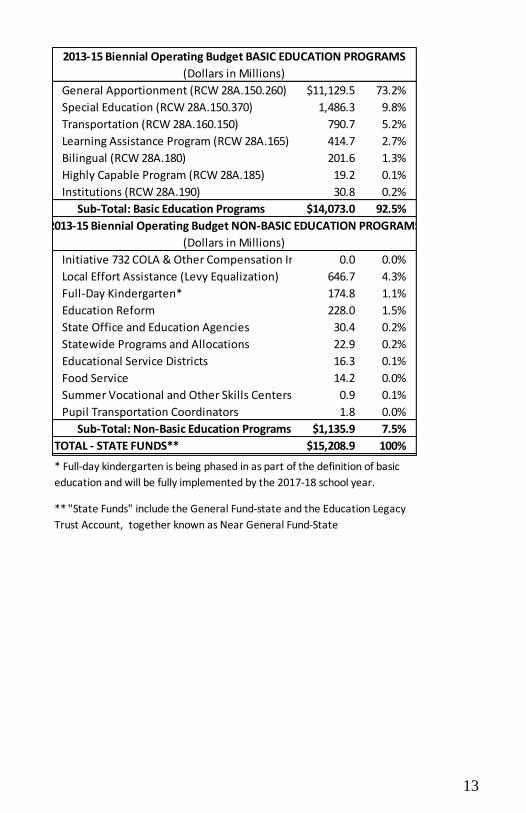
The Legislature also funds a variety of programs and activities outside
of its definition of basic education. The chart below reflects the funding for
the 2013-15 biennium (fiscal years 2014 and 2015) for the seven programs
currently defined as “basic education” as well as the funding for other K-12
programs and activities funded by the state.
13
General Apportionment (RCW 28A.150.260) $11,129.5 73.2%
Special Education (RCW 28A.150.370) 1,486.3 9.8%
Transportation (RCW 28A.160.150) 790.7 5.2%
Learning Assistance Program (RCW 28A.165) 414.7 2.7%
Bilingual (RCW 28A.180) 201.6 1.3%
Highly Capable Program (RCW 28A.185) 19.2 0.1%
Institutions (RCW 28A.190) 30.8 0.2%
Sub-Total: Basic Education Programs $14,073.0 92.5%
Initiative 732 COLA & Other Compensation Increases 0.0 0.0%
Local Effort Assistance (Levy Equalization) 646.7 4.3%
Full-Day Kindergarten* 174.8 1.1%
Education Reform 228.0 1.5%
State Office and Education Agencies 30.4 0.2%
Statewide Programs and Allocations 22.9 0.2%
Educational Service Districts 16.3 0.1%
Food Service 14.2 0.0%
Summer Vocational and Other Skills Centers 0.9 0.1%
Pupil Transportation Coordinators 1.8 0.0%
Sub-Total: Non-Basic Education Programs $1,135.9 7.5%
TOTAL - STATE FUNDS** $15,208.9 100%
** "State Funds" include the General Fund-state and the Education Legacy
Trust Account, together known as Near General Fund-State
2013-15 Biennial Operating Budget BASIC EDUCATION PROGRAMS
(Dollars in Millions)
2013-15 Biennial Operating Budget NON-BASIC EDUCATION PROGRAMS
(Dollars in Millions)
* Full-day kindergarten is being phased in as part of the definition of basic
education and will be fully implemented by the 2017-18 school year.
14
What is the levy lid act and why was it passed? In a major 1978 decision (Seattle School District No. 1 v. State, 585
P.2d 71, 978) interpreting constitutional provisions related to education,
among other things, the Washington State Supreme Court found that school
districts may use local tax levies to fund enrichment programs and programs
outside the legislative definition of “basic education.” However, the use of
local levies cannot reduce the state’s obligation to fund basic education.
At the same time that the Legislature defined and took on responsibility
for fully funding a basic education program, they passed the Levy Lid Act.
The act limits the amount of revenue that a school district can raise through
maintenance and operation (M & O) levies. While local levy revenues made
up 32 percent of total school district revenues prior to the levy failures of
1975 that precipitated the 1977 school funding lawsuit, they fell to less than
10 percent of total school district revenues after the enactment of the Levy
Lid Act.
Since that time, the Legislature has made various changes to the Levy
Lid Act, ultimately increasing school districts’ ability to raise levy revenues.
Currently, 205 of the 295 school districts have a levy lid of 28 percent,
which was increased in the 2010 Legislative session from 24 percent. This
means that revenue raised from local tax levies cannot exceed 28 percent of
the district’s state and federal revenues (with other technical adjustments to
that base). The other 90 school districts have a levy lid ranging from 28.01
percent to 37.90 percent. These 90 districts have higher levy lid authority
because, at the time the Levy Lid Act was passed, these districts raised a
higher amount of their revenues through M & O levies. (A list of these
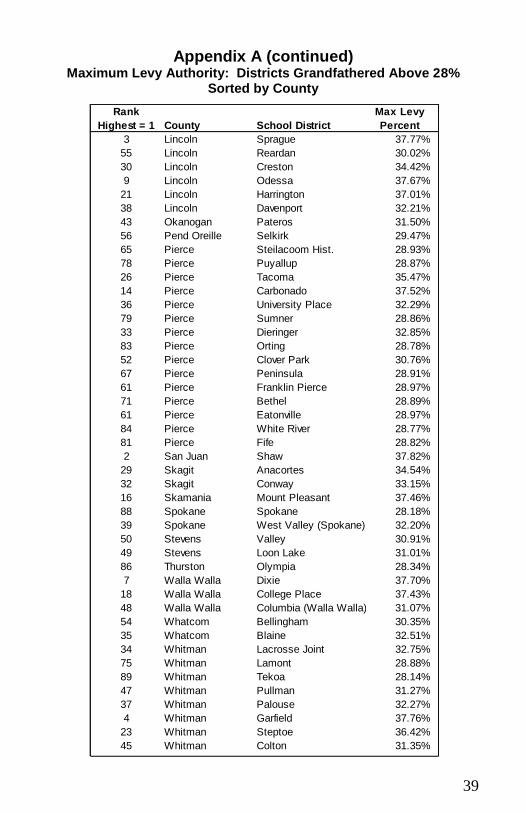
districts and their current levy lid rates is included in appendix A.)
15
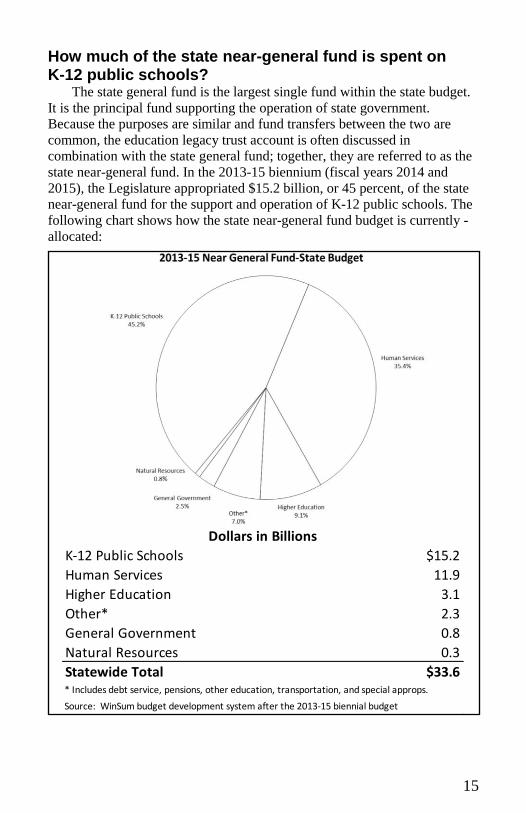
K-12 Public Schools $15.2
Human Services 11.9
Higher Education 3.1
Other* 2.3
General Government 0.8
Natural Resources 0.3
Statewide Total $33.6* Includes debt service, pensions, other education, transportation, and special approps.
Source: WinSum budget development system after the 2013-15 biennial budget
Dollars in Billions
How much of the state near-general fund is spent on K-12 public schools?
The state general fund is the largest single fund within the state budget.
It is the principal fund supporting the operation of state government.
Because the purposes are similar and fund transfers between the two are
common, the education legacy trust account is often discussed in
combination with the state general fund; together, they are referred to as the
state near-general fund. In the 2013-15 biennium (fiscal years 2014 and
2015), the Legislature appropriated $15.2 billion, or 45 percent, of the state
near-general fund for the support and operation of K-12 public schools. The
following chart shows how the state near-general fund budget is currently -
allocated:
16
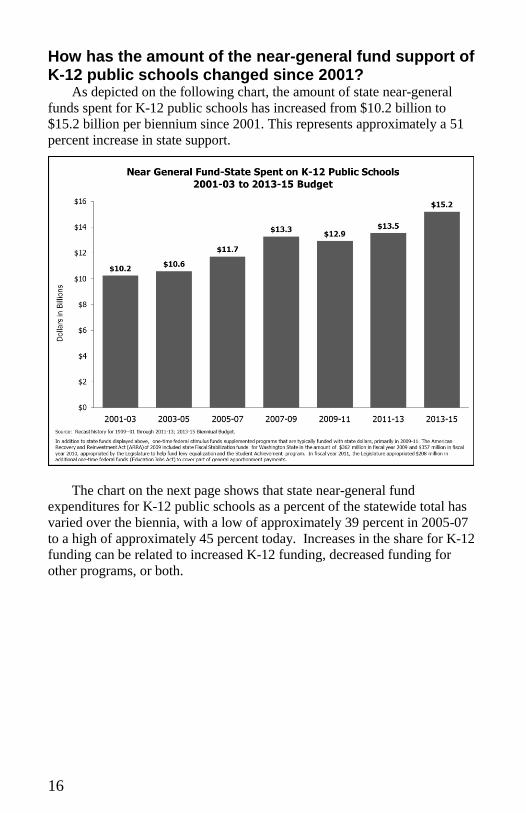
How has the amount of the near-general fund support of K-12 public schools changed since 2001?
As depicted on the following chart, the amount of state near-general
funds spent for K-12 public schools has increased from $10.2 billion to
$15.2 billion per biennium since 2001. This represents approximately a 51
percent increase in state support.
The chart on the next page shows that state near-general fund
expenditures for K-12 public schools as a percent of the statewide total has
varied over the biennia, with a low of approximately 39 percent in 2005-07
to a high of approximately 45 percent today. Increases in the share for K-12
funding can be related to increased K-12 funding, decreased funding for
other programs, or both.
17
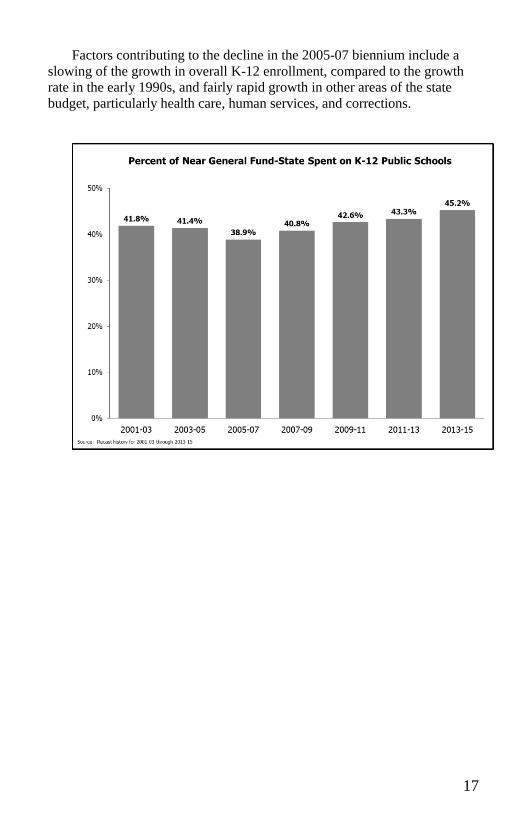
Factors contributing to the decline in the 2005-07 biennium include a
slowing of the growth in overall K-12 enrollment, compared to the growth
rate in the early 1990s, and fairly rapid growth in other areas of the state
budget, particularly health care, human services, and corrections.
18
What are other sources of funding used by school districts?
In addition to state funding, school districts receive funding from the
federal government, local taxes, and other miscellaneous sources. The
sources of funding budgeted by school districts for operating costs for the
2012-13 school year are described below.
State — Approximately 66 percent of budgeted school district revenues in the last school year were from state sources. This amount consists of funding
for the seven categorical programs currently defined as “basic education”
(general apportionment; the special education program for students with
disabilities; some pupil transportation; the Learning Assistance program for
remediation assistance; the Transitional Bilingual Instructional Program; the
Dollars in Millions
State $6,708
Local Taxes 2,052
Federal 905
Other Revenues & Reserves 442
Total $10,108Excludes capital costs, debt service, transportation vehicle, and associated student body
revenues.
Source: OSPI F195/F196 School Financial Services reports.
19
Highly Capable program; and educational programs in juvenile detention
centers and state institutions) as well as a variety of other grants, allocations,
and items funded from the state general fund and the education legacy trust
account.
Local Taxes — Approximately $2.1 billion, or 20 percent of the total
amount spent, is from local taxes. This is primarily local property taxes,
which are often referred to as maintenance and operations levies.
Federal — School districts spent about $905 million from federal sources
for the 2012-13 school year. This represented about 9 percent of their total
spending. This includes funding for the implementation of the federal
Individuals with Disabilities Education Act; instructional assistance and
other strategies aimed at improving student achievement in high-poverty
schools; a variety of professional development activities; the school lunch
and other nutrition programs; financial assistance to compensate school
districts as the result of federal land ownership; and a variety of smaller
allocations and grants.
Other Revenue & Reserves— This category, totaling $442 million or about
four percent of total funding, includes a variety of miscellaneous sources
such as charges and fees for non-basic education programs, school lunch
charges, revenue from other school districts, rental income, donations, and
the use of reserves or fund balance.
20
How are these funds spent by school districts? Another way to examine school spending is to identify how school
districts spend the money received from state, federal, local, and other
sources. School districts report detailed data to the Office of Superintendent
of Public Instruction, including the “activities” on which they spend money.
The amounts spent on each activity for the 2012-13 school year are depicted
below.
Dollars in Millions
Teaching $5,937
Other Support Services 1,112
Teaching Support 1,071
Central Administration 577
Building Administration 602
Pupil Transportation 417
Food Services 357
Total $10,073Source: OSPI F195/F196 School Financial Services reports.
21
Teaching — For the 2012-13 school year, school districts spent
approximately $5.9 billion (59 percent of the total) for teaching activities.
This includes payments for salaries and benefits for classroom teachers,
direct classroom instruction, extracurricular activities, and payments to other
districts for educational services.
Teaching Support — School districts spent $1.1 billion on teaching support
activities in the 2012-13 school year. This represents approximately 11
percent of total school district spending. This includes guidance counseling,
library services, audio-visual functions, psychological services, health-
related activities, and other services that support the delivery of teaching
services.
Other Support Activities — After teaching, the largest activity for school
district spending is utilities, grounds care, plant operation and maintenance,
insurance, information systems, and other support functions. In the 2012-13
school year, school districts spent approximately $1.1 billion, or 11 percent
of their total spending, on this activity.
Central Administration — Approximately $577 million or six percent of
total school district spending is for central administration. This includes
school board functions, the superintendents’ offices, business functions,
human resources, centralized programs, and other district-level
administrative functions.
Building Administration — In the 2012-13 school year, school districts
spent $602 million, or six percent, on unit administration. This includes
expenditures for principals and other building-level administrative functions.
Pupil Transportation — School districts spent $417 million or four percent
on pupil transportation in the 2012-13 school year. This includes bus and
other vehicle operating costs, related maintenance, and program supervision.
Food Services — Approximately $357 million, or four percent of the total,
is spent for food-operation functions, including program supervision and
federal-nutrition programs, in the 2012-13 school year.
22
How much is spent per student? In the 2012-13 school year, on a statewide basis, school districts spent
$10,063 per student. The following chart depicts a breakdown of the sources
of funding for per student spending:
Of the $10,063 spent by school districts in per-student resources, $6,678 or
66 percent of the funding is from state sources, $2,043 or 20 percent is from
local taxes, $901 or 9 percent is from federal sources, and $440 or 4 percent
came from other revenue. For more detail on these sources, please see
“What are other sources of funding used by schools districts?” on page 16.
State $6,678
Local Taxes 2,043
Federal 901
Other Revenues 440
Total Per Student $10,063
Sources: OSPI F195/F196 School Financial Services and OSPI enrollment reports.
23
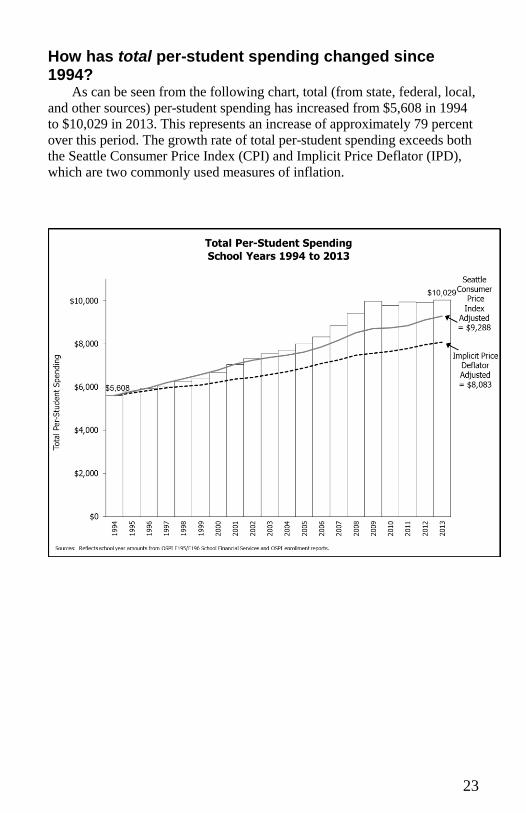
How has total per-student spending changed since 1994?
As can be seen from the following chart, total (from state, federal, local,
and other sources) per-student spending has increased from $5,608 in 1994
to $10,029 in 2013. This represents an increase of approximately 79 percent
over this period. The growth rate of total per-student spending exceeds both
the Seattle Consumer Price Index (CPI) and Implicit Price Deflator (IPD),
which are two commonly used measures of inflation.
24
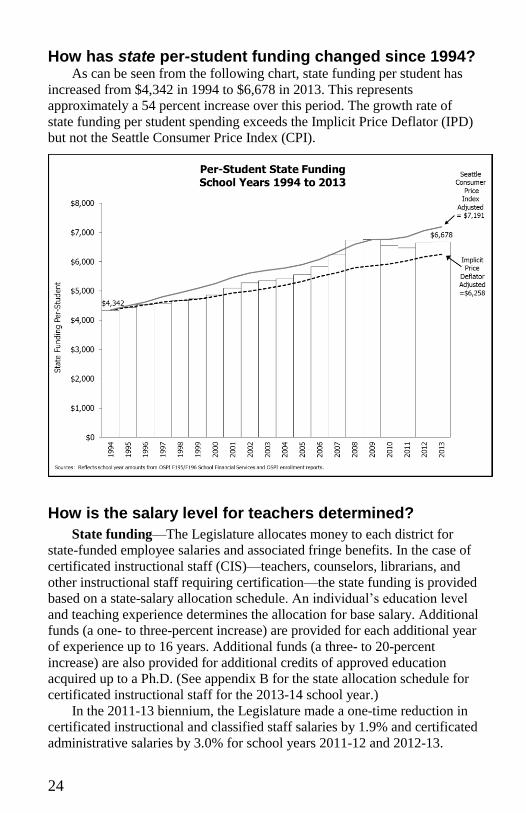
How has state per-student funding changed since 1994? As can be seen from the following chart, state funding per student has
increased from $4,342 in 1994 to $6,678 in 2013. This represents
approximately a 54 percent increase over this period. The growth rate of
state funding per student spending exceeds the Implicit Price Deflator (IPD)
but not the Seattle Consumer Price Index (CPI).
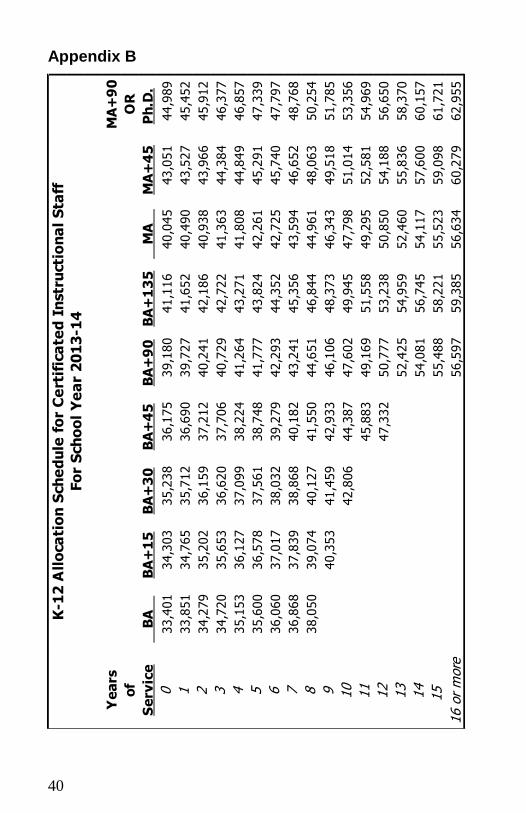
How is the salary level for teachers determined?
State funding—The Legislature allocates money to each district for
state-funded employee salaries and associated fringe benefits. In the case of
certificated instructional staff (CIS)—teachers, counselors, librarians, and
other instructional staff requiring certification—the state funding is provided
based on a state-salary allocation schedule. An individual’s education level
and teaching experience determines the allocation for base salary. Additional
funds (a one- to three-percent increase) are provided for each additional year
of experience up to 16 years. Additional funds (a three- to 20-percent
increase) are also provided for additional credits of approved education acquired up to a Ph.D. (See appendix B for the state allocation schedule for
certificated instructional staff for the 2013-14 school year.)
In the 2011-13 biennium, the Legislature made a one-time reduction in
certificated instructional and classified staff salaries by 1.9% and certificated
administrative salaries by 3.0% for school years 2011-12 and 2012-13.
25
The state does not require school districts to pay certificated
instructional staff in accordance with the state-salary allocation schedule.
However, most school districts have adopted a salary schedule the same as,
or similar to, the state allocation schedule. Some of the state’s 295 school
districts receive higher salary allocations for certificated instructional staff.
The primary reason for this higher allocation is that these districts were
paying their certificated instructional staff higher salaries when the
Legislature took on responsibility for fully funding basic education programs
in the late 1970s. In the 2007-09 budget, the Legislature took steps that
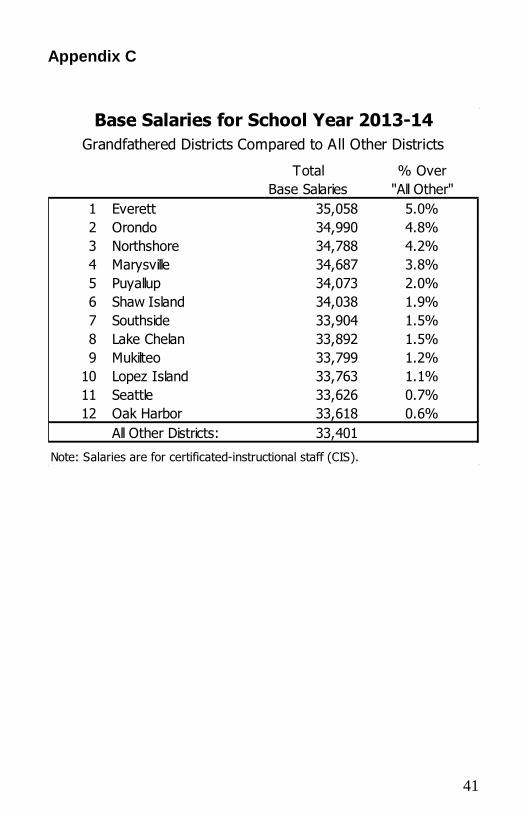
reduced the number of grandfathered salary districts. (See appendix C for a
list of these districts and their allocation rate for school year 2012-13.)
Additionally, the Legislature limits a school district’s authority to establish
salaries for certificated instructional staff by setting a minimum and an
average salary level.
Minimum salary – The actual minimum salaries in the district
cannot be less than the minimum on the state-salary allocation
schedule for a certificated instructional staff member who has a BA
or MA with no years of experience. The rationale for this limitation
is to ensure a minimum salary for beginning certificated
instructional staff.
Average salary – The actual average salary in the district cannot
exceed the average salary calculated based on the state allocation
schedule. A rationale for this limitation is to prevent districts from
paying a few certificated instructional staff a very large salary and
the rest at the minimum.
The state funding provided to school districts for certificated instructional
staff salaries is subject to collective bargaining within the state limitations.
Supplemental Pay – School districts may provide supplemental pay for
additional time, responsibilities, and incentives (also known as “TRI”)
beyond that provided by the state. The vast majority of supplemental
contracts are paid from local revenue. State law provides that supplemental
pay contracts must not create any present- or future-funding obligation for
the state.
26
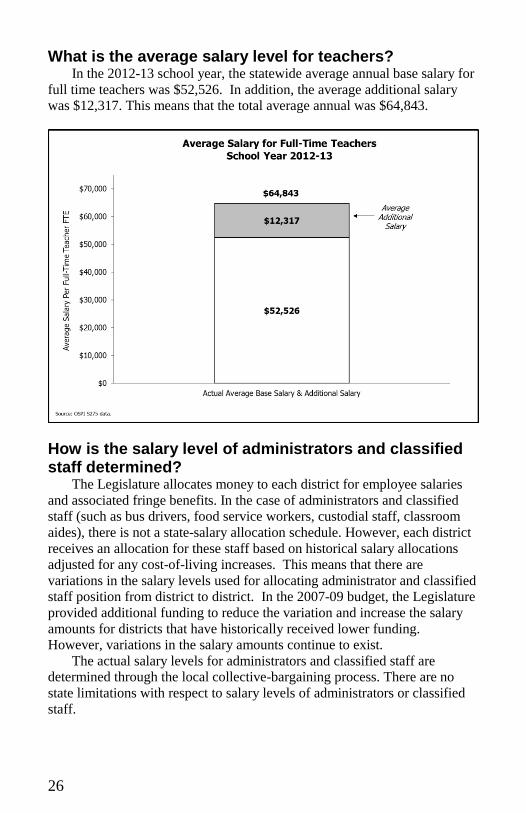
What is the average salary level for teachers? In the 2012-13 school year, the statewide average annual base salary for
full time teachers was $52,526. In addition, the average additional salary
was $12,317. This means that the total average annual was $64,843.
How is the salary level of administrators and classified staff determined?
The Legislature allocates money to each district for employee salaries
and associated fringe benefits. In the case of administrators and classified
staff (such as bus drivers, food service workers, custodial staff, classroom
aides), there is not a state-salary allocation schedule. However, each district
receives an allocation for these staff based on historical salary allocations
adjusted for any cost-of-living increases. This means that there are
variations in the salary levels used for allocating administrator and classified
staff position from district to district. In the 2007-09 budget, the Legislature
provided additional funding to reduce the variation and increase the salary
amounts for districts that have historically received lower funding.
However, variations in the salary amounts continue to exist.
The actual salary levels for administrators and classified staff are determined through the local collective-bargaining process. There are no
state limitations with respect to salary levels of administrators or classified
staff.
27
How does Washington compare to other states? National information is often used to compare different aspects of K-12
finance. On the following three pages are charts comparing per-student
spending, students enrolled per teacher, and teacher average salary levels in
Washington and other states. It should be noted that comparisons with other
states, while interesting, often do not lend themselves to any definitive
conclusions regarding each state’s K-12 finance system, due to differences
in reporting practices, demographics, and public-school funding systems.
Per-Student Spending — As depicted on the chart on page 28,
Washington’s total per-student spending of $10,682 ranks 28th compared to
the other states in the 2011-12 school year. The national average was
$11,254. Compared to other states in the western region, Washington’s per
student spending was $1,550 below Oregon ($12,232), $1,522 above
California ($9,160) and $1,794 above Idaho ($8,888).
Students Enrolled Per Teacher — The chart on page 29 compares students
enrolled per teacher in the 2011-12 school year. Washington’s 19.7 enrolled
students per teacher makes it the fourth highest in the nation. The national
average was 16.0. Compared to other states in the western region,
Washington’s number of enrolled students per teacher was below California
(25.6) and Oregon (20.2) but above Idaho (18.2). For a variety of reasons,
this measure of students to teachers does not translate into the “average class
size” in any given school, district, or state.
Teacher Average Salary Levels — The chart on page 30 provides a
comparison of average salary levels for teachers. In the 2011-12 school year,
Washington’s reported teacher average salary of $52,232 made it the 23rd
highest in the nation. The national average was $55,418. Compared to other
states in the western region, Washington’s average teacher salary was
$16,299 below California ($68,531), $5,116 below Oregon ($57,348), and
$3,681 above Idaho ($48,551). The average salary levels depicted on this
chart do not include supplemental pay. Since data related to supplemental
pay in other states is not available, it is unknown how this might affect the
rankings.
28
29
30
31
How does the state lottery support public schools? When the state lottery was established in 1982, the state was in an
economic recession. The Legislature deposited the lottery revenues into the
state general fund, which supports K-12 public schools, higher education,
human services, natural resources, and other state programs. Prior to the
actual creation of the lottery, there were various proposals to dedicate the
lottery proceeds to the developmentally disabled, public schools, or state
institutions. While none of these proposals were actually enacted into law,
they are probably the source of the popular misconception that the lottery
had been entirely dedicated to K-12 education.
As a result of the passage of Initiative 728 in 2000, all lottery revenues
were, in fact, dedicated for educational purposes (with the exception of
about 10 percent, which was dedicated by previous legislation for debt
service on the stadiums in Seattle). For fiscal years 2001-2004, a portion of
lottery revenues were distributed to school districts to allow them to make
improvements, such as reducing class sizes, extending learning
opportunities, and expanding professional development and early childhood
education programs. The remainder was deposited into the Education
Construction Account, which is used to fund a portion of the state matching
funds for K-12 public school and higher education construction. From fiscal
year 2005 through 2009, all lottery revenues were deposited into the
Education Construction Account. In 2009, the Legislature redirected lottery
dollars to the state general fund to support a range of state programs,
including education, for fiscal year 2010. K-12 school construction costs
were covered with additional general obligation bonds. Also in 2009, the
Legislature approved the sale of the multi-state game Powerball. While the
education construction fund previously has been lottery's largest beneficiary,
the lottery has been directed by the Legislature to make contributions to
stadium funding and problem gambling prevention and treatment. The
Legislature repealed I-728 during the 2012 Legislative session as part of HB
2824 (Chapter 10, Laws of 2012).
It should be noted that while Initiative 728 dedicated lottery revenues to
educational purposes, the Legislature passed legislation in 2002 that
authorized a new lottery game that is not subject to the distribution for
educational purposes. The legislation authorized participating in a multi-
state lottery (now named “Mega Millions”) with the profits from the game
going to the state general fund. The legislation had provisions addressing the
concern that some people might play the new multi-state lottery rather than
the existing lottery games and, therefore, diminish the base revenues for educational purposes. For this reason, the legislation required $102 million
annual transfers to make the educational-related accounts “whole” before
distributing any excess profits to the general fund. In other words, it was
intended that the educational related activities would receive as much money
as they would have without the multi-state lottery.
32
In 2010, the Legislature created the Washington Opportunity Pathways
Account. Beginning in fiscal year 2011, all net revenues from in-state
lottery games not otherwise dedicated to debt service on the Safeco Stadium
and Qwest (Century Link) Field and Exhibition Center were dedicated to the
new account. All net income from the multi-state lottery games, other than
those dedicated to the Problem Gambling Account, were deposited into the
Washington Opportunity Pathways Account rather than into the state general
fund and used for specified early-learning, higher-education, and economic-
development programs. A provision of the legislation creating the
Washington Opportunity Pathways Account requires a transfer of $102
million per year from the state general fund to the Education Construction
Account to maintain the same level of support for education construction.
Pursuant to 2012 legislation, the $102 million annual transfer is suspended
through fiscal year 2015. 2013 legislation repealed the annual transfer of the
$102 million and backfilled this transfer with state general obligation bonds.
33
What is the role of the federal government in public elementary and secondary education?
Public K-12 education is primarily a state and local responsibility.
However, the federal role in education has been evolving and increasing
over time. Although the federal Constitution, which gives U.S. Congress its
authority to act, is silent on the subject of education, Article I, Section 8, of
the U.S. Constitution provides that Congress has the power to provide
funding for the general welfare of the United States. Congress has relied on
this provision when enacting federal assistance programs addressing
education, including the education of students with disabilities (the
Individuals with Disabilities Education Act – IDEA, and the Americans
with Disabilities Act – ADA) and the education of students in poverty (Title
I programs). State participation in these programs is voluntary; however, if
the state accepts the federal funds then the state must comply with all of the
federal program requirements. Federal funds comprise approximately 9
percent of the total of Washington K-12 funding. Additionally, the due
process and equal protection clauses of the U.S. Constitution provide the
basis for the anti-discrimination laws (Title VI, Title VII, and Title IX)
enacted by Congress. The federal courts have also had a significant impact
on public education, especially in the areas of racial segregation, First
Amendment and due process rights of students and employees, school
finance, and education programs for students who have limited English
proficiency and for students with disabilities. The No Child Left Behind Act of 2001 (NCLB) reauthorized the
Elementary and Secondary Education Act of 1965 (ESEA). This legislation
greatly expanded the federal role in public education. Part of the stated intent
of the reauthorized ESEA is that all students obtain a high-quality education
that will enable them to meet challenging state academic achievement
standards. The new law represents the most sweeping changes to the ESEA
since it was originally enacted in 1965. Under the NCLB, states are required
to increase student testing; collect and disseminate subgroup results; ensure
a highly qualified teacher in every classroom; and guarantee that all
students, regardless of socioeconomic factors, achieve a “proficient” level of
education by school year 2014. As these provisions are implemented, the
Office of Superintendent of Public Instruction and others are continuing to
assess the adequacy of federal funding and potential changes to NCLB.
Most recently, part of the American Recovery and Reinvestment Act of
2009 included $4.35 billion for the Race to the Top Fund. The program's
intent was to provide competitive grants to encourage states to advance
education reform in the following four areas: adopting standards and
assessments; building data systems; recruiting and retaining effective
teachers and principals; and turning around low-achieving schools. Grant
awards were announced in 2010 for 12 states. Washington State was not a
successful contender for the award.
34
In 2011, the federal Department of Education (DOE) began offering
waivers of certain provisions of the NCLB/ESEA, including, among other
things, the requirement to meet the Annual Yearly Progress targets and reach
100% student proficiency by 2014 in reading and mathematics; and the
NCLB/ESEA's mandated consequences. In order to receive a waiver, states
are required to implement the following: 1) college- and career- ready
standards and assessments that measure student achievement and growth; 2)
a differentiated accountability system that both recognizes high-achieving,
high progress schools (reward schools) and supports chronically low-
achieving schools (priority and focus schools); 3) teacher and principal
evaluation and support systems to improve instruction; and 4) a reduction in
duplication and unnecessary burdens on school districts. Washington is one
of 42 states that have received NCLB/ESEA waivers. However, the DOE
recently designated Washington's waiver to be at "high-risk." At issue is
Washington's implementation of number three in the paragraph above:
teacher and principal evaluation and support systems to improve instruction.
35
What are other types of dedicated funding utilized by school districts?
Over three-fourths of a typical school district’s expenditures are for the
day-to-day operation of the school district and are funded in the school
district’s general fund. For this reason, this document primarily focuses on
these expenditures. However, it should be noted that school districts also use
other funds including: Capital Project Funds, which are used for some
facility construction and remodeling costs; Debt Service Funds, which are
used for the repayment of bond debt; Associated Student Body Funds, which
are used for student activities; and Transportation Vehicle Funds, which are
used for purchasing school buses.
How is school construction funded in the state? In each biennial capital budget, the state provides financial assistance to
school districts for constructing new, and remodeling existing, school
buildings. The state-assistance program is based on two principles: (a) state
and local school districts share the responsibility for the provision of school
facilities; and (b) there is an equalization of burden among school districts to
provide school facilities regardless of the wealth of the districts.
To be eligible for state funding, a school district must have a space or
remodeling need and must secure voter approval of a bond levy or other
funding for the local share of a school project. Once the local share is
secured, the state money is allocated to districts based on a formula
comprised primarily of a set of space and cost standards/allocations and
a matching ratio based on the relative wealth of the district.
The state program does not reimburse all costs related to a project. Costs
not eligible for reimbursement include site-acquisition costs; administrative
buildings; stadiums/grandstands; most bus garages; and local sales taxes.
Construction-related costs that are eligible include eligible construction costs
per-square-foot; architectural and engineering fees; construction
management; value-engineering studies; furniture and equipment; energy
conservation reports; and inspection and testing.
In the 2013-15 biennium (fiscal years 2014 and 2015), the Legislature
appropriated approximately $495 million in new funds for the state match
associated with school-construction projects beginning in the biennium.
36
What is Initiative 732? Initiative 732 (I-732), approved by state voters in November 2000,
required the state to provide an annual cost-of-living salary adjustment
(COLA) for K-12 teachers and other public school employees and certain
community and technical college staff, beginning in school year 2002. Each
school district must distribute the cost-of-living COLA in accordance with
the district's salary schedules, collective-bargaining agreements, and
compensation policies, and certify that the district spent the funds for
COLAs.
In 2003, the Legislature suspended the COLA requirement for the 2003-
05 biennium (school years 2004 and 2005), and no COLA was provided
with the exception of a few targeted salary increases for beginning teachers
and classified staff. Additionally, the Legislature modified the COLA
provisions for K-12 employees so that the state is required to fund only costs
associated with providing the COLA to state-funded employees. Since all
employees receive the COLA, this means that the costs associated with
providing a COLA for locally- and federally-funded staff has to come from
those sources.
The Legislature suspended the COLA requirement for the 2009-11
(school years 2010 and 2011), 2011-13 (school years 2012 and 2013), and
the 2013-15 (school years 2014 and 2015) biennia.
What is Initiative 728? Initiative 728 (I-728), was approved by state voters in November 2000
and repealed during the 2012 Legislative session as part of HB 2824
(Chapter 10, Laws of 2012).
The Initiative transferred a portion of the state property tax from the
state general fund to the Student Achievement Fund (SAF). The SAF then
distributed a per-pupil allocation to school districts to use for class-size
reduction, extended learning opportunities for students, professional
development for educators, early-childhood programs, and necessary
building improvements to support class-size reductions or extended learning
opportunities. The initiative provided school districts $184 per full-time
equivalent (FTE) student in the 2001-02 school year, $208 per FTE student
in the 2002-03 school year, $212 per FTE student in the 2003-04 school
year, and $450 per FTE student in the 2004-05 school year. In subsequent
years, the amount would increase by inflation.
As depicted on the following chart, in 2003, the Legislature reduced the
distribution of the I-728 funds so that school districts received $254 per FTE
student in the 2004-05 school year; $300 per FTE student in the 2005-06
school year; $375 per FTE student in the 2006-07 school year; $450 per FTE
student in the 2007-08 school year; and $458 per FTE student in the 2008-09
school year, which reflected an inflationary increase from the prior year.
37
In 2009, the Student Achievement Fund was consolidated into the state
general fund, along with five other funds with purposes similar to the
general fund. The accounts were subject to the state expenditure limit at the
time, so the consolidation did not affect the Initiative-601 approved spending
limit and were previously categorized as "Near General Fund-State" funds.
Advocates of the consolidation believed the change would improve budget
transparency by simplifying the budget process and reducing the need to do
frequent and numerous fund shifts in the state budget.
For the 2009-10 school year, I-728 per-student distributions were
reduced to $131 per FTE student and were eliminated for school years 2010-
11 through 2012-13 as the Legislature balanced a series of budgets requiring
the closure of multi-billion dollar budget deficits. One-time federal stimulus
funds from the American Recovery and Reinvestment Act (ARRA) provided
a portion of the I-728 funding for the 2008-09 and 2009-10 school years.
In the 2012 Legislative session, the Student Achievement Program
statutes were repealed as preparations were made for funding the redefined
definition of basic education and enhancements to be phased in by 2018, in
recognition that basic education funding, rather than supplementary non-
basic education programs, would be the Legislature's focus.
38
Appendix A Maximum Levy Authority: Districts Grandfathered Above 28%
Sorted by County
Rank Max Levy
Highest = 1 County School District Percent
58 Adams Lind 29.20%
40 Adams Ritzville 32.12%
81 Chelan Cashmere 28.79%
12 Clark Green Mountain 37.58%
11 Columbia Starbuck 37.61%
27 Cowlitz Toutle Lake 35.19%
86 Cowlitz Kalama 28.24%
15 Douglas Orondo 37.51%
90 Douglas Bridgeport 28.01%
5 Douglas Palisades 37.73%
41 Douglas Mansfield 32.00%
24 Douglas Waterville 36.00%
25 Franklin North Franklin 35.70%
1 Franklin Kahlotus 37.90%
8 Grant Wahluke 37.69%
53 Grant Quincy 30.67%
51 Grant Coulee/Hartline 30.79%
19 Grays Harbor Cosmopolis 37.40%
43 Jefferson Brinnon 31.50%
22 King Seattle 36.97%
68 King Federal Way 28.90%
75 King Enumclaw 28.88%
9 King Mercer Island 37.67%
64 King Highline 28.95%
75 King Vashon Island 28.88%
65 King Renton 28.93%
57 King Skykomish 29.43%
28 King Bellevue 34.66%
13 King Tukwila 37.54%
85 King Riverview 28.72%
68 King Auburn 28.90%
71 King Tahoma 28.89%
80 King Snoqualmie Valley 28.83%
61 King Issaquah 28.97%
42 King Shoreline 31.93%
71 King Lake Washington 28.89%
71 King Kent 28.89%
68 King Northshore 28.90%
60 Kitsap Bainbridge 28.98%
17 Kittitas Damman 37.44%
6 Klickitat Centerville 37.71%
89 Klickitat Roosevelt 28.14%
20 Lewis Evaline 37.36%
58 Lewis Boistfort 29.32%
31 Lewis White Pass 33.43%
39
Appendix A (continued) Maximum Levy Authority: Districts Grandfathered Above 28%
Sorted by County
Rank Max Levy
Highest = 1 County School District Percent
3 Lincoln Sprague 37.77%
55 Lincoln Reardan 30.02%
30 Lincoln Creston 34.42%
9 Lincoln Odessa 37.67%
21 Lincoln Harrington 37.01%
38 Lincoln Davenport 32.21%
43 Okanogan Pateros 31.50%
56 Pend Oreille Selkirk 29.47%
65 Pierce Steilacoom Hist. 28.93%
78 Pierce Puyallup 28.87%
26 Pierce Tacoma 35.47%
14 Pierce Carbonado 37.52%
36 Pierce University Place 32.29%
79 Pierce Sumner 28.86%
33 Pierce Dieringer 32.85%
83 Pierce Orting 28.78%
52 Pierce Clover Park 30.76%
67 Pierce Peninsula 28.91%
61 Pierce Franklin Pierce 28.97%
71 Pierce Bethel 28.89%
61 Pierce Eatonville 28.97%
84 Pierce White River 28.77%
81 Pierce Fife 28.82%
2 San Juan Shaw 37.82%
29 Skagit Anacortes 34.54%
32 Skagit Conway 33.15%
16 Skamania Mount Pleasant 37.46%
88 Spokane Spokane 28.18%
39 Spokane West Valley (Spokane) 32.20%
50 Stevens Valley 30.91%
49 Stevens Loon Lake 31.01%
86 Thurston Olympia 28.34%
7 Walla Walla Dixie 37.70%
18 Walla Walla College Place 37.43%
48 Walla Walla Columbia (Walla Walla) 31.07%
54 Whatcom Bellingham 30.35%
35 Whatcom Blaine 32.51%
34 Whitman Lacrosse Joint 32.75%
75 Whitman Lamont 28.88%
89 Whitman Tekoa 28.14%
47 Whitman Pullman 31.27%
37 Whitman Palouse 32.27%
4 Whitman Garfield 37.76%
23 Whitman Steptoe 36.42%
45 Whitman Colton 31.35%
40
Appendix B
K-1
2 A
llo
ca
tio
n S
ch
ed
ule
fo
r C
ert
ific
ate
d I
nstr
ucti
on
al
Sta
ff
Fo
r S
ch
oo
l Y
ea
r 2
01
3-1
4
Ye
ars
MA
+9
0
of
OR
Se
rvic
e B
A
BA
+1
5B
A+
30
BA
+4
5B
A+
90
BA
+1
35
M
A
MA
+4
5P
h.D
.
033,4
01
34,3
03
35,2
38
36,1
75
39,1
80
41,1
16
40,0
45
43,0
51
44,9
89
133,8
51
34,7
65
35,7
12
36,6
90
39,7
27
41,6
52
40,4
90
43,5
27
45,4
52
234,2
79
35,2
02
36,1
59
37,2
12
40,2
41
42,1
86
40,9
38
43,9
66
45,9
12
334,7
20
35,6
53
36,6
20
37,7
06
40,7
29
42,7
22
41,3
63
44,3
84
46,3
77
435,1
53
36,1
27
37,0
99
38,2
24
41,2
64
43,2
71
41,8
08
44,8
49
46,8
57
535,6
00
36,5
78
37,5
61
38,7
48
41,7
77
43,8
24
42,2
61
45,2
91
47,3
39
636,0
60
37,0
17
38,0
32
39,2
79
42,2
93
44,3
52
42,7
25
45,7
40
47,7
97
736,8
68
37,8
39
38,8
68
40,1
82
43,2
41
45,3
56
43,5
94
46,6
52
48,7
68
838,0
50
39,0
74
40,1
27
41,5
50
44,6
51
46,8
44
44,9
61
48,0
63
50,2
54
940,3
53
41,4
59
42,9
33
46,1
06
48,3
73
46,3
43
49,5
18
51,7
85
10
42,8
06
44,3
87
47,6
02
49,9
45
47,7
98
51,0
14
53,3
56
11
45,8
83
49,1
69
51,5
58
49,2
95
52,5
81
54,9
69
12
47,3
32
50,7
77
53,2
38
50,8
50
54,1
88
56,6
50
13
52,4
25
54,9
59
52,4
60
55,8
36
58,3
70
14
54,0
81
56,7
45
54,1
17
57,6
00
60,1
57
15
55,4
88
58,2
21
55,5
23
59,0
98
61,7
21
16 o
r m
ore
56,5
97
59,3
85
56,6
34
60,2
79
62,9
55
41
Appendix C
Total % Over
Base Salaries "All Other"
1 Everett 35,058 5.0%
2 Orondo 34,990 4.8%
3 Northshore 34,788 4.2%
4 Marysville 34,687 3.8%
5 Puyallup 34,073 2.0%
6 Shaw Island 34,038 1.9%
7 Southside 33,904 1.5%
8 Lake Chelan 33,892 1.5%
9 Mukilteo 33,799 1.2%
10 Lopez Island 33,763 1.1%
11 Seattle 33,626 0.7%
12 Oak Harbor 33,618 0.6%
All Other Districts: 33,401
Note: Salaries are for certificated-instructional staff (CIS).
Base Salaries for School Year 2013-14
Grandfathered Districts Compared to All Other Districts