Embed Size (px)
Citation preview

SAmMS NS Vol 3 (2000) No 1 245
A Classification of Different Phases of Development in the Export Sector of Nigerian Agriculture
Richard lIorah
Department of Economics. University of the North
ABSTRACT
The Nigerian agricultural export sector has been through three different development phases: transition, peak, and de-agriculturalisation. Blending simple international trade theory with actual facts, this study supports the notion that production during the transition phase enjoyed a classical "vent for surplus" type of growth, involving increased utilisation of available factor inputs, which in turn produced increased per capita income. Coupled with the classical factors were several technological packages introduced to fanners in later years. These led to the attainment of output peaks mainly in the 1950s and 1960s. Finally. the study argues that the foundation for de-agriculturalisation was already laid during the peak phase when fanners were taxed heavily, and several agricultural projects were biased against them.
JELQ18
1 INTRODUCTION
The development of the export sector of Nigerian agriculture may be classified in three different phases: transition, peak and de-agriculturalisation. Agriculture was introduced into the money economy by the colonial masters in the transition phase that ranged from the late 1800s to the early 1950s. There was a relative switch in production from food crops to export crops during the period. In the peak phase that stretched over most part of the 1950s and the 1960s output of the export crops boomed generally. Agriculture was the engine of growth of the Nigerian economy during the period. The de-agriculturalisation phase began generally in the second part of the 1960s and continued through the succeeding decades. In the de-agriculturalisation phase, Nigeria became more or less an importer of the same agricultural products that it had exported earlier. The agricultu.""al products in question include cocoa, palm produce (palm oil and palm kernels), groundnuts, cotton and rubber.
Rep
rodu
ced
by S
abin
et G
atew
ay u
nder
lice
nce
gran
ted
by th
e Pu
blis
her (
date
d 20
09).
246 SAJEMS NS Vol 3 (2000) No 1
The relative switch from food to export crops production that characterised the transition phase was not a switch from backward to modern agriculture, since the newly introduced export crops did not alter the traditional farming methods. The switch rather involved increased utilization of available factor inputs, which in turn produced increased per capita income. By 1929, increases in agriCUltural output had registered annual growth rates of 7 percent for export value and about 6 percent for the volume, and a total contribution to GDP of between five to seven percent (Helleiner, 1966: 5). Included in the exports were nonagricultural commodities such as coal, tin ores and other m,inerals, though agricultural exports were dominant.
Growth in commodity markets and production was halted during the great depression of the 1930s that extended to the first half of the 1940s, affecting agricultural exports in both value and volume. The purchasing power of exports dropped by about 38 percent already in 1931 and was not fully regained until after World War II. In the period 1929·1945, the entire export crops put together recorded only about 20 percent increase in export volume (Helleiner, 1966: 18). The removal of price ceilings in the USA after the war resulted in a boom in many commodity prices. Production increased above pre-war levels in all sectors of the export crops, and the trend continued generally into the 1950s and the most part of the 1960s. All export crops recorded output peaks during the period but for the cocoa sector where output peak was recorded in 1970.
A record level of about 293 600 tons of cocoa was attained in 1964, reflecting a growth rate of about 281.3 percent based on the 1945 level, to be followed by yet an all time high of 302 400 tons in 1970, implying a growth rate of 292.7 percent. In the groundnut sector, an output peak of about 1 026 600 tons of groundnuts was recorded in 1966, reflecting a growth rate of about 482.6 percent based on the 1945 level. Output peaks of 201 300 tons of palm oil and 462 100 tons of palm kernels were recorded in 1953 and 1961, respectively. These peaks meant growth rates of 76.3 percent for palm oil and 60 percent for palm kernels, based on their levels in 1945. Output peak of about 69 000 tons of cotton was recorded in 1963, and 70 300 tons of rubber in 1966. These peaks represented growth rates of over 6000 percent for cotton and 546.7 percent for rubber, based on their 1945 output levels.
Agriculture also became a substantial employer in Nigeria, accounting for over 70 percent of the country's labour force. Its share of GDP rose to about 50 percent. The export crops accounted for more than 55 percent of the Nigerian export revenues until the mid·1960s, when mineral oil (petroleum) became a significant source of foreign exchange (FOS, Review of external trade (various issues». Agriculture was therefore the engine of growth of the Nigerian econ?mr particularly during the peak phase. This study explores the main
Rep
rodu
ced
by S
abin
et G
atew
ay u
nder
lice
nce
gran
ted
by th
e Pu
blis
her (
date
d 20
09).
SAJEMS NS Vol 3 (2000) No 1 247
factors that promoted agricultural production in Nigeria during the transition and the peak phases. The study proceeds by looking at the structure of agricultural production in Nigeria. Thereafter, it blends a simple international trade theory with actual facts to analyse the initial expansion of agricultural output for export. It proceeds to discuss the growth rates in key sectors of the economy, including non-agricultural sectors, during the 1950s and part of the 1960s. More emphasis is given to the agriCUltural sector though and, in particular, the main factors that geared production towards attaining output peaks during the period. Finally, the study discusses the origin of de-agriculturalisation, followed by a brief conclusion.
2 THE STRUCTURE OF AGRICULTURAL PRODUCTION IN NIGERIA
Agricultural production in Nigeria for export has early been regionally specialized. The regional specialization has been dictated by the physical environment such as soil, climate and vegetation prevailing in the different regions of the country. The regions belong to different ecological areas. The northern savannah region is responsible for production of over 80 percent of the country's groundnuts and cotton. It is characterized by low rainfall, a short wet season, and low humidity. The southern thick forest regions, comprising of the west, mid-west and the east, on the contrary, receive heavy rainfall, have a long wet season and high humidity. The southern regions have climatic conditions favorable for production of the tree-crops, namely, cocoa produced in the west, rubber produced in the mid-west, and palm products (palm oil and palm kernels) produced in the east. The export sector of Nigerian agriculture is based on many small farms of usually not more than 5 acres per farm. Although over 80 percent of the adult male population in the peasant communities are farmers, only a little over 50 percent are full-time farmers. In the country as a whole, an average of around 30 percent of the population is engaged in part-time farming or work as farm labourers (Agboola, 1979: 15). The farm labourers usually complement family labour to satisfY labour requirements, particularly during peak periods.
The initial expansion of Nigerian agriculture for export was a response by indigenous peasant farmers to various external forces introduced by the British colonial administration. Among such forces were the development of transport and communication, the establishment of a suitable land policy, and the maintenance of law and order. Hogendorn (1978: 6) noted that the overwhelming colonial military technology, by diffusing the then political unrest, diverted man-hours spent for defence to more economic ends such as production for trade. A major obstacle to the growth of agricultural exports was thus removed. Direct foreign investment in agricultural production was
Rep
rodu
ced
by S
abin
et G
atew
ay u
nder
lice
nce
gran
ted
by th
e Pu
blis
her (
date
d 20
09).

243 SAJEMS NS Vol 3 (2000) No I
prohibited (Oluwasanmi, 1966). This prohibition by the Land and Native Ordinances of 1910 and 1917 was aimed at preserving farming land exclusively for the Nigerian fanners. Foreign finDs were, however, allowed to invest in trading activities, and thereby serving as links between Nigerian fanners and the world market. Consequently, important consumer goods such as textiles, salt, spirit, and tobacco were made available. These goods accounted for over 50 percent of the value of imports, and their availability helped to boost fanners' incentives toward further production. Fanners subsitituted leisure for more hours of work and brought more land into production. Food production for domestic consumption increased simultaneously with the production of export crops. The increased productive activities in the agricultural sector did not necessitate labour or capital imports into that sector (Eicher, 1970: 10).
3 THE INITIAL EXPANSION OF PRODUCTION FOR EXPORT
Myint's (1959) "vent for surplus" model of international trade provides a suitable tool for the analysis of output expansion from a subsistence to a trade level. It builds on Adam Smith's idea that international trade is the only route through which the smallness or the narrowness of a domestic market could be overcome. An outlet for a country's surplus product above domestic needs is thereby created. Myint's argument is that increased output per head in the less developed countries (LDCs) has been due to factors such as: (i) Once-for-all increase in productivity accompanying the transfer of labour from subsistence to money economy. (ii) Increase in working hours and in the proportion of gainfully employed labour relative to the semi-idle labour of the subsistence economy. (iii) Expansion of land under cultivation with the same methods of cultivation as used in the subsistence economy.
A key feature of Myint's model is that the country is assumed to have considerable surplus agricultural potentials consisting not only of unutilized land but also of unutilized labour, which could be mobilized for the expansion of material output. It implies that surplus productive potentials could act as a source of motivation for fanners to undertake production for export. This is in line with a different version by Just (1975) in which he argues that fanners are risk-averse. The degree of risk aversion increases when the margin of resources above that required for minimum subsistence output is negligible. It means that transition from subsistence to export production is only acceptable for peasant fanners who posses surplus resources that enable them to produce the export crops in addition to their subsistence production. Non-agricultural goods, including imported ones, acquired by fanners through the exploitation of the surplus productive capacity are regarded as a clear net gain attained merely by putting extra labour and land into export crops production. The relevance of the
Rep
rodu
ced
by S
abin
et G
atew
ay u
nder
lice
nce
gran
ted
by th
e Pu
blis
her (
date
d 20
09).
SAJEMS NS Vol 3 (2000) No 2 249
''vent for swplus" model is very obvious in the analysis of the initial development in the export sector of Nigerian agriculture.
a The cocoa sector Cocoa is a perennial crop that requires very little attention to produce maximum yields after planting. Nigerian cocoa trees begin to bear fruits after about 5-7 years from initial planting. Production becomes substantial during the seventh to tenth years, with peak production occurring between the tenth to fifteenth years of the trees life (Galletti et a1., 1956: 188). The old trees may continue to bear fruits for up to 40 years, although a continuous decline in production sets in after about 25 years of the plants' age. The harvest comprises plucking and picking the cocoa fruits as well as extracting the seeds from the fruits. Thus, very simple and unmechanical techniques are required. Usually, hired labourers are needed to meet production needs, especially during peak periods. A typical cocoa farmer in Nigeria cultivates the trees on land holdings of sizes 1.25-2.5 acres (Galletti et at., 1956: 149).
Cocoa was introduced in Western Nigeria, particularly in Ibadan and Ondo, in the 1890s (Berry, 1970: 18). The initial expansion of production was heavily influenced by factors such as: (i) Extension of a railway in the early 1900s from the sea port of Lagos, where already many traders were stationed, to Ibadan, a major producing area. (ii) Development of additional feeder-roads to other growing centres such as Ondo, Ogun, and Oyo, all in Western Nigeria. (iii) A system of labour employment (mostly in cases where demand is beyond a family-household supply) involving caSual or seasonal employment. (iv) Modification of tenure (land) arrangements according to the requirements of the cocoa farmer. An example of this type of modification was a change from communal form of land ownership to that of individual property rights (Berry, 1970: 18-19).
b The palm produce sector The oil palm products are also produced from a perennial tree. Unlike cocoa trees, the oil palm trees grow wild and are indigenous to tropical West Africa. The products, palm oil and palm kernels, serve both as domestic food (mostly the palm oil) and export products. The palm oil is extracted from the pericarp or the pulp of the palm fruit through crushing. The palm kernels, on the other hand, are obtained by cracking the nuts contained within the palm fruit. Palm kernels are produced almost exclusively for export. The palm trees have a life span of up to 60-70 years, with output declining after about 35 years. The young trees begin to bear fruits after about 10 years. Since the trees grow wild (in farmlands owned by individuals or in groves that are communally owned), very little or no effort is required in planting as well as in other care-taking (Helleiner, 1966: 94). Most labour is needed for plucking the fruits from the trees, extracting the
Rep
rodu
ced
by S
abin
et G
atew
ay u
nder
lice
nce
gran
ted
by th
e Pu
blis
her (
date
d 20
09).

250 SAmMS NS Vol 3 (2000) No 2
oil, and breaking up the nuts to take out the kernels. The palm trees produce fruits for harvest throughout the year, although production peak periods are mostly from March to May. Palm produce belongs to the main nineteenth century export crops in Nigeria (Zeven, 1965; Eicher, 1970: 10). At the early part of the twentieth century, it accounted for about 80-90 percent of Nigeria's export trade (Eicher, 1970: 9; Agboola., 1979: 115). With increases in demand from within and abroad, coupled with improvement in transportation that provided accessibility of former remote areas, more land and labour were brought into production.
c Tbe groundnuts and cotton sectors The production of groundnuts and cotton is handled by peasant farmers in the Northern Nigeria. The production process involves very simple technologies. In the groundnuts sector, about 5.8-8.7 acres of land per peasant household is devoted for production, particularly in the main producing Northern areas, such as Katsina and Kano (Luning, 1963: 27, 50). Production for export at the turn of the 20th century was stimulated by demand from Europe, although production for domestic consumption was already in progress as far back as the 1850s (Agboola., 1979). High demand for groundnuts as raw materials in European margarine industries raised prices substantially for the first time during the second half of the 1910s (Hogendom, 1978: 39). Already at that period, a railway line was under construction from Lagos seaport to Kano, a major producing area. The railway was opened for general traffic in April I, 1912 (Hogendom, 1970: 32). There was also surplus productive resources such as labour and land to raise output to match the increased demand from abroad.
Cotton, just like palm produce, also belongs to the main nineteenth century export crops in Nigeria (Eicher, 1970: 10; Agboola., 1979: 137). It is produced in the northern region just like groundnuts. It therefore benefitted from the same factors as groundnuts did for its initial expansion. Among such factors were improved transportation system, abundant productive resources (labour and land). Cotton also benefitted from a high demand from abroad, especially from the Lancashire cotton mills in Britain (Hogendorn, 1978, Chapt. 2).
d Tbe rubber sector Rubber is a perennial crop, just like cocoa and palm produce. The supply from peasant farmers with small land holdings of about 3-4 acres accoUnts for about 95 percent of total output. The remaining 5 percent comes from plantations owned by the Nigerian government. The crude rubber that is exported is developed from the latex obtained from the bark of the tree after cutting. About 5·7 years is usually required for the rubber'trees to attain producing age. The trees reach their production peak at the age of about 15 years, after which production gradually diminishes. Production is customarily stopped after about
Rep
rodu
ced
by S
abin
et G
atew
ay u
nder
lice
nce
gran
ted
by th
e Pu
blis
her (
date
d 20
09).

SAJEMS NS Vol 3 (2000) No 1 251
20-25 years of their lives (Blanckenburg, 1971). Increases in output during the transition period, particularly in the 1940s, was geared by the Japanese occupation of the main south-east Asian suppliers (HelJeiner, 1966: 120-2). To increase supply to meet the increased demand from abroad, there was support from the very usual factors such as improved transportation system from the major producing mid-westem areas to the ports of shipment in Lagos, and exploitation of the otherwise idle productive resources such as labour and land (Eicher, 1970: 10).
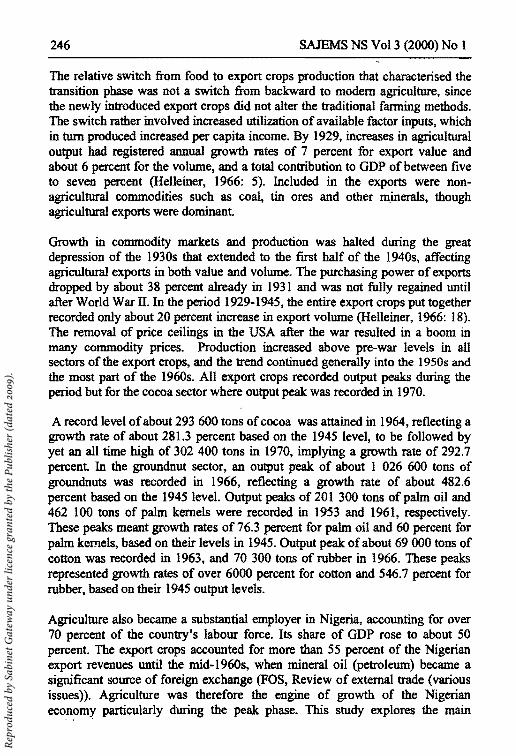
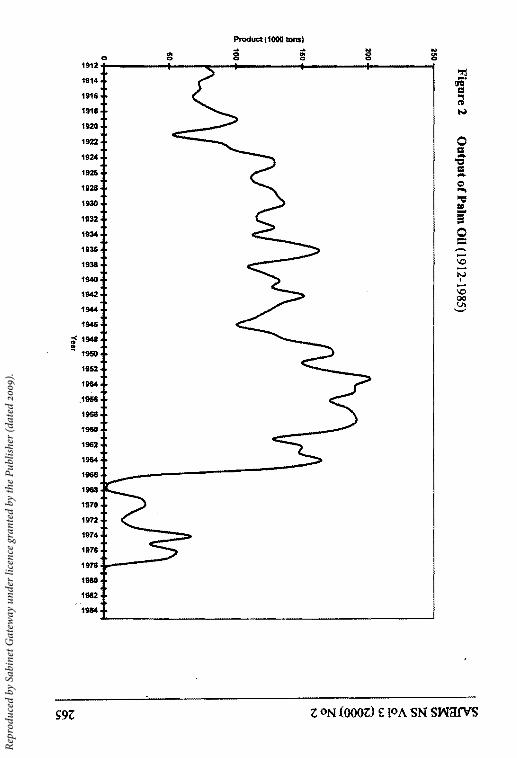
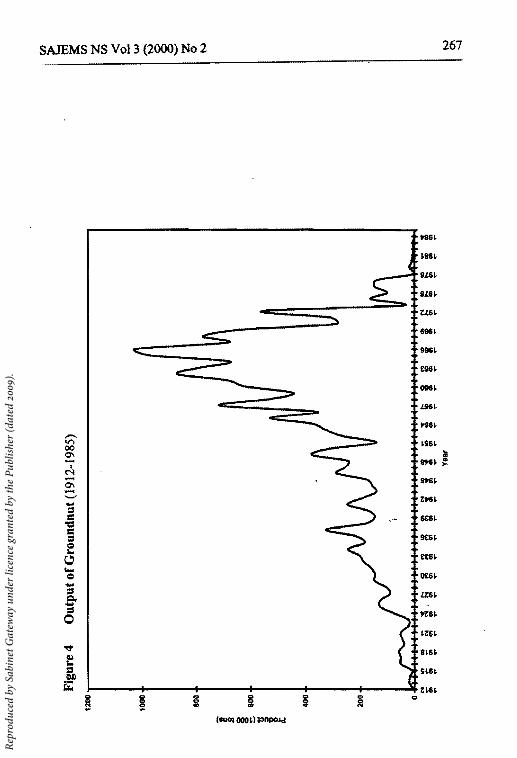
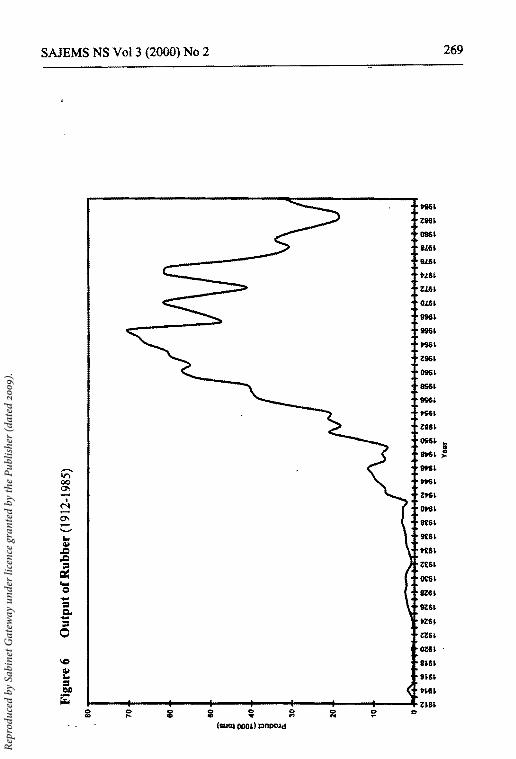
Figures 1-6 show exports of the main agricultural crops during the period 1912-1985. See Appendix A. The quantity of export captures output Domestic consumption of the crops was negligible. Exceptions were palm oil and groundnuts that were consumed domestically as food. Even with these food crops, and the others that were in the later years consumed domestically in significant quantities, purchases by users were, to a large extent, made directly through government initiated marketing organizations such as the commodity marketing boards (eMB).
As shown in Figure 1, the output of cocoa followed an upward trend in the transition period, 1912-1950. There were fluctuations though during the years, the most pronounced having occurred in the 1940s that was part of the Great Depression period which began in the 1930s. For example, in 1942, output was almost halved to around 60 000 tons from its level of about 113800 tons in 1939. Production increased after 1945 and, but for sharp decreases in 1954 and 1957 to 85 000 tons and 75 600 tons, respectively, it maintained an upward trend until the flTSt peak level of about 293 600 tons was recorded in 1964. There were decreases of 38 percent and 35.6 percent in 1965 and 1968, respectively, based on the output level attained in 1964. A record output peak of about 302 400 tons of cocoa was attained in 1970. Thereafter, output deteriorated and continued during the remaining period with only intermittent minor improvements that could not compare with the preceding peaks. In general, the period 1960-1970 represented the most favorable for cocoa output in Nigeria.
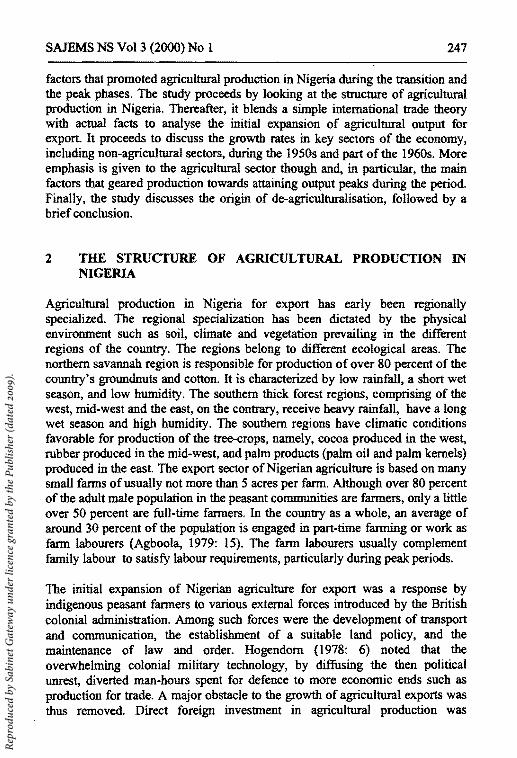
Figure 2 shows the output of palm oil during the period 1912-1985. Output showed a more or less steady improvement during the period 1912-1930 but for a sharp decrease in 1921. It remained stagnant during the first haIf of the 1930s when the average output level attained was about 125 000 tons. There was a tremendous improvement in 1936 when output level recorded about 162 800 . tons. The trend changed during the depression period of the late 1930s and the first half of the 1940s. The effect of the depression on output was mostly pronounced in 1938 and 1945/46 when output decreased by 32 percent and 20 percent, respectively, based on the preceding peaks attained in 1936 and 1942. Output, however, recovered after 1946. It is difficult (in the absence of reliable
Rep
rodu
ced
by S
abin
et G
atew
ay u
nder
lice
nce
gran
ted
by th
e Pu
blis
her (
date
d 20
09).
252 SAJEMS NS Vol 3 (2000) No I
data} to detennine the extent to which production for domestic consumption of palm oil has drained production for export. However, as shown in the figure, the main output peak was attained in 1953, after which production more or less continued to decline. A very poor output level became more pronounced since the second half of the 1960s. The period 195()"1960 remains the most favorable in the history of palm oil production in Nigeria.
The development in the palm kernel sector followed a similar pattern as in the palm oil sector. See Figure 3. Already in 1912, a substantial amount of palm kernel (about 184 600 tons) was produced. Output increased most of the time recording the first pronounced peak in 1936 with a level of 386 100 tons. A sharp decrease of about 61 percent was recorded in 1921 based on the 1936 level. Other significant decreases in output were experienced in 1940 and 1945/46 with rates of 39 percent and 26.2 percent, respectively, based on 1936 level. After 1946, output improved and remained generally favorable in the 1950s and the first half of the 1960s. Output deteriorated generally after 1965, with only minor improvements that remained far below the levels attained in the preceding decade.
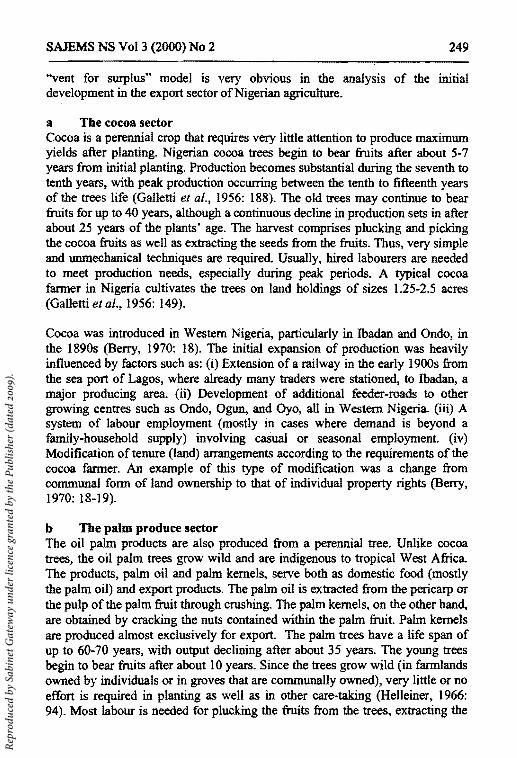
The output of groundnut was negligible during the very early 19008; the highest level attained before the 1920s was 57 600 tons in 1918. During the second half of the 1920s, output improved and rose to about 325 900 tons in 1937. See Figure 4. Thereafter, the trend changed showing a poor output performance particularly during the period 1938-1945 that coincided with World War II period. Production was generally revived after 1945, following a more or less upward trend but for sharp decreases experienced at nearly five-year intervals. The greatest decrease during the period occurred in 1951 when output fell by 62.6 percent, based on the preceding peak in 1949. The main peak in the sector was attained in 1966 with a record level of about 1 026 400 tons of groundnuts. A continuous deterioration has characterized the output trend during the post-1966 period but for slight improvements in 1968 and 1972.
The output of cotton during the transition phase, 1912-1950, was very erratic, fluctuating strongly around an upward trend. See Figure 5. A peak was attained in 1942, recording an output level of about 19000 tons. There was hardly any output at all in 1945, with a level of just about 1 000 tons. Output increased after 1945, reaching an all time high of 69200 tons in 1963. There were fluctuations though along the way, characterized by sharp decreases, particularly in 1960 and 1962 with rates of about 29.5 percent and 45 percent, respectively, based on the preceding peaks in 1958 and 1961. Output slowed down after the peak attained in 1963. It has shown a continuous deterioration since 1978. Generally, the output of cotton was most favorable during the period 1958-1977 in Nigeria.
Rep
rodu
ced
by S
abin
et G
atew
ay u
nder
lice
nce
gran
ted
by th
e Pu
blis
her (
date
d 20
09).

SAJEMS NS Vol 3 (2000) No 1 253
At the tum of the twentieth century, the output of rubber was already over 1 200 tons. Yet there was no clear output trend until the middle of the 1920s. See Figure 6. Until 1942, improvement in output was rather slow, with slight interruptions in 1932 and 1941. A significant improvement was started in 1942 and, but for minor decreases in 1947/49 and 1952, it continued generally until 1966 when a peak output level of about 70100 tons of rubber was recorded. The first real shock on rubber output occurred at the wake of the Nigerian civil war in 1967. Output then was, for the first time since 1950, decreased by as much as 31.9 percent from the preceding year's level. In the early post-(civil) war period in 1971, output was slightly improved, but fell again in 1972 by about 19.7 percent compared to the level in 1971. There was a sharp increase by about 48.8 percent in 1974 and that level was maintained even in 1975 after which output decreased successively during the remaining years, except for slight improvements in 1984 and 1985.
4 SECTORAL GROWTH RATES AND THE CONTRIBUTING FACTORS
The key economic sectors of the Nigerian economy experienced steady growths generally during the 1950s and the first-half of the 196Os. Such key sectors and their average annual growth rates are as follows: large scale manufacturing, 15 percent; construction, 7 percent; export crops, 5 percent; small scale industries, 3 percent; food production for domestic use (including fishery and livestock), 2.5 percent; and mining (excluding oil), 1 percent (Lewis, 1967: 10-11). Oil (petroleum) sector growth was negligible. Compared to the growth rates attained in the large scale manufacturing and construction sectors, the rate in the export crops sector with its third position might appear unimpressive. However, in terms of the export crops sector's contribution to the expansion of transportation and distribution, fmancing of imports through its export proceeds, financing of government services through its taxes, and its general contribution to employment, the exportable crops have made much greater contribution than the other sectors (Lewis, 1967: 15-16)
In Nigeria, manufactured goods are not produced in appreciable quantities for domestic consumption or for export. The economy's import volume can therefore be used as an important indication of its ability to produce primary crops for exports. In other words, the economy's ability to pay for its imports is determined by its primary export (export crops) earnings. In the I 950s, Nigeria's export and import values seemed to move positively with each other. For example, in 1950, export earnings stood at N176.8 million and the import expenditures at N123.6 million. Four years later, export earnings increased to N292.4 million and the import expenditures also increased to N228 million
Rep
rodu
ced
by S
abin
et G
atew
ay u
nder
lice
nce
gran
ted
by th
e Pu
blis
her (
date
d 20
09).
254 . SAJEMS NS Vol 3 (2000) No 1
(FOS, Review of external trade, various issues). With regard to sectoral contributions to tax revenue, duties on export crops and .export (crops)-financed imports together accounted for approximately half of the Nigerian government revenue as compared to less than 10 percent from direct taxes on income. Between 1950 and 1955, export duties mainly on agriculture alone averaged more than 20 percent of total government revenue (FOS, National accounts of Nigeria, various issues).
The growth of manufactures, on the other hand, was heavily dependent on an import substitution strategy through tariffs and other control instruments (Forest, 1982). The impressive growth rate also reflected the very small base from which the Nigerian industrial sector took off. In terms of shares of GOP, the agricultural (including food production for domestic use) contribution of over 50 percent far surpassed that of manufacturing sector of just about 4.7 percent (Lewis, 1967: 10-11). The enonnous difference was partly due to the fact that manufacturing employed mostly imported machines that were in turn supervised mainly by expatriates. The proceeds in fonn of value added in large scale manufacturing received by Nigerian nationals represented just a small fraction of what left the country in fonn of remittances by the expatriates. A similar explanation would be relevant for construction sector since its staff were also mainly foreign experts.
The output of export crops in Nigeria responded to improved prices after World War II. Export grew at an average annual rate of 4.8 percent during the period 1948-1958. Although this growth rate decelerated to 4.1 percent per annum during the period 1958-1964, production growth was fully maintained at 5.1 percent on average per annum (Lewis, 1967: 17). The difference between production and export was diverted to domestic use through the government commodity marketing boards (CMBs). During the period 1959/60, about 19.5 percent of groundnuts produced was supplied as raw materials to groundnut crushing mills in Kano, 7.2 percent of output of palm produce was diverted to local soap and margarine producing establishments, 7.1 percent of cotton output was absorbed into domestic industries, and 0.1 percent of rubber output was supplied to local industries manufacturing foot-wear, foam rubber, tyres, etc (Carter, 1963).
Apart from the effect of improved prices, other factors contributed also to boosting production during the post-war decades. Increased cocoa output was to a large extent caused by technological improvements, with only small increases in land and labour. Estimates in 1954 by Western Region Ministry of Agriculture indicated cocoa plantation to have covered about I million acres of land. During the period 1950-1953, the average purchase of cocoa in one season
. was about 110 000 tons. That implied an average yield of about one-ninth ton or
Rep
rodu
ced
by S
abin
et G
atew
ay u
nder
lice
nce
gran
ted
by th
e Pu
blis
her (
date
d 20
09).

SAJEMS NS Vol 3 (2000}No I 255
about 250 pounds per acre. By the early 1960s, although there was only about 15 percent increase in cocoa acreage, there was more than 50 percent rise in cocoa production above that of the early part of the 1950s. (See Figure 1.) That indicated a productivity increase. Among the factors responsible for the productivity increase were: (i) Improved age distribution of cocoa trees. More frequent planting of cocoa trees was undertaken by farmers in expectation for improved prices. Even when prices failed to meet expectations, output continued to improve since verY little or no financial resources were required to maintain the cocoa trees. Besides, the opportunity cost of cocoa farming was very low, since the cocoa farmers lacked other skills (Berry, 1975: 88 -9). (ii) Increased use of insecticides and fungicides both of which were promoted by the authorities through subsidies, credit-schemes, and extension services. The fungicide and insecticide sprays, introduced in 1956 and 1957, respectively, protected the cocoa plants against diseases such as black pods, capsid infestation, and swollen shoots. By 1962, the insecticide sprays were estimated to have covered about one-third of the entire cocoa acreage (Helleiner, 1966: 84). (iii) Distribution of improved cocoa seedlings to farmers. The principal variety, Amelenado cocoa, which on average and if properly managed could yield up to 800 pounds of cocoa per acre, was complemented with a new variety called Amazon cocoa. This variety could surpass the Amelenado variety with as much as per acre yield of more than 50 percent (Helleiner, 1966: 84).
The pattern of expansion of output of palm produce during the peak phase remained the same as in the transition phase. Production remained the indigenous method of cultivation, care and harvesting. The output expansion that took place was geared by international trade and was followed up by established smallholder-farmers with minimal innovation in the cultivation and harvesting of the product. Early attempts to promote smaIlholder production came in form of distribution of improved seedlings. The seedlings were palms of selective genetic material (Purvis, 1970: 268-9). The seedlings were to be grown in straight lines to the exclusion of food crops, and involving laborious inter-row weeding and fertilizing. The idea was to depart from the historical pattern of output expansion. The technological change was meant to be land-saving and requiring investments in the then wild crops. A smallholder rehabilitation scheme for palm produce sponsored by a Production Development Board (PDB), was launched in 1953 to achieve this goal (Purvis, 1970: 268-9). In the scheme, every participating farmer was allotted a limit of 5 acres of land to manage and the PDB agreeing to finance subsidies of about ~10 per acre. The amount was meant for felling, clearing, planting, and maintenance over a period of 4 years. The scheme lasted until 1957 and then ceased to exist. The PDB could not fulfill their financial obligations and that created suspicion and loss of confidence in the scheme. Farmers felt that the scheme was not worth the trouble when its advantages as a paying proposition was uncertain (Oloko,
Rep
rodu
ced
by S
abin
et G
atew
ay u
nder
lice
nce
gran
ted
by th
e Pu
blis
her (
date
d 20
09).

256 SAJEMS NS Vol 3 (2000) No I
1963). Besides, fanners did not have enough resources for a change from a classical "vent for surplus" type of growth, requiring little or no costs of investments, to a neo-classical type of growth affecting changes of resource use and high cost of growth through investment (Purvis, 1970: 275). The innovations that got positive reception, mainly in the 1950s, were exclusively in processing and marketing. These resulted in remarkable improvements in product quality rather than in output expansion (Purvis, 1970: 267).
In the grolUldnuts sector, improvement in production was attributed to many factors among which were: (0 Gradual expansion on the extensive margin. More land was brought into production. For example, there was an expansion of grOlUldnut cultivation land from about 1 million acres. in 1937 to over 1.6 million acres in 1960 (CMB Annual Reports, various issues). (ii) Improvement in real prices. The real price of groundnuts in 1963/64 was over 50 percent higher than its level in 1948 (CMB Annual Reports, various issues). Fanners obviously responded positively to such price developments. (iii) Increase in productivity through the introduction of high yielding breed of ground-nuts. An initiation of a pilot scheme in 1951 by the Northern Region Development Corporation introduced a new breed of grolUldnut called K50. Fanners welcomed the new breed since it had similar cultivation method as the traditional one that was already in use. The result of the scheme was that by 1957, the per acre yield of groundnuts was raised by 38 percent (Helleiner, 1966: II3). (iv) Fertilizer campaigns of the 1950s. During the period 1950-1952, large-scale issues offertilizer (super-phosphate) were allotted to fanners free of charge (Hogendom, 1978: 147). The campaigns were so successful, with the resulted productivity increases so obvious, that fanners generally accepted the positiv~ effects Qfusing the fertilizers. (v) Improvements at post-harvesting stages of the production process. The use of pestle and mortar, which was the traditional method of shelling the nuts, was in many areas of the producing region replaced with a better technique called mechanical decorticators. (vi) Introduction of sprays against pests. With the introduction of the sprays, pests called trogoderma granarium that attacked groundnuts during storage, and which in 1954155 destroyed up to 8.1 percent of total groundnut output, were by 1959/60 completely eradicated (Helleiner, 1966: 113).
Until the 1 950s, a breed of cotton known as Ishan A, with a strong but characteristic roughness, was the most common one grown in Nigeria for export (Agboola, 1979). A new breed called Allen Longstaple was later on introduced, to be followed by other breeds such as the Samaru strains, 26C and 26J. The newly introduced breeds proved to thrive very well in the Nigerian soil. At the same time, several programmes were in progress to boost output. The programmes included: (i) The use of "cotton cultivation officers" for the improvement of husbandry and cultivation practices. (U) Further improvement
Rep
rodu
ced
by S
abin
et G
atew
ay u
nder
lice
nce
gran
ted
by th
e Pu
blis
her (
date
d 20
09).
SAJEMS NS Vol 3 (2000) No 1 257
and extension of marketing facilities. To reduce certain problems associated with sales, several markets for cotton were created and placed closer to farmers. The markets were usually within 16 kilometres from each other. (iii) Installation of several cotton ginneries in the main producing centres. These ginneries separated the seeds from the cotton lint. The seeds were in tum dressed with protective chemicals (fungicides) that reduced the incidence of diseases, and then redistributed free of charge to farmers. Such measures boosted productivity and also guaranteed that the quality of cotton produced met export requirements. (iv) A policy of paying equal prices at all buying stations. This policy acted as an incentive to remote cotton growing areas towards increased production (Choyce, 1968).
The area under rubber production increased by about 33 percent in the 1960s. F AO (1966) estimated that about 120 000 persons were engaged in rubber production before the first-half of the 1960s. That figure excluded farmers working in government plantations. By 1971, the total number of rubber farmers, including those working in the government plantations, had gone down to 100000 (Agboola, 1979: 114). A combination of the acreage expansion in the growing areas and the decrease in the number of persons working in the farms, would imply that the increase in rubber output during the peak phase was partly due to expansion on the extensive margin, and partly due to a boost in productivity. Improvement in productivity was a result of government-led projects that were started in the 1950s, namely the government-owned model plantations. Although accounting for only one-eight of the estimated total rubber acreage by 1962, these plantations had served enormously to improve the skills needed by farmers to maintain their rubber farms. The most important of the skills were in rubber tapping and processing. During the period 1957-1962, about 49 000 farmers had been trained in tapping, 17 000 farmers in rubber processing, and about 1 400 farmers in cultivation and maintenance (Agboola, 1979: 114). Other government-led projects that boosted productivity included distribution of high-yielding seedlings at heavily subsidized prices. The seedlings produced quality changes in Nigerian rubber exports. Government official figures revealed that in 1956, the three categories of rubber produced in Nigeria had the following composition: Crepe natural rubber, 5456 tons (14.3. percent); Higher grade natural rubber, 5 215 tons (13.7 percent); Lower grade natural rubber, 27 486 tons (72 percent). In 1962, the composition had improved to the following: Crepe natural rubber, 32518 tons (54.5 percent); Higher grade natural rubber, 20 120 tons (33.7 percent); Lower grade natural rubber, 7 010 tons (11.8 percent) (FOS, Trade reports, 1964).
Obviously, increases in labour and land alone cannot explain the remarkable increases in Nigerian export crops production during the peak phase. Considerable increases in productivity had contributed to the expanded
Rep
rodu
ced
by S
abin
et G
atew
ay u
nder
lice
nce
gran
ted
by th
e Pu
blis
her (
date
d 20
09).

2S8 SAJEMS NS Voll (2000) No 1
production during the period. The cocoa sector was a typical example where productivity gains played a significant role, though there also occurred increases in acreages cultivated. The palm produce sector was on the opposite extreme, however. In that sector, production continued with the classical "vent for surplus" type of growth, since fanners were not particularly receptive to new farming methods. Output peaks attained in the palm produce sector were therefore mainly a result of expansion on the extensive margin. For groundnuts, cotton, and rubber, the output peaks attained were through a combination of gradual expansion on the extensive margin and increases in, productivity. Fanners in those sectors responded to a large extent to the technological packages that were introduced by the authorities. Remarkable though was the fact that all the export crops thrived nearly during the same period and thereafter deteriorated, marking the de-agriculturalisation phase.
5 THE ORIGINS OF DE-AGRICULTURALISATION
The role played by the agriCUltural sector after the mid-1960s had decreased both in relative and absolute terms. Its share of GDP had by 1970 fallen to under SO percent and further down to about 22 percent in 1982 (Oyejide. 1986: 13). The period 1970-1975 experienced an output decline by about 17.3 percent, and the situation was not improved through the 1980s and the 199Os. During the period 1973-1982, the total real output of agricultural export crops declined at an annual rate of about 30 percent (Oyejide, 1986: 14). Purchases by the government commodity marketing boards (CMB) for export, which was considered the most adequate measure of the output growth (Teal, 1983), had more or less ceased in the palm produce and grQundnut sectors, even before the CMB was officially dissolved in April 1986 (Andrae and Beckman, 1987: 52). (Recall Figures 1-6.)
The CMBs had, since their formation in the late 1930s and early 1940s, taxed away, in form of withdrawals, a substantial amount of income generated by Nigerian export crops fanners. Because of the gap between world market prices and producer prices, created by the CMB, there were indications that farmers' income fell relative to per capita income in the country. Table 1 below shows the magnitude of the tax deductions on export receipts that reached the farmers for the sales of their cash crops. The generally downward trend followed by the price ratios in nearly all the commodities, but for rubber, during the period before the mid-1970s, implied that the taxes on the export crops followed an upward trend. In an argument against the CMB taxes on export crops, Lewis (1967: 63) noted, "Producer prices have been driven so low that farmers' income is much less than it was IS years ago. The incentive to plant export crops has been diminished, and the engine of growth is in danger of being
Rep
rodu
ced
by S
abin
et G
atew
ay u
nder
lice
nce
gran
ted
by th
e Pu
blis
her (
date
d 20
09).

SAJEMS NS Vol 3 (2000) No 1 259
slowed down. YOWlg men are leaving the cOWltry-side, because the tenns of trade are heavily against fanning". Rubber was an exception because it was not Wlder the control of any government marketing organisation wttiI 1977 (CBN, Annual report and statement of accoWlts, 1977: 3).
The table shows that subsidies to farmers only became common as from the first half of the 1970s. That move by the authorities was Wldoubtedly a result of the diverted attention to the petroleum sector as the main source of government revenue during the period, and also a desperate attempt by the government to revive the seriously deteriorated agriculture. The subsidy payments were most visible in the palm produce (palm oil and palm kernel) and grOWldnut sectors. Cotton and cocoa farmers continued to be taxed unabated even in the 1980s.
Table 1
COID-lDodity Cocoa PlIIIn kernel PlIIIn 00 Ground Dats COttoD Rubber
Tbe ratio of producer price to world price for the principal Nigerian agricultural export commodities, 1945-1985
1945 1950 19S5 1960 1965 1970 1975 1980 1985
98.2 63.5 97.6 58.9 41.1 55.4 72.1 89.3 71.7 70.8 79.0 68.1 59.8 49.1 54.1 140.2 106.4 154.1
75.8 78.6 53.4 57.1 53.2 52.7 87.5 136.2 121.4 77.4 43.8 58.1 68.7 58.7 37.0 100.0 155.6 234.4
100.0 15.9 19.8 24.8 19.9 23.5 36.2 30.1 56.1 100.0 100.0 100.0 100.0 100.0 100.0 100.0 58.0 115.9
Sources: Computations are based on data from: FOS. Annual abstracts of statistics (various issues); Annual report of the commodity marketing boards (various issues); FAO,
Annual production statistics (various issues); CBN, Economic and financial review (various issues), and Annual report and statement of accoWlts (various issues).
At the same time as farmers suffered great income losses through withdrawals by the CMBs, unskilled urban workers. and farmers employed in government farms settlements and plantations, enjoyed regular minimum wage increases. DmiDg tbeperiod 1961/63, the minimum wage was increased by about 200 percent lbat increase was nothing compared to the benefits enjoyed by the urban educated elite. Lewis (1967: 42-3) noted that whereas in Britain university graduates and miners received about the same wage, the Nigerian graduates expected to be paid wages equivalent to that of four miners or nine farmers.
Rep
rodu
ced
by S
abin
et G
atew
ay u
nder
lice
nce
gran
ted
by th
e Pu
blis
her (
date
d 20
09).

260 SAJEMS NS Vol 3 (2000) No 1
The Nigerian government awareness of the agricultural deterioration became pronounced in 1973, when it undertook a reformation of the commodity marketing boards. The main objective of the reform was to tum the trend of output upwards by improving producer prices (Kirk-Green and Rimmer, 1981). Taxes on some of the export crops were relaxed, and removed completely on the others. Subsidy payments which were very rarely awarded farmers in the past became more frequent Other measures taken by the government to improve agricultural production included the establishment of government-directed projects such as Agricultural banks, farm settlements and plantations, and irrigation schemes (Forest, 1980: 222-58).
The agricultural banks were supposed to give credits to farmers for the purchase of production inputs such as fertilizers, and cash crops seedlings, among others. Unfortunately, it turned out later that political pressures dominated the activities of such banks, with the result that a vast majority of the peasant farmers never did benefit from the credits (Forest, 1980). Not only was it impossible for the farmers to produce the collateral securities needed to guarantee them the loans, but as Okowa (1982: 182) noted, most peasant farmers were simply not aware of the existence of the credit facilities. The facilities were located in the urban areas while farmers who were supposed to make use of them lived in the rural areas. As an example, the Nigerian Agricultural Bank had by 1978 approved loans of about frot286 million, with the actual disbursed amount estimated to about frotl24 million. Of the total amount disbursed as loans, 58 percent went to state government corporations and cooperatives, at 3 percent interest for on-lending. At 5 percent interest rate, the remaining 42 percent went to private companies and a class of individuals that, according to Collier (1983: 212), were better classified as "over-night" farmers recruited from urban business people, civil servants, and army officers. The idea with the low interest rates was that the bank should not operate on commercial basis (Forest, 1980). The bank, however, had other stringent lending conditions that made it practically impossible for poor peasant farmers to obtain the loans. Yet in the official government declaration for creating the Agricultural Bank, it was "in order to bring its lending facilities closer to the farmers for whose benefit the Nigerian Agricultural Bank was established" (The Nigerian Trade Journal, 1975: 10). The Bank's attitude lends weight to one of the common lender behavior assumptions that formal lenders are overly risk averse (Spio and Groenewald, 1997).
The establishment of government farm settlements and plantations was begun already in the 1960s with follow-ups on the project in the 1970s. The farm settlements were operated in such a way that a settler was an integral part of the establishment, and the farm he operated could ultimately become his after he had repaid development costs. (Settlers were predominandy males.) In contrast,
. a farmer remained an employee in the plantations (Agboola, 1979: 186), The
Rep
rodu
ced
by S
abin
et G
atew
ay u
nder
lice
nce
gran
ted
by th
e Pu
blis
her (
date
d 20
09).

SAJBM.S NS Vol 3 (2000) No 1 261
government fann settlements had important goals among which were to depart from subsistence agriculture, and to make farming an attractive means of earning a living for able-bodied schoolleavers (Roider, 1971). The size ofland under the care of each settler varied from 4.9 to 5.7 hectares in the Eastern region of the country, and 8.1 to 10.1 hectares in the Western region (UN, FAO, 1966; Floyd and Adinde, 1967). To meet the goals, the authorities provided social facilities and offered comparatively high wages. What the authorities neglected, however, was the necessity of first considering properly local labour requirements before going into vast expenditures on housing and the social facilities for expected migrant labour. It turned out that because of the capitalintensive nature of the agricultural projects their capacity to create jobs was limited (Eicher et ai., 1970). In the Western Region, it was reported that by the end of 1966/67, a total cost of N12.8 million had been incurred. That was equivalent to about N8 000 per settler an amount that represented double of what was originally projected (Forest, 1980). UN, FAO (1966) estimated the cost per settler to be about NI0 000. Apart from the over expenditure caused by poor planning in the Western region, the oil plllm plantations and the settlement schemes encountered somewhat different problems in the Eastern Region. The participants lacked the right incentives, the main cause being their dissatisfaction with the commodity marketing boards taxes that would eventually affect their export receipts (Saylor, 1968).
irrigation schemes were also given priorities by the authorities in their drive to revive tbe deteriorated agriculture. The schemes were supposed to serve as sources of water supply to some of the farm settlements and plantations, particularly the ones located in the more arid areas in the Northern region. The irrigation projects turned out, later on, to be failures. The projects were a total of eight in number at the very beginning in the 1960s, with varying sizes of 20-1094 hectares. Yet by 1974, only about 5.5 percent of projected irrigable area had been developed (Agboola, 1979). The only success achieved was on rice, despite the initial plan that they should cover cotton and groundnuts areas, as well as wheat to substitute imports. Based on data from Forest (1980), the wheat produced on irrigated fann land was, by 1970, only about I percent of total wheat import into Nigeria. So when more money was allocated to irrigation projects in the 1970s, as a follow-up on the projects from the 1960s, some critics argued dmt the government's drive towards such projects was due to prestige considerations (Essang and Olayide, 1975). Others argued that it was a continuation of goyemment import substitution strategy (Forest, 1980), and that such projects had only succeeded mainly in massive appropriation of peasant lands but to very limited utilization of peasant labour (Collier, 1983: 210-11).
The Nigerian irrigation projects were capital intensive in nature, with development costs estimated to about N592 per hectare. One of the great
Rep
rodu
ced
by S
abin
et G
atew
ay u
nder
lice
nce
gran
ted
by th
e Pu
blis
her (
date
d 20
09).

262 SAmMS NS Vol 3 (2000) No 1
problems encountered with the projects. apart from the high development costs, was that it was not always clear what particular cropping patterns should be employed to realize yields high enough to cover the high costs (Agboola, 1979: NI93).
Obviously, the government had good intentions by embarking on the projects. Unfortunately, the projects mainly raised wages in the rural communities at the expense of agricultural production. The predominantly agricultural rural labour simply rushed to the government-directed projects in search of higher paid jobs, deserting their farms. It was a situation that could be characterized as a coexistence of labour shortages in the rural agriculture and a big pool of unemployed persons in search of higher paid jobs. The consequence was a decreased agricultural production, particularly since the government-directed projects never succeeded in producing enough to substitute the lost output of the rural agriculture that was exposed to uncompetitive high labour costs. According to Agboola (1979: 193), the estimated output of some of the export crops by the farm settlements and plantations, at their production peaks, as a percentage of total output of the respective export crops in the country, ran as follows: cocoa 1 percent, palm produce (palm oil and palm kernel) 3.5 percent, and rubber 5 percent. The government projects never paid off with the result that the authorities ran into difficulties of mobilizing revenues for maintenance. A positive achievement, however, was the use of fertilizers that became widespread among farmers when some of the projects were first introduced in the 1960s (Adegboye et aI., 1969).
CONCLUSION
No significant part of the expansion of output of cash crops during the transition period can be attributed to any revolutionary changes in production techniques. Mechanized farming did not exist in Nigeria during the period. Expansion of output was achieved because there existed surplus labour and land both of which could be mobilized without much risk of reductions in local levels of consumption of domestically produced output. Transportation systems were also improved. However, increases in labour and land alone cannot explain the output peaks attained during the 1950s and some part of the 1 960s. The agricultural sector experienced increases in productivity following the introduction of some technological packages by the authorities. Biological research processes had begun in the 1940s with their results being felt as from the 1950s. The technological packages were mainly in the form of insecticide and fungicide sprays, fertilizers, improved seedlings, extension services and infrastructural facilities. Remarkable though with the trend of development of Nigerian export agriculture was the fact that all the export crops flourished
Rep
rodu
ced
by S
abin
et G
atew
ay u
nder
lice
nce
gran
ted
by th
e Pu
blis
her (
date
d 20
09).
SAJEMS NS Vol 3 (2000) No 1 263
nearly during the same period and thereafter started to deteriorate and therefore marking the de-agriculturalisation period. An important.argument by this paper is that the foundation for de-agriculturalisation was actually laid during the 1950s and the 1960s, ev.en though the period also corresponded with the output peak phase. Not only were farmers heavily taxed by the government instituted commodity marketing boards during the period, but the government credit facilities were made very difficult to obtain, particularly for the grassroot farmers. In other words, the government credit policies were biased against the grassroot (peasant) farmers who were responsible for a greater part of the total agricultural production. Those who gained from the credit facilities were mainly government corporations and cooperatives, private companies, civil servants and army officers.
Rep
rodu
ced
by S
abin
et G
atew
ay u
nder
lice
nce
gran
ted
by th
e Pu
blis
her (
date
d 20
09).

Product (1000 IOns,
i i ~ .. 8 '" .. $ $ I
1912 :a I I ~ 191 .. IJQ
I: ;
1918 J. £ -1920
1922 0 I:
192.& .t; 1926 I: .... 1928 0
"'" 1930 n 0
1932 S 11134 = ..-.. -1936 \0 -1938 N
I
1940 -\0 1M2 00
V. '-'
19.&.&
19.&6
:- 19.&6 .. ~ 19S0
1962
1954
1956
1956
1960
1962
196.&
1966
1966
1970
1972
197.-
1976
1978
1980
1982
19M
V XIClN::iddV
Z ON (OOOZ) £ lOA SN SW3fVS t9Z
Rep
rodu
ced
by S
abin
et G
atew
ay u
nder
lice
nce
gran
ted
by th
e Pu
blis
her (
date
d 20
09).
Product (lOGO tons) ~ ... ...
g g <:> ... <:> g
1912 I • '!l'l 1914 riO = "I 1916
~
1918 N
1920
1922 0 = -"CI 1924
= -1926
C ... 1928
"= » 1930
1932 a 1934 0 = 1936 ,-. -1938 I.,Q
hi I 1940
I.,Q co 1942 VI '-' 1944
1946
~ 1941 . ~ 1950
1952
1964
1956
1968
1960
1962
1964
1_
1_
1970
1972
1974
1976
1978
1980
1982
1984
~9Z z; ON (OOOZ) E lOA SN swruvs
Rep
rodu
ced
by S
abin
et G
atew
ay u
nder
lice
nce
gran
ted
by th
e Pu
blis
her (
date
d 20
09).

266 SAmMS NS Vol 3 (2000) No 2
1Jt6~
~86~
8l6~
Sl6~
U6~
686~
996~
1:96~
096~
l.H~
ts6~
,..-... ..,.. ~S6~ 00 0'1 - :-
8t1H ~ I
~ SK~ 0'1 -'-' M~
~ c: .. 8C6~
~ 9£6~
e -; Ct6~
Ii\.o ... OU~ C> .. :s a8~
c. .. :s tl!6~
0 1.Z6~
f'I'l 8~6'
f :s S~6~ II!)
~ tun i ! iii 0
Rep
rodu
ced
by S
abin
et G
atew
ay u
nder
lice
nce
gran
ted
by th
e Pu
blis
her (
date
d 20
09).
SAmMS NS Vol 3 (2000) No 2 267
-~ ~86~
lI.l.6~
SL6~
ZJ.6~
696~
996~
£96~
0116~
LH~
ts8~
,-,. 1.1") 00 Cf\ ..-.
~S6~
i -~:.
C"I -Cf\ SK~ -'-' - l:"l ::I s:: -= 6t6~
s:: ::I 9tn co 10. 0 tt6~
.... co ot6~ -::I =.. LU~ -::I 0 n6~
~l:6~
..,. GI
8l6l 10. ::I ~
5~6~
~ n6~ 0
!! '" '" (iii
Rep
rodu
ced
by S
abin
et G
atew
ay u
nder
lice
nce
gran
ted
by th
e Pu
blis
her (
date
d 20
09).

268 SAJEMS NS Vol 3 (2000) No 2
t1I6~
~~
086~
8L&~
'L&~
tL&~
l:L&~
OL&~
-~ -~ t1I6~
l:8&~
086~
8S&~
8S&~
K&~
~&~
O!ltn ~
n&~ ! n&~
--. 00 ""~ 00 C'I l:t&~ .....
I N OK~ ..... C'I 8t&~ ..... '-' ....1 c = tE&~ -- mn = U on~ ... = Il:&~ -:I Il:U C. - n&~ :I 0 U&~
Ol:&~
III 8~~
Qj .. .~~
:I QI) t~~
fi: n&~ 0 0 • .. 0
Rep
rodu
ced
by S
abin
et G
atew
ay u
nder
lice
nce
gran
ted
by th
e Pu
blis
her (
date
d 20
09).
Product (1000 tons)
C> ;; ~ l!: ~ ! ! Cl CD C
1912
1914 ~ (JQ
= 1916 '"I t'I>
191. 0'1
1920
1922 0
1924 = ....
1926 'C
= .... 1926 C> 1930 ....
::0 1932
= =- 1934 =- t'I>
1936 '"I
- 1938 'J:J 1940 ......
IV 1942
I
'J:J 1944 00
Vt I_ '-'
t: 1948 I! ~ 19!1O
1952
1954
1966
1_
19110
1962
1964
1966
1968
1970
1972
1974
1975
1971
1980
1982
1984
69Z Z ON (OOOZ) £ lOA SN SWffi'VS
Rep
rodu
ced
by S
abin
et G
atew
ay u
nder
lice
nce
gran
ted
by th
e Pu
blis
her (
date
d 20
09).

270 SAJEMS NS Vol 3 (2000) No 2
REFERENCES
ADEGBOYE, R.O.; BASU, A.C. and OLATUNBOSUM, D. (1969) "Impact of We stem Nigerian Farm Settlements on Surrounding Farmers", Nigerian Journal of Economic and Social Studies, 11: 229-40.
2 AGBOOLA, S.A. (1979) An Agricultural Atlas of Nigeria. Oxford University Press, Oxford and London.
3 ANDRAE, G. and BECKMAN, B. (1987) Industry Goes Farming (The Nigerian Raw Material Crisis and the Case of Textiles and Cotton), Research Report No. 80, Scandinavian Institute of African Studies, Uppsala.
4 BERRY, S.S. (1970) "Cocoa and Economic Development in Western Nigeria", in Eicher, C.K. and Liedholm, C. (eds.) Growth and Development of the Nigerian Economy, Michigan State University Press, East Lansing, Michigan.
5 BERRY, S.S. (1975) Cocoa, Custom and Socio-Economic Change in Rural Western Nigeria, Clarendon Press, Oxford.
6 BLANCKENBURG, P. von (1971) "Rubber Farming in Benin Area: A Study of Some Socio-Economic Factors Influencing Rubber Production", Nigerian Institute of Social and Economic Research, lbadan. Mimeographed.
7 CARTER, N.G. (1963) "An Input-Output Analysis of the Nigerian Economy, 1950-1960", Working Paper. School of Industrial Management, MIT, Cambridge.
8 CHOYCE, M.A. (1968) "A Review of Cotton Development in Nigeria", SamaruAgricultural Newsletter, 10: 44-57.
9 COLLIER, P. (1983) "Oil and Inequality in Rural Nigeria", in Ghai, D. and Radwan, S. (eds.) Agrarian Policies and Rural Poverty in Africa. International Labour Office, Geneva.
10 EICHER, C.K. (1970) "The Dynamics of Long-Term Agricultural Development in Nigeria", in Eicher, C.K. and Liedholm, C. (eds.) Growth and Development of the Nigerian Economy, Michigan State University Press, East Lansing, Michigan.
11 EICHER, C.K., ZALLA, T., KOCHER, J. and WINCH, F. (1970) Employment Generation in African Agriculture. Michigan State University Press, East Lansing, Michigan.
12 ESSANG, S.M. and OLAYIDE, S.O. (1975) "Pattern of Estimated Agricultural Expenditures in the 1975-80 Nigerian Plan: Some Implication", The Nigerian Journal of Economic and Social Studies, 17 (3): 245-61.
13 FLOYD, B. and ADINDE, A. (1967) "Farm Settlements in Eastern Nigeria: A Geographical Appraisal", Economic Geography, 43: 189-230.
Rep
rodu
ced
by S
abin
et G
atew
ay u
nder
lice
nce
gran
ted
by th
e Pu
blis
her (
date
d 20
09).

SAJEMS NS Vol 3 (2000) No 2 271
14 FOREST, T.G. (1980) "Agricultural Policies in Nigeria, 1900-1978", in . Heyer, J., Roberts, P. and Williams, G. (eds.) Rural Development in
Tropical Africa. Macmillan, London. 15 FOREST, T.G. (1982) "Recent Development in Nigerian
Industrialization", in Fransman, M. (ed.) Industry and Accumulation in Africa, Heinemann, London.
16 GALLETTI, R., BALDWIN, K.D.S. and DINA, 1.0. (1956) Nigerian Cocoa Farmers, Oxford University Press, London.
17 HELLEINER, G.K. (1966) Peasant Agriculture, Government, and Economic Growth in Nigeri, Richard D. Irwin Inc., Homewood, Illinois.
18 HOGENDORN, J.S. (1970) "The Origins of the Groundnut Trade in Northern Nigeria", in Eicher, C.K. and Liedholm, C. (eds.) Growth and Development of the Nigerian Economy, Michigan State University Press, East Lansing, Michigan.
19 HOGENDORN, J.S. (1978) Nigerian Groundnuts Exports: Origins and Early Developments, Ahmadu Bello University Press and Ox.ford University Press, Zaria and Ibadan.
20 JUST, R.E. (1975) "Risk Response Models and their Use in Agricultural Policy Evaluation", American Journal of Agricultural Economics, 57: 836-43.
21 KIRK-GREEN, A. and RIMMER, D. (1981) Nigeria Since 1970: A Political and Economic Outline, Hodder and Sloughton, London.
22 LEWIS, W.A. (1967) Reflections on Nigeria's Economic Growth. Development Centre, OECD, Paris.
23 LUNING, H.A. (1963) An Agro-Economic Survey in Katsina Province. Government Printer, Kaduna.
24 MYINT, H. (1959) ''The Classical Theory of International Trade and the Underdeveloped Countries", Economic Journal. 68: 17-337.
25 OKOWA, W.J. (I982) The Distributional Impact of Public Policy in Nigeria:A Dualistic Approach, Unpublished Ph.D. Thesis, Uppsala University, Uppsala.
26 OLOKO, O. (1963) A Study of Socio-Economic Factors Affecting Agricultural Productivity in Annang Province, Eastern Nigeria, Nigerian Institute of Social and Economic Research, Ibadan.
27 OLUW ASANMI, H.A. (1966) Agriculture and Nigerian Economic Development. Oxford University Press, London.
28 OYEJIDE, T.A. (1986) The Effects of Trade and Exchange Rate Policies on Agriculture in Nigeria. Research Report 55, International Food Policy Research Institute.
29 PURVIS, MJ. (1970) "New Sources of Growth in a Stagnant Smallholder Economy in Nigeria: The Oil Palm Rehabilitation Scheme", in Eicher, C.K. and C. Liedholm (eds.) Growth and Development of the Nigerian Economy, Michigan State University Press, East Lansing, Michigan.
Rep
rodu
ced
by S
abin
et G
atew
ay u
nder
lice
nce
gran
ted
by th
e Pu
blis
her (
date
d 20
09).

272 SAJEMS NS Vol 3 (2000) No 2
30 ROIDER, W. (1971) Farm Senlementsjor Socio-Economic Development: The Western Nigerian Case, Weltforum Verlag, Munchen.
31 SAYLOR, RG. (1968) A Study ofObstac/es to Investment in Oil Palm and Rubber Plantations. Nigerian Institute of Social and Economic Research, Ibadan.
32 SPIO, K. and GROENEWALD, J.A. (1997) "Rural Financial Markets: An Overview", Agrekon. 36 (2): 121-38.
33 TEAL, F. (1983) "The Supply of Agricultural Output in Nigeria. 1950-1974", Journal of Development Studies. 19: 191-206.
34 UN, FAO (1966) Agricultural Development in Nigeria, ]965-]980, Rome.
35 UN, F AO, Annual Production Statistics (various issues). 36 ZEVEN, A.C. (1965) "Oil Palm Groves in Southern Nigeria: Part 1,
Types of Groves in Existence", Journal of Nigerian Institute of Palm Oil Research, 4 (1): 43-54.
Offidal Nigerian Publications Annual Reports of the Commodity Marketing Boards (various issues). Central Bank of Nigeria (CBN), Annual Report and Statement of Accounts (various issues). CBN, Economic and Financial Review (various issues). Federal Office of Statistics (FOS), Review of External Trade, Lagos (various issues). FOS, Trade Reports, Lagos, 1964. FOS, Annual Abstract of Statistics, Lagos (various issues). FOS, National Accounts of Nigeria, Lagos (various issues). The Nigeria Trade Journal, vol. 22, No.1, 1975. Western Region Ministry of Agriculture, Ibadan, 1954, 1955.
Rep
rodu
ced
by S
abin
et G
atew
ay u
nder
lice
nce
gran
ted
by th
e Pu
blis
her (
date
d 20
09).