Embed Size (px)
Citation preview

A Classroom Research Study: Examining Relationships Between Feedback,
Performance, and Self-Efficacy in a First-Year Mathematics Course
Christine Marie Krbavac B.A., Simon Fraser University, 1992
THESIS SUBMITTED IN PARTIAL FULFILLMENT OF THE REQUIREMENTS FOR THE DEGREE OF
MASTER OF ARTS
In the Faculty of Education
Curriculum and Instruction, Education and Technology
O Christine Marie Krbavac 2006
SIMON FRASER UNIVERSITY
Fall 2006
All rights reserved. This work may not be reproduced in whole or in part, by photocopy or other means, without permission of the author.

APPROVAL
NAME
DEGREE
TITLE
(Christine) Marie Krbavac
Master of Arts
A Classroom Research Study: Examining Relationships Between Feedback, Performance, and Self-Efficacy in a First-Year Mathematics Course
EXAMINING COMMITTEE:
Chair Michelle Nilson
---- ----- Cheryl Amundsen, Associate Professor Senior Supervisor
-- ---- - Philip Winne, Professor Member
-- --- -- Veselin Jungic, Lecturer, Department of Mathematics Member
-------- --- Dr. John Nesbit, Assistant Professor, Faculty of Education, SFU Examiner
Date December 1, 2006

SIMON FRASER UNIVERSITY~ i bra ry
DECLARATION OF PARTIAL COPYRIGHT LICENCE
The author, whose copyright is declared on the title page of this work, has granted to Simon Fraser University the right to lend this thesis, project or extended essay to users of the Simon Fraser University Library, and to make partial or single copies only for such users or in response to a request from the library of any other university, or other educational institution, on its own behalf or for one of its users.
The author has further granted permission to Simon Fraser University to keep or make a digital copy for use in its circulating collection (currently available to the public at the "Institutional Repository" link of the SFU Library website <www.lib.sfu.ca> at: <http:llir.lib.sfu.calhandlell8921112>) and, without changing the content, to translate the thesislproject or extended essays, if technically possible, to any medium or format for the purpose of preservation of the digital work.
The author has further agreed that permission for multiple copying of this work for scholarly purposes may be granted by either the author or the Dean of Graduate Studies.
It is understood that copying or publication of this work for financial gain shall not be allowed without the author's written permission.
Permission for public performance, or limited permission for private scholarly use, of any multimedia materials forming part of this work, may have been granted by the author. This information may be found on the separately catalogued multimedia material and in the signed Partial Copyright Licence.
The original Partial Copyright Licence attesting to these terms, and signed by this author, may be found in the original bound copy of this work, retained in the Simon Fraser University Archive.
Simon Fraser University Library Burnaby, BC, Canada
Revised: Fall 2006

SIMON FRASER UNIVERSII"YII
STATEMENT OF ETHICS APPROVAL
The author, whose name appears on the title page of this work, has obtained, for the research described in this work, either:
(a) Human research ethics approval from the Simon Fraser University Office of Research Ethics,
(b) Advance approval of the animal care protocol from the University Animal Care Committee of Simon Fraser University;
or has conducted the research
(c) as a co-investigator, in a research project approved in advance,
(d) as a member of a course approved in advance for minimal risk human research, by the Office of Research Ethics.
A copy of the approval letter has been filed at the Theses Office of the University Library at the time of submission of this thesis or project.
The original application for approval and letter of approval are filed with the relevant offices, Inquiries may be directed to those authorities.
Bennett Library Simon Fraser University
Burnaby, BC, Canada
Last revision: Summer 2006

ABSTRACT
Many instructors, on their own or with the help of,faculty developers, have made
changes to the instructional design of their courses and have wondered about the impact
of the changes on student learning. After completing the Rethinking Teaching Workshop
(RTW) offered at Simon Fraser University (SFU), one mathematics instructor decided to
formally evaluate particular aspects of changes made to the instructional design of his
course. This study describes the process used to formulate the research questions and
evaluate the impact of the instructional changes. The research questions focus on the
instructor's objectives for making the changes, namely to provide additional feedback
(using an on-line tool called LON-CAPA) to the 400 students in his course in an effort to
improve student achievement and mathematics self-efficacy. The results indicate that
there was an improvement in student achievement and mathematics self-efficacy between
the beginning and the end of the course.
Keywords
Instructional design, mathematics education, self-efficacy, achievement, scholarship of
teaching and learning

EXECUTIVE SUMMARY
The Department of Mathematics at Simon Fraser University (SFU) believes that
student-instructor contact plays a key role in helping students to succeed in mathematics.
Recently drop-in hours for the Applied Calculus labs were reduced, which decreased the
number of contact hours between students and the course instructorlteaching assistants.
Looking for ways to increase the amount of feedback provided to students, one Calculus
instructor, Dr. Jungic, attended the Rethinking Teaching Workshop (RTW). Subsequent
to learning more about the benefits of feedback and how to include feedback in his course
design, Dr. Jungic decided to make changes to his instructional strategy by incorporating
an on-line tool called LON-CAPA that would provide students with immediate multiple-
try feedback.
After making the changes, Dr. Jungic approached me and another researcher for
help with assessing the impact of the course design changes he made on student learning.
Specifically, Dr. Jungic wanted to know if increasing the amount of feedback would
increase student's "self-confidence" and achievement in his Calculus course. Upon
consulting the literature, I quickly learned that the term self-confidence is rarely used in
the literature, and that Bandura's (Bandura, 1997) term "self-efficacy" matched Dr.
Jungic's definition of self-confidence. After confirming this with Dr. Jungic, I returned to
the literature and investigated the relationships between feedback and performance,
performance and self-efficacy, and feedback and self-efficacy. Out of interest, I also

investigated the role of gender in each of these relationships. In addition, changes to the
instructional strategy were documented through interviews with Dr. Jungic.
The results indicated that feedback may have helped to improve performance.
Between 2002 and 2004 percentage of A's and B's increased and the percentage of F's
and N's decreased. There was also an increase in grades between the first and second
midterms for students in the bottom one-third of the class. In addition, students in the
bottom one-third of the class had a larger decrease in grades on the final exam than
students in the other two groups.
The second research area investigated the relationship between performance and
mathematics self-efficacy. These results indicated that there was a statistically significant
increase in mathematics self-efficacy (MSE) scores from the beginning of the semester to
the end of the semester, MSE scores at the beginning of the semester are correlated with
scores at the end of the semester, and students' self-efficacy scores for topics covered
throughout the semester were similar at the beginning of the semester and at the end of
the semester. No correlation was found between MSE scores at the beginning of the
semester and performance on the first midterm. At the end of the course, however,
students' mathematics performance was strongly correlated with their self-efficacy about
specific topics covered in the class.
The relationship between feedback and mathematics self-efficacy was the third
relationship examined. These results indicated that student's mathematics self-efficacy
improved significantly between the beginning and the end of the semester. As there is an
indication that overall performance in this class was higher than in the previous class, it is
possible that student's mathematics self-efficacy improved as a result of feedback.

Finally, the analysis of the relationship between gender and performance indicates
that there were no differences in mathematics self-efficacy for males and females. There
were also no differences on the final exam scores of males and females.
After completing the analyses described above, I asked Dr. Jungic to review and
comment on the findings. Upon reviewing the results, Dr. Jungic stated that he believes
the results of this study justify the effort required to create and manage the on-line
assignments, and that he felt that the whole process was a very positive experience, and
would like to ask the same research questions in a new class. Subsequently, in the 2006
fall semester he used a similar approach that included multiple weekly on-line
assignments using LON-CAPA and a weekly paper assignment for teaching a different
class (August 2006).
Classroom research studies can provide faculty with valuable knowledge about
the nature of student learning. At the heart of research about teaching and learning is
developing an understanding about how learning occurs. This activity can be simple,
involving asking students if they understand what is being taught. Or, it can be very
involved, with instructors studying new literature, interacting with new colleagues, and
exploring new methods of inquiry (Huber, 2004).
The data gathering for the study discussed in this paper took 4 months, a long
time in the research world. However, in educational terms, it constitutes only I semester
and 1 course. Studies like this one are necessary to help faculty understand the impact of
the instructional strategies they use.
DEDICATION
To my dad, Ivan, who has always encouraged me to follow my dreams and get a
good education.
To my mom, Elma, whose constant cheering would fill a stadium.
To my husband, William, whose patience and understanding mean more than I
can ever put into words.
None of this would
be possible without your love and support
vii
ACKNOWLEDGMENTS
I would like to thank my supervisory committee for the support they provided me
throughout my thesis. I would like to specifically express my appreciation to Dr. Cheryl
Amundsen, my senior supervisor, for her mentorship, encouragement, and patience
throughout my degree.
I would like to thank Amrit Mundy and Mary Wilson, friends and members of Dr.
Amundsen's research group, for always being willing to listen, support, and encourage.
I would also like to thank Liny Chan from Analytical Studies and Ray Batchelor
from Chemistry for providing me with data used in this study.
viii

TABLE OF CONTENTS
. . Approval ............................................................................................................................ II
... Abstract ............................................................................................................................. 111
Executive Summary ......................................................................................................... iv . .
Dedication ........................................................................................................................ vn ...
Acknowledgments ......................................................................................................... VIII
Table of Contents ............................................................................................................ ix
List of Figures ................................................................................................................... xi . .
List of Tables ................................................................................................................... XII
Introduction ....................................................................................................................... 1 ..................................................................................................................... Background 2
The Rethinking Teaching Workshop (RTW) .............................................................. 2 Dr . Jungic's Redesigned Calculus Course ................................................................... 3
Overview of the Relevant Literature ............................................................................... 5 Feedback and Performance .......................................................................................... 8
.................................................................................. Self-Efficacy and Performance 15 ....................................................................................... Feedback and Self-Efficacy 21
Gender and FeedbacMPerformance/Mathematics Self-Efficacy ........................... 23 The Question of Technology Use .............................................................................. 23
................................................................................................ The Research Questions 24
..................................................................... Design of the Classroom Research Study 26 . Dr Jungic's Students ..................................................................................................... 27
Instruments .................................................................................................................... 28 ........................................................................................ Mathematics Self-Efficacy 28
........................................................................................................... Student Grades 32 .................................................................................... Computer User Self-Efficacy 32
....................................................................................................................... Procedure 33 . . . Limitations.. ............................................................................................................... 35
.............................................................................................................................. Results 37 Treatment of Missing Data ............................................................................................ 37
Paper Submission Group ........................................................................................... 37 On-line Submission Group ........................................................................................ 39
Research Question #1 .................................................................................................... 40 .................................................................................................... Research Question #2 51

..................................................... Mathematics Self-Efficacy Questionnaire (MSE) 52 Mathematics Self-Efficacy Questionnaire (MSE) and Performance ......................... 55
............................................... On-line Assignment Marks and Self-Efficacy Scores 57 Research Question #3 .................................................................................................... 58 Research Question #4 .................................................................................................... 59
Discussion ....................................................................................................................... 62 Research Question #1 .................................................................................................... 63 Research Question #2 .................................................................................................... 65 Research Question #3 .................................................................................................... 66
.................................................................................................... Research Question #4 67 ................................................................................................ Dr . Jungic' s Reflections 68
Thoughts about the Results ........................................................................................ 68 Thoughts about the Process of this Study .................................................................. 68 Instructional Design Changes .................................................................................... 69 . . .
Limitations ..................................................................................................................... 70
Future Research .............................................................................................................. 72
...................................................................................................................... Conclusions 74
Appendices ....................................................................................................................... 77 Appendix A: Instructor Consent Letter ......................................................................... 77 Appendix B: Mathematics Self-Efficacy Questionnaire ............................................... 78
................................. Appendix C: Mathematics Self-Efficacy Practice Questionnaire 80 .................................................. Appendix D: Computer User Self-Efficacy Approval 81
Appendix E: Student Information Letter ....................................................................... 82 Appendix F: Informed Consent By Participants in a Research Study .......................... 83
Reference List .................................................................................................................. 85

LIST OF FIGURES
...................................................................................................... Figure 1 : Relationships 7
........................................................................... Figure 2: Midterm 1 grade distribution 42
........................................................................... Figure 3: Midterm 2 grade distribution 43
............................................................ Figure 4: On-Line assignment grade distribution 44
Figure 5: Written assignment grade distribution ............................................................. 45
Figure 6: Final exam grade distribution ........................................................................... 46

LIST OF TABLES
....................................... Table 1 : Sample Assignment Self-Efficacy Question Format 29
.................................................... Table 2: Paper Submission Group Completion Rates 38
Table 3: Questionnaires Completed by On-Line Participants ........................................ 39
........................................................................................ Table 4: Student Performance 41
Table 5: Exam score correlations ................................................................................... 47
Table 6: Performance by 3rds on exams ........................................................................ 48
.................................. Table 7: Paired-sample t-test examining exam score differences 50
Table 8: Beginning of semester MSE correlations ......................................................... 54
................................................................... Table 9: End of semester MSE correlations 55
......................................................................... Table 10: First midterm scores and MSE 56
............................................. Table 1 1 : On-line Assignment Self-Efficacy Mean Scores 58
........................ Table 12: Gender and Mathematics Self-Efficacy Questionnaire Scores 60
Table 13: T-Test with Gender and Mathematics Self-Efficacy Questionnaire Scores ............................................................................................................... 60
.................................................................................. Table 14: Gender and Performance 61
....................................................................... Table 1 5: Gender and Performance T-test 61
xii

INTRODUCTION
Can you imagine teaching calculus to more than 400 first year students? Realize
that most of these students are in the course not because of a love of calculus or of math,
but because it is a pre-requisite for entry into a highly competitive Business degree
program. What methods would you use to give individualized feedback to each student?
Throughout the history of the Department of Mathematics at Simon Fraser University
(SFU), several different approaches aimed at reducing the failure rate and increasing
student retention in this course have been tried. At the center of these initiatives is the
belief that student-instructor contact plays a key role in helping students to succeed in
mathematics. Over the years, this Department has used different approaches such as small
group tutorials and open drop-in labs to maximize the amount of feedback provided to
students through student-instructor contact. About 10 years ago, after funding cutbacks,
the Department switched from tutorials to a drop-in Calculus Workshop, Algebra
Workshop, and Applied Calculus Workshop to support different courses, as they believed
that these labs would provide a better student-instructorlteaching assistant ratio than the
old tutorial structure. The workshop is open several hours each weekday, and is a place
where students can get help from fellow students, teaching assistants, and the instructor.
The workshop is also the place where students hand-in and pick-up written assignments.
Recently the workshop hours have been reduced, which further decreases the number of
contact hours between students and the course instructorlteaching assistants.

One Calculus instructor, Dr. Jungic, attended the Rethinking Teaching Workshop
(RTW) at SFU with the primary objective of revising his course design so that students
could continue to receive the support and feedback that he believes is necessary to help
them learn mathematics. After learning more about the benefits of feedback and how to
incorporate feedback into his course design, Dr. Jungic began wondering about how to
assess the impact of the course design changes he made on student learning. This paper
describes the research undertaken to evaluate the changes Dr. Jungic made to his course
design.
Background
The Rethinking Teaching Workshop (RTW)
The Rethinking Teaching Workshop (RTW) is a 30-hour workshop usually
offered over a five-day period. It has been offered to professors for over ten years at
McGill University and more recently has become an annual offering at Simon Fraser
University and Concordia University (see Saroyan & Amundsen, 2004 for a detailed
description of all aspects of the workshop). Theory and practice are combined as
participant professors design (or redesign) one of their courses. At the end of the
workshop, a course outline, assessment plan, and an action plan for the implementation of
the new course design is developed by all participants. These elements support the
primary focus of the RTW, which encourages participants to link teaching actions
directly to student learning by incorporating a "reasoned and intentional approach to
teaching.. .informed by reflective practice and peer critique" (Amundsen, Weston, &
McAlpine, 2005).

The RTW strongly values the importance of merging generic teaching knowledge
with subject-matter knowledge. By drawing upon each person's subject-matter
understanding, the RTW designers believe that it helps participants to view "student
learning as an ongoing process of developing an understanding in the discipline rather
than as mastering a sequence of topics within a particular course" (Amundsen et al.,
2005). Upon completion of the workshop many participants participate in follow-up
groups and classroom-based research where they can explore teaching and learning topics
of interest to them. This analysis of teaching, in both formal and informal ways, is an
intellectual exercise akin to what many professors do as scholars (Kreber, 2001 ;
Shulman, 2000).
Dr. Jungic's Redesigned Calculus Course
At the time of the research study, Dr. Jungic had been a Lecturer in the
Department of Mathematics at Simon Fraser University for three years. He had taught
lower division courses including Calculus for the Social Sciences I, Calculus I, Calculus
11, Calculus 111, Elementary Linear Algebra, and Discrete Mathematics 11. It was his
second time teaching Calculus for the Social Sciences I (Math 157), the class used in this
study (September 2004).
As mentioned above, Dr. Jungic decided to make changes to this Calculus class
because he had become increasingly concerned about student learning after fiscal
pressures had decreased the amount of feedback students were given. To address his
concern, Dr. Jungic redesigned his course. Changes to the grading scheme and additional
assignments were part of incorporating a web-based tool called Learningonline Network
with Computer Assisted Personalized Approach (LON-CAPA) to provide students with
3

feedback on assignments (September 2004). This tool immediately informs students
whether they have correctly answered a question, and gives them up to eight chances
(without penalty) to correctly answer the question. In addition, LON-CAPA also has a
discussion forum where students can ask each other questions about the current
assignment. According to Dr. Jungic, hundreds of messages were posted by students, and
they were read thousands of times. The questions posted allowed him to gain a better
understanding of problem areas, as well as provide additional guidance by responding to
questions posted in the discussion forum (May 2005).
Before Dr. Jungic redesigned his course, students completed a final exam (50%),
two midterm exams (20% each), and weekly assignments (10%). Students were able to
receive help from teaching assistants by going to the Applied Calculus workshop and
from Dr. Jungic via email and during office hours. The typical format for grading the
weekly assignments involved randomly selecting and then marking only one or two
questions per assignment, with part marks given just for handing assignments in. Students
could access course notes on-line through a course management system called WebCT
(September 2004).
With the new course design, there were some changes to the assessment scheme.
The final exam remained the same (50%), as did the second midterm (20%). The value of
the first midterm was reduced to 15% and the weekly paper assignments were reduced to
7%. This allowed for the addition of on-line assignments submitted using LON-CAPA
three times a week (8%). As before, students were able to receive help from the Applied
Calculus Workshop and from Dr. Jungic via email and his office hours, and course notes

continued to be available in WebCT. Details about the redesign of Dr. Jungic's course
were provided during an interview (September 2004).
Dr. Jungic chose to continue requiring written assignments as well as assignments
submitted on-line because he believes that you have to "do" math in order to learn it;
"mathematics must be done on paper to be understood and to be done properly"
(September 2004). The on-line assignments were incorporated because Dr. Jungic
(September 2004) believes that immediate and frequent individualized feedback can be
beneficial to learning, increase student confidence, and increase performance in
mathematics.
Dr. Jungic was interested in investigating the changes he had made to his course.
Specifically, he wanted to know if there would be a relationship between the changes he
had made to increase feedback, and student self-confidence and performance in
mathematics. He met with one of the RTW instructors, my supervisor Dr. Cheryl
Amundsen, and me to outline his ideas. Our questions queried exactly what he meant by
"self-confidence" and in what ways he expected to see changes in achievement. After our
discussion, it was apparent that he wanted students to believe in themselves and their
mathematics abilities, and that he believed improving these beliefs would lead to better
grades. After our meeting, I went off to explore the literature to see if I could support Dr.
Jungic in more clearly defining the research questions.
Overview of the Relevant Literature
I began my literature review by searching on-line library databases for the term
"self-confidence." After some searching, I found that the tern "self-confidence" is rarely
used in the literature but more specific terms such as self-concept, self-esteem, and self-
5

efficacy are used. Bandura (1 997) refers to self-concept as an overall view of oneself that
is thought to be formed or adopted through direct experience and/or evaluations from
others, and self-esteem as a person's self-worth. Self-efficacy, as defined by Bandura
(1 997), is the belief "in one's capabilities to organize and execute the courses of action
required to produce given attainments." (Bandura, 1997). It was this definition of self-
efficacy that seemed to most closely describe Dr. Jungic's description of "self-
confidence."
At a subsequent meeting, I described Bandura's concept of self-efficacy to Dr.
Jungic and he agreed that this matched what he meant. Furthermore, I told Dr. Jungic that
Bandura related performance to self-efficacy, and Bandura argued that in order to change
self-efficacy, people must have the ability (or knowledge) to make accurate assessments
of their performance. Dr. Jungic agreed that this seemed to describe the feedback,
performance, and self-efficacy link that he believed to be the case.
With this information, I began to research the relationships depicted in Figure 1,
returning to the on-line library databases and searching the following databases: ERIC,
IEEEIIEEE Electronic Library (IEEE Xplore), Science Indexes, and PsycInfo. In each
database, and for each of the relationships, I began my search using the relationship terms
plus mathematics and higher education. For example, when searching for articles related
to feedback and performance, my keywords (or search criteria) were feedback,
performance, mathematics, and higher education. For most of the relationships, my
search criteria were too specific and yielded few results. As a result, in all cases, my
search criteria were broadened by including only mathematics or higher education in the
search criteria. Accordingly, there were two searches done for each relationship. The first

search included the relationship keywords and mathematics, and the second included
relationship keywords and higher education.
The solid lines in Figure 1 indicate areas where I found several studies that met
my search criteria; dotted lines indicate areas where only a few studies that met my
search criteria were found. An additional variable has been added to Figure 1, gender.
This relationship was a secondary variable that I investigated out of interest, and was not
of direct interest to Dr. Jungic. As gender was not a primary area of research in my study,
I did not do any additional searches related to gender in mathematics, and refer to studies
related to my three major relationships that also discuss gender. The literature relevant to
each of these relationships is addressed in the following sections.
Instructional Strategy
/ Feedback Performance \
Gender Figure 1: Relationships

Feedback and Performance
The use of the on-line LON-CAPA tool in Dr. Jungic's revised course design
provides students with immediate rightlwrong feedback and allows students eight
chances to correctly answer the question before a grade is submitted. Dr. Jungic's
prediction that this type of feedback will increase performance is supported in the
literature described below.
In 1984, Bloom reported on seminal studies investigating the relationship between
the amount of feedback provided during instruction and student achievement. The
students in these studies were taking classes in either cartography or probability, and
were in grades 4, 5, or 8. The classes had approximately 30 students in them. The results
of these studies indicate that students who receive feedback during instruction perform
better than students who did not receive any feedback. Specifically, Bloom reported that
the average student who received formative assessment followed by corrective
procedures (referred to as mastery learning instruction) during instruction performed 1
standard deviation higher (84%) than students who did not receive any feedback (referred
to as conventional instruction). In addition, Bloom also found that the average student
who received personalized feedback along with formative assessment followed by
corrective procedures (referred to as tutoring) on average performed 2 standard
deviations (98% higher) than students who received no feedback. These results also
indicate that for the 20% of students at the top of the class in conventional instruction,
tutoring did not help them to perform better. According to Bloom, these results were
expected because the grades of students at the top of the class do not have as much room
for improvement as other students.
Since 1984, there have been many other studies examining the relationships
between feedback and performance, and the definition of types of feedback has been
modified. In a review of other studies, Clariana (1 993) defines several types of feedback:
knowledge response which states whether the answer is "right" or "wrong"; knowledge
of correct response which states the correct answer; elaborative feedback which is similar
to knowledge of correct response but gives more information and possibly hints; and,
finally, multiple try feedback which is knowledge response with additional tries for
answering the same question. The type of feedback made possible through the use of
LON-CAPA in this study is, according to this classification, multiple-try feedback
because students are given eight tries to correctly answer each assignment question.
Of particular interest to this review are studies that have a similar form of
feedback to LON-CAPA. Specifically, I focused on those that compared performance in
settings where there was no feedback or delayed feedback versus immediate multiple-try
feedback. I believe these studies to be appropriate comparisons because before Dr.
Jungic's Calculus class was changed to incorporate an on-line tool to give feedback,
students would have to obtain correct answers for assignment questions on their own
(similar to no feedback), or wait for assignments to be marked (similar to delayed
feedback). In addition, multiple-try feedback with additional tries (but no extra help) for
answering the same question was provided to students using LON-CAPA in this study.
Clariana (1 993) summarized studies comparing multiple-try feedback with no
feedback as well as studies comparing multiple-try feedback with delayed feedback.
There were 12 studies that compared multiple-try feedback with no feedback. These
studies had sample sizes ranging from 28 to 460, had participants at different levels

(including elementary, high school, and post secondary students, and people in the work
force), and were on a wide range of subjects including electronics, flight safety,
education, and biology. All 12 studies reported that students who received multiple-try
feedback where they were told the answer was right or wrong performed better than
students who received no feedback during instruction.
The results of studies reported by Clariana (1 993) comparing immediate multiple-
try feedback with feedback that is given after a delay, on the other hand, were mixed. Out
of 4 studies, 2 reported that student performance was higher with multiple-try feedback
than with delayed feedback, and two reported that student performance was higher with
delayed feedback than with multiple-try feedback. Possible explanations for these
differences are not discussed. Unfortunately, in the review Clariana does not discuss
(possibly because the information was not reported in the studies) the impact of these
different types of feedback on students with different achievement levels at the start of
the instruction or whether students were being assessed on tasks requiring memorization
or more complex learning processes. Perhaps this information would have provided some
clues about reasons for different results in these studies.
In addition to the foundational work of Bloom (1984) and Clariana's summaries
(1 993) discussed above, I found three higher education studies (two in courses with
mathematics-related content and one in psychology) that discuss performance
improvements that occurred after an on-line tool that provided students with multiple-try
feedback was used as part of the instructional method. In the first mathematics-related
study described by Siew (2003), an on-line tool called AIM was used to provide students
with immediate multiple-try feedback. This tool is similar to LON-CAPA because it also

provides students with rightlwrong feedback and multiple tries to answer the same
question.
In Siew's (2003) study, 150 students taking a first year linear algebra course used
AIM to complete practice questions (not included in the final grade calculation) and
quizzes. When completing quizzes, students could re-submit answers to questions after
one or more attempts. In this study, a 15% penalty for the question was incurred each
time a solution was re-submitted. Siew and the course instructor believe that this
approach is similar to part-marks that may be given when answers are written out and
submitted on paper because it is "an automatic way of assigning part-marks to a student
who initially did not quite grasp a concept required" (Siew, 2003 p. 46) Student grades
were higher at the end of this semester than they were in the two previous offerings of
this course. In particular, the number of students with less than 50% in the course
decreased from 15 and 17 in 1999 and 2000 to 0 in 200 1, and the number of students with
80% or more increased to 21 in 2001 from 10 in 1999 and 0 in 2000.
The second study with mathematics-related content involved students studying
Calculus in an introductory Physics course. This study is described in three separate
papers, Kashy, Thoennessen, Tsai, Davis, and Wolfe (1998), Kashy, Thoennessen, Tsai,
Davis, and Albertelli (2000), and D. Kashy, Albertelli, E. Kashy, and Thoennessen
(2001). This study incorporated the same on-line tool (LON-CAPA) as Dr. Jungic used to
provide students with immediate multiple-try feedback. As Dr. Jungic had, the
instructors/researchers further modified the instructional design when they added LON-
CAPA. Previously, there were four lectures and one optional-attendance tutorial each
week (led by the instructor or a teaching assistant) with partially-marked assignments that

were usually returned to students the following week. The revised instructional approach
continued to have three lectures, added access to the on-line tool, eliminated the tutorials,
and added a Physics Learning Center (staffed by faculty, graduate students, and honors
undergraduate students) where students could go to receive help (E. Kashy et al., 2000).
When using the on-line tool, students were allowed to attempt to correctly answer an
assignment question 20 times without penalty. In addition, as in Dr. Jungic's course,
students could participate in an on-line discussion forum that is part of this tool to get
help from other students (D. A. Kashy et al., 2001).
Kashy, Thoennessen, et al. (D. A. Kashy et al., 2001; E. Kashy et al., 2000) report
that after making changes to the instructional design, the percentage of students receiving
grades between 2.5 - 4.0 remained the same the first year LON-CAPA was introduced
(59% in 1992-1 994 and 58% in 1995) and then increased to 74% in 1996 and 78% in
1997. This trend of improved performance continued in 1999 and 2000, where the
percentage of students receiving a grade between 3.5 and 4.0 increased from 20% in
1992-1994 to 32% in 1999 and 36% in 2000 (D. A. Kashy et al., 2001). There was also a
reported decrease in the drop rate from 6.7% in 1995 to 3.2% in 1997 (E. Kashy et al.,
2000). In addition, the grade distribution changed from the traditional bell-curve and was
more evenly distributed (D. A. Kashy et al., 2001; E. Kashy et al., 1998; E. Kashy et al.,
2000) after the implementation of LON-CAPA.
Kashy et a1 (D. A. Kashy et al., 2001) further analyzed the performance data by
looking at how well students performed on solving numerical problems and how well
they understood the underlying conceptual material. In particular, they were "interested
in determining whether [their] students were learning at a level above a purely

algorithmic 'plug-and-chug' (i.e., finding a formula to plug in variables and grinding out
the answer) approach" (D. A. Kashy et al., 2001). Their results found that students who
performed well solving numerical problems also performed well on problems requiring
an understanding of the conceptual material (r = .72, p < .001 in 2000). However, as this
analysis was only done after LON-CAPA was added to the instructional strategy, it is not
possible to determine whether this relationship existed before, and whether performance
in one of the areas increased more than the other. On the other hand, it is implied that
scores in both areas improved because the exam was similar to previous years and overall
performance improved.
In the third study related to feedback and performance, Buchanan (2000) reported
on two studies that used an on-line tool (PsyCAL) to provide multiple-try plus
elaboration feedback to students in a Psychology class. According to Buchanan's
description of PsyCAL, it is similar to LON-CAPA as it provided students with
immediate, multiple-try feedback and allowed students unlimited attempts to answer a
question. One additional feature of PsyCAL is instead of simply providing rightlwrong
feedback, references to the corresponding course material were provided when incorrect
answers were submitted (referred to as elaborated feedback). PsyCAL was used to
provide students with the same type of feedback in both studies.
The results of the Buchanan (2000) study were similar to the two studies
mentioned above. In the first study the use of PsyCAL was optional, and participants
were 148 students taking a first year psychology course. These students used PsyCAL to
complete three assignments, two revision exercises, and a final exam at the end of the
semester. The assignment questions mainly assessed factual knowledge covered in the

module. The results of this study found that the more students used PsyCAL, the better
they performed on the final exam (r(1~~)=.24, p<0.003). In addition, the average final
exam score for students who used PsyCAL was almost 10% higher than students who did
not use PsyCAL. Nevertheless, Buchanan states that PsyCAL does not necessarily lead to
higher marks, as it is possible that a student's dedication, conscientiousness, and
motivation to succeed might result in more effective use of the exercises and effort in
other areas.
The goal of the second study reported by Buchanan (2000) was to establish
whether the use of PsyCAL increased performance when it's use was not required in the
course. In this study, participation was again optional. Participants were 2 14 students
taking a 2nd year Psychology course. This study built upon the first study by comparing
exam scores for questions that required the application of knowledge with exam scores
for questions that required students to follow textbook procedures. In this study 5
exercises related to course content were made available to students.
In the analysis, Buchanan (2000) compared exam scores of students who used
PsyCAL (n=16) with those who did not (198). The results indicate that students who used
PsyCAL performed better than students who did not use it on tests requiring the
application of knowledge (p<.04). On the other hand, no significant differences were
found between PsyCAL use and following textbook procedures.
Despite the different ways of providing feedback described in the studies
discussed above, they all found that performance increased when feedback was given.
Performance improvements occurred regardless of the type of multiple-try feedback
provided (with or without hints). Two of the studies further investigated the research on

feedback and performance by evaluating types of learning with performance. While my
study does not make distinctions with respect to the type of learning, it may be interesting
to conduct further analysis in this area at a later date.
Self-Efficacy and Performance
Most of the research I found relevant to the link between self-efficacy and
performance is framed by Bandura's (1977; 1997) definition of self-efficacy which states
that there is a strong correlation between a person's self-efficacy beliefs about performing
a task and how well they perform that task. This foundational literature supported Dr.
Jungic's prediction about the link between performance and what he called "self-
confidence". However, I needed to better understand how this link was investigated in
the literature.
Self-efficacy assessments, according to Bandura (1 997; 2001), should ask how
well a specific task can be performed. Therefore, Pajares (2001) recommends asking
"How well can you do fractions?" instead of "How well can you do mathematics?"
Pajares and Graham (1999) following Bandura's reasoning asked task-specific questions
in a study that compared mathematics self-efficacy and performance of middle school
students in grade 6 at the beginning and end of the school year. Using an eight-point
Likert scale, students were asked to state their confidence that they would be able to
correctly answer a question if they were asked to answer the question tomorrow. The
questions were specific, and similar to "A train is traveling an average speed of 75 miles
per hour. Use the four-step plan to find out how far it will travel in four hours" ( p. 127).
Students were told that these questions would be similar to questions on the high-stakes

end-of-unit tests given at the end of the fall and spring semesters. The end-of-unit tests
were prepared by the mathematics grade-level chair and the teaching team.
They found positive correlations between mathematics self-efficacy and
performance in end of unit exams given at the end of the fall semester and at the end of
the spring semester (r = .57 and r = .59, p < .0001). In addition, a multiple regression
analysis between performance on the end of unit exam in the fall predicted performance
on the end of unit exam in the spring (P = .162), and self-efficacy scores in both the fall
and the spring predicted performance on end of unit exams at both administrations (P =
.267 and P = .272). These results indicate that a student's past performance is related to
their future performance and that a student's self-efficacy is related to their performance.
For example, if a student did well on the test at the beginning of the year, they would
have high mathematics self-efficacy at the beginning of the year and be likely to do well
on a test at the end of the year. Similarly, students with low performance on a test at the
beginning of the year would have low mathematics self-efficacy and be likely to do
poorly on a test at the end of the year.
A further analysis by Pajares and Graham (1 999) revealed that there was a
decrease in mathematics self-efficacy scores between the fall and the spring. A
dependent-sample t-test revealed that the decrease in self-efficacy scores was statistically
significant (p <. 001). While the exams given to these grade 6 students taught by the same
teacher at the end of the fall and the spring were different, the authors do not indicate
whether topics taught in the spring semester required mastery of topics taught in the fall
semester. Pajares and Graham believe that the self-efficacy decrease was likely the result
of differences in exam difficulty but no further explanation is provided.

While Pajares' (2001) guidelines state the importance of asking task specific self-
efficacy questions, other researchers have obtained similar results by asking about a more
general concept. This difference is illustrated in a study by Carmichael and Taylor (2005)
that also employed Bandura's (1997) definition of self-efficacy. The participants in this
study were 129 university students enrolled in a tertiary preparatory course that would
allow them, upon successful completion, to take further preparatory level mathematics
courses or enter undergraduate study.
The participants were asked to answer self-efficacy questions at the course level,
concept level, and question level, complete a maths readiness test, and one assignment.
Positive correlations between performance on the maths readiness test and self-efficacy
were found at the course level (r = .25), topic level (r = .39), and question level (r = .45)
(all p <. 01). Conversely, on the first assignment, only one significant correlation was
found, between performance and question level self-efficacy (r = .20, p <. 05). These
results may indicate that when people are faced with a new subject, they often do not
have a clear idea of their ability to perform a task until they try it. Therefore, by asking
specific questions, it will help people to identify the task and give a self-efficacy rating
that is related to their performance.
Similar results were found in a study by Pietsch, Walker, and Chapman (2003).
Bandura's (1 997) definition of self-efficacy was also employed in this study. In their
study, participants were asked task specific questions and more general (concept)
questions. The specific questions asked students to rate their self-efficacy for correctly
answering specific questions about percentages. Questions about concepts were more
general, and asked students to indicate their confidence for a statement such as "I am able

to achieve at least 90% on a percentages test" (p. 591). The analysis of the responses
provided by 41 6 students between the ages of 13 and 15 indicated that there was a
positive correlation (p < .05) between a student's performance and both their
mathematics self-efficacy for concepts and their mathematics self-efficacy for specific
tasks.
In another study by Hackett and Betz (1989) similar results were also found.
While employing Bandura7s (1977) definition of self-efficacy, they asked Psychology
students about their mathematics self-efficacy for specific tasks such as balancing a
cheque book and broader concepts such as problem solving questions from arithmetic,
algebra, and geometry. The questions were taken from the standardized mathematics self-
efficacy scale (MSES) developed by Betz and Hackett (1 983). Positive correlations
between both general and specific mathematics self-efficacy and performance were found
(average r=.44, p<.001).
The results of the studies discussed above left me with questions concerning the
importance of asking task level questions for self-efficacy assessment. Results of these
studies may indicate that by asking specific questions it will help people to identify the
task and give a self-efficacy rating that is related to their performance of that task.
Lodewyk and Winne (2005) believe that the timing of self-efficacy questions is
another component to consider in order to obtain accurate self-efficacy responses. These
authors assert that there are two different types of self-efficacy that are important to the
design of self-efficacy questions, self-efficacy for learning and self-efficacy for
performance. Thus, they should be distinct measures, as "learning and performing are not
necessarily equivalent. Students can perform well (succeed) without necessarily
comprehending material or a procedure, and they can learn material without being able to
perform in ways that reveal mastery.. .self-efficacy for performance relates more to one's
expectancy for success or achieving a desired outcome on a task whereas self-efficacy for
learning involves 'judgments about one's ability to accomplish a [particular] task as well
as one's confidence in one's skills to perform that task' (Pintrich et al., 1991, p. 13 in
Lodewyk and Winne)" (p. 4). Therefore, accurate self-efficacy ratings are more likely to
be obtained by asking students to rate their self-efficacy after they have attempted to
answer a specific, task-related question. This is an interesting idea as all of the studies
reported above only asked for self-efficacy information before the task was completed.
An analysis of changes to self-efficacy for learning versus self-efficacy for
performance was done by Lodewyk and Winne (2005). The participants in their study
were 94 volunteer students from a 1 oth grade science class. The students were divided
into two groups and asked to complete either an ill-structured task that did not contain
specific direction for completing the assignment or a well-structured task that contained
specific direction for completing the assignment. Self-efficacy was assessed at six
different times during the task, including the beginning and end of the task. The results
indicate that in the ill-structured task, the mean self-efficacy for learning score increased
on a 7-point scale from 3.26 at the beginning of the task to 3.77 at the end of the task.
Self-efficacy for performance with the ill-structured task group, on the other hand,
remained approximately the same throughout the task (3.83 at the beginning and 3.81 at
the end). The well-structured task group had greater increases in their self-efficacy for
learning (from 3.46 at the beginning to 4.05 at the end) and their self-efficacy for
performance (4.05 at the beginning and 4.13 at the end).

This study, unlike the others reported above, did not compare self-efficacy for
learning or self-efficacy for performance with actual performance. Instead, it used
structured multiple regression to determine if students' levels of self-efficacy for learning
and self-efficacy for performance would predict task performance (after controlling for
general academic achievement). They found that the combination of past performance,
self-efficacy for learning, and self-efficacy for performance did predict final performance
on the ill-structured task, but not on the well-structured task (p<.05) (Lodewyk & Winne,
2005).
The results of this study indicate that self-efficacy for learning is a stronger
predictor of performance than self-efficacy for performance in both ill-structured and
well-structured tasks. In addition, the results indicate that self-efficacy for performance
predicts performance on the final task. The use of both ill-structured and well-structured
tasks in this study is another way of looking at the debate discussed in studies above
regarding specific versus general self-efficacy questions. It also helps to shed some light
as to the type of task where students may benefit from additional feedback.
In putting together what I learned from the literature, and in consultation with Dr.
Jungic, 1 decided to assess the mathematics self-efficacy of students at both the
conceptual and question specific levels at different points throughout the semester. Even
though the research recommends asking problem-specific questions, I chose this
approach because the results of studies assessing self-efficacy at the conceptual and
question specific levels are mixed. In addition, we decided to obtain information about
self-efficacy for learning and self-efficacy for performing by asking students to rate their
self-efficacy before and after answering assignment questions. It was hoped that the

amount of information obtained using this process would allow me to make comparisons
between conceptual and question specific self-efficacy scores as well as self-efficacy for
learning and self-efficacy for performing scores.
Feedback and Self-Efficacy
Examining the relationship between self-efficacy and feedback was the major area
of interest for Dr. Jungic. This relationship has long been mentioned as an area for future
research in studies that have shown a relationship between performance and feedback,
but I found little research relevant to this relationship. Bandura (1977; 1997) states that
self-efficacy beliefs are influenced by: performance accomplishments (successes raise
expectations while failures lower them unless they are followed by repeated successes);
vicarious experience (seeing others perform the same activity); verbal persuasion (being
told that they can do it); and, emotional arousal (performance increases when there is less
anxiety and more relaxation). Bandura (1 997) further argues that people must have the
ability (or knowledge) to make accurate assessments of their performance. One way to
provide this information to students is through formative feedback.
The addition of LON-CAPA has the potential to address each of the above four
influences because it provides feedback and there is a discussion board which enables
students to give and receive support from each other. In particular, following Bandura's
(1 997) reasoning, performance accomplishments should rise because students will
expect, with eight tries, they will be able to arrive at the correct answer. The discussion
board, that is part of LON-CAPA may support the vicarious experience and verbal
persuasion components as it allows students to communicate with each other, find out
that their classmates are able to answer similar questions, and possibly be told that they
2 1

too can answer the question. Finally, knowing that they have eight tries and can get help
from classmates, the instructor, and the Applied Calculus lab may help to relax students
and lower their emotional arousal.
In my study, the specific cause of increases or decreases in self-efficacy was not
investigated. Instead, self-efficacy scores were compared with performance between
students who did or did not use LON-CAPA. A study similar to mine, although slightly
more elaborate because it also compares performance with different types of feedback,
was conducted by Schunk and Swartz (1 993). In this study, self-efficacy comparisons
were made between 5th grade students who experienced different instructional strategies
for teaching writing: 1) process goal (a description of a strategy for improving their
writing skills); 2) process goal and feedback; 3) product goal (a reminder about the
specific task to be completed); and, 4) general goal (a reminder to "do your best"). The
results of this study indicated that students who received some direction (a process or a
product goal) had larger increases in self-efficacy for the task than those who were only
given a general goal, and that students who received specific feedback and direction
(process goal plus feedback) had the largest increase in self-efficacy for the task.
The importance of providing personalized feedback that provides students with
some direction is highlighted as a key element to increasing self-efficacy in the Schunk
and Swartz (1 993) study. Perhaps one reason why I found there has been relatively little
research published examining the relationship between feedback and self-efficacy using
technology to give feedback is because technology is currently unable to analyze
complex thought processes and provide the level of individualized feedback required to
increase self-efficacy. It is expected that the results of my study will help to answer

whether general feedback such as "you have correctly/incorrectly answered the question"
is sufficient to increase self-efficacy.
Gender and Feedback/Performance/Mathematics Self-Efficacy
Investigating the role of gender was a secondary goal of this study, and was not of
direct interest to Dr. Jungic. Given this, I have only summarized the results of gender
analyses in studies previously mentioned. The two studies that mention gender, Pajares
and Graham (1 999), and Carmichael and Taylor (2005) both expected to find lower self-
efficacy ratings for girls, and especially gifted girls (Pajares & Graham, 1999). In the
study by Carmichael and Taylor, they state that females reported lower self-efficacy
levels than males (but they do not state how much lower). Pajares and Graham, on the
other hand, found no significant differences between genders on performance.
The Question of Technology Use
In the present study, unlike many others, I have intentionally not focused on the
presence or absence of technology but on the instructional element the technology
permitted, namely immediate multiple-try feedback. My reading of the literature led me
to understand that this is an important distinction.
Many studies have compared teaching and learning with technology versus
teaching and learning without technology and have failed to find a strong causal
relationship between media or media attributes and learning (Clark, 1994). In this respect,
I responded to a critique made by Clark based on several meta-analyses that he conducted
(Clark, 1994; Kozma, 1994). In his meta-analysis of thousands of media research studies,
Clark (1 994) asserted that the lack of findings between studies that compare instruction

using technology and instruction that does not incorporate technology is due to the
studies not addressing differences in the aspect of instruction that has been proven to
affect learning, namely the instructional strategy. Instead of comparing the effect of
changes to the instructional strategy that occurred by incorporating technology these
studies compared the use of technology with not using technology in instruction. Clark,
in support of this argument, refers to a study by Suppes described in Clark (1983), where
there were no performance differences between students who received drill and practice
instruction in mathematics and those whose teacher gave extra (more than the study
allotted) drill and practice instruction. However, both of these groups of students
performed better than students who did not receive any extra help from their teacher.
According to Clark's argument, there were no performance differences between the
groups that received the additional feedback because it was changes to the instructional
strategy that provided students with the additional practice that enabled them to increase
their performance.
The Research Questions
After reviewing the literature, I again met with Dr. Jungic and another workshop
instructor to talk about what I had learned from my review of the literature, and to jointly
develop the research questions. I began by describing research in all of the areas related
to Dr. Jungic's instructional inquiry: instructional strategy; feedback; performance; self-
efficacy; and, the relationships between each of these areas. We all agreed that in order to
satisfy Dr. Jungic's desire to better understand the relationship between the changes he
had made to increase feedback, student's mathematics self-efficacy, and student

performance, the relationships between all of these areas would need to be examined. The
following research questions were developed to address each area:
Feedback and mathematics performance: Did the increase in feedback provided to
students in Dr. Jungic's class effect class performance?
Mathematics performance and mathematics self-efpcacy: What was the relationship
between performance and mathematics self-efficacy for students in Dr. Jungic's
course? Did the relationship between performance and mathematics self-efficacy
change during the semester?
Feedback and mathematics self-efzcacy: Did increasing the feedback given to
students in Dr. Jungic's course effect students mathematics self-efficacy?
Gender, self-efJicacy, andperformance: What were the relationships between gender
and self-efficacy and gender and performance for students in Dr. Jungic's course?

DESIGN OF THE CLASSROOM RESEARCH STUDY
In order to investigate the relationships between feedback and performance,
performance and self-efficacy, and feedback and self-efficacy, the following design was
agreed upon. First of all, grades from the previous semester was provided by Dr. Jungic
so that performance differences between the two offerings of the same course could be
compared before and after changes to the course design were made. Next, it was decided
that there would be two groups of student participants. Both groups completed 19
assignments and were asked to provide self-efficacy information in addition to answering
the questions on 10 assignments. One group, referred to as the "on-line group" would
complete these assignments using an on-line tool called LON-CAPA that would provide
them with immediate multiple-try feedback. The other group, referred to as the "paper
group" would receive the same assignments through email and submit them to the course
instructor on paper. The paper group did not have access to LON-CAPA. Their
assignments were returned 1 week later and the only feedback provided was whether they
had answered the question correctly or incorrectly. Both groups were able to contact the
course instructor and get help from TAs in the Applied Calculus Workshop. The other
course components were the same for a11 students (quizzes, final exam, and written
assignments).
We also decided that I would conduct three interviews with Dr. Jungic, one at the
beginning of the semester, one at the end of the semester, and one after I had finished the

data analysis. The first two interviews were semi-structured and about a half-how in
length, while the third interview was conducted by email. In the first two interviews Dr.
Jungic was asked questions about the course components and the use of LON-CAPA to
provide students with feedback. At the beginning of the semester there were questions
regarding the planned changes to the instructional strategy and their expected results. End
of semester interview questions inquired about the actual implementation of the changes,
the perceived success of the changes, and other changes that were made during the course
of the semester. In the third interview Dr. Jungic was asked to discuss how he felt about
the research process, the results of the study, and whether he will be making any changes
to his instructional method.
At the beginning of the first interview, Dr. Jungic was asked to sign a consent
form (Appendix A). After each interview was transcribed Dr. Jungic was asked to review
the transcriptions and make any revisions. On each interview, a few grammatical
revisions were requested and then incorporated into the interview transcript. I describe
Dr. Jungic's thinking about his course design, sometimes illustrated by actual quotes
fiom these interviews in several places in this thesis to illustrate and provide detail to my
discussion. The following research procedures, analyes and findings, however, focus on
data collected from the students in Dr. Jungic's course to address the specific research
questions.
Dr. Jungic's Students
All students (484) enrolled in Dr. Jungic's course, Introductory Calculus for the
Social Sciences (Math 157), were asked to participate in this study on the first day of
classes in the Fall 2004 semester at Simon Fraser University. At the end of the semester
27

there were 384 students enrolled in the class. The majority of students (387) enrolled
were taking this course in their first semester of university and intended to major in either
Business Administration (237) or Arts (1 86). The average CGPA for students who were
not in their first semester at SFU was 2.48 (Analytical Studies, 2006).
One hundred and ninety out of 384 students who completed the course
volunteered to participate in the study. Results from the Computer User Self-Efficacy
(CUSE) questionnaire completed by 98 students found that almost all students were 18
years old (M=19.26, SD=3.87, Min=17, Max=52), 97% owned a computer, 41.8% were
male, and 59.2% were female. Most students, 94.8%, indicated using a 4-point Likert
scale, that they had experience using computers. Specifically, 41.8% stated that they had
"some experience", 41.8% stated that they had "quite a lot of experience", and 11.2%
stated that they had "extensive experience" using computers.
Instruments
The design of my research study utilized three categories of data collection. The
first category focused on mathematics self-efficacy information, the second on student
grades, and the third on computer-user self-efficacy.
Mathe,matics Self-Efficacy
1. Mathematics Self-Efficacy (MSE) Questionnaire (A~pendix B). This questionnaire
used an 1 1 -point Likert scale to obtain information about each student's mathematics
self-efficacy for each topic in the course. The list of topics was obtained from the
course outline. This questionnaire format was also used in studies conducted by
Lodewyk and Winne (2005), Carmichael and Taylor (2005), Pietsch, Walker, and

Chapman (2003), and Hackett and Betz (1989). Students were asked to complete this
questionnaire at both the beginning of the semester and the end of the semester using
a web-based tool called WebCT. Overall MSE scores were calculated by adding the
scores for all topics together. Mean MSE scores were calculated by dividing the
overall MSE score by the total number of topics.
2. Assignment Self-Efficacy Questions. Students answered self-efficacy questions on 10
assignments. The responses were submitted through LON-CAPA by students in the
on-line group and on paper by students in the paper group. All students in both the
on-line group and the paper group used an 1 1 -point Likert scale to provide self-
efficacy information before and after answering each question on each assignment.
The format was identical for students in the on-line group and the paper group. An
example of this format is shown in Table 1.
Table 1: Sample Assignment Self-Efficacy Question Format
How sure are you that you can correctly answer the following question? Please rate your degree of confidence by entering a number from 0 to 10, where 0 = can not do it at all, 5 = moderately certain can do, and 10 =
certain can do. Select a number. 0 1 2 3 4 5 6 7 8 9 10
Complete the following statements by circling the appropriate italicized items.
1. The line x=a y=b is a vertical asymptote horizontal asymptote for the graph of the function f if and only if at least one of the following is true:
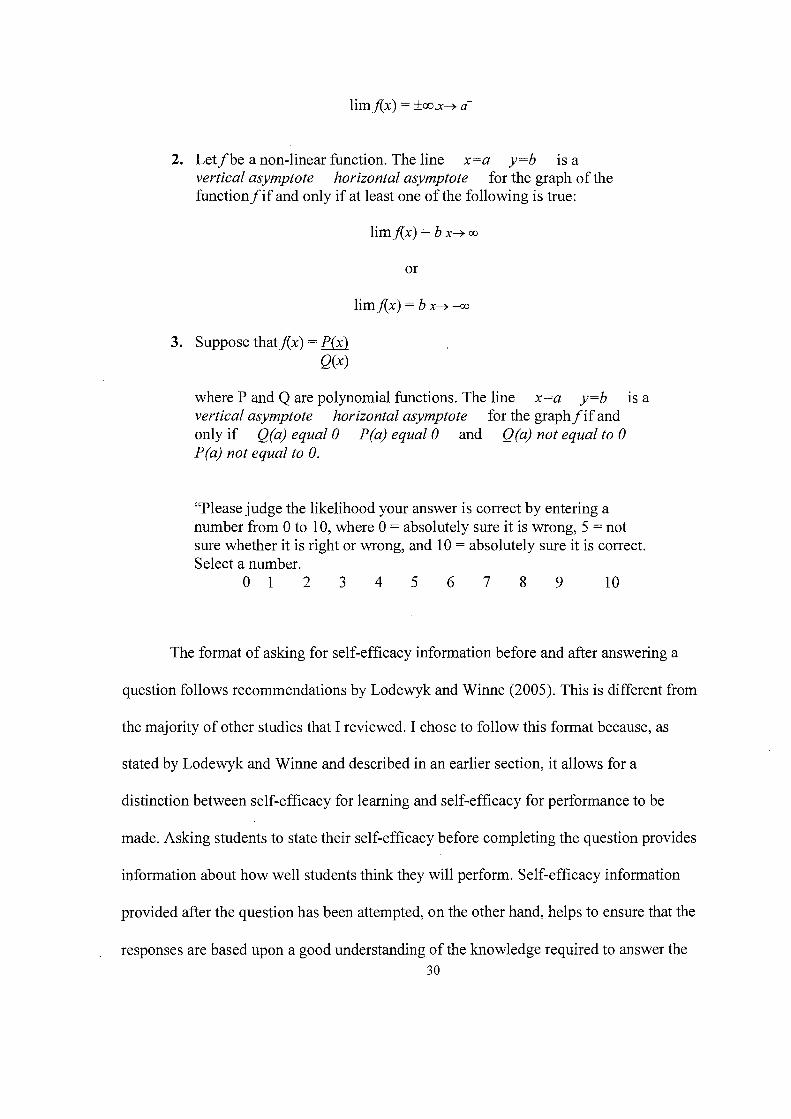
limfix) = +oo.x+ a-
2. Let f be a non-linear function. The line x=a y=b is a vertical asymptote horizontal asymptote for the graph of the function f if and only if at least one of the following is true:
limfix) = b x-+ ca
3. Suppose thatfix) = P(x) QW
where P and Q are polynomial functions. The line x=a y=b is a vertical asymptote horizontal asymptote for the graph f if and only if Q(a) equal 0 P(a) equal 0 and Q(a) not equal to 0 P(a) not equal to 0.
"Please judge the likelihood your answer is correct by entering a number from 0 to 10, where 0 = absolutely sure it is wrong, 5 = not sure whether it is right or wrong, and 10 = absolutely sure it is correct. Select a number.
0 1 2 3 4 5 6 7 8 9 10
The format of asking for self-efficacy information before and after answering a
question follows recommendations by Lodewyk and Winne (2005). This is different from
the majority of other studies that I reviewed. I chose to follow this format because, as
stated by Lodewyk and Winne and described in an earlier section, it allows for a
distinction between self-efficacy for learning and self-efficacy for performance to be
made. Asking students to state their self-efficacy before completing the question provides
information about how well students think they will perform. Self-efficacy information
provided after the question has been attempted, on the other hand, helps to ensure that the
responses are based upon a good understanding of the knowledge required to answer the 30

question, and not simply the ability to imagine all of the steps required for answering the
question (Cassidy & Eachus, 2002; Lodewyk & Winne, 2005).
The use of task-specific questions follows the same format of questions used in
research conducted by Lodewyk and Winne (2005), Carmichael and Taylor (2005),
Pietsch, Walker, and Chapman (2003), Pajares and Graham (1 999), and Hackett and Betz
(1 989) discussed in an earlier section.
3. Practice Mathematics Self-Efficacy Questionnaire (Appendix C). This test was
developed by me to allow students to practice the format of questions they would
encounter on the beginning and end of semester MSE questionnaires before taking
those tests. This was done to familiarize students with the question format and with
completing on-line questionnaires. This questionnaire was administered on-line
through WebCT and was not used for data analysis.
The self-efficacy instruments used in this study (i.e. MSE questionnaires and
Assignment self-efficacy questions) adhere to Bandura's self-efficacy questionnaire
guidelines (2001) that are appropriate for the goals of this study. Specifically:
Each question on the scales were tailored to address specific topics in the course.
The self-efficacy statements asked students if they thought that they could do the
task.
The questions used vocabulary that was appropriate for the course.
An I 1 -point response scale was used to allow participants to differentiate steps
and provide data that is more sensitive and reliable.
Response bias was minimized because questionnaires were answered privately,
participants were informed that their responses would remain confidential and

identifying information would be removed, and participants were told about the
value of their participation in this research with respect to knowledge
development in this field
Student Grades
The second category of data collection involved obtaining student grades on all
assignments and exams in this course. The final grades for students who had taken this
course in 2002, when it had previously been taught by Dr. Jungic, were also obtained for
purposes of comparison.
Computer User Self-Efficacy
Finally, the third category of data collection involved asking students to complete
a Computer User Self-Efficacy questionnaire (CUSE) to determine if computer self-
efficacy may have been a reason for why a student wanted to be in the on-line or paper
submission group. It was administered through WebCT. The CUSE was developed by
Cassidy and Eachus (2002) (see Appendix D for the letter of permission to use the
CUSE). I chose to use this questionnaire because Cassidy and Eachus had tested it on a
similar population (university students). The issue of reliability was addressed because
there were several questions about the same topic; the questions asked about many
different types of topics; and, internal reliability and internal validity appeared to be high
as Cronbach's alpha was 0.94. There were also strong correlations provided between
computer self-efficacy and both computer experience (r=0.55, p<0.001) and familiarity
with software packages (r=0.53, p<0.00 1).

Procedure
I attended the first day of classes to talk about the study and ask all students to
participate. All students were given a handout describing the study (Appendix E) and a
consent form to be completed and returned should they choose to participate (Appendix
F). The consent forms were retained by the researcher. On the consent form, students
were asked to indicate whether they would like to be in the group that completed the "on-
line assignments" worth 8% of their grade using LON-CAPA (referred to as the on-line
group) or on paper (referred to as the paper group). Students were told that the
assignments would be exactly the same and that students in the paper group would
receive a 1.5% bonus mark, up to a maximum of 8% of the "on-line assignment" grade.
In addition, due to funding restrictions, students were also told that the paper group had
to be restricted to 15 volunteers who would be randomly selected from those who
volunteered. After I make the group selection, each student was sent an email telling
them whether they would be submitting assignments on-line or on paper. The purpose of
having two groups, as was previously explained, was to allow self-efficacy and
performance comparisons to be made between students who received immediate
rightlwrong multiple-try feedback on every question and students who received delayed
rightlwrong feedback on every question.
In the second week of classes, I returned to ask students if they had any further
questions and collect any additional consent forms. Students who submitted consent
forms at this time were told that they could only participate in the on-line group as the
maximum number of participants in the paper group had already been selected.

At the beginning of the semester all students who consented to participate were
asked to complete the Mathematics Self-Efficacy questionnaire (MSE) and the Computer
User Self-Efficacy questionnaire (CUSE). The practice self-efficacy test was also made
available at the beginning of the semester for any students who chose to use it. At the end
of the semester students were asked to complete the MSE for the second time. All
questionnaires were completed on-line using WebCT.
The procedure that students followed for submitting the assignments depended
upon whether they were in the on-line or paper submission group. Assignment
submission for students in the paper submission group used the following procedure:
1. Approximately one week before there was an assignment due, the researcher
downloaded the assignment from LON-CAPA and e-mailed it to participants in the
paper group.
2. Assignments were submitted to Dr. Jungic during class, and were later picked up and
marked by me using an answer key obtained from LON-CAPA. The only feedback
students received was whether they had correctly answered the question, and the
correct answer (if they had answered incorrectly). I returned assignments to all
students using drop boxes in the Math Lab no later than one week after they had been
submitted.
3. Self-efficacy information provided on assignments was recorded in a separate file
before the assignments were returned.
4. All assignment marks were recorded and given to Dr. Jungic at the end of the
semester.

Students in the on-line assignment submission group used a different procedure
for completing assignments:
1. Approximately one week before there was an assignment due, students were able to
access and complete the assignment using LON-CAPA. Students were immediately
given feedback by LON-CAPA as to whether their response was right or wrong.
Students had up to eight tries to obtain the correct answer.
2. Self-efficacy information provided by students for each question was recorded in
LON-CAPA.
3. Students had access to the on-line discussion board available in LON-CAPA and
could ask other students for help on assignment questions.
Limitations
The research design described in the previous sections of this chapter has a few
limitations that I was aware of at the beginning of the study. However, while the
following limitations existed, I thought that they were characteristic of many of the quasi-
experimental designs reported in the literature.
The first limitation was amount of information that I was able to obtain about the
students. Reports from Analytical Studies told me that in 2-002 and 2004 most students in
this course were new to SFU and intending to major in Business Administration
(Analytical Studies, 2006). The SFU calendar told me that there were no changes in SFU
or Business Administration entrance requirements between 2002 and 2004. However,
other past performance data that would have helped me to make a better comparison with
respect to performance between the two classes, such as high school Mathematics 12 and
Calculus 12 grades, was not obtained. 35

A second possible limitation of this study was the high student drop-out rate that
is normally experienced in the fall semester offering of this course. While there are many
reasons for dropping a course, some reasons such as course difficulty and course work
load may have been relevant when discussing improvements in performance between the
2002 and 2004 offerings of this course. Nonetheless, I did not consider trying to obtain
reasons for a student dropping this course.
Finally, the third limitation that I was aware of was the possibility of changes in
the difficulty level of the assignments and exams from the 2002 course offering to the
2004 course offering. I did investigate my concern by expressing it to Dr. Jungic, who
told me that the exams and assignments would be similar to the ones used in 2002.
Nevertheless, no actual analysis was performed.

RESULTS
Treatment of Missing Data I
Before analyzing the data, I first had to make decisions about how to address
group attrition in the study groups and participant non-response. Participant non-response
occurred in two areas of this study: 1) there was a low completion rate in the paper-
submission group; and, 2) some participants in both groups completed some but not all of
the questionnaires. The issue of missing data is commonly found in longitudinal studies
involving human subjects, as participants frequently drop out of the study or only
participate in parts of the study (Maxim, 1999; Plewis, 1985). When this occurs,
decisions must be made about whether to include or exclude non-responses (Groves,
I 2004). The following sections describe how I addressed the problem of these issues for
I
the paper subr$ission group and the on-line submission group.
Paper Submission Group
One of the research questions was to compare performance and mathematics self-
efficacy of stuhents who completed assignments on-line with those who completed
assignments 04 paper. Again the difference between these two groups was that the paper I
submission g r ~ u p would only receive feedback after the assignment was marked I
(approximately 1 week later), and the on-line group would receive immediate multiple- I
try feedback dith eight chances to correctly answer a question by using LON-CAPA.
Unfortunately, many of the students in the paper submission group either did not
3 7

complete the qourse (one student withdrew) or remain in the paper submission group (5
out of 15 studknts asked to switch groups). In addition, there were some students who did
not complete dl1 questionnaires (refer to Table 2 for a summary of paper group
participation ih all surveys).
Table 2: ~ a b e r Submission Group Completion Rates
, Questionnaire
Computer user Self-Efficacy (CUSE)
I Assignments with reported self-efficacy scores I
Paper Submission Participants
5
Mathematics Self-Efficacy (beginning of semester) (begin MSE)
Mathematics Self-Efficacy (end of semester) (end MSE)
I CUSE and M ~ E (begin) I
5
3
I MSE (begin) a;nd MSE (end) 3
~ c c o r d i n ~ to Groves (Groves, 2004) and Plewis (Plewis, 1985), I could have
"predicted" the responses of participants who dropped out or did not respond, but I would I I
need to be surd that they were representative of the entire sample. I chose not to try to I
predict responses because it was not possible to determine if the students remaining in the
paper submission group were a random sample of all students in the paper submission
group, or if thd lack of access to the additional feedback from LON-CAPA influenced I
their decision do withdraw from the course, group, or not to complete all questionnaires. I
As a result of these dropouts it was not possible to make comparisons between the paper l
and on-line submission groups. This group was excluded from my further analysis.

On-line Subm/ission Group
In the dn-line submission group there were some students who completed some
but not all questionnaires (see Table 3 for a summary). My options for addressing the
non-responses for the on-line submission group were to: predict the responses for
students who did not respond; only use data from students who responded to all
questionnaires; or, to consider the analysis of each research question separately, using the
relevant data available.
Table 3: Questionnaires Completed by On-Line Participants
I Questionnaire Number of students completing
Computer User Self-Efficacy (CUSE)
Mathematics Self-Efficacy (beginning of semester) (begin MSE)
99
98 -- -
Mathematics Self-Efficacy (end of semester) (end MSE)
Assignments (self-efficacy scores for each question)
In this research study, 91 out of 175 students who volunteered to participate and
68
127
CUSE and MSE (beginning of semester)
MSE (begin) dnd MSE (end)
were in the onkline submission group completed the MSE and CUSE questionnaires at
the beginning bf the semester, but only 68 completed the MSE questionnaire at the end of
9 1
56
the semester. k s I did not know why students did not complete a particular questionnaire,
I could not besure that the remaining data were representative of all students in the on-
line submission group. Therefore, it was not appropriate to predict their responses to the
MSE questionnaire at the end of the semester.
3 9

The se ond option, to only use data from students who completed all c I
questionnaires, would mean that I would have had to assume that there were no
differences between students who completed all questionnaires and students who did not
complete all questionnaires (Groves, 2004; Plewis, 1985). This assumption was also not
appropriate because I do not know why some students only completed questionnaires at
the beginning of the semester and not at the end of the semester. Consequently, I chose
the third option, to consider the analysis of each research question separately, using the
relevant data available.
In the remainder of this chapter, I present the findings for each of the research
questions:
Research Question #I I
Did increasing the feedback provided to students in Dr. Jungic S class effect student
performance?
This research study attempted to answer this question by using two different
methods. The first and most direct method involved making performance comparisons I
between studefits in the on-line group and the paper group. Unfortunately, due to attrition
in the paper griup, it was not possible to complete this analysis. I
The secbnd method involved examining changes in performance by comparing
final marks from different semesters and by looking at how students performed
throughout the bemester. Comparisons of final marks between semesters have been done
in studies that cliscuss the benefits of the feedback provided by the use of an on-line tool
(D. A. Kashy et al., 2001; E. Kashy et al., 1998; E. Kashy et al., 2000; Siew, 2003)). In
my study, a comparison of grades from all 472 students in this class (not just the 171
40

students who participated in my research study and completed the course) with a previous
course offering by Dr. Jungic (in 2002)' did reveal changes in the grades awarded. It is
important to note that Dr. Jungic believes that all exams were of a similar level of
difficulty in both offerings of the course, and the final marks in both offerings of the
course were awarded using the same letter grading scale and were not adjusted.
At the top of the class there were 12.1% A's and 36.0% B's in 2004 versus 11.2%
A's and 29.8% B's in 2002. At the bottom of the class there were 6.8% F's and 8.9% N's
in 2004 versus 12.6% F's and 4.9% N's in 2002 (see Table 4 to view the complete grade
distribution). There was also an increase in overall the class grade point average from
2.03 in 2002 to 2.13 in 2004. A chi-square indicates that the difference between the
observed and expected grades is statistically significant (p<.05) when all letter grades are
included. However, if the grades of F and N are combined, then a chi-square indicates
that the difference between the observed and expected grades is not statistically
significant. While these are indirect methods of assessing changes in performance, the
results may be an indicator that the type of feedback provided through LON-CAPA is
related to the improvement in student grades.
Table 4: Student Performance
I further analyzed student performance in the 2004 offering of Dr. Jungic's class
Year 2002 2004
by examining the exam marks of students throughout the semester. According to Dr.
4 1
Percentage of Students with Letter Grade %N
4.9 8.0
%A 11.2 12.1
%F 12.6 6.8
%B 29.8 36.0
%C 31.8 29.0
%D 9.6 8.2

Jungic, the topics tested on the second midterm were different from the first midterm, but
required an understanding of topics on the first midterm. The final exam included topics
from the entire course. Looking at each course component for students who completed
the course and participated in my study, I found that:
On the first midterm (marked out of 40), the mean score was 70%, median score was
71.25%, the mode was 78%, and the standard deviation was 19%. The grades were
normally distributed with a negative skew (see Figure 2).
0 20 40 60 80 100
Midterm 1
Figure 2: Midterm 1 grade distribution

On the second midterm (marked out of 4O), the mean score was 74.5%, median score
was 77.5%, the mode was 83%, and the standard deviation was 17%. The grades were
normally distributed with a negative skew (see Figure 3).
0 20 40 60 80 100
Midterm 2
Figure 3: Midterm 2 grade distribution

On-line assignments were completed by all 171 students. The scores had a mean of
93.6%, median of 99%, mode of 100%, and standard deviation of 13%. These grades
were not normally distributed (see Figure 4).
20 40 60 80 100
Online Assignments
Figure 4: On-Line assignment grade distribution

142 students completed the written assignments. The mean score was 71.9%, median
72.8%, mode 73.6'76, and standard deviation was 3.6%. These grades were not
normally distributed (see Figure 5).
55.00 60.00 65.00 70.00 75.00
Written Assignments
Figure 5: Written assignment grade distribution

171 students completed the final exam. The median score was 66.9%, median score
was 70%, mode was 64%, and the standard deviation was 17.65%. These grades were
normally distributed (see Figure 6).
0 20 40 60 80 100
Final Exam
Figure 6: Final exam grade distribution
These grade summaries reveal that between the first and second midterms the
grades increased, and in the second midterm they are not as evenly distributed as in the
first midterm. This indicates that there was an improvement in midterm scores between
the first and second midterms (see Figure 2 and Figure 3), and a decrease in the number
of lower grades on the second midterm. On the final exam, however, the grades were
normally distributed.

I continued analyzing changes in performances by looking for correlations
between performance on different exams. I examined this area because previous research
indicates that past performance is related to future performance (Carmichael & Taylor,
2005; Pajares & Graham, 1999). Pearson's correlation testing for two-tailed significance,
indicated that there were statistically significant correlations (p < .01) between grades on
the first midterm and the second midterm (r = .522), the first midterm and the final exam
(r = .628), and the second midterm and the final exam (r = .601) (see Table 5). This
means that students who had high scores on the first midterm tended to have high scores
on the second midterm and the final exam, and students with low scores on the first
midterm tended to have low scores on the second midterm and the final exam. These
values indicate that the correlation between each of the exam scores is moderately strong,
and unlikely to have occurred simply by chance.
Table 5: Exam score correlations
Final Exam
.63(**)
Midterm 2 Pearson Correlation
** Correlation is significant at the 0.01 level (two-tailed).
%
Midterm 2
.52(**) Midterm 1 Pearson
Correlation
Final Exam Pearson Correlation
According to previous research, feedback is most helpful to students at the bottom
Midterm 1
.52 (**)
of the class (Bloom, 1984; E. Kashy et al., 1998; E. Kashy et al., 2000). To examine this
.60(**)
.63(**)
relationship, I divided students who completed the course into three performance groups
.60(**)
based upon their first midterm score. A frequency distribution was used to determine that

out of 171 students who completed the class, 54 scored more than 80% (top one-third of
the class), 60 scored between 64.17% and 80% (middle one-third of the class), and 57
scored less than 64.17% (bottom one-third of the class). A second frequency distribution
of the grades of students in each group revealed that the average grades of students in the
top one-third of the class dropped slightly from 90 to 85.23% between the first and the
second midterms, the middle one-third of the class experienced a slight increase from
72.5 to 75.54%, and the bottom one-third of the class had a larger increase from 48.49 to
63.38% (see Table 6).
Table 6: Performance by 3rds on exams
I I Final Exam (percent) I
Top 113 of the class on the 1'' midterm (N=54)
Middle 113 of the class on Midterm 1 (percent) the lSt midterm (N=60)
Midterm 2 (percent)
Final Exam (percent)
Bottom 113 of the class Midterm 1 (percent) on the 1'' midterm (N=57)
Midterm I (percent)
Final Exam (percent)
Midterm 2 (percent)
Mean 1 Median 1 Mode 85 1 Std. 5,48 1 Deviation
90.00 90.00
a Multiple modes exist. The smallest value is shown
Changes to the exam scores with first midterm exam scores at the top, middle, and
bottom one-third of the class were further analyzed using dependent samples t-tests. For
students in the top one-third of the class after the first midterm, the decreases in exam
scores between the first and second midterms, the second midterm and the final exam,

and the first midterm and the final exam are all statistically significant (pc.01). The exam
scores received by students in the middle one-third of the class, on the other hand, were
more similar and only the decrease in the score between the second midterm and the final
exam is statistically significant (p<.05). Finally, the increase of the exam scores between
the first midterm and the second midterm for students with first midterm exam scores in
the bottom one-third of the class on the first midterm is statistically significant (p<.01). In
addition, the decrease in exam scores between the second midterm and the final exam for
students at the bottom one-third of the class after the first midterm is also statistically
significant (p<.01) (see Table 7). These results may be an indicator that feedback was
beneficial to the performance of students at the bottom one-third of the class, at least
during the first one-third of the semester. Or, they could reflect the phenomenon of
regression to the mean.

Table 7: Paired-sample t-test examining exam score differences
Pairec
Top 113 Pair 1 Midterm 1 - 4.77 of the Midterm 2 9.48
class Pair 2 Final Exam -6,32 - Midterm 2
11.81
I Pair 3 Final Exam 1 ,08 1 12.29 - Midterm 1 . . . . - - - . . . . . Middle Pair 1 Midterm 1 - -2.94 113 of Midterm 2
16.31
the I Pair 2 Final Exam 1 -5,64 7,49 class - Midterm 2 Pair 3 Final Exam -2.70 - Midterm 1 13.28
Bottom Pair 1 Midterm 1 - 1 -14,89 / 113 of I Midterm 2 19.66
Pair 2 Final Exam 1 1 16,01 the class I - Midterm 2 I Pair 3 Final Exam 1 4,05 1 17,92
- Midterm 1
Differe Std. Error Mean
zes 95% Confidence
Interval of the Difference 7 Lower Upper +
Sig. (2- tailed)
Summing up, the results of these analyses indicate that there was an increase in
the class grades between 2002 and 2004, and the midterm scores of students in the
bottom one-third of the class increased between the first and second midterms.
Specifically, in 2004 there was a higher percentage of A's and B's, a lower percentage of
students who failed the class, and a higher percentage of students who dropped-out than
in the same class during 2002 with the same instructor (see Table 4). In addition, mean
exam scores for students with first midterm exam scores in the bottom one-third of the
class improved on both the second midterm and the final exam (compared to first
midterm exam scores). The grades of students with first midterm scores in both the
middle-third or top-third of the class on the first midterm, on the other hand, decreased
between the first midterm and the final exam. In addition, the grades of students in the

top third of the class also decreased between the first midterm and the second midterm,
while the grades of students in the middle third of the class increased between the first
and second midterm (see Table 6). While one possible cause for this variance is due to
the regression to the mean phenomenon, it is also possible that feedback may have helped
students in the bottom one-third of the class to perform better on the second midterm and
the final exam, but the benefits appear to be more noticeable on the second midterm than
the final exam.
Research Question #2
What is the relationship between performance and mathematics self-efJicacy for students
in Dr. Jungic 's course? Did the relationship between performance and mathematics self-
eficacy change during the semester?
In the second research question, I analyzed student performance on different
course components. Results from the analysis of Research Question #1 told me that: 1)
performance on the first midterm was correlated with performance on the second
midterm and the final exam; 2) the largest increase between the first and the second
midterm exam scores was for students in the bottom one-third of the class; and 3) the
grades for all students dropped between the second midterm and the final exam, and the
largest drop was for students in the bottom one-third of the class. These results will also
be used to answer this research question.
Information about the second variable in this question, mathematics self-efficacy,
was obtained from two different instruments. The first instrument, the Mathematics Self-
Efficacy Questionnaire (MSE), was used to obtain self-efficacy information about each
course topic. Students were asked to complete the MSE at the beginning and at the end of
5 1

the semester. The second instrument, assignment self-efficacy questions, was used to
obtain self-efficacy information about solving a specific question. It asked students to
judge the likelihood that they could correctly answer a specific assignment question
before answering the assignment question, and the likelihood that they had correctly
answered a specific assignment question after they had answered the assignment
question.
Mathematics Self-Efficacy Questionnaire (MSE)
The beginning and end of semester MSE data was analyzed using responses from
52 students who completed both of these. The Cronbach's alpha score for the MSE is .95.
Mean scores were calculated by adding the response values (ranging from 0 to 11) for
each question and then dividing by the total number of questions on the questionnaire.
This was done for each student, and on both questionnaires.
The mean self-efficacy scores were higher on the MSE given at the end of the
semester (7.43) than at the beginning of the semester (5.16). Pearson's correlation
indicated that the relationship between a student's self-efficacy score at the beginning of
the semester and their self-efficacy score at the end of the semester was significant and
positively correlated (r=.41, p<.05). This means that if a student had a high self-efficacy
score at the beginning of the semester, they tended to have a high self-efficacy score at
the end of the semester, and students with low self-efficacy scores at the beginning of the
semester tended to have low self-efficacy scores at the end of the semester. Further
testing using a paired samples t-test indicated that the difference between the mean self-
efficacy scores at the beginning and end of the semester was also statistically significant
(t(56)=8.03, p<.05). Therefore, the increase in the scores between the beginning and end
52

of the semester is large enough that this difference is unlikely to have occurred by
chance.
After determining that there was an improvement in the mean MSE scores
between the beginning and the end of the semester, I began to look more closely at the
responses given on each questionnaire at different points in the semester. This involved
grouping each student's response to the questionnaire items into three categories: 1)
concepts covered between the beginning of the semester and the first midterm; 2)
concepts covered between the first and the second midterm; and, 3) concepts covered
between the second midterm and the final exam. These groups were applied to responses
on both the beginning and end of semester questionnaires. The responses to each
questionnaire were analyzed separately.
Using Pearson's correlation and testing for two-tailed significance, I found that at
the beginning of the semester, self-efficacy scores at all points in the semester on the
MSE were significantly correlated (p<.01) and strongly related (r ranges from .69 to 39).
These results are shown in Table 8. They indicate that at the beginning of the semester
students had similar self-efficacy levels for all topics in the course. For example, if a
student had a high self-efficacy for concepts covered at the beginning of the course, their
self-efficacy remained high for topics covered in the middle of the course and at the end
of the course.

Table 8: Beginning of semester MSE correlations
(N=56) Beginning of
Semester MSE -
Beginning of Semester Pearson MSE - start to first Correlation
I midterm
** Correlation i s significant at the 0.01 level (2-tailed).
Beginning of Semester MSE -
start to first midterm
MSE - first midterm to Correlation second midterm Beginning of Semester Pearson MSE - second midterm Correlation
An examination of self-efficacy scores provided from the questionnaire at the end
Beginning of Semester MSE -
Beginning of Semester Pearson
~,
of the semester revealed similar information. As with the beginning of the semester, MSE
first midterm to second midterm
.73(**) ~,
.73(**)
.69(**)
scores at the end of the semester for all course topics were significantly correlated
second midterm to final
.69Y)
(p<.01). The strength of their relationships is even stronger, and ranged from r=.84 to
.89(**)
r=.92. These results are shown in Table 9. These results indicate that self-efficacy ratings
.89(**)
at both the beginning and the end of the semester were similar for all topics covered
throughout the semester, implying that students who had lower self-efficacy ratings at the
beginning of the semester tended to have lower self-efficacy ratings at the end of the
semester, and students who had higher self-efficacy ratings at the beginning of the
semester tended to have higher self-efficacy ratings at the end of the semester.

Table 9: End of semester MSE correlations
N=56
Mathematics Self-Efficacy Questionnaire (MSE) and Performance
End of Semester MSE - Pearson start to first midterm Correlation End of Semester MSE Pearson - first midterm to Correlation second midterm End of semester MSE Pearson - second midterm to Correlation
I . .
final exam
Finally, after examining performance scores and then self-efficacy scores
. ,
separately, I began looking at performance and self-efficacy together using o
data. In my first analysis, I used exam scores from the first midterm and mean
efficacy scores for topics covered between the start of the semester and the f i
that were provided on the questionnaire given at the beginning of the semest
would allow me to compare differences in the strength of the relationship be
efficacy and performance at different points in the semester.
Using Pearson's correlation with two-tailed significance testing, I le
relationship between MSE and performance was not significantly correlate
the beginning of the semester. In other words, there was no relationship be
self-efficacy scores at the beginning of the semester and performance on the fir
midterm.
While there were no correlations between self-efficacy for course t
up to the first midterm and the first midterm marks for the entire class, it o
that even though it was a first year class and all students had completed th
End of Semester MSE - start to first
midterm
.92(**)
.84(**)
'* Correlation is significant at the 0.01 level (2-tailed).
End of Semester MSE - first
midterm to second midterm
.92(**)
.go(**)
End of semester MSE - Qecond
midtermto Final
.84(**)
.go(**)

requisite (Math 12), students who had taken Calculus in high school may be more
familiar with the course topics, obtain higher grades, and have higher self-efficacy for
those topics. Using Pearson's correlation with two-tailed significance, I learned that there
was no statistically significant correlation (p .05) between self-efficacy for course topics
covered up to the first midterm and the first midterm marks for students in the top,
middle, or bottom one-third of the class (see Table 10).
Table 10: First midterm scores and MSE
Top 113 of the class I Pearson Correlation
Beginning of the semester MSE (start to 1'' midterm)
- Performance on the lSf midterm
.37
Middle 113 of the class
I ;g. (Ztailed)
Bottom 113 of the class
The relationship between final exam marks and mean self-efficacy scores for all
course topics covered between the second midterm and the end of the semester was
examined next. Pearson's correlation with two-tailed significance testing, indicated that
this relationship was significantly correlated (p<.01). The relationship was also
moderately strong (r=.46). These results may suggest that at the beginning of the
semester the self-efficacy scores for all course topics may be optimistic and reflect a
student's self-efficacy for performance (the expectation of achieving a desired outcome
on a task). However, by the end of the semester, students are aware of their abilities, and
5 6
Pearson Correlation -.05
Sig. (Ztailed)
N
Pearson Correlation
.84
18
-.I 3

their self-efficacy for topic scores reflect their self efficacy for learning, judgments about
ability to accomplish a task and confidence in the skills to perform that task (Lodewyk
and Winne, 2005).
On-line Assignment Marks and Self-Efficacy Scores
In the final phase of analysis for this question, the second method of mathematics
self-efficacy collection, the assignment self-efficacy questions, was compared with
performance. I started this analysis by looking at assignment grades. As you will recall
when I began describing my analysis process for this question, I stated that 175 students
completed the online assignments and these grades were not normally distributed,
Specifically, most students received high grades on these assignments.
One hundred and sixteen students provided self-efficacy data on a question by
question basis. An analysis of self-efficacy data on specific assignment questions
revealed that the scores varied little throughout the semester (see Table 11). The
assignment question self-efficacy scores were grouped into assignments completed
between the start of the semester and the first midterm, assignments completed between
the first midterm and the second midterm, and assignments completed between the
second midterm and the final exam. For each group of assignments, the mean assignment
question self-efficacy scores were calculated by adding the scores for each assigriment
and then dividing by the total number of assignments during that time.

Table 11: On-line Assignment Self-Efficacy Mean Scores
N Valid
Missing
Mean
Median
Mode
Std. Deviation
Minimum
Maximum
Start of Semester to Midterm 1 Average
MSE Score on On-line Assignments
116
11
7.91
8.00
10.00
1.57
3.25
10.00
Midterm 1 to Midterm 2 Average MSE Score on On-line Assignments
l o6
2 1
7.77
8.00
10.00
1.66
3.33
10.00
Midterm 2 to Fil Exam Average A
Score on On-li~ Assignments
The next step would normally be to compare assignment scores with sel5
scores. However, this analysis was not done because there was no change in scor
either measure. Also, as a result of the lack of variance, Cronbach's alpha was nc
calculated.
The analyses for this question indicate that while there was no correlatior
between MSE scores and performance at the beginning of the semester, there wa
correlation between MSE scores and performance at the end of the semester.
Research Question #3
Did the feedback given to students in Dr. Jungic 's course affect students ' mather
self-eficacy?
This research study attempted to answer this question directly by making
efficacy comparisons between students in the on-line group and the paper group.
Unfortunately, the paper group was not viable, as discussed previously.
A second indirect method of answering this question is to examine the
relationships between feedback and performance, and performance and self-effic
fficac y
s for
xtics
elf-
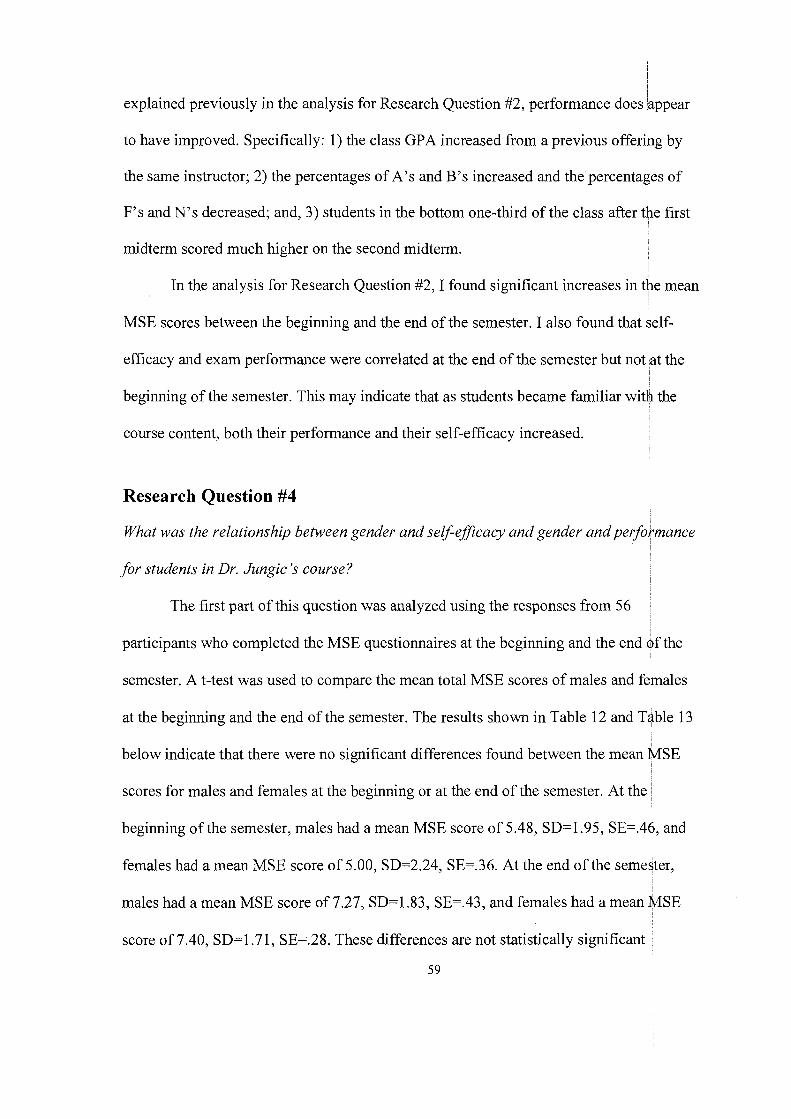
to have improved. Specifically: 1) the class GPA increased from a previous offer
the same instructor; 2) the percentages of A's and B's increased and the percenta
F's and N's decreased; and, 3) students in the bottom one-third of the class after 1
midterm scored much higher on the second midterm.
In the analysis for Research Question #2, I found significant increases in 1
MSE scores between the beginning and the end of the semester. I also found that
efficacy and exam performance were correlated at the end of the semester but no1
beginning of the semester. This may indicate that as students became familiar wii
course content, both their performance and their self-efficacy increased.
explained previously in the analysis for Research Question #2, performance does a
in
EY
~h
Research Question #4
What was the relationship between gender and self-efJicacy and gender andperfc
for students in Dr. Jungic 's course?
The first part of this question was analyzed using the responses from 56
participants who completed the MSE questionnaires at the beginning and the end
semester. A t-test was used to compare the mean total MSE scores of males and f
at the beginning and the end of the semester. The results shown in Table 12 and 1
below indicate that there were no significant differences found between the mean
scores for males and females at the beginning or at the end of the semester. At thc
beginning of the semester, males had a mean MSE score of 5.48, SD=1.95, SE=.'
females had a mean MSE score of 5.00, SD=2.24, SE=.36. At the end of the semt
ppear
g by
:s of
e first
e mean
?If-
it the
the
mance
f the
nales
.ble 13
JlSE
I, and
ter,
males had a mean MSE score of 7.27, SD=1.83, SE=.43, and females had a mean MSE
score of 7.40, SD=1.71, SE=.28. These differences are not statistically significant

(p>.05). The results of the t-test at the beginning of the semester are t(56)=.78, and at the
end of the semester are t(56)=.64.
Table 12: Gender and Mathematics Self-Efficacy Questionnaire Scores
Std. Error Sex N Mean Std. Deviation Mean
Beginning of Semester: Male 18 5.48 1.95 .46 Average MSE Female 38 5.00 2.24 .36 End of Semester: Male 18 7.27 1.83 .43 Average MSE Female 38 7.50 1 .71 .28
Table 13: T-Test with Gender and Mathematics Self-Efficacy Questionnaire Scores
95% ifidence val of the
rence
-, Upper
1 .7l
1.67
Levene's Test for
Equality of -test for Eaualitv of Means
Sig. -
.38
-
C Int
I -
LO\ -
- 1
-1
-
Std. Error
Differe nce
Mean Differe
nce Sig. (2- tailed)
Beginning of Equal Semester: variances Average MSE assumed
Equal variances not assumed
End of Equal Semester: variances Average MSE assumed
Equal variances not assumed
The second part of this research question involved comparing gender anc
performance. As students were only asked for gender information on the MSE
questionnaires, the data used for the analysis in this question was from participai s who

completed the MSE at the beginning of the semester and completed the course (91
participants). The final exam marks for males and females were compared using a t-test.
The results shown in Table 14 and Table 15 below indicate that there were no significant
differences found between the mean total scores for males and females. Males had a
mean total score of 71.06, SD = 12.12, SE = 1.92, and females had a mean total score of
74.45, SD = 12.49, SE=1.75. These differences are not statistically significant (p , .05).
The results of the t-test are t(91) = -1.30.
Table 14: Gender and Performance
I I Std. Error 1 sex
Total Mark Male
Table 15: Gender and Performance T-test
Female 51
N
40
74.45
Total Equal Mark variances
assumed Equal variances not assumed
Mean 71.06
12.49
Std. Deviation 12.12
1.75
Levene's Test for
Equality of Variances
Mean
1.92
t-test for Equality of Means
F
.28
Sig.
.60
95% Confidence lntervai of the
~iffe~rence Mean
Difference
-3.39
-3.39
Sig. (2-
tailed)
.20
.I9
t
-
1.31
Lower
-8.56
-8.55
Std. Error Difference
2.60
2.59
df
89
85.00
Upper
1.78
1.76

DISCUSSION
The research questions for this study were developed after a mathematics
instructor, Dr. Jungic, attended the Re-thinking Teaching Workshop (RTW) o
SFU. After attending the workshop, Dr. Jungic decided to make changes to his
instructional strategy by incorporating an on-line tool called LON-CAPA that
provide students with immediate multiple-try feedback. These changes were ma
because Dr. Jungic hoped that increasing the amount of feedback would increas
student's "self-confidence" and achievement in his Calculus course. After dec
make the changes Dr. Jungic approached me and another researcher, my supervisdr Dr.
Cheryl Amundsen, because he wanted to evaluate the impact of the changes on
"self-confidence" and achievement in his course.
I sought confirmation of Dr. Jungic's beliefs by going to the literature t
about "self-confidence" and its relationship to feedback and performance. I soo
that the term "self-confidence" is rarely used in the literature, and that Bandura'
(Bandura, 1997) term "self-efficacy" matched Dr. Jungic's definition of self-c
After confirming this with Dr. Jungic, I returned to the literature and investigate
relationships between feedback and performance, performance and self-efficacy,
feedback and self-efficacy. Out of interest, I also investigated the role of gend
of these relationships. In addition changes to the instructional strategy were also
documented through interviews with Dr. Jungic.

In the remainder of this chapter, I present a discussion of each of the resel
questions. Following that, I discuss Dr. Jungic's thoughts about the findings and i
the process of engaging in classroom research. Finally I discuss implications and
directions.
Research Question #1
Did increasing the feedbackprovided to students in Dr. Jungic's class effect stud
performance?
Student performance in Math 157 during the Fall 2002 and 2004 semester
compared in this study. Fall 2002 was chosen as the comparison year because it v
only other time that this course had been taught by Dr. Jungic. I chose to only loo
grades from the fall 2002 semester, in an effort to remove any bias that could be
introduced by having multiple instructors. This also means that for both 2002 and
assumed that the students were "typical" in that class. I believe this to be the case
there were no changes to the admission requirements for either SFU or the high sc
admission requirements to the Faculty of Business Administration during this tim
(Simon Fraser University, 2002; Simon Fraser University, 2004) and most studen
taking this course in their first semester of university (78% in 2002 and 80% in 2C
(Simon Fraser University, 2005a; Simon Fraser University, 2005b). However, the
always be fluctuations in performance from year to year due to different abilities (
entering students, and these could have caused the performance differences bet
and 2004.
The analysis of the relationship between feedback and performance of
Dr. Jungic's class may indicate that feedback helped to improve performance.
63
rch
bout
uture
nt
l were
as the
; at the
2004, I
3ecause
hool
s were
34)
e will
f

study, I saw an increase in the percentage of A's and B's and a decrease in the pericentage
of F's and N's. These results are consistent with findings from previous research that
used an on-line tool that provided immediate multiple-try feedback to students in
mathematics courses (Buchanan, 2000; D. A. Kashy et al., 2001; E. Kashy et al., 1998; E.
Kashy et al., 2000; Siew, 2003). Of course, other possibilities such as differences in
teaching and the possibility that the technology motivated students to spend more time on
their course work may have also influenced the improvement in performance.
Further analysis of the increase in grades of students taking Math 157 in Fall 2004
was done in two steps. The first step revealed that overall, students tended to have higher
grades on the second midterm than on the first midterm. In addition, there was
moderately strong (r ranging from .532 to .63 l), significant correlation (p<.01)
grades on the first midterm, second midterm, and final exam. These results are
with previous research which has found that past performance is related to futur
performance (Carmichael & Taylor, 2005; Pajares & Graham, 1999). Therefore
appears that students performed relatively consistently throughout the semester
received similar grades on the first midterm, second midterm, and final exam.
The second step of analyzing the grades of Math 157 students in Fall 20
involved looking at the exam scores of students at the top, middle, and bottom
throughout the semester. This division was made based upon previous research (Bloom,
1984; E. Kashy et al., 1998; E. Kashy et al., 2000). This analysis revealed that: students
in the top one-third of the class performed slightly better on average on the first didterm
than on the second midterm; students in the middle one-third of the class performed
slightly worse on average on the first midterm than on the second midterm; and, students

in the bottom one-third of the class performed quite a bit better on average on the first
midterm than on the second midterm. Taking the class as a while, the mean and niedian
grades decreased between the second midterm and the final exam for all students.
Two components of this analysis stand out. The first component is the slight
decrease in grades between the first and second midterms for students in the top ohe-third
of the class, and the increase in grades between the first and second midterms for Students
in the bottom one-third of the class. According to previous research, this may have
occurred due to a phenomenon referred to as regression to the mean which states
"whenever a pretest-posttest procedure is used to assess learning in an experiment, the
individuals scoring high or low on the pretest will tend to have scores somewhat closer to
the mean on the posttest" (Gall, Gall, & Borg, 1999). The second component of interest is
that students with first midterm exam scores in the bottom one-third of the class had a
larger decrease in grades on the final exam than students in the other two groups. $ome
reasons this may have occurred is because students at the bottom of the class required
more time to finish the exam, or the high assignment marks (most students received
100% on all assignments) created unrealistic performance expectations on the second I
midterm which led to disappointment and lower effort at the end of the class.
Research Question #2 I
What is the relationship between performance and mathematics self-efficacy for students
in Dr. Jungic 's course? Did the relationship between performance and mathematics self-
eflcacy change during the semester?
The relationship between students7 mathematics performance and their
mathematics self-efficacy was analyzed using two methods of collecting self-efficacy
65

information, mathematics self-efficacy questionnaires completed at the beginn
end of the semester (MSE), and asking for mathematics self-efficacy informatio
assignments. Cronbach's alpha for the MSE questionnaire was .95. The analys
MSE indicates that the increase in MSE scores between the beginning and the
semester is statistically significant, MSE scores at the beginning of the semeste
correlated with scores at the end of the semester, and students' self-efficacy sc
topics covered throughout the semester were similar at the beginning of the se
at the end of the semester (p<.05).
There was no correlation found between mathematics self-efficacy sc
beginning of the semester (in particular for topics covered between the start o f t
semester and the first midterm) and performance on the first midterm. At the
class, however, students' mathematics performance is strongly correlated wi
efficacy about specific topics covered in the class. This indicates that in the
the semester, students may not know the expectations for the class or have
expectations for themselves in their first semester of university. But, by th
semester they have a good idea of the grading standards as well as their
course requirements.
The assignment self-efficacy information, unfortunately, did not permit
analysis because most students received 100 percent on all assignments.
Research Question #3 I
Did the feedback given to students in Dr. Jungic S course affect students ' mathematics I
self-eflcacy ? I

An examination of the relationship between feedback and mathematics self
efficacy indicates that student's mathematics self-efficacy improved significantly
between the beginning and the end of the semester. There is also an indication, as
in the discussion for Research Question #2, that overall performance in this class
higher than in the previous class. As there were no students who did not receive
feedback, it is impossible to determine if the improvement in mathematics self-ef
was due to the additional feedback. However, it is possible that student's mathem
self-efficacy improved as a result of feedback, as these results were found in resei
Schunk and Schwartz (1 993). This idea is also supported by research that has fou:
relationships between feedback and performance (Bloom, 1984; Buchanan, 2000;
Clariana, 1993; D. A. Kashy et al., 2001; E. Kashy et al., 1998; E. Kashy et al., 2(
Siew, 2003).
Research Question #4
What was the relationship between gender and self-efJicacy and gender andperfi
for students in Dr. Jungic S course?
An analysis of the MSE scores at both the beginning and the end of the sei
indicates that there were no differences in mathematics self-efficacy for males an(
females. There were also no differences on the final exam scores of males and fen
These results may contradict research by Carmichael and Taylor (2005)who repor
lower self-efficacy scores for females but did not state the score differences. Pajar
(1 999) also found that there were no significant differences between gender and
performance.
-
ltated
ras
cac y
tics
ch by
1
10;
wance
ester
des.
:d
S

Dr. Jungic's Reflections
After completing the results and analysis sections of my thesis I asked Dr. Jungic
to review and comment on my findings, answer a few questions about the overall process
of this study, and discuss the impact of the findings on his future instructional methods.
Thoughts about the Results
In my interview with Dr. Jungic at the beginning of the semester, he co
on the amount of time that was required to set-up the questions in LON-CAPA
(September 2004). After reviewing the results, Dr. Jungic believes that "the fi
justify the effort that was put in creating and managing on-line assignments fo
(August 2006)." He believes that it is good that the findings are in line with pr
research, and he would also like to think that the increase in the percentage of
and N's is related to the immediate feedback provided by LON-CAPA (Augu
course, he realizes while the results of this study do indicate that there were incre
student achievement after making changes to the instructional strategy, it is possi
the increases may have occurred as a result of other factors such as student's prio
achievement or better instruction in this year.
Thoughts about the Process of this Study
When asked to reflect upon the design process of this study, Dr. Jungic stdted that I
I he is happy with the research questions, and believes that "the first three questions
I
represent our exact interest when we decided to analyze the impact of the new tool in
Math 157" (August 2006). He believes that the most exciting (and useful) new fa(t
learned is the concept of regression to the mean (on a pre-testlpost-test, high and low
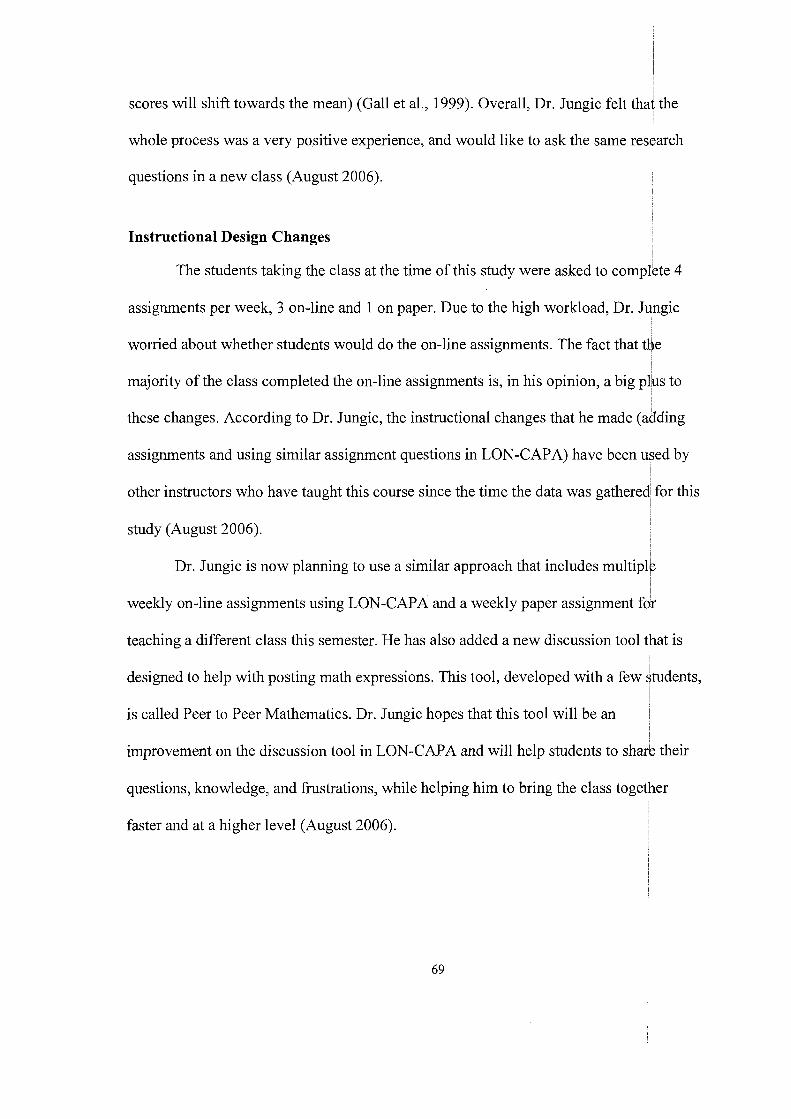
scores will shift towards the mean) (Gall et al., 1999). Overall, Dr. Jungic felt that the I
whole process was a very positive experience, and would like to ask the same resdarch
questions in a new class (August 2006).
Instructional Design Changes
The students taking the class at the time of this study were asked to co
assignments per week, 3 on-line and 1 on paper. Due to the high workload, D
worried about whether students would do the on-line assignments. The fact tha
majority of the class completed the on-line assignments is, in his opinion, a b
these changes. According to Dr. Jungic, the instructional changes that he ma
assignments and using similar assignment questions in LON-CAPA) have b
other instructors who have taught this course since the time the data was g
study (August 2006).
Dr. Jungic is now planning to use a similar approach that includes multi
weekly on-line assignments using LON-CAPA and a weekly paper assignment for
teaching a different class this semester. He has also added a new discussion tool tbat is
designed to help with posting math expressions. This tool, developed with a few qtudents,
is called Peer to Peer Mathematics. Dr. Jungic hopes that this tool will be an
improvement on the discussion tool in LON-CAPA and will help students to shark their
questions, knowledge, and frustrations, while helping him to bring the class together
faster and at a higher level (August 2006).

Limitations
When I began this study, I was aware that I had limited knowledge about the
students taking this class, that there was a high-drop out rate, and that there may be
changes in the exam difficulty from course offering to course offering. The limit:
the first concern, the amount of information that I knew about students in this col
means that the performance improvements that I saw between 2002 and 2004 cot
been simply due to the different backgrounds of students in the course. Learning
about the students in the course would help to eliminate other possible causes of
performance improvements.
The second known limitation at the beginning of the study, a high student
out rate that is normally experienced in the fall semester offering of this course, c
in this course. While I was not directly interested in the reasons students dropped
course, knowing why students dropped-out would have helped me to learn more
students who decide not to take the course. In particular, the performance and
mathematics self-efficacy scores of these students may be different from those w
remained in the course if the course was dropped because it was too difficult or h
large workload. In addition, if I had this information for both 2002 and 2004, I w
have been able to make comparisons between students in these courses.
Finally, the third limitation that I considered at the beginning of the study
possibility of changes in the difficulty level of the assignments and exams. While
possible to be certain that the assignments and exams were at exactly the same le
difficulty, Dr. Jungic believes that they were similar in 2002 and 2004.
kion of
rse,
Id have
nore
drop-
~d occur
the
bout
LO
~d a
uld
was the
it is not
,el of

After conducting the study I became aware of two other limitations, the an -
I
r I
4
s
e
time devoted to coursework may have changed, and the drop-out rate of the papei
submission group. The amount of time students spent on course work is an impor
consideration because more effort is usually related to better performance. In my
is not possible to determine if students spent more time doing their homework aft
changes to the instructional strategy were made. In addition, knowing the amount
spent doing homework by students in both the on-line and the paper submission g
would help to determine if the use of LON-CAPA was related to students spendir
time doing their homework.
The final limitation was the small number of participants that remained in
paper-submission participation group at the end of the semester. Due to resource
limitations, only 15 students who volunteered to be in the paper-submission grouj
placed in that group. Unfortunately, only 3 students remained in this group at the
the semester. The drop-outs meant that I was not able compare the performance o
efficacy between students in the paper submission group with students in the on-1
submission group. These comparisons would have provided more information abc
whether the instructional strategy or the use of LON-CAPA was related to increaa
lount oi-
ant
itudy, it
:r
of time
:oups
g more
the
were
:nd of
self-
ne
ut
:s in
performance and self-efficacy.

FUTURE RESEARCH
In this study, it appears that adding an on-line tool that provided immediate
feedback to the instructional strategy may have influenced the increases in student
performance and mathematics self-efficacy. Nevertheless, as all students received the
same instruction and used the on-line tool, it is not possible to differentiate improbements
related to changes to the instructional strategy from the feedback provided by the tool. I
This is an area that was also not addressed in previous studies that have used similar tools
(Buchanan, 2000; D. A. Kashy et al., 2001; E. Kashy et al., 1998; E. Kashy et al.,2000;
Siew, 2003). Distinguishing the tool from the instructional strategy would help to address
the question of whether the grade and self-efficacy increases were due to changes to the
instructional strategy or the feedback provided by the tool. Some insight into this issue
I could be revealed by repeating this study with the same class and by gathering self-
I
efficacy data in future courses. ,
A second area of research would involve providing students with different types I
of feedback, possibly using different methods. While Dr. Jungic appears to believe that
LON-CAPA was a major contributor to these benefits, it is not possible to determine if
the same results could have been achieved if it had been possible to provide the ~ I
additional feedback using teaching assistants. Research in this area would povide insight
into the type of support that is most effective for these students. I
A third area of research is to consider the impact of feedback and discussidn
groups on achievement and mathematics self-efficacy separately. As both were part of 72

LON-CAPA, it is not possible to determine if the feedback, discussion, or a combination
i of these was the best contributor to the increase in achievement and self-efficacy. The
I
findings from this study would add to research by Pascarella (2002) and ~ortemeker
(2006). Specifically, an examination of the relationship between self-efficacy, the1 number ~ of tries, and the amount of time between tries, would add to Pascarella's (2002) risearch ~ that indicated that multiple-try feedback may encourage students to simply guess the
I answer rather than helping them to engage in deep learning. Kortemeyer's (2006)~
analysis of discussion postings that found a positive correlation between the nun
conceptual-level statements made by a student and their achievement in the clas!
also be enhanced by adding self-efficacy information as it may provide some
understanding of a student's self-efficacy level when the post was made.
jer of
could

CONCLUSIONS
Classroom research studies, such as this one, can provide valuable insights for
faculty about the nature of student learning. At the heart of research about teaching and
learning is the examination of learning. This activity can simply involve asking students
if they understand what is being taught. It can also be very involved, with instructors
studying new literature, interacting with new colleagues, and exploring new methods of
inquiry (Huber, 2004).
According to Huber (2004), research about teaching and learning, referred to as
the scholarship of teaching and learning, can take many forms.
For many, it may begin and end with inquiry into and documentation of teaching and learning in a single course, or iterations of that course, shared and discussed with campus or disciplinary colleagues. For faculty who have achieved prominence in the scholarship of teaching and learning, like those considered here [in this book], it also includes well-documented classroom innovation, curriculum development, new resources for students and colleagues, grantsmanship, publication in peer-reviewed journals, presentations at conferences and other universities, Web activities, workshops for fellow faculty, participation on national panels and curriculum projects, and elaborations, collaborations, new initiatives, and the like (Huber, 2004, 8).
Dr. Dan Bernstein, now a psychologist and scholar in teaching and learning,
began his career with a simple interest in his students' learning (Huber, 2004). Similar to
Dr. Jungic, he believed that providing students with a lot of feedback would help their
performance. In Dr. Bernstein's first year 350 student Psychology class, students would
take tests, hand them to TA's for immediate grading, meet with the TA as soon as the test

was marked, and then have the opportunity to retake the same test. This approach resulted
in Dr. Bernstein being called in front of the College of Arts and Sciences grade inflation
committee. Fortunately, after explaining his instructional method and showing examples
of exams, he impressed the committee members with evidence of student learning and
was even asked to join the committee!
Unfortunately, it eventually became clear to Dr. Bernstein (as reported in Huber,
2004) that his teaching efforts were not being recognized, and were in fact hurting his
case for tenure and promotion. At one point, a colleague told him,
You've got to stop doing that research you are doing. It's too slow. You know, each person is in the study for two months. You run a couple of people a year. Do something quick. Do it. Get it out. Get tenure, and then you can go back and do the things you think are important (Huber, 2004, 34).
Soon after Dr. Bernstein quit teaching first year courses Eventually, after receiving tenure
and promotion, Dr. Bernstein did return to researching teaching and learning He is now
the Director of the Center for Teaching Excellence at the University of Kansas (Huber,
The obstacles faced by Dr. Bernstein are being faced by many instructors in
higher education. The data gathered for this study took 4 months. While this is a long
time in the research world, in educational terns, it constitutes only 1 semester and 1
course. Without studies like this one, how will faculty understand the impact of the
instructional strategies they use? It is my hope that the notion of the scholarship of
teaching and learning will take root within the SFU culture and that the type of research I
have undertaken with Dr. Jungic will be considered credible in decisions about merit,

tenure and promotion, thus encouraging more classroom research studies such as this one
to be undertaken.
One way to make formal classroom-based research more feasible for faculty is to
create partnerships with graduate students seeking authentic situations in which to
conduct thesis research In this study, the partnership between myself and Dr. Jungic
proved to be interesting and beneficial for both of us. Shorter more informal studies, on
the other hand, have been individually undertaken by some instructors who have
completed workshops like the Rethinking Teaching Workshop (RTW) described in
Background section of the Introduction chapter. These studies have asked fewer, but very
specific questions in an effort to further the instructor's knowledge about the effect of a
specific instructional change on student learning. Both formal and informal studies can
make important contributions to the scholarship of teaching and learning and I believe
that it is important that research like this continue.

APPENDICES
Appendix A: Instructor Consent Letter
Dear Dr. Jungic:
As you know, beginning in Fall 2004 there will be a new instructional initiative in Math 157 at Simon Fraser University. One of the big changes made at this time constituted using an on-line tool called LON-CAPA to provide feedback to students. As this is a relatively new approach to mathematics instruction in North America, there is some debate about the benefits to students for incorporating tools similar to this into instruction. In my Masters thesis in Education, I would like to examine whether there are benefits for students if LON-CAPA is used.
If you choose to participate in this study, you will be asked to participate in two interviews and discuss what changes you planned to make to this class and why you planned to make the changes, the differences between the changes that you planned to make and the changes that you actually made, your expectations for making the changes, and your perception of the impact of these changes. Any information that is obtained during this study will be kept confidential to the full extent permitted by the law. Materials will be maintained in a secure location.
If you have any questions now or at any point during the semester please feel to contact me or my supervisor, Dr. Cheryl Amundsen ([email protected]).
Sincerely,
Marie Krbavac Graduate Student Faculty of Education, SFU e-mail: [email protected]

Appendix B: Mathematics Self-Efficacy Questionnaire
In the column Confidence rate how sure you are that you can complete problems for each of the topics listed below.
Please rate your degree of confidence by recording in each of the blank spaces a number from 0 to 10 using the scale given below.
0 1 can not do at all
Topic
2 3 4 5 6 Moderately certain can do
Functions of a Real Variable Graphs of Functions Straight Lines and Exponential Logarithmic Functions Applications Limits Interest Compounded Continuously Continuity Continuity Applied to Inequalities The Derivative Rules for Differentiation The Derivative as a Rate of Change Differentiability and Continuity Product and Quotient Rules Chain Rule and Power Rule Derivatives of Logarithmic Functions Derivatives of Exponential Functions Implicit Differentiation Logarithmic Differentiation Higher-Order Derivatives Relative Extrema Absolute Extrema on a Closed Interval Concavity Second Derivative Test Applied Maxima and Minima Differentials Elasticity of Demand Functions of Several Variables Partial Derivatives
9 10 Certain can do
Confidence (0- 10)

Applications of Partial Derivatives Implicit Partial Differentiation Higher-Order Partial Derivatives Chain Rule Maxima and Minima for Functions of Two Variables Lagrange Multipliers Lines of Regression

Appendix C: Mathematics Self-Efficacy Practice Questionnaire
Math 157 (Calculus for the Social Sciences I) Mathematics Self-Efficacy Pre-test and Post-test
Student Number: Name: Sex: M F
Practice Rating
To familiarize yourself with the rating form, please complete the practice item first.
If you were asked to walk different distances right now, how confident are you that you can walk each of the distances described below.
Please rate your degree of confidence by recording in each of the blank spaces a number from 0 to 10 using the scale given below.
Confidence Scale
0 1 can not do at all
Distance
4 5 6 7 8 Moderately certain can do
9 10 Certain can do
Confidence (0- 1 0)
Walk 1 km Walk 5 km Walk 10 km Walk 15 km Walk 20 km Walk 25 km Walk 30 km Walk 35 km Walk 40 km


Appendix E: Student Information Letter
Dear Students of Math 1 57:
As you know, this semester is the first time that an on-line tool called LON- CAPA will be used to provide feedback to students taking Math 157. While this is a relatively new approach to mathematics instruction in North America, research has shown that tools such as LON-CAPA can benefit teaching and learning. In my Masters thesis in Education, I plan to learn more about how to use LON-CAPA with instruction to benefit student's self-confidence in mathematics.
If you choose to participate in this study, you will be asked to indicate if you would like to use LON-CAPA to submit assignments or if you would like to submit assignments on paper. Participation will also mean that I am given access to your grades in this course.
If you choose to participate, you will also be asked to do the following: 1. at the beginning of the semester
use the course WebCT site to complete a questionnaire that asks you to state your confidence in specific content areas of the course use the course WebCT site to complete a questionnaire about your self- confidence using computers
2. during the semester (while completing one assignment each week) state how confident you are (on a scale of 0 to 10) that you will be able to correctly answer each assignment question state how confident you are (on a scale of 0 to 10) that you have correctly answered each assignment question
3. at the end of the semester use the course WebCT site to complete a questionnaire that asks you to state your confidence in specific content areas of the course
If you have any questions now or at any point during the semester, please feel to contact me or my supervisor, Dr. Cheryl Amundsen (Cheryl [email protected]). Please note that any information that is obtained during this study will be kept confidential to the full extent permitted by the law. Materials will be maintained in a secure location.
Sincerely,
Marie Krbavac Graduate Student Faculty of Education, SFU e-mail: [email protected]

Appendix F: Informed Consent By Participants in a Research Study
Title: An Examination of Changes to the Instructional Strategy in a First Year Mathematics Course and Student's Mathematics Self-Efficacy and Performance
Investigator Name: Marie Krbavac
Investigator Department: Education
The University and those conducting this research study subscribe to the ethical conduct of research and to the protection at all times of the interests, comfort, and safety of participants. This research is being conducted under permission of the Simon Fraser Research Ethics Board. The chief concern of the Board is for the health, safety and psychological well-being of research participants.
Should you wish to obtain information about your rights as a participant in research, or about the responsibilities of researchers, or if you have any questions, concerns or complaints about the manner in which you were treated in this study, please contac the Director, Office of Research Ethics by email at hweinner@,sfu.ca or phone at 604-268-6593.
Your signature on this form will signify that you have received a document which describes the procedures, possible risks, and benefits of this research study, that you have received an adequate opportunity to consider the information in the documents describing the study, and that you voluntarily agree to participate in the study.
Any information that is obtained during this study will be kept confidential to the full extent permitted by the law. Materials will be maintained in a secure location.
Having been asked to participate in the study named above, I certify that I have read the procedures specified in the Study Information Document describing this study. I understand the procedures to be used in this study and the personal risks to me in taking part in the study as described on the Study Information Document.
I understand that I may withdraw my participation at any time. I also understand that I may register any complaint with the Director of the Office of Research Ethics or the researcher named above or with the Chair, Director or Dean of the Department, School or Faculty as shown below.

Dr. Paul Shaker Dean Faculty of Education 8888 University Way Simon Fraser University Burnaby, British Columbia V5A 1 S6 Canada
I may obtain copies of the results of this study, upon its completion by contacting Ms. Marie Krbavac (krbavac@,sfu.ca).
I have been informed that the research will be confidential.
I understand the risks and contributions of my participation in this study and agree to participate.
I would like to participate in the group that (please select one group): Submits assignments on paper or Submits assignments using LON-CAPA
Participant Last Name: Participant First Name: Participant Student Number: Participant E-mail address: Participant Signature: Date (use format MM/DD/YYYY):

REFERENCE LIST
Amundsen, C., Weston, C., & McAlpine, L. (2005). Course design and teaching development: Multiple windows for understanding impact. European Association for Research on Learning and Instruction (EARLI), Cyprus.
Analytical Studies. (2006). Profile of students in math 157
Bandura, A. (2001). Guide for constructing self-eflcacy scales (revised). Unpublished manuscript.
Bandura, A. (1 997). Self-eflcacy the exercise of control. New York: W.H. Freeman and Company.
Bandura, A. (1 977). Self-efficacy: Toward a unifying theory of behavioral change. Psychological Review, 84(2), 19 1-2 15.
Betz, N. E., & Hackett, G. (1983). The relationship of mathematics self-efficacy expectations to the selection of science-based college majors. Journal of Vocational Behavior, 23, 329-345.
Bloom, B. (1 984). The 2 sigma problem: The search for methods of group instruction as effective as one-to-one tutoring. Educational Researcher, l3(6), 4- 16.
Buchanan, T. (2000). The efficacy of a world-wide web mediated formative assessment. Journal of Computer Assisted Learning, 16, 193-200.
Carmichael, C., & Taylor, J. A. (2005). Analysis of student beliefs in a tertiary preparatory mathematics course. International Journal of Mathematical Education in Science and Technology, 36(7), 7 13-71 9.
Cassidy, S., & Eachus, P. (2002). Developing the computer user self-efficacy (CUSE) scale: Investigating the relationship between computer self-efficacy, gender and experience with computers. Journal of Educational Computing Research, 26(2), 133-153.
Clariana, R. (1 993). A review of multiple-try feedback in traditional and computer-based instruction. Educational Researcher, 20(3), 67-74.
Clark, R. (1 994). Media will never influence learning. Educational Technology Research and Development, 42(2), 21 -29.
Clark, R. (1 983). Reconsidering research on learning from media. Review of Educational Research, 43(4), 445-459.

Gall, J. P., Gall, M. D., & Borg, W. R. (1999). Applying educational research. A practical guide (fourth ed.). United States: Addison Wesley Longman, Inc.
Groves, R. M. (2004). Survey methodology. Hoboken, NJ: John Wiley
Hackett, G., & Betz, N. E. (1 989). An exploration of the methematics self- efficacy/mathematics performance correspondence. Journal for Research in Mathematics Education, 20(3), 26 1-273.
Huber, M. T. (2004). Balancing acts: The scholarship ofteaching and learning in acade'mic careers. Washington, DC: American.Association for Higher 'Education and The Carnegie Foundation for the Advancement of Teaching.
Kashy, D. A., Albertelli, G., Kashy, E., & Thoennessen, M. (2001). Teaching with ALN technology: Benefits and costs. Journal of Engineering Education, October, 499- 505.
Kashy, E., Thoennessen, M., Tsai, Y.,'Davis, N. E., & Albertelli, G. (2000). Melding network technology with traditional teaching: Enhanced achievement in a 500 student course. In D. G. Brown (Ed.), Interactive learning vignettesfrom america's most wired campuses (pp. 5 1-55). Bolton, MA: Anker Publishing Company, Inc.
Kashy, E., Thoennessen, M., Tsai, Y., Davis, N. E., & Wolfe, S. L. (1998). Using networked tools to promote student success in large classes. Journal of Engineering Education, 87,3 85-3 9 1.
Kozma, R. (1 994). Media and methods - reply. Educational Technology Research and Development, 43(2)
Kreber, C. (Ed.). (2001). Scholarship revisited: Perspectives on the scholarship of teaching. San Francisco: Jossey-Bass.
Lodewyk, K. R., & Winne, P. H. (2005). Relations among the structure of learning tasks, achievement, and changes in self-efficacy in secondary students. Journal of Educational Psychology, 97(1), 3- 12.
Maxim, P. S. (1999). Quantitative research methods in the social sciences. New York: Oxford University Press.
Pajares, F., & Graham, L. (1999). Self-efficacy, motivation constructs, and mathematics performance of entering middle school students. Contemporary Educational Psychology, 224, 124-1 39.
Pajares, F., Hartley, J., & Valiante, G. (2001). Response format in writing self-efficacy assessment: Greater discrimination increases prediction. Measurement & Evaluation in Counseling and Development, 33(4), 2 14-22 1.
Pietsch, J., Walker, R., & Chapman, E. (2003). The relationship among self-concept, self- efficacy, and performance in mathematics during secondary school. Journal of Educational Psychology, 95(3), 589-603.

Plewis, I. (1 985). Analysing change : Measurement and explanation using longitudinal data. Chichester: J . Wiley.
Saroyan, A., & Amundsen, C. (2004). Rethinking teaching in higher education: From a course design workshop to a faculty development framework. Sterling, Virginia: Stylus Publishing.
Schunk, D. H., & Swartz, C. W. (1993). Goals and progress feedback: Effects on self- efficacy and writing achievement. Contemporary Educational Psychology, 18, 337-354.
Shulman, L. (2000). From minsk to pinsk: Why a scholarship of teaching and learning? The Journal of the Scholarship of Teaching and Learning (JoSoTL), 1 (I), 48-52.
Siew, P. F. (2003). Flexible on-line assessment and feedback for teaching linear algebra. International Journal of Mathematical Education in Science and Technology, 34(1), 43-5 1.
Simon Fraser University. (2005a). Profile of students in SFU courses fall 2002.
Simon Fraser University. (2005b). Profile of students in SFU courses fall 2004.
Simon Fraser University. (2004). Simon fraser university 2004/2005 calendar
Simon Fraser University. (2002). Simon fraser university 2002/2003 calendar