Embed Size (px)
Citation preview
A Close Examination of Jo Boaler’s Railside Report
Wayne BishopDept. of MathematicsCal. State University, LA
Paul CloptonVAMCSan Diego
R. James MilgramDept. of MathematicsStanford University
Abstract: Jo Boaler, an Associate Professor at the Stanford School of Educationhas just published an already well known study of three high schools that she calledHillside, Greendale, and Railside. This study makes extremely strong claims fordiscovery style instruction in mathematics, and consequently has the potential toaffect instruction and curriculum throughout the country.
As is the case with much education research of this nature, Prof. Boaler hasrefused to divulge the identities of the schools to qualified researchers. Consequently,it would normally be impossible to independently check her work. However, in thiscase, the names of the schools were determined and a close examination of the actualoutcomes in these schools shows that Prof. Boaler’s claims are grossly exaggeratedand do not translate into success for her treatment students. We give the details inthe following article.
Other papers where the researchers have refused to divulge such details as thenames of the schools to qualified researchers have affected and continue to affecteducation policy decisions at the school, state and even national levels. Amongthese papers are Standards, Assessments – and What Else? The Essential Ele-ments of Standards-Based School Improvement, D. Briars - L. Resnick, CRESSTTechnical Report 528, (2000) which has been cited repeatedly as justification for theadoption of Everyday Mathematics in school districts throughout the country, andThe impact of two standards-based mathematics curricula on student achievementin Massachusetts. D. Perda, P. Noyce, J. Riordan, J. for Research in Math-ematics Education, 32(2001), p. 368-398. which has been used to justify theadoption of the mathematics program “Investigations,” developed by TERC. It isworth noting that currently about 19% of U.S. elementary students use EverydayMathematics and between 6% and 9% use Investigations, including many of ourinner city schools.
If we are to reverse the woeful performance of our students it seems crucial thatK-12 education research be subject to the same high standards as are the norm inmedicine and the sciences. As a key step we believe that the analysis here showsthe dangers of accepting the legitimacy of articles such as those mentioned aboveas long as the results cannot be independently studied and verified.
Recently, Dr. Jo Boaler, an Associate Professor at the Stanford School of Education,gave a standing room only talk at the National Meeting of the NCTM1 in Anaheim, CA,and received a tremendously enthusiastic response. She had just explained how the results
1 National Council of Teachers of Mathematics
1
of her NSF2 funded study of three high schools in Northern California had verified themost controversial of the deeply held beliefs of this country’s education schools aboutmathematics education.
The study followed the cohort of students at each school that started ninth grade in2000, used a non-standard set of four tests, interviews, and a number of group projectsto determine the mathematical competency of these students. The students at two of theschools were said to have been taught mathematics using mainly “traditional methods,”but the students at the third were supposed to have been taught using “reform methods”with group learning and detracking, based largely on CPM,3 a high school mathematicscurriculum developed at the University of California, Davis.
The third school, which was called Railside in the study, was claimed to have muchpoorer demographics than the other two, and the students, when tested at the beginningof ninth grade, did significantly worse than the students at the other two schools. However,by the end of the tenth grade these students were outperforming the students at the othertwo schools.
Afterwards, at least two mathematicians that attended the lecture expressed deepscepticism though the prevalent response was unbridled enthusiasm.
Unfortunately, the mathematicians are correct. Dr. Boaler kept the names of theschools private and asked that everyone trust that she had faithfully recorded the outcomesof her study. We were able to determine the identities of these schools. Then we studiedthe considerable amount of data in the California data base relating to these schools, aswell as data requested through the Freedom of Information act or the California PublicRecords Act. This data includes things like school rankings, demographic data, SAT Ioutcomes, AP outcomes and even student level outcomes. Further, the results of thestudents from each of these schools on the entry level CSU4 math skills test are available.The totality of this data does not support her conclusions.
Indeed, there is only one year in the last five where any of these various measures forany cohort of students gives any advantage to the Railside students - the CST5 AlgebraI exams for the ninth grade students in 2003 - and this is the only test data from thatCalifornia database which is reproduced in Prof. Boaler’s report even though these datacannot represent the cohort that is the focus of the report.
We also found evidence that Dr. Boaler obtained her results by focusing on essentiallydifferent populations of students at the three schools. At Railside, her population appearedto consist primarily of the upper two quartiles, while at the other two schools the treatmentgroup was almost entirely contained in the two middle quartiles.
2 National Science Foundation3 College Preparatory Mathematics http://www.cpm.org4 CSU is the California State University system5 California Standards Test
2
Dr. Boaler put her four tests up on her web-site.6 We studied them using standardmethods to verify their content validity and the two post-tests that were relevant to herstudy were found to be, on average, roughly 3 years below the grade level where theywere being administered. Additionally, all four exams had serious mathematical difficul-ties - including mathematically incorrect problems, problems with hidden assumptions, amultiple choice problem with all answer choices incorrect, and a problem that was incor-rectly graded since, even though the problem was not entirely well posed, it was solvable.However, the actual solution was far more difficult than the graders seemed to understand.
Next, we compared the topics covered on these exams with the recommended contentin Algebra I and Geometry. We found that very few of the key topics in these courseswere covered in even the most superficial ways on her exams. Thus, the content validity(see Appendix 3) of these tests was shown to be extremely small. Moreover, when wecompared the results of these tests against standard measures such as SAT I scores, thepredictive validity of these tests was also shown to be negligible.
Thus, whatever was being tested by these exams was unlikely to be relevant to studentoutcomes in the sense of their being able to actually use school mathematics either in theircontinuing educations or in their daily lives.
Using the style in which the Railside report is written we can summarize by saying
Fortunately, there is a clarifying post-script that can be added to the claims of highachievement in mathematics at Railside made in the report. Despite the Railside stu-dents’ achievement on un-validated tests tailored to favor their program and assessinglow-level skills, the students in fact do not perform well on state tests that are morecarefully developed and standards-aligned or on AP or SAT exams. This, togetherwith a careful review of the test items used in the study, makes one extremely skepti-cal of the value of the Railside study’s tests for assessing achievement in mathematics.The Railside students show through AP, SAT, and state assessments that they do nothave a good understanding of mathematics. This phenomenon speaks more to theflawed nature of the tests used in the study than it does to any claim of adequacy orinadequacy in the reform approach at Railside.
6 http://www.stanford.edu/∼joboaler/
3
A Discussion of standard measures of student achievement at the three schools
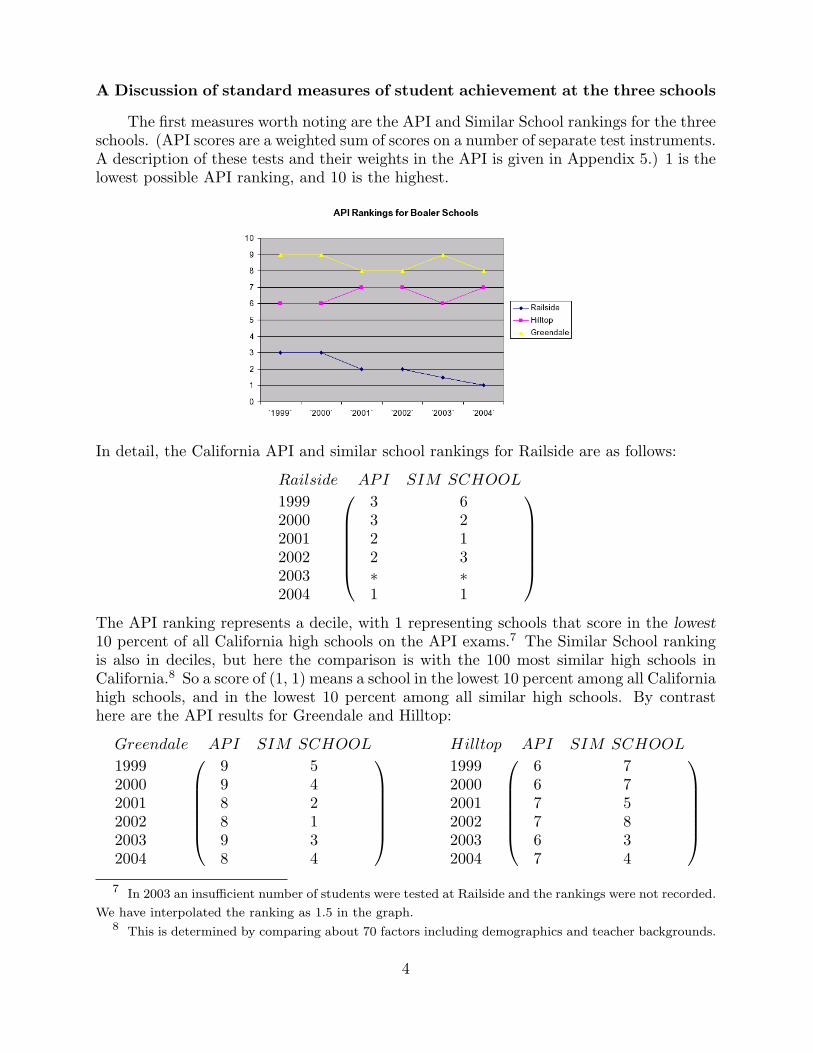
The first measures worth noting are the API and Similar School rankings for the threeschools. (API scores are a weighted sum of scores on a number of separate test instruments.A description of these tests and their weights in the API is given in Appendix 5.) 1 is thelowest possible API ranking, and 10 is the highest.
In detail, the California API and similar school rankings for Railside are as follows:
Railside API SIM SCHOOL
1999 3 62000 3 22001 2 12002 2 32003 ∗ ∗2004 1 1
The API ranking represents a decile, with 1 representing schools that score in the lowest10 percent of all California high schools on the API exams.7 The Similar School rankingis also in deciles, but here the comparison is with the 100 most similar high schools inCalifornia.8 So a score of (1, 1) means a school in the lowest 10 percent among all Californiahigh schools, and in the lowest 10 percent among all similar high schools. By contrasthere are the API results for Greendale and Hilltop:
Greendale API SIM SCHOOL
1999 9 52000 9 42001 8 22002 8 12003 9 32004 8 4
Hilltop API SIM SCHOOL
1999 6 72000 6 72001 7 52002 7 82003 6 32004 7 4
7 In 2003 an insufficient number of students were tested at Railside and the rankings were not recorded.
We have interpolated the ranking as 1.5 in the graph.8 This is determined by comparing about 70 factors including demographics and teacher backgrounds.
4
Remark: It is worth looking at the total group of California high schools, (excludingcharter schools, alternative schools, and other special needs schools) with rankings of1 on the API and 1 among similar schools in 2004. There are 16 of them includingRailside. Among these schools, Railside had the second highest percentage of highlyqualified teachers at 97%, tied for highest level of average parental education, had, by afull 8%, the lowest number of free lunch students and had the fourth smallest number ofESL students.
On the basis of these rankings, there is reason to be concerned that Railside studentswould not do well in college.
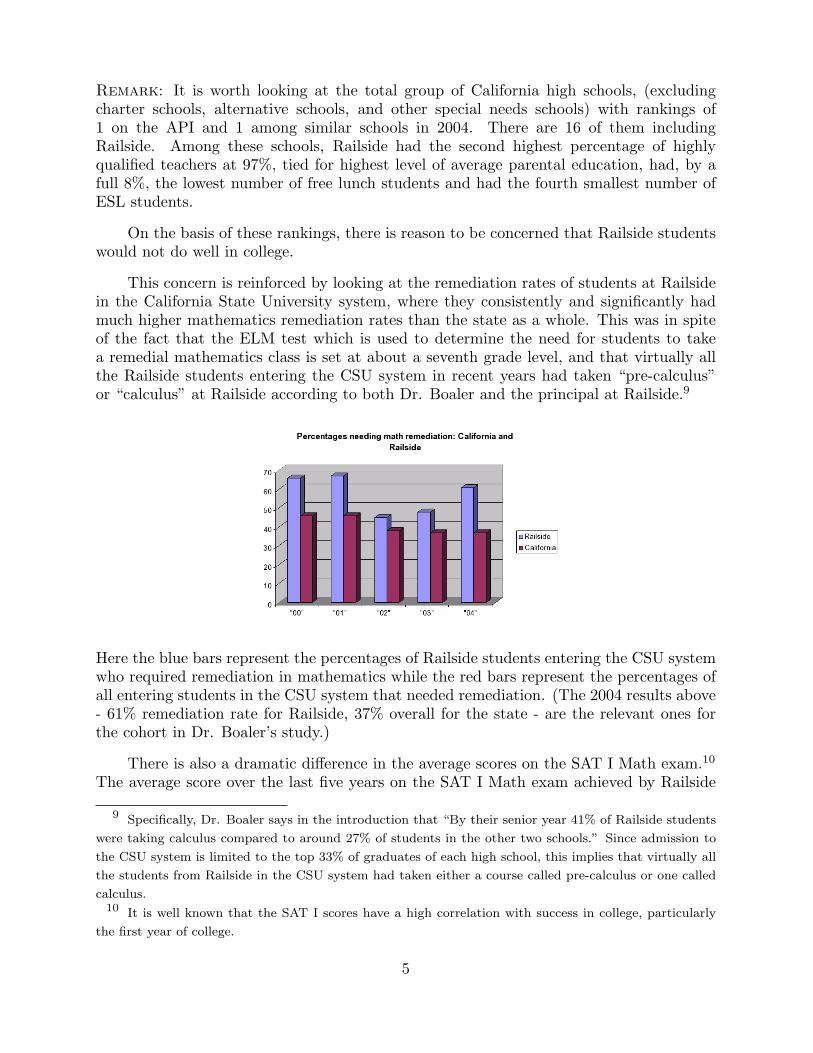
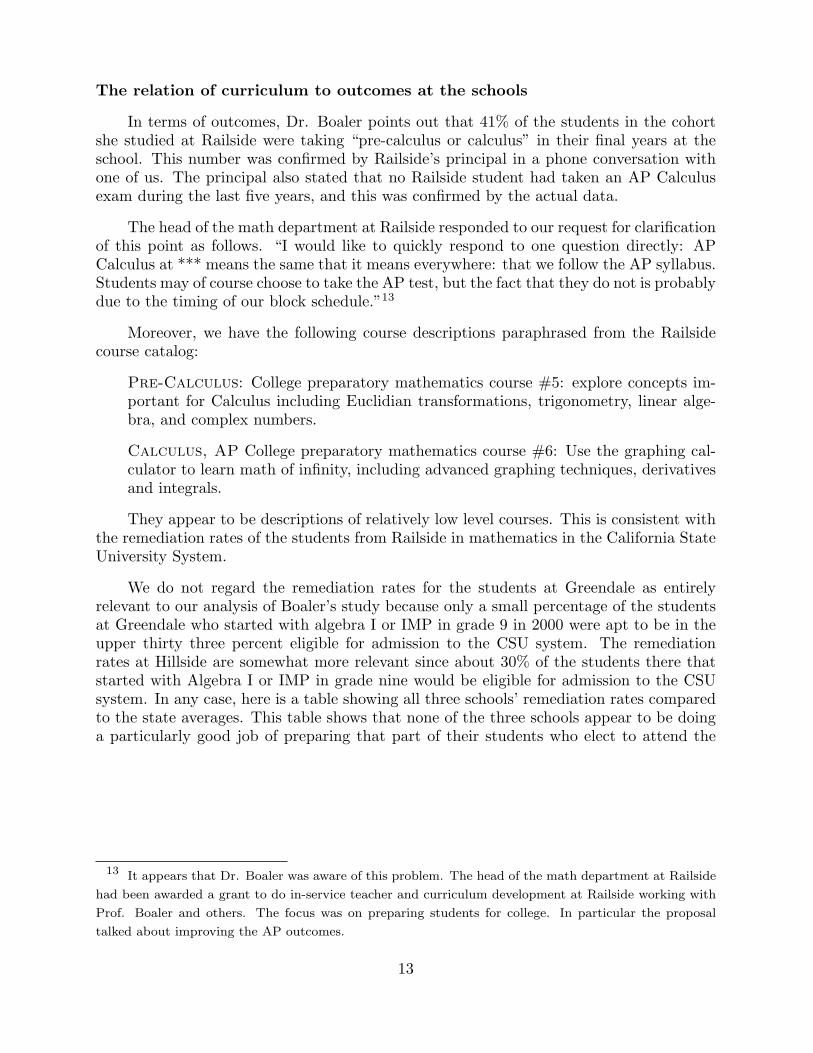
This concern is reinforced by looking at the remediation rates of students at Railsidein the California State University system, where they consistently and significantly hadmuch higher mathematics remediation rates than the state as a whole. This was in spiteof the fact that the ELM test which is used to determine the need for students to takea remedial mathematics class is set at about a seventh grade level, and that virtually allthe Railside students entering the CSU system in recent years had taken “pre-calculus”or “calculus” at Railside according to both Dr. Boaler and the principal at Railside.9
Here the blue bars represent the percentages of Railside students entering the CSU systemwho required remediation in mathematics while the red bars represent the percentages ofall entering students in the CSU system that needed remediation. (The 2004 results above- 61% remediation rate for Railside, 37% overall for the state - are the relevant ones forthe cohort in Dr. Boaler’s study.)
There is also a dramatic difference in the average scores on the SAT I Math exam.10
The average score over the last five years on the SAT I Math exam achieved by Railside
9 Specifically, Dr. Boaler says in the introduction that “By their senior year 41% of Railside students
were taking calculus compared to around 27% of students in the other two schools.” Since admission to
the CSU system is limited to the top 33% of graduates of each high school, this implies that virtually all
the students from Railside in the CSU system had taken either a course called pre-calculus or one called
calculus.10 It is well known that the SAT I scores have a high correlation with success in college, particularly
the first year of college.
5
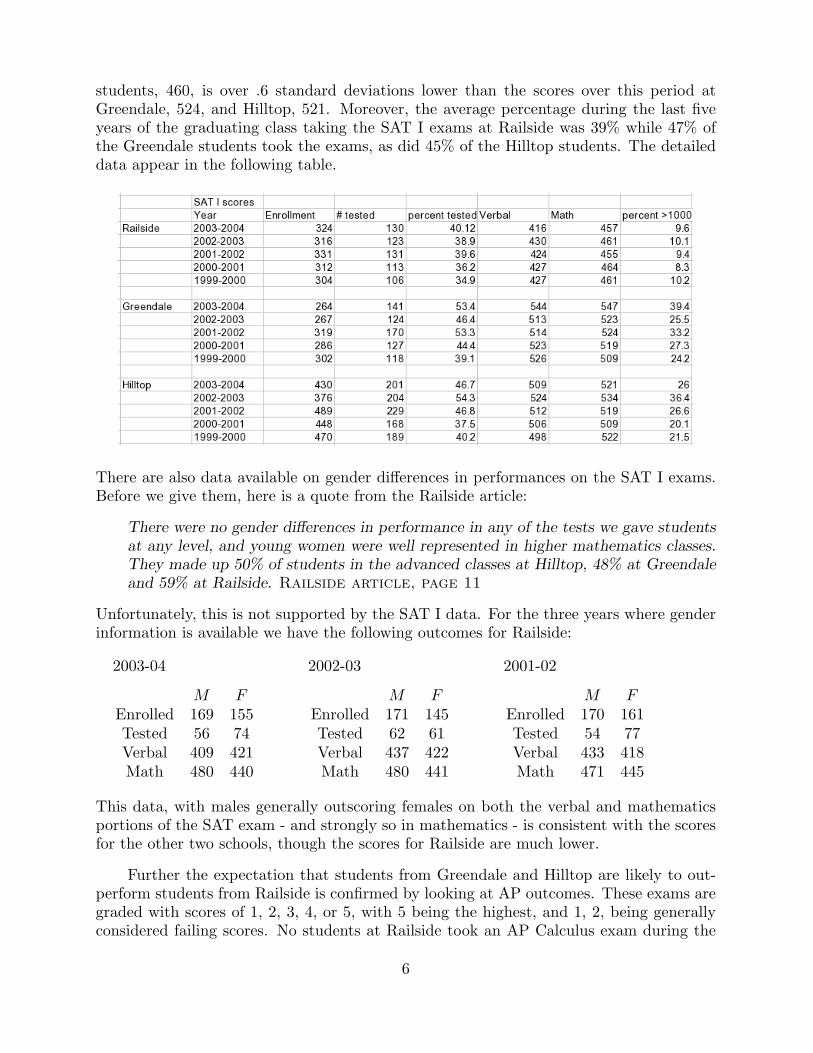
students, 460, is over .6 standard deviations lower than the scores over this period atGreendale, 524, and Hilltop, 521. Moreover, the average percentage during the last fiveyears of the graduating class taking the SAT I exams at Railside was 39% while 47% ofthe Greendale students took the exams, as did 45% of the Hilltop students. The detaileddata appear in the following table.
There are also data available on gender differences in performances on the SAT I exams.Before we give them, here is a quote from the Railside article:
There were no gender differences in performance in any of the tests we gave studentsat any level, and young women were well represented in higher mathematics classes.They made up 50% of students in the advanced classes at Hilltop, 48% at Greendaleand 59% at Railside. Railside article, page 11
Unfortunately, this is not supported by the SAT I data. For the three years where genderinformation is available we have the following outcomes for Railside:
2003-04
M FEnrolled 169 155Tested 56 74Verbal 409 421Math 480 440
2002-03
M FEnrolled 171 145Tested 62 61Verbal 437 422Math 480 441
2001-02
M FEnrolled 170 161Tested 54 77Verbal 433 418Math 471 445
This data, with males generally outscoring females on both the verbal and mathematicsportions of the SAT exam - and strongly so in mathematics - is consistent with the scoresfor the other two schools, though the scores for Railside are much lower.
Further the expectation that students from Greendale and Hilltop are likely to out-perform students from Railside is confirmed by looking at AP outcomes. These exams aregraded with scores of 1, 2, 3, 4, or 5, with 5 being the highest, and 1, 2, being generallyconsidered failing scores. No students at Railside took an AP Calculus exam during the
6
last five years. Greendale was only able to provide us with detailed results for 2003 and2004, but Hilltop provided us with data for 2000 - 2004. The numbers for the CalculusAB exam are
(Greendale 5 4 3 2 12004 7 6 6 5 12003 11 1 2 1 0
)
Hilltop 5 4 3 2 12004 17 10 12 9 22003 8 16 19 7 12002 6 18 9 5 42001 6 9 9 5 142000 5 13 9 15 5
It is worth pointing out that in 2003 one student took and passed the AP Statistics examat Greendale, and 32 took this exam with 23 scoring 3 or better at Hilltop. In 2004 fifteenstudents took this exam, with 9 receiving a score of three or better at Greendale while 35took the exam at Hilltop with 27 scoring 3 or better. However no students took this examat Railside from 2000 - 2004.
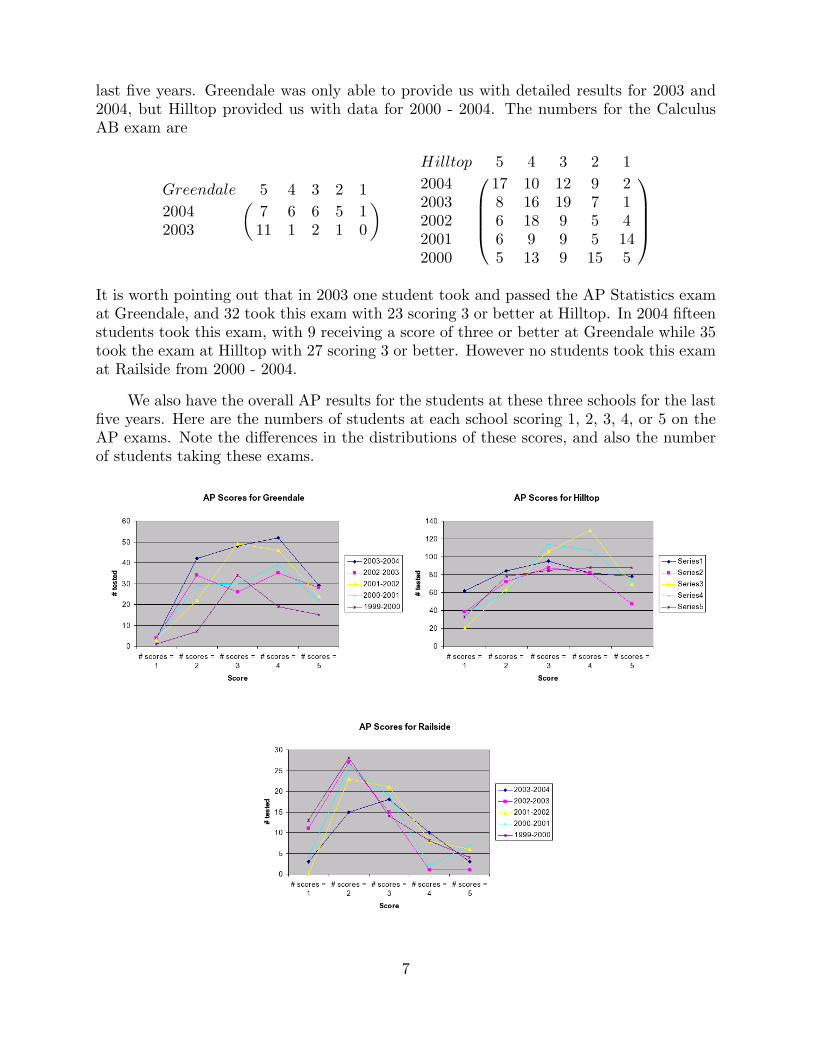
We also have the overall AP results for the students at these three schools for the lastfive years. Here are the numbers of students at each school scoring 1, 2, 3, 4, or 5 on theAP exams. Note the differences in the distributions of these scores, and also the numberof students taking these exams.
7
Filling in the missing data for the Railside Study
“The Railside students were able to achieve at comparable levels after a year of algebrateaching, despite starting the course at significantly lower achievement levels. At theend of Year 2 we gave students a test of algebra and geometry, reflecting the contentthe students had been taught over the first two years of school. By the end of Year2 Railside students were significantly outperforming the students in the traditionalapproach (t = -8.304, p < 0.001, n = 512).” Railside study, page 8
By the end of year 4, 41% of Railside seniors were enrolled in advanced classes of pre-calculus and calculus, compared with 30% of seniors at Hilltop and 23% of seniorsat Greendale. There were no gender differences in performance in any of the testswe gave students at any level, and young women were well represented in highermathematics classes.” Railside study, page 10
The full data available for these schools shows that this glowing description is notaccurate. It is difficult to identify the cohort of students Boaler was studying from thearticle. Indeed, the only point where this is indicated is in the title of her Table 6, where sheindicates that in 2002-2003 the cohort she studies was in grade 11. Thus, her cohort tookninth grade algebra in 2000-2001, and graduated in 2004. Two of the schools, Greendaleand Hilltop, were very unstable during this period. Significant changes were taking placein their mathematics curriculums and there was a great deal of faculty discontent at bothschools. Some faculty left Greendale as the school reinstated its traditional math courses.At the same time a small number of previously retired faculty rejoined the mathematicsstaff.11
“The California Standards test, a curriculum-aligned test taken by students who hadcompleted algebra, showed the Railside students scoring at higher levels than theother two schools (see Table 6). Fifty percent of Railside students scored at or abovethe basic level, compared to 30% at Greendalev and 40% at Hilltop.
“Table 6: California Standards Test, Algebra, 2003. Percent of students attaininggiven levels of proficiency.”
Greendale Hilltop Railside
Advanced 0 0 1Proficient 10 10 20Basic 30 30 30Below basic 60 40 40Far below basic 10 20 20
Railside article, Page 12.
This is a key point where the author is being disingenuous. For one thing, her Table
11 Greendale had been one of the relatively few schools in California that taught the IMP curriculum
exclusively until just before the beginning of Dr. Boaler’s study. The first years of her study at Greendale
coincided with the reintroduction - due to enormous parental pressure - of more traditional math courses.
8
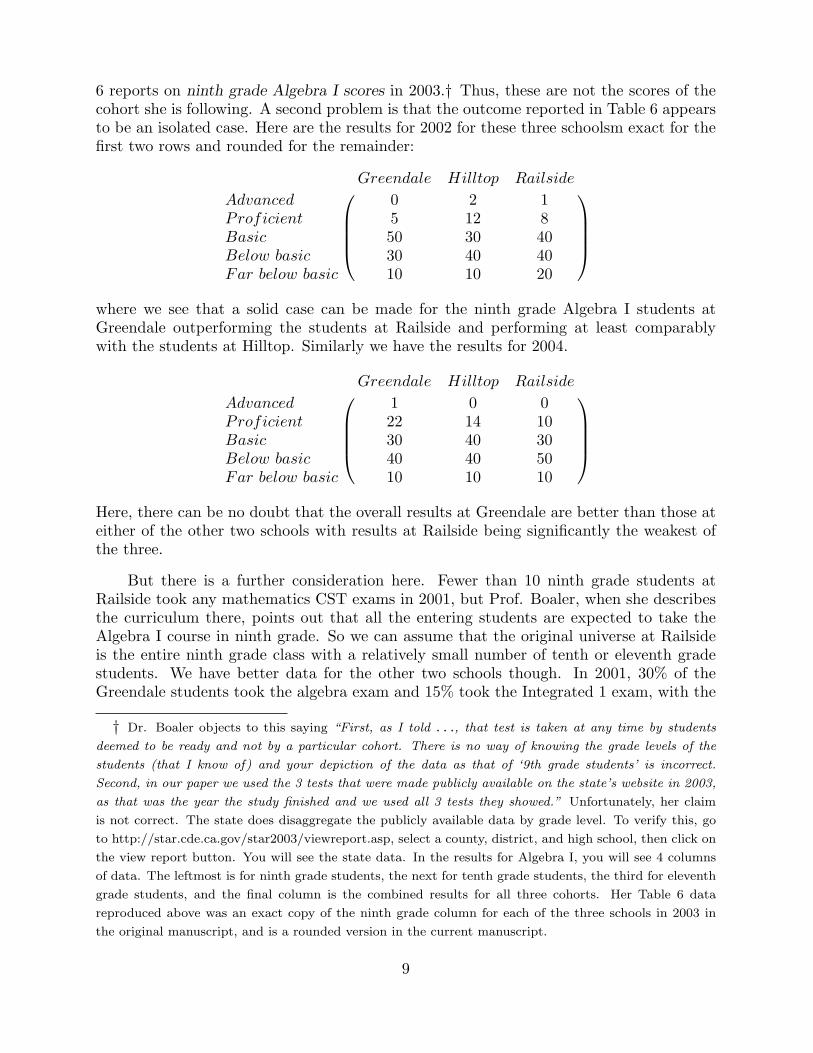
6 reports on ninth grade Algebra I scores in 2003.† Thus, these are not the scores of thecohort she is following. A second problem is that the outcome reported in Table 6 appearsto be an isolated case. Here are the results for 2002 for these three schoolsm exact for thefirst two rows and rounded for the remainder:
Greendale Hilltop Railside
Advanced 0 2 1Proficient 5 12 8Basic 50 30 40Below basic 30 40 40Far below basic 10 10 20
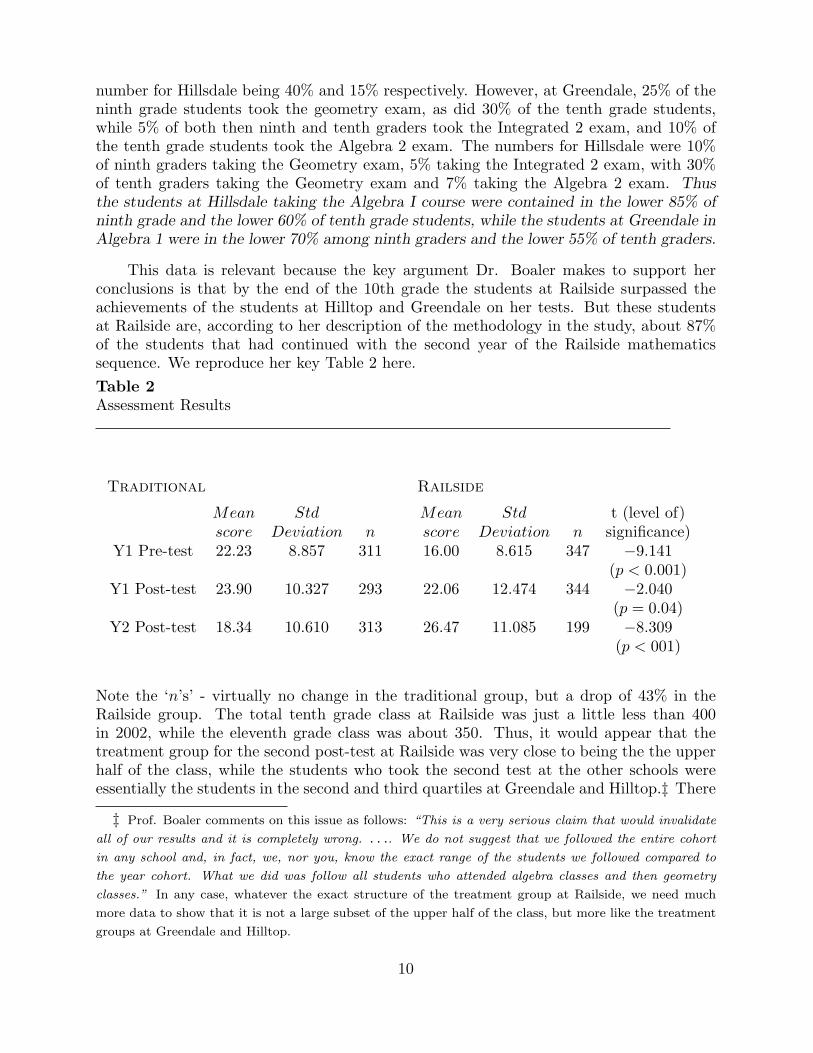
where we see that a solid case can be made for the ninth grade Algebra I students atGreendale outperforming the students at Railside and performing at least comparablywith the students at Hilltop. Similarly we have the results for 2004.
Greendale Hilltop Railside
Advanced 1 0 0Proficient 22 14 10Basic 30 40 30Below basic 40 40 50Far below basic 10 10 10
Here, there can be no doubt that the overall results at Greendale are better than those ateither of the other two schools with results at Railside being significantly the weakest ofthe three.
But there is a further consideration here. Fewer than 10 ninth grade students atRailside took any mathematics CST exams in 2001, but Prof. Boaler, when she describesthe curriculum there, points out that all the entering students are expected to take theAlgebra I course in ninth grade. So we can assume that the original universe at Railsideis the entire ninth grade class with a relatively small number of tenth or eleventh gradestudents. We have better data for the other two schools though. In 2001, 30% of theGreendale students took the algebra exam and 15% took the Integrated 1 exam, with the
† Dr. Boaler objects to this saying “First, as I told . . ., that test is taken at any time by students
deemed to be ready and not by a particular cohort. There is no way of knowing the grade levels of the
students (that I know of) and your depiction of the data as that of ‘9th grade students’ is incorrect.
Second, in our paper we used the 3 tests that were made publicly available on the state’s website in 2003,
as that was the year the study finished and we used all 3 tests they showed.” Unfortunately, her claim
is not correct. The state does disaggregate the publicly available data by grade level. To verify this, go
to http://star.cde.ca.gov/star2003/viewreport.asp, select a county, district, and high school, then click on
the view report button. You will see the state data. In the results for Algebra I, you will see 4 columns
of data. The leftmost is for ninth grade students, the next for tenth grade students, the third for eleventh
grade students, and the final column is the combined results for all three cohorts. Her Table 6 data
reproduced above was an exact copy of the ninth grade column for each of the three schools in 2003 in
the original manuscript, and is a rounded version in the current manuscript.
9
number for Hillsdale being 40% and 15% respectively. However, at Greendale, 25% of theninth grade students took the geometry exam, as did 30% of the tenth grade students,while 5% of both then ninth and tenth graders took the Integrated 2 exam, and 10% ofthe tenth grade students took the Algebra 2 exam. The numbers for Hillsdale were 10%of ninth graders taking the Geometry exam, 5% taking the Integrated 2 exam, with 30%of tenth graders taking the Geometry exam and 7% taking the Algebra 2 exam. Thusthe students at Hillsdale taking the Algebra I course were contained in the lower 85% ofninth grade and the lower 60% of tenth grade students, while the students at Greendale inAlgebra 1 were in the lower 70% among ninth graders and the lower 55% of tenth graders.
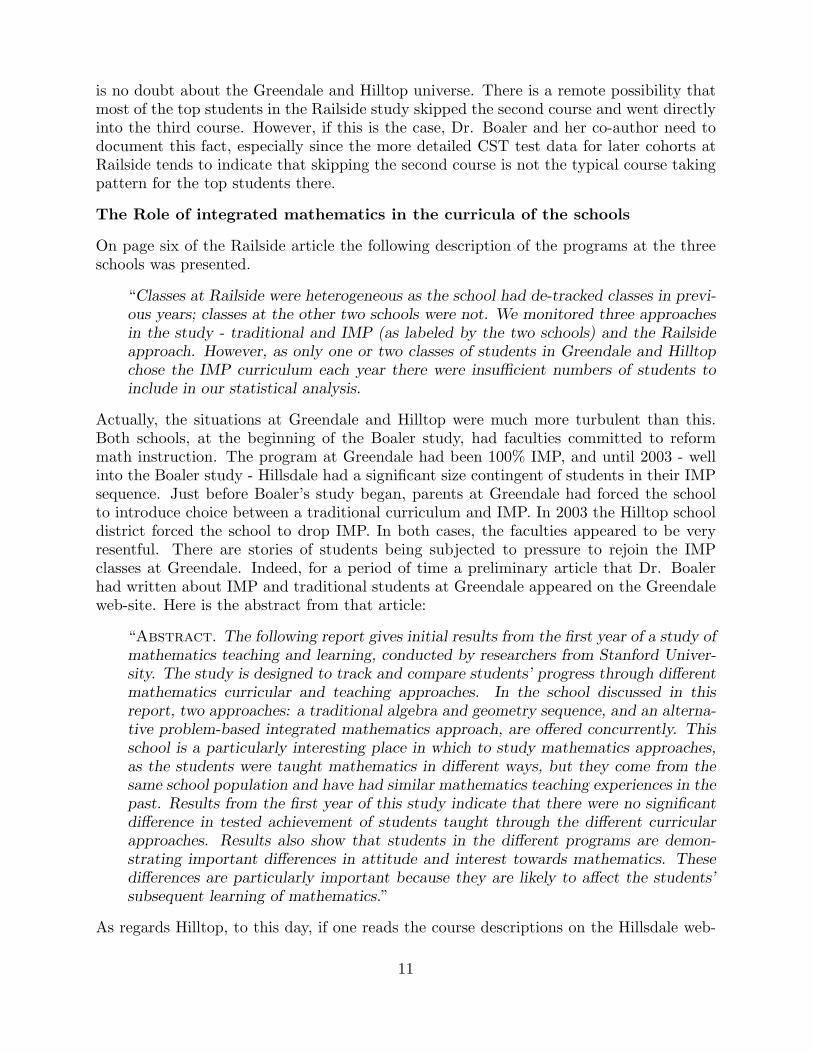
This data is relevant because the key argument Dr. Boaler makes to support herconclusions is that by the end of the 10th grade the students at Railside surpassed theachievements of the students at Hilltop and Greendale on her tests. But these studentsat Railside are, according to her description of the methodology in the study, about 87%of the students that had continued with the second year of the Railside mathematicssequence. We reproduce her key Table 2 here.Table 2Assessment Results
Traditional
Mean Stdscore Deviation n
Y1 Pre-test 22.23 8.857 311
Y1 Post-test 23.90 10.327 293
Y2 Post-test 18.34 10.610 313
Railside
Mean Std t (level of)score Deviation n significance)16.00 8.615 347 −9.141
(p < 0.001)22.06 12.474 344 −2.040
(p = 0.04)26.47 11.085 199 −8.309
(p < 001)
Note the ‘n’s’ - virtually no change in the traditional group, but a drop of 43% in theRailside group. The total tenth grade class at Railside was just a little less than 400in 2002, while the eleventh grade class was about 350. Thus, it would appear that thetreatment group for the second post-test at Railside was very close to being the the upperhalf of the class, while the students who took the second test at the other schools wereessentially the students in the second and third quartiles at Greendale and Hilltop.‡ There
‡ Prof. Boaler comments on this issue as follows: “This is a very serious claim that would invalidate
all of our results and it is completely wrong. . . .. We do not suggest that we followed the entire cohort
in any school and, in fact, we, nor you, know the exact range of the students we followed compared to
the year cohort. What we did was follow all students who attended algebra classes and then geometry
classes.” In any case, whatever the exact structure of the treatment group at Railside, we need much
more data to show that it is not a large subset of the upper half of the class, but more like the treatment
groups at Greendale and Hilltop.
10
is no doubt about the Greendale and Hilltop universe. There is a remote possibility thatmost of the top students in the Railside study skipped the second course and went directlyinto the third course. However, if this is the case, Dr. Boaler and her co-author need todocument this fact, especially since the more detailed CST test data for later cohorts atRailside tends to indicate that skipping the second course is not the typical course takingpattern for the top students there.
The Role of integrated mathematics in the curricula of the schools
On page six of the Railside article the following description of the programs at the threeschools was presented.
“Classes at Railside were heterogeneous as the school had de-tracked classes in previ-ous years; classes at the other two schools were not. We monitored three approachesin the study - traditional and IMP (as labeled by the two schools) and the Railsideapproach. However, as only one or two classes of students in Greendale and Hilltopchose the IMP curriculum each year there were insufficient numbers of students toinclude in our statistical analysis.
Actually, the situations at Greendale and Hilltop were much more turbulent than this.Both schools, at the beginning of the Boaler study, had faculties committed to reformmath instruction. The program at Greendale had been 100% IMP, and until 2003 - wellinto the Boaler study - Hillsdale had a significant size contingent of students in their IMPsequence. Just before Boaler’s study began, parents at Greendale had forced the schoolto introduce choice between a traditional curriculum and IMP. In 2003 the Hilltop schooldistrict forced the school to drop IMP. In both cases, the faculties appeared to be veryresentful. There are stories of students being subjected to pressure to rejoin the IMPclasses at Greendale. Indeed, for a period of time a preliminary article that Dr. Boalerhad written about IMP and traditional students at Greendale appeared on the Greendaleweb-site. Here is the abstract from that article:
“Abstract. The following report gives initial results from the first year of a study ofmathematics teaching and learning, conducted by researchers from Stanford Univer-sity. The study is designed to track and compare students’ progress through differentmathematics curricular and teaching approaches. In the school discussed in thisreport, two approaches: a traditional algebra and geometry sequence, and an alterna-tive problem-based integrated mathematics approach, are offered concurrently. Thisschool is a particularly interesting place in which to study mathematics approaches,as the students were taught mathematics in different ways, but they come from thesame school population and have had similar mathematics teaching experiences in thepast. Results from the first year of this study indicate that there were no significantdifference in tested achievement of students taught through the different curricularapproaches. Results also show that students in the different programs are demon-strating important differences in attitude and interest towards mathematics. Thesedifferences are particularly important because they are likely to affect the students’subsequent learning of mathematics.”
As regards Hilltop, to this day, if one reads the course descriptions on the Hillsdale web-
11
site, the teacher’s attempts to inject IMP style material into courses with traditional namesis clear.
In 2003, Hilltop dropped IMP. The article in the local paper reporting on the reasonsfor dropping it pointed out that more than 90% of the students in the IMP classes scoredbelow or far below basic, with similar scores the year before. Moreover the 2004 studentsdid only slightly better. The article also pointed out that students in the standard mathclasses averaged more than 40 points higher than students in the IMP program.
The same article inplied that the faculty at Hilltop did not entirely accept this decision.In particular, the teachers were said to be critical of using standardized tests to evaluatestudents in the IMP course.
Parental pressure at Greendale in the late 1990’s resulted in the school being forcedto offer ninth grade students a choice between IMP and a more traditional curriculum.Virtually all the students elected the algebra sequence in the first years this choice wasavailable. However, the mathematics faculty was very unhappy with this situation and,with Dr. Boaler observing a number of meetings with parents, they tried to convincemany of the parents to place their children back in the IMP sequence. There was somejustification for this in that in these years the ninth grade students were generally illprepared to handle traditional curricula. The reason was that the students at Greendalehad taken courses with curricula like Connected Math in middle school and MathLandin elementary school. On the other hand there was at least one letter to the editor ofthe local paper from a parent complaining that the school was distributing a great dealof information about IMP but saying very little about the reasons for taking a moretraditional mathematics sequence.
The IMP program at Greendale is still in place, but a nominal number of studentscurrently take it.
12
The relation of curriculum to outcomes at the schools
In terms of outcomes, Dr. Boaler points out that 41% of the students in the cohortshe studied at Railside were taking “pre-calculus or calculus” in their final years at theschool. This number was confirmed by Railside’s principal in a phone conversation withone of us. The principal also stated that no Railside student had taken an AP Calculusexam during the last five years, and this was confirmed by the actual data.
The head of the math department at Railside responded to our request for clarificationof this point as follows. “I would like to quickly respond to one question directly: APCalculus at *** means the same that it means everywhere: that we follow the AP syllabus.Students may of course choose to take the AP test, but the fact that they do not is probablydue to the timing of our block schedule.”13
Moreover, we have the following course descriptions paraphrased from the Railsidecourse catalog:
Pre-Calculus: College preparatory mathematics course #5: explore concepts im-portant for Calculus including Euclidian transformations, trigonometry, linear alge-bra, and complex numbers.
Calculus, AP College preparatory mathematics course #6: Use the graphing cal-culator to learn math of infinity, including advanced graphing techniques, derivativesand integrals.
They appear to be descriptions of relatively low level courses. This is consistent withthe remediation rates of the students from Railside in mathematics in the California StateUniversity System.
We do not regard the remediation rates for the students at Greendale as entirelyrelevant to our analysis of Boaler’s study because only a small percentage of the studentsat Greendale who started with algebra I or IMP in grade 9 in 2000 were apt to be in theupper thirty three percent eligible for admission to the CSU system. The remediationrates at Hillside are somewhat more relevant since about 30% of the students there thatstarted with Algebra I or IMP in grade nine would be eligible for admission to the CSUsystem. In any case, here is a table showing all three schools’ remediation rates comparedto the state averages. This table shows that none of the three schools appear to be doinga particularly good job of preparing that part of their students who elect to attend the
13 It appears that Dr. Boaler was aware of this problem. The head of the math department at Railside
had been awarded a grant to do in-service teacher and curriculum development at Railside working with
Prof. Boaler and others. The focus was on preparing students for college. In particular the proposal
talked about improving the AP outcomes.
13
CSU system, though the outcomes for Railside are clearly the worst of the three.
(Note in particular the results for 2004, which are the results for the cohort of students inDr. Boaler’s study.)
14
The validity of the post-tests used in the Railside study
“Student achievement data. In addition to monitoring the students experiencesof the mathematics teaching and learning we assessed their understanding in a rangeof different ways. At the beginning and end of Years 1 and 2 and at the end of Year 3we administered tests that were carefully written by the research team and consideredby the teachers in each approach to make sure they fairly assessed each approach. Thetest at the beginning of high school was a test of middle school mathematics, as thatwas the mathematics students would be expected to know at that time. At the end ofYear 1 we administered an algebra test. The test was designed to assess only algebraictopics that the students had encountered in common across the different approaches,and we used an equal proportion of question-types from each of the three teachingapproaches. At the beginning of Year 2 we administered the same test, giving us arecord of the achievement of all students starting Year 2 classes. At the end of Year 2we wrote and administered a test of algebra and geometry, again focusing only uponcontent all students had met, using question types from each approach that teachersfrom each approach reviewed, and repeated this process at the end of Year 3.” FromPage 7 of the Railside study
It is non-trivial to assess test validity, and it is clear from the descriptions of themethod of validation given by the author of the Railside study in the last sentence of theparagraph quoted above that no serious attempt was made to validate these tests. SeeAppendix 3 for a short description of the issues involved in test validation.
Without a complete discussion of all these validation issues, it is very difficult, infact really impossible, to evaluate research claims based on a test. There are a numberof aspects of the tests that we cannot evaluate since the tests were only given once andwe do not have access to the student level results on each item in the tests. However, wecan discuss the fourth issue, the extent to which a test measures that which it is supposedto measure. Since the study does not really use the initial pre-test or the third post-testwe will not study these tests. But we will determine the levels of the first and secondpost-tests, measuring them against the California Mathematics Content Standards. Allthree authors of this note helped write the current California mathematics standards.One is a professional mathematics educator, one a professional mathematician, and one aprofessional statistician and they independently evaluated all the parts of each questionon the first and second post-tests. They assigned to each part the California mathematicsstandards that were relevant to that part, and then the grade levels of these assignmentswere averaged to measure the grade levels of each question.
It was found that the first post-test is, on average, written at the 5.7th grade levelwhile the second post-test is, on average, written at the 6.6th grade level. Hence thesetests are approximately 3 years below grade level.
This is somewhat subtle. On superficial examination, it appears that many of thesequestions are at grade level. However, when one looks at the special assumptions and theparticular choices for the given data in each problem, it turns out that very elementarymethods can be used to resolve the questions, at least to the point asked for by the
15
examiners. We use a term coined by the mathematician J. Dancis, and popularized bythe Washington Post education writer and columnist, Jay Mathews, for problems of thesekinds, pretend algebra and pretend geometry.
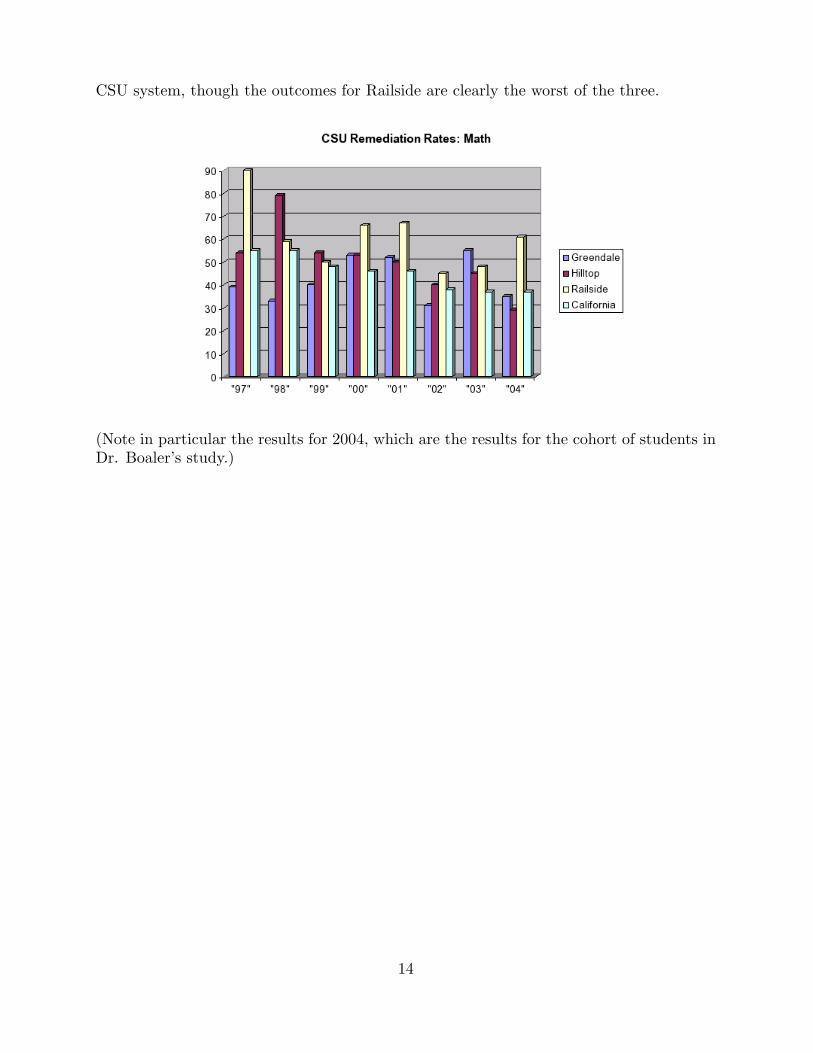
Moreover there are a number of mathematical errors in the problems presented in allfour tests, but particularly in the first post-test. One problem, #9 on the first post-test, isparticularly problematic though it is not incorrect. A discussion of the difficulties with thisproblem comprises the entire fourth appendix to this report. The other difficulties withspecific parts of problems in the first and second post-tests are discussed in the detailedappendices that follow.
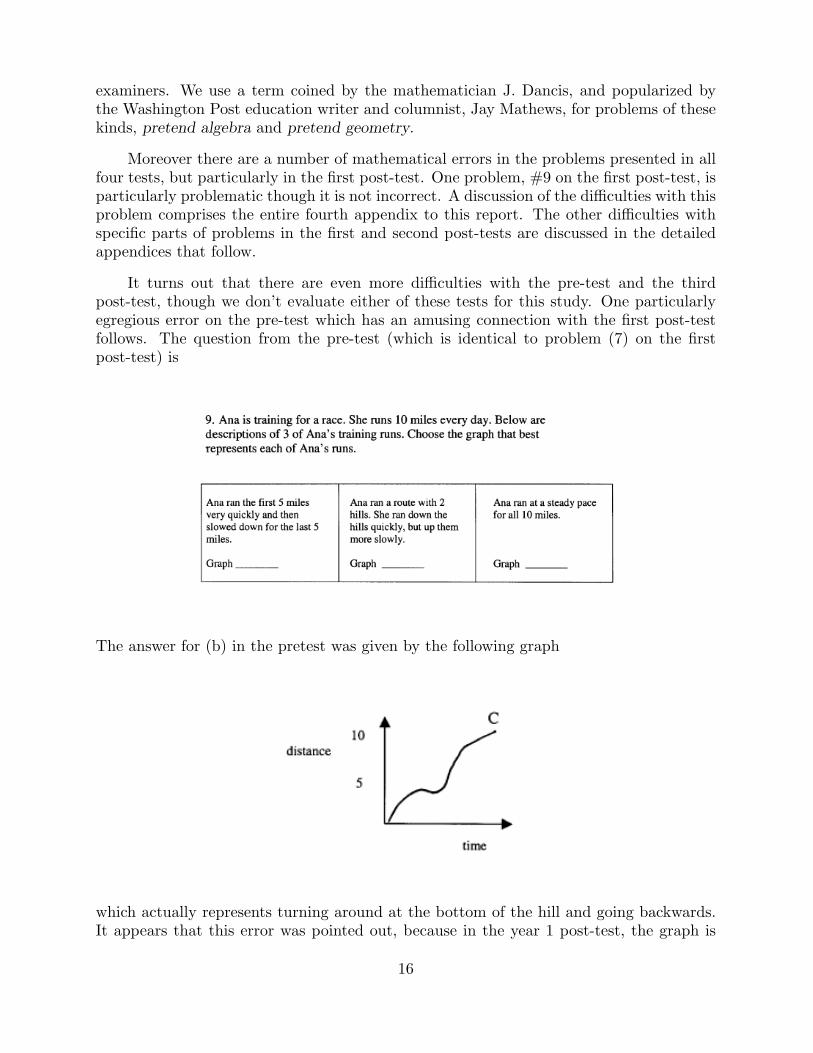
It turns out that there are even more difficulties with the pre-test and the thirdpost-test, though we don’t evaluate either of these tests for this study. One particularlyegregious error on the pre-test which has an amusing connection with the first post-testfollows. The question from the pre-test (which is identical to problem (7) on the firstpost-test) is
The answer for (b) in the pretest was given by the following graph
which actually represents turning around at the bottom of the hill and going backwards.It appears that this error was pointed out, because in the year 1 post-test, the graph is
16
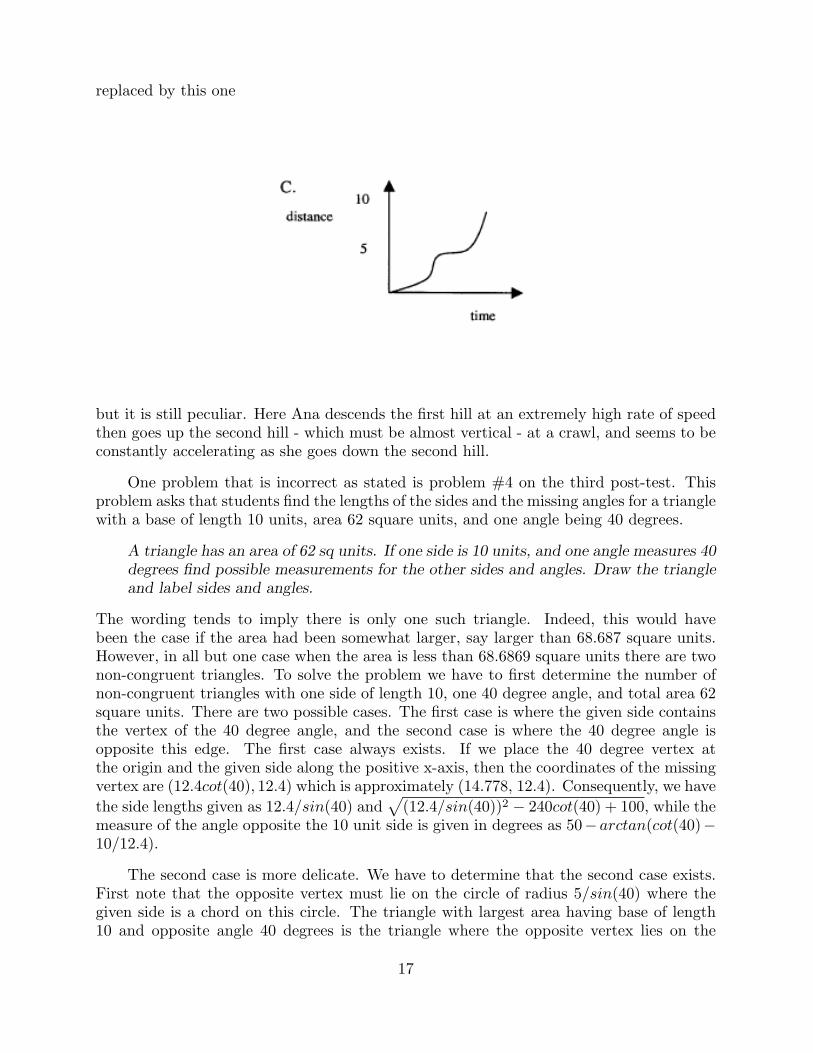
replaced by this one
but it is still peculiar. Here Ana descends the first hill at an extremely high rate of speedthen goes up the second hill - which must be almost vertical - at a crawl, and seems to beconstantly accelerating as she goes down the second hill.
One problem that is incorrect as stated is problem #4 on the third post-test. Thisproblem asks that students find the lengths of the sides and the missing angles for a trianglewith a base of length 10 units, area 62 square units, and one angle being 40 degrees.
A triangle has an area of 62 sq units. If one side is 10 units, and one angle measures 40degrees find possible measurements for the other sides and angles. Draw the triangleand label sides and angles.
The wording tends to imply there is only one such triangle. Indeed, this would havebeen the case if the area had been somewhat larger, say larger than 68.687 square units.However, in all but one case when the area is less than 68.6869 square units there are twonon-congruent triangles. To solve the problem we have to first determine the number ofnon-congruent triangles with one side of length 10, one 40 degree angle, and total area 62square units. There are two possible cases. The first case is where the given side containsthe vertex of the 40 degree angle, and the second case is where the 40 degree angle isopposite this edge. The first case always exists. If we place the 40 degree vertex atthe origin and the given side along the positive x-axis, then the coordinates of the missingvertex are (12.4cot(40), 12.4) which is approximately (14.778, 12.4). Consequently, we havethe side lengths given as 12.4/sin(40) and
√(12.4/sin(40))2 − 240cot(40) + 100, while the
measure of the angle opposite the 10 unit side is given in degrees as 50−arctan(cot(40)−10/12.4).
The second case is more delicate. We have to determine that the second case exists.First note that the opposite vertex must lie on the circle of radius 5/sin(40) where thegiven side is a chord on this circle. The triangle with largest area having base of length10 and opposite angle 40 degrees is the triangle where the opposite vertex lies on the
17
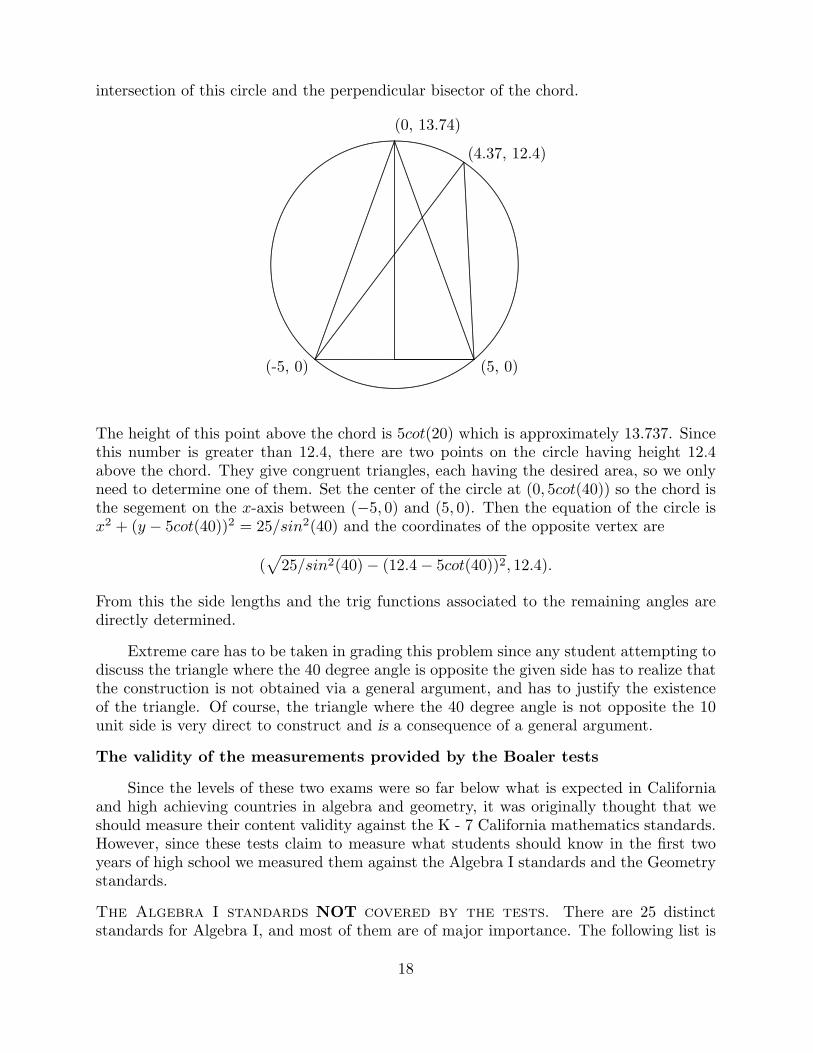
intersection of this circle and the perpendicular bisector of the chord.
...............................................................................................................................................................................................................................................................................................................
.....................
........................
.............................
........................................
....................................................................................................................................................................................................................................................................................................................................................................................................................................................................................................................................................................................................................................................................................................................................................
.........................................
..................................................
.........................................................................................................................................................................................................................................................................................................................................................................................................................................................................................................................................................................................................................................................................................................................................................................................................................................................................................................................................................................................................................................................................................................................................................................................................................................
.......................................................................................................................................................................................................................................................................................................................................................................................................................................................................................................................................................................................................................................................................................................................................................................................................................................................................................................................................................................................
(0, 13.74)
(4.37, 12.4)
(5, 0)(-5, 0)
The height of this point above the chord is 5cot(20) which is approximately 13.737. Sincethis number is greater than 12.4, there are two points on the circle having height 12.4above the chord. They give congruent triangles, each having the desired area, so we onlyneed to determine one of them. Set the center of the circle at (0, 5cot(40)) so the chord isthe segement on the x-axis between (−5, 0) and (5, 0). Then the equation of the circle isx2 + (y − 5cot(40))2 = 25/sin2(40) and the coordinates of the opposite vertex are
(√
25/sin2(40)− (12.4− 5cot(40))2, 12.4).
From this the side lengths and the trig functions associated to the remaining angles aredirectly determined.
Extreme care has to be taken in grading this problem since any student attempting todiscuss the triangle where the 40 degree angle is opposite the given side has to realize thatthe construction is not obtained via a general argument, and has to justify the existenceof the triangle. Of course, the triangle where the 40 degree angle is not opposite the 10unit side is very direct to construct and is a consequence of a general argument.
The validity of the measurements provided by the Boaler tests
Since the levels of these two exams were so far below what is expected in Californiaand high achieving countries in algebra and geometry, it was originally thought that weshould measure their content validity against the K - 7 California mathematics standards.However, since these tests claim to measure what students should know in the first twoyears of high school we measured them against the Algebra I standards and the Geometrystandards.
The Algebra I standards NOT covered by the tests. There are 25 distinctstandards for Algebra I, and most of them are of major importance. The following list is
18
those standards that are not covered in any way, except as noted for 10.0 and 13.0,by any of the questions in these tests.
1.0 Students identify and use the arithmetic properties of subsets of integers, rational,irrational and real numbers. This includes closure properties for the four basic arith-metic operations where applicable.
2.0 Students understand and use such operations as taking the opposite, reciprocal, rais-ing to a power, and taking a root. This includes the understanding and use of therules of exponents.
3.0 Students solve equations and inequalities involving absolute values.
6.0 Students graph a linear equation, and compute the x- and y- intercept (e.g., graph2x + 6y = 4). They are also able to sketch the region defined by linear inequality(e.g., sketch the region defined by 2x + 6y < 4).
7.0 Students verify that a point lies on a line given an equation of the line. Students areable to derive linear equations using the point-slope formula.
8.0 Students understand the concepts of parallel and perpendicular lines and how theirslopes are related. Students are able to find the equation of a line perpendicular to agiven line that passes through a given point.
10.0 Students add, subtract, multiply and divide monomials and polynomials. Studentssolve multistep problems, including word problems, using these techniques. The near-est any problem in the first and second post-tests comes here is #9 of post-test 2 whichsupposes that a rectangular prism with a square base having side length a, height hand is one-third filled with water having a a total volume of W cubic units. Thequestion then asks for the formula in terms of a, W for h, that is, 3W/a2.
11.0 Students apply basic factoring techniques to second and simple third degree poly-nomials. These techniques include finding a common factor to all of the terms ina polynomial and recognizing the difference of two squares, and recognizing perfectsquares of binomials.
12.0 Students simplify fractions with polynomials in the numerator and denominator byfactoring both and reducing to lowest terms.
13.0 Students add, subtract, multiply, and divide rational expressions and functions. Stu-dents solve both computationally and conceptually challenging problems using thesetechniques. The closest any problem in the first and second post-tests comes to thisstandard is #4 of the second post-test which is extensively discussed in Appendix 2,and doesn’t really come close to the level expected here.
14.0 Students solve a quadratic equation by factoring or completing the square.
15.0 Students apply algebraic techniques to rate problems, work problems, and percentmixture problems.
19
16.0 Students understand the concepts of a relation and a function, determine whether agiven relation defines a function, and give pertinent information about given relationsand functions.
17.0 Students determine the domain of independent variables, and range of dependentvariables defined by a graph, a set of ordered pairs, or symbolic expression.
18.0 Students determine whether a relation defined by a graph, a set of ordered pairs, orsymbolic expression is a function and justify the conclusion.
19.0 Students know the quadratic formula and are familiar with its proof by completingthe square.
20.0 Students use the quadratic formula to find the roots of a second degree polynomialand to solve quadratic equations.
21.0 Students graph quadratic functions and know that their roots are the x-intercepts.
22.0 Students use the quadratic formula and/or factoring techniques to determine whetherthe graph of a quadratic function will intersect the x-axis in zero, one, or two points.
23.0 Students apply quadratic equations to physical problems such as the motion of anobject under the force of gravity.
24.1 Students explain the difference between inductive and deductive reasoning andidentify and provide examples of each.
24.2 Students identify the hypothesis and conclusion in logical deduction.
24.3 Students use counterexamples to show that an assertion is false and recognizethat a single counterexample is sufficient to refute an assertion.
25.2 Students judge the validity of an argument based on whether the properties ofthe real number system and order of operations have been applied correctly ateach step.
25.3 Given a specific algebraic statement involving linear, quadratic or absolute valueexpressions, equations or inequalities, students determine if the statement is truesometimes, always, or never.
The geometry standards covered by the tests. Next we look at the geometrystandards that are measured by her tests. As was the case with algebra the Californiageometry standards are limited in number - there are only 22 - but they are very focused,and virtually all of them are essential for students to know. We now list the extremelyfew standards that are covered in even the most superficial way in the two Boaler exams:
5.0 Students prove that triangles are congruent or similar, and they are able to use theconcept of corresponding parts of congruent triangles.
6.0 Students know and are able to use the triangle inequality theorem.
20
9.0 Students compute the volumes and surface areas of prisms, pyramids, cylinders, cones,and spheres; and students commit to memory the formulas for prisms, pyramids, andcylinders.
10.0 Students compute areas of polygons, including rectangles, scalene triangles, equilat-eral triangles, rhombi, parallelograms, and trapezoids.
13.0 Students prove relationships between angles in polygons by using properties of com-plementary, supplementary, vertical, and exterior angles.
15.0 Students use the Pythagorean theorem to determine distance and find missing lengthsof sides of right triangles. This is represented in an extremely weak way by problem#5 of the second post-test, which can be answered without the use of the Pythagoreantheorem if students are aware of the (3, 4, 5) right triangle.
These are all standards that have been, to a large degree, covered in earlier courses.All the basic material that is new to the geometry course, such as ruler and compass con-structions, beginning trigonometry, simple proofs, or the content of the last two standards,
21.0 Students prove and solve problems regarding relationships among chords, secants,tangents, inscribed angles, and inscribed and circumscribed polygons of circles.
22.0 Students know the effect of rigid motions on figures in the coordinate plane and space,including rotations, translations, and reflections.
is simply not represented in these tests.
The Algebra II standards covered by the Boaler tests. There are 24 standardsin the California Algebra II standards. Here are the standards that these tests cover inany way.
2.0 Students solve systems of linear equations and inequalities (in two or three variables)by substitution, with graphs, or with matrices. Of course it must be noted here thatthe only methods expected in these tests are substitution and possibly graphing.
22.0 Students find the general term and the sums of arithmetic series and of both finiteand infinite geometric series. This is represented in and extremely weak way by #2on the pre-test, which is repeated as #7 on the second post-test.
Since these tests are assumed to generally cover just the material in the first algebra courseand the geometry course, we do not regard the lack of any substantive questions about thecontent of the second algebra course as germane. The remarks above are included onlyfor completeness.
Conclusion. We conclude that these tests cannot measure that which they are supposedto measure, and consequently, whether or not they are consistent measurement instru-ments, they are of minimal value in determining student achievement in mathematics atthe ninth and tenth grade levels.
As a consequence of our analysis we can say that it is unrealistic to try to draw any
21
valid conclusions about student mathematics achievement at the high school level basedon the Boaler tests. It is consistent with this conclusion that all the other measures ofstudent achievement we studied gave a dramatically different picture than the Boaler testsdid.
22
Appendix 1: The Evaluation of the Ninth Grade Post-test
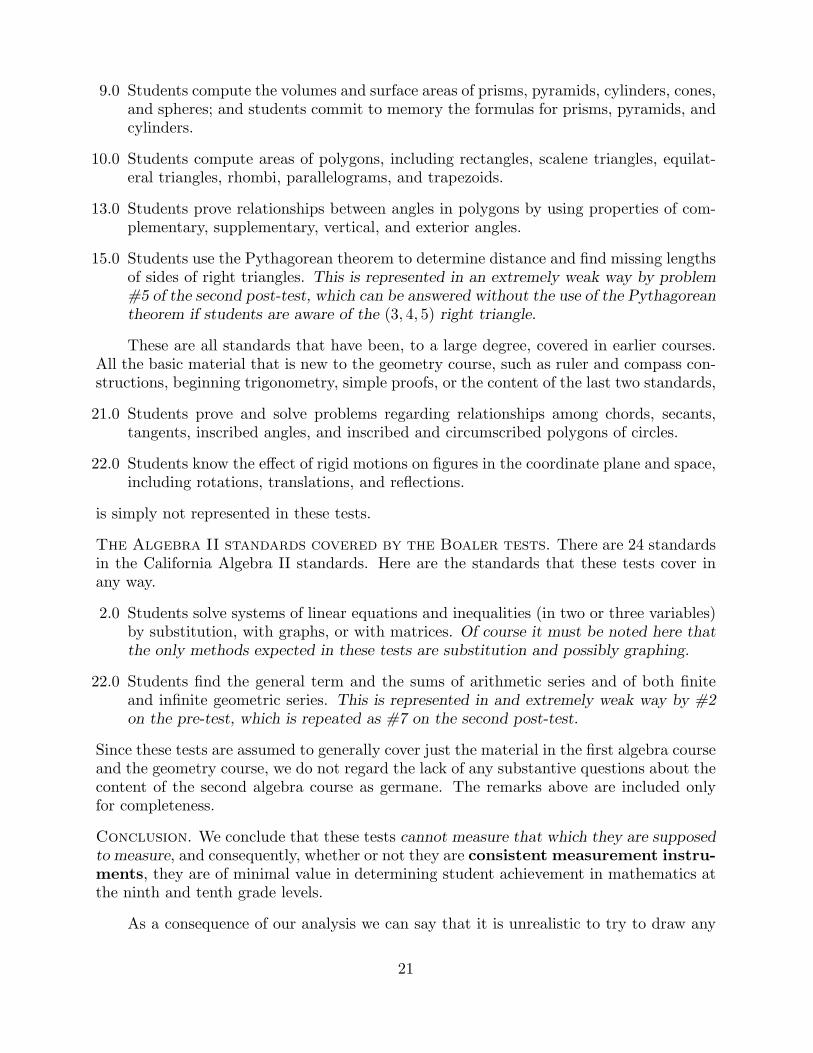
The three authors independently reviewed and evaluated the questions on this testagainst the California Mathematics Standards. All three were involved in writing thesestandards, and consequently were very familiar with them and the levels of competencyexpected for each standard. Their individual comments are presented in detail below,identified by the first letter of the authors last name. Here is a summary chart showingthe grade levels assigned to each part of each problem. (8 means Algebra I.)
As can be seen, there is substantial agreement among the authors as to the grade levelsof the 24 parts of this exam. Since problem #6d was not well posed, two of the threeauthors did not rate it.
The average grade level of the 9 problems 5.7Standard deviation for the 9 problems 1.19
Average grade level of all 23 parts 6.03Standard deviation for the 23 parts 1.13
We now give the detailed evaluation of the problems on this test. Note that a number ofthe problems are ill-posed or otherwise mathematically inappropriate. This will be notedin the comments.
Problem (1) Simplify each expression
a. 5− 3− 4× 2 =
b. 15− 2(4 + 6) =
1(a) (M,B) 6AF1.314 [Order of operations], but the easiest part of it only.
14 The first number in these standards abbreviations is the grade level. Here, 8 means the Algebra
23
(C) 4AF1.2. The problem says simplify, but the test’s authors probably want it solved.It is rather difficult to peg this item to a standard. Order of operations doesn’t showup until 6AF1.3, but by then the student is way beyond what is asked in this problem.One could argue for 3NS2.8 and/or 3AF1.2 for the operations involved. Maybe thefair placement is 4AF1.2 even though parentheses are not involved.
1(b) (M, B, C) 4AF1.3. The illustrative examples are virtually the same.
Problem (2) Using three of these operations (+,−,×,÷) and some numbers, write anexpression that equals 12.
(M) This question is not very well posed - what does the phrase ”using three of theseoperations” mean? I conceive of (0 − 0) × 0 + 12 as a possibility, also a nonsensephrase ”I am using three symbols but they don’t mean anything +,−,×, now I amwriting what I want this expression to be, 12.”
In any case, this is covered by 4AF1.3.
(B) Easy. This problem could be regarded as third grade level, but if students havenever been asked a question of this type before they could have difficulties.
(C) 4AF1.3. This is a fake “real-world” problem - use a specific number of operationsand any numbers you want. In any case, the student is very able to do this with4AF1.3
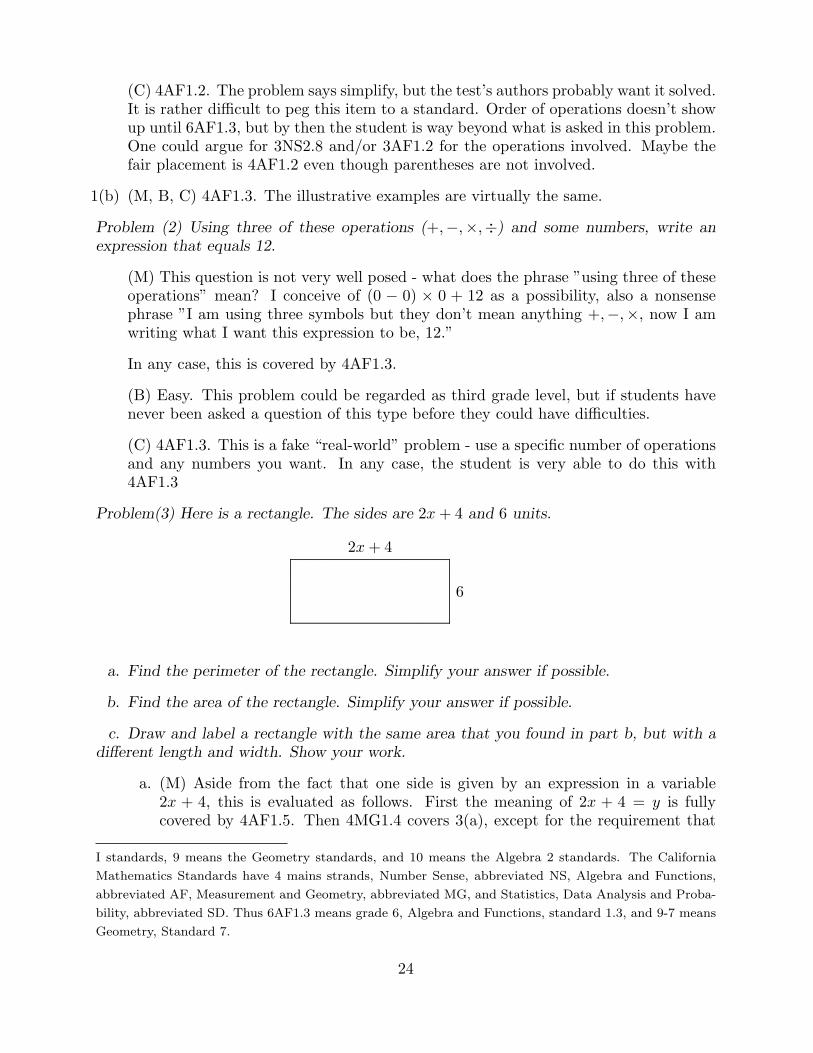
Problem(3) Here is a rectangle. The sides are 2x + 4 and 6 units.
................................................................................................................................................................................................................................................................................................................................................................................................................................................................................................................................................................................................................................................................................................................................
2x + 4
6
a. Find the perimeter of the rectangle. Simplify your answer if possible.
b. Find the area of the rectangle. Simplify your answer if possible.
c. Draw and label a rectangle with the same area that you found in part b, but with adifferent length and width. Show your work.
a. (M) Aside from the fact that one side is given by an expression in a variable2x + 4, this is evaluated as follows. First the meaning of 2x + 4 = y is fullycovered by 4AF1.5. Then 4MG1.4 covers 3(a), except for the requirement that
I standards, 9 means the Geometry standards, and 10 means the Algebra 2 standards. The California
Mathematics Standards have 4 mains strands, Number Sense, abbreviated NS, Algebra and Functions,
abbreviated AF, Measurement and Geometry, abbreviated MG, and Statistics, Data Analysis and Proba-
bility, abbreviated SD. Thus 6AF1.3 means grade 6, Algebra and Functions, standard 1.3, and 9-7 means
Geometry, Standard 7.
24
the resulting value 2(2x + 4) + 2× 6 be “simplified.” Of course, simplification isambiguous. The expression above is pretty simple. Rewrite it as 4x + 20 whichis what I suppose is meant. But almost entirely, the simplification requirementis covered by the standards in 7AF.
(B) Grade 7 is more than generous. 5AF1.3 is not keyed but it is “know anduse the distributive property in equations and expressions with variables,” andperimeter and area are 4MG1.0 unless “understand” doesn’t mean “understandand compute” in which case it moves up to Grade 5. And there is still Grade 6to play with so I’d put it there because of the level of sophistication.
(C) 5AF1.3. The first part of the proble, to write the expression, is 4AF1.1 butwriting expressions also shows at 5AF1.2. It is the “simplify” part of the problemthat is tricky. The standards don’t get to formal simplification of expressions withvariables until Algebra I, but formal simplification is clearly expected in 5AF1.3.Note that the problem is not evaluation because the value of x is never stipulated.
b. (M, B) The formula for the area is covered by 4MG1.4, and the simplificationrequirement is covered by the 7AF1.3.
(C) 5AF1.3. Same argument
c. (M, B) 4MG1.3, 4MG1.4 cover 3(c), except for the explicit method of determiningthe side lengths. This is ambiguous, however what we think they had in mindwas that the area equals 6(2x + 4) = 3× 2× 2(x + 2), so this can be written asa product of an integer side length and a side length involving x in a number ofways, for example 3 and 4(x + 2) or 2 and 6(x + 2) or 4 and 3(x + 2) or even 1and 12(x + 2). If this is what is expected then the correct standards are 5NS1.4,and 4NS4.1, 4NS4.2, together with the weakest form of 8-2.0 (which isn’t reallynecessary here).
(C) 5AF1.3. Same argument
Problem (4) Solve the folowing equations, check your answers and show your work:
a. 5x− 3 = 101 b. 3x− 1 = 2x + 5 c. x2 = 4
(a) (M,B) 5x− 3 = 101. The standards for the basic manipulation of such equationsare 4AF2.0, 4AF2.1 and 4AF2.2. But the explicit requirement to solve such anequation is 5AF1.2.
(C) 6AF1.1. 5AF1.2 calls for evaluation by substitution but this is solving andprobably would not be done by guess and check.
(b) (M) equations of this type, 3x − 1 = 2x + 5, are covered by 7AF4.1, but at ahigher level, since in this seventh grade standard the coefficients can be rationalnumbers.
25
(B) The phrase “two-step” ought to make it clear but it doesn’t because “n-step” is ill defined. Isn’t 2x + 3 = 7 a two-stepper, not just a one step problemas indicated in the example for 6AF1.1?
(C) 7AF4.1. It was difficult for me to classify this one
(c) (M) x2 = 4. In 7NS2.4 the illustrative example is a harder case of this type ofequation.
(B) Does one get negative square roots in 7NS2.4? How do you sketch the square?This is an extremely simple problem for the standard 8-14.0; i.e., it is an instanceof “pretend algebra.”
(C) 5NS1.3. The expression x2 = 4 is not solving a second degree equation, it isknowing what a variable is and what squared is. I see some 5NS1.3 and 4AF1.2here, and also knowing that 2× 2 = 4, which students should know in first grade(1NS2.1).
Problem (5) Use 2 different methods to find where the following two lines intersect. Showyour work.
y = x + 6
y = −2x + 3
(M) I do not know what is meant by “two different methods.” What determines whentwo ways of solving these two equations are “different?”
(B) Maybe the methods are meant to be subtraction, substitution, or graphing. Guessand check should not be acceptable for either of them. To be sure we need to see thescoring rubric though?
(M) Leaving aside the issue that the question is not well posed, the equations them-selves are sufficiently elementary that they can be solved by guess and check, orgraphing. In part, this question is covered by 5AF1.1 and 5AF1.5. It is also coveredby 7AF4.1, and 4AF2.0, 4AF2.1, 4AF2.2. [This is a “pretend algebra” problem. Itlooks like it should represent the true standard 8-9.0, but it does not really rise to thelevel expected there.]
(B) 8-9.0 is where it has to be put, but with a comment that it does not rise to theexpected level.
(C) 8-9.0, but at a very low level. The two ways they are looking for are the fuzzyway (graphic guessing) and tabled guess and check (you have to know that the linesintersect when the same values satisfy both equations). Reluctantly granting AlgebraI on this one.
Problem (6) SuperSlide waterslide park charges $10 for the first 3 rides. Each additionalride costs $2.
a. How much would 34 rides cost? Show your work.
26
b. You spent $18 on rides down the waterslide. How many rides did you take?
c. What rule tells you the cost of n rides?
d. WonderWater park charges $15 for 3 rides and $2 for each additional ride. Whichpark is a better value? Explain why.
a. (M) 6AF1.2 in a weak form (only one variable) is appropriate for 6(a).
(C) 7AF1.1 and 7AF1.2.
b. (M) 6AF1.1 and 6AF1.2 are the relevant standards for 6(b),
(C) 7AF1.1 and 7AF1.2.
c. (M) 6AF1.2 is again the relevant standard for 6(c).
(C) 7AF1.2.
(B) I have a greater objection to 6(a) and 6(b) in that they can be answeredwith only number sense at the fourth or even third grade level with no algebraat all. If the order were reversed with an intro as for #8 and the old (a) and (b)becoming “Using (a), conclude that...” But it’s not. I’d also prefer “function” to“rule” and with the restriction that n be greater than or equal to 3.
d. (B M) Part (d) is not well-posed. Since there is no “correct” answer for this partwe will not consider it.
(C) 7AF1.1, 7AF1.2, 7AF1.5. This is a bad question that we would never allow.One could call it a trick question because there is the implication that one isalways better than the other. Note that I pick grade 7 standards because 6AF1.2
27
calls for evaluation rather than solution.
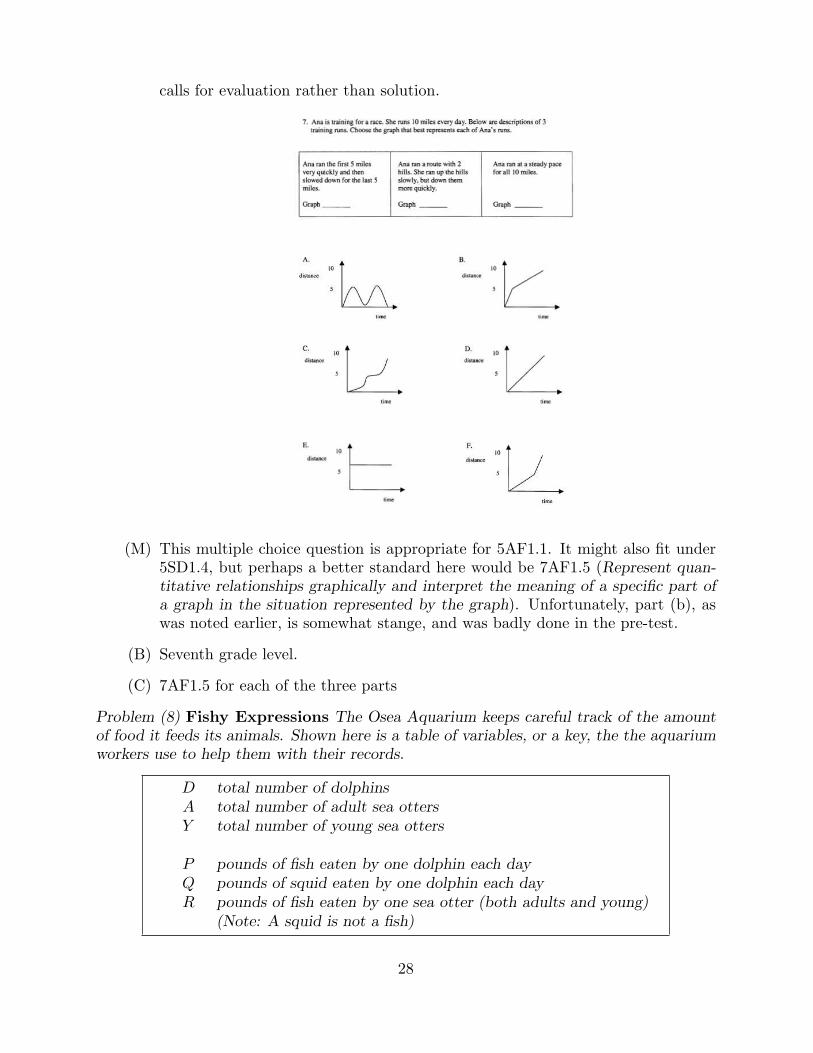
(M) This multiple choice question is appropriate for 5AF1.1. It might also fit under5SD1.4, but perhaps a better standard here would be 7AF1.5 (Represent quan-titative relationships graphically and interpret the meaning of a specific part ofa graph in the situation represented by the graph). Unfortunately, part (b), aswas noted earlier, is somewhat stange, and was badly done in the pre-test.
(B) Seventh grade level.
(C) 7AF1.5 for each of the three parts
Problem (8) Fishy Expressions The Osea Aquarium keeps careful track of the amountof food it feeds its animals. Shown here is a table of variables, or a key, the the aquariumworkers use to help them with their records.
D total number of dolphinsA total number of adult sea ottersY total number of young sea otters
P pounds of fish eaten by one dolphin each dayQ pounds of squid eaten by one dolphin each dayR pounds of fish eaten by one sea otter (both adults and young)
(Note: A squid is not a fish)
28
Use variables to write an expression that represents each of the following:
a. The total number of otters.
b. The total amound of fish needed each day to feed all of the dolphins and all of thesea otters.
c. There are 10 more adult sea otters than young sea otters.
Write a phrase that explains what each of the following expressions represents.
d. Q×D
e. A + Y = 4D
(B,M) All five parts are appropriately covered by the 6AF1.2. They are also covered by7AF1.1.
(C) Parts (a) through (c) and (e), 7AF1.1 at a very low level
d. 7AF1.1 at a very low level, note that this is reverse of what the standard saysbut sometimes one does reverse things on a test
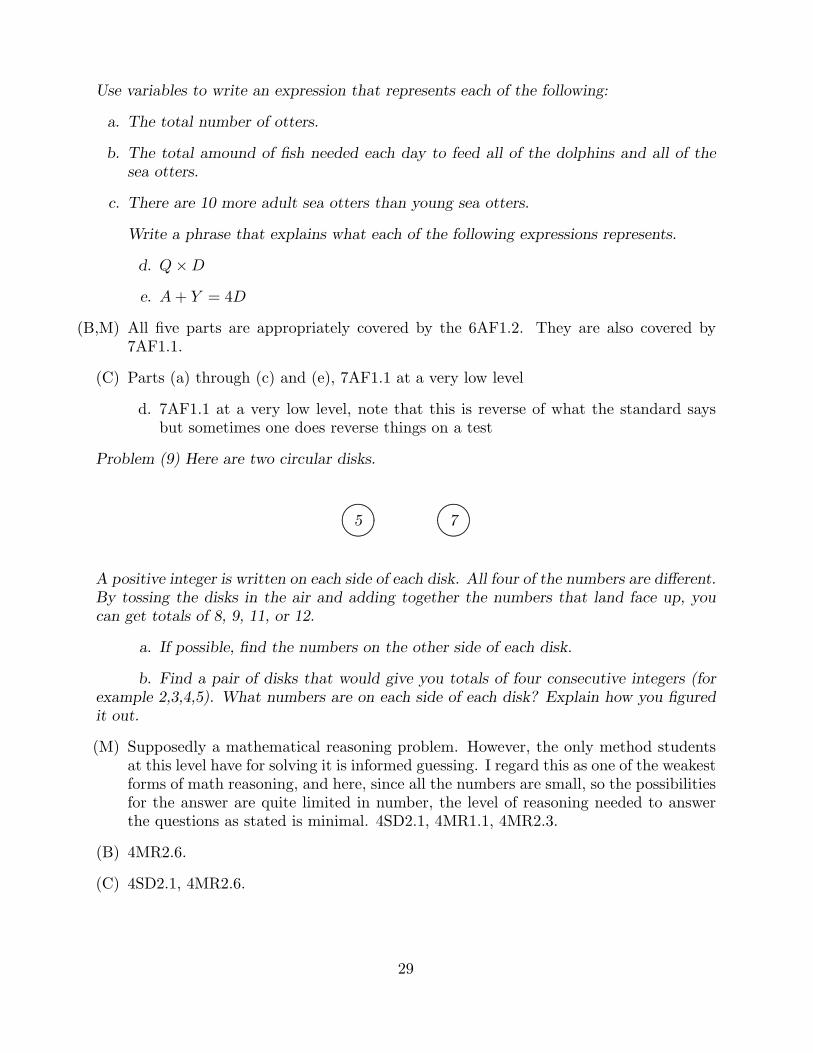
Problem (9) Here are two circular disks.
........
.......................
............................................................................................................................... ............................................................
................................................
..................................................5 7
A positive integer is written on each side of each disk. All four of the numbers are different.By tossing the disks in the air and adding together the numbers that land face up, youcan get totals of 8, 9, 11, or 12.
a. If possible, find the numbers on the other side of each disk.
b. Find a pair of disks that would give you totals of four consecutive integers (forexample 2,3,4,5). What numbers are on each side of each disk? Explain how you figuredit out.
(M) Supposedly a mathematical reasoning problem. However, the only method studentsat this level have for solving it is informed guessing. I regard this as one of the weakestforms of math reasoning, and here, since all the numbers are small, so the possibilitiesfor the answer are quite limited in number, the level of reasoning needed to answerthe questions as stated is minimal. 4SD2.1, 4MR1.1, 4MR2.3.
(B) 4MR2.6.
(C) 4SD2.1, 4MR2.6.
29
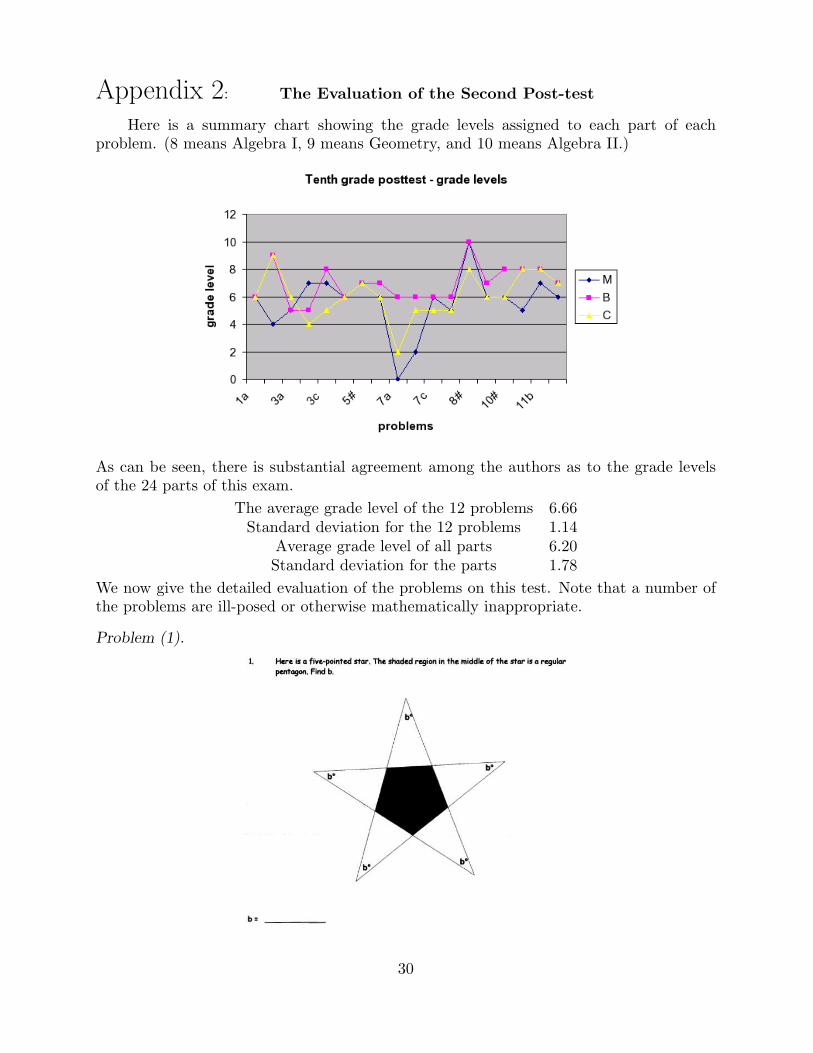
Appendix 2: The Evaluation of the Second Post-test
Here is a summary chart showing the grade levels assigned to each part of eachproblem. (8 means Algebra I, 9 means Geometry, and 10 means Algebra II.)
As can be seen, there is substantial agreement among the authors as to the grade levelsof the 24 parts of this exam.
The average grade level of the 12 problems 6.66Standard deviation for the 12 problems 1.14
Average grade level of all parts 6.20Standard deviation for the parts 1.78
We now give the detailed evaluation of the problems on this test. Note that a number ofthe problems are ill-posed or otherwise mathematically inappropriate.
Problem (1).
30
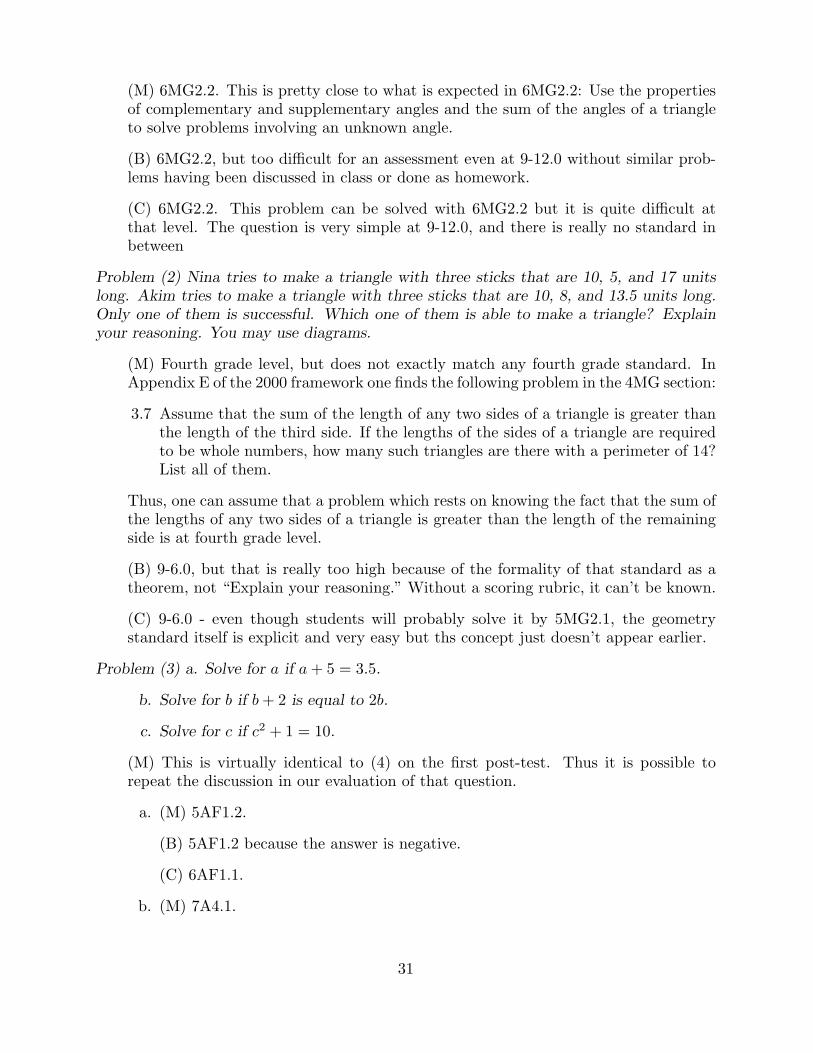
(M) 6MG2.2. This is pretty close to what is expected in 6MG2.2: Use the propertiesof complementary and supplementary angles and the sum of the angles of a triangleto solve problems involving an unknown angle.
(B) 6MG2.2, but too difficult for an assessment even at 9-12.0 without similar prob-lems having been discussed in class or done as homework.
(C) 6MG2.2. This problem can be solved with 6MG2.2 but it is quite difficult atthat level. The question is very simple at 9-12.0, and there is really no standard inbetween
Problem (2) Nina tries to make a triangle with three sticks that are 10, 5, and 17 unitslong. Akim tries to make a triangle with three sticks that are 10, 8, and 13.5 units long.Only one of them is successful. Which one of them is able to make a triangle? Explainyour reasoning. You may use diagrams.
(M) Fourth grade level, but does not exactly match any fourth grade standard. InAppendix E of the 2000 framework one finds the following problem in the 4MG section:
3.7 Assume that the sum of the length of any two sides of a triangle is greater thanthe length of the third side. If the lengths of the sides of a triangle are requiredto be whole numbers, how many such triangles are there with a perimeter of 14?List all of them.
Thus, one can assume that a problem which rests on knowing the fact that the sum ofthe lengths of any two sides of a triangle is greater than the length of the remainingside is at fourth grade level.
(B) 9-6.0, but that is really too high because of the formality of that standard as atheorem, not “Explain your reasoning.” Without a scoring rubric, it can’t be known.
(C) 9-6.0 - even though students will probably solve it by 5MG2.1, the geometrystandard itself is explicit and very easy but ths concept just doesn’t appear earlier.
Problem (3) a. Solve for a if a + 5 = 3.5.
b. Solve for b if b + 2 is equal to 2b.
c. Solve for c if c2 + 1 = 10.
(M) This is virtually identical to (4) on the first post-test. Thus it is possible torepeat the discussion in our evaluation of that question.
a. (M) 5AF1.2.
(B) 5AF1.2 because the answer is negative.
(C) 6AF1.1.
b. (M) 7A4.1.
31
(B) 5AF1.2, but it’s really a guess and check at about Grade 3.
(C) 4AF2.1.
c. (M) 7NS2.4.
(B) 8-14.0, but “pretend algebra” because it’s so simple.
(C) 5NS1.3.
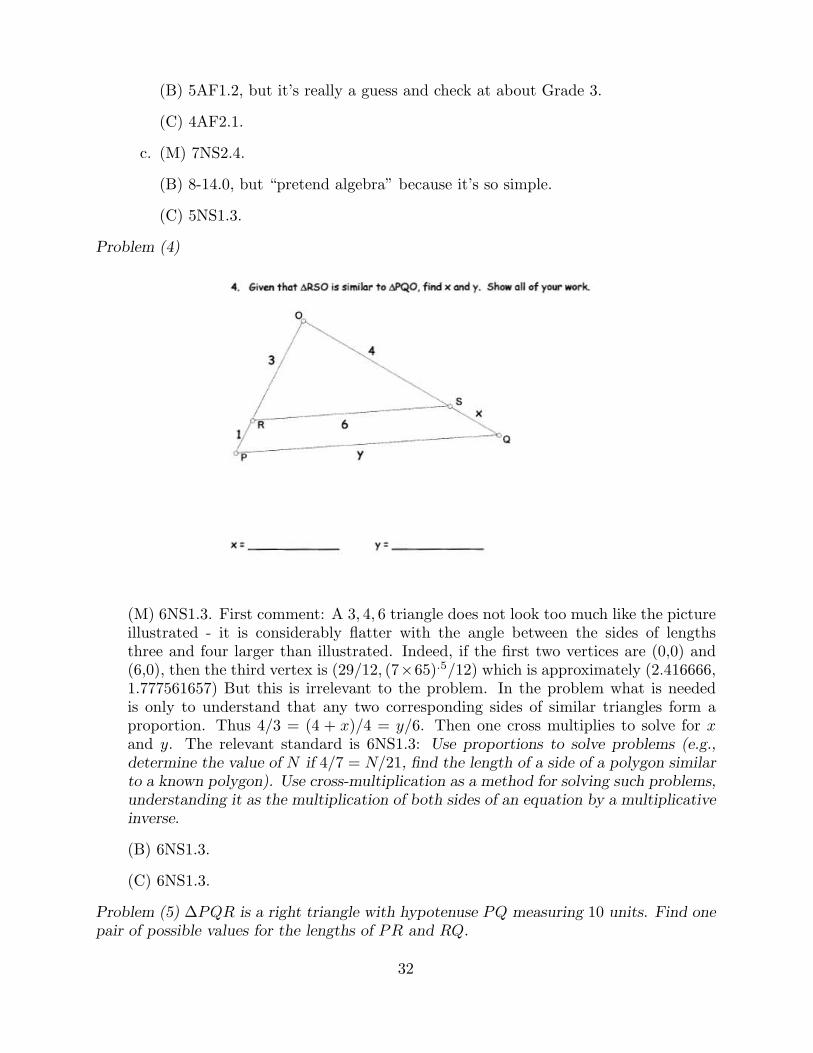
Problem (4)
(M) 6NS1.3. First comment: A 3, 4, 6 triangle does not look too much like the pictureillustrated - it is considerably flatter with the angle between the sides of lengthsthree and four larger than illustrated. Indeed, if the first two vertices are (0,0) and(6,0), then the third vertex is (29/12, (7×65).5/12) which is approximately (2.416666,1.777561657) But this is irrelevant to the problem. In the problem what is neededis only to understand that any two corresponding sides of similar triangles form aproportion. Thus 4/3 = (4 + x)/4 = y/6. Then one cross multiplies to solve for xand y. The relevant standard is 6NS1.3: Use proportions to solve problems (e.g.,determine the value of N if 4/7 = N/21, find the length of a side of a polygon similarto a known polygon). Use cross-multiplication as a method for solving such problems,understanding it as the multiplication of both sides of an equation by a multiplicativeinverse.
(B) 6NS1.3.
(C) 6NS1.3.
Problem (5) ∆PQR is a right triangle with hypotenuse PQ measuring 10 units. Find onepair of possible values for the lengths of PR and RQ.
32
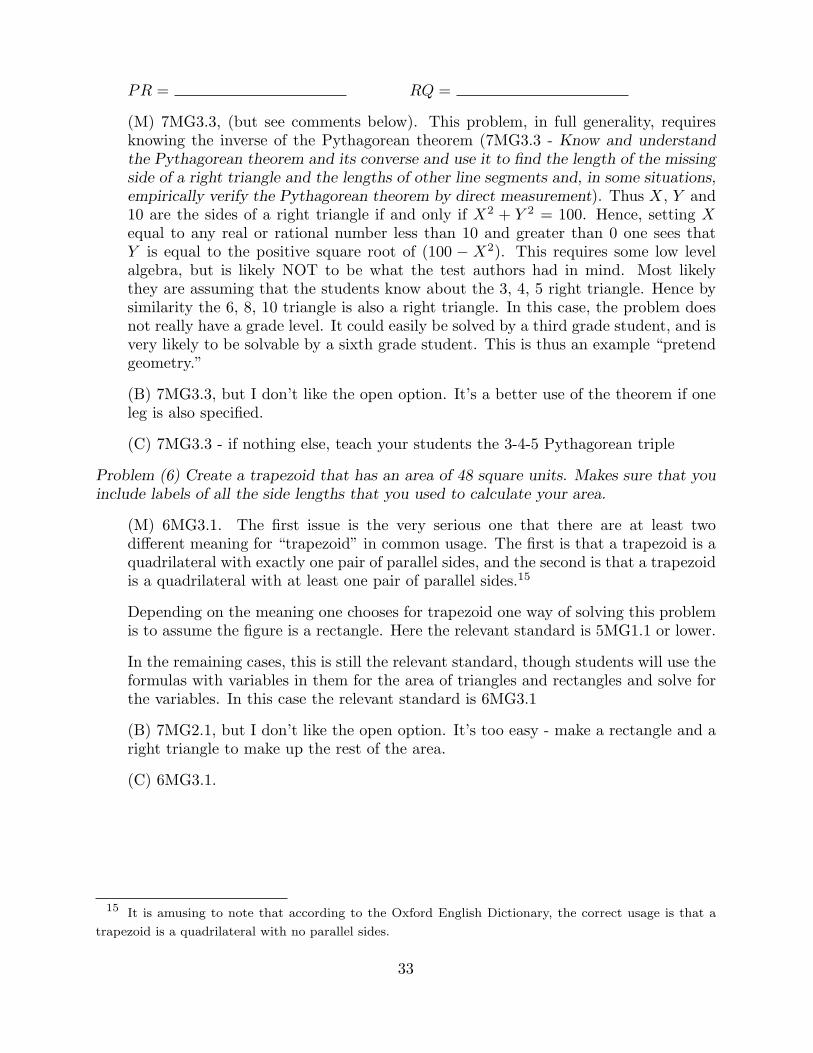
PR = RQ =
(M) 7MG3.3, (but see comments below). This problem, in full generality, requiresknowing the inverse of the Pythagorean theorem (7MG3.3 - Know and understandthe Pythagorean theorem and its converse and use it to find the length of the missingside of a right triangle and the lengths of other line segments and, in some situations,empirically verify the Pythagorean theorem by direct measurement). Thus X, Y and10 are the sides of a right triangle if and only if X2 + Y 2 = 100. Hence, setting Xequal to any real or rational number less than 10 and greater than 0 one sees thatY is equal to the positive square root of (100 − X2). This requires some low levelalgebra, but is likely NOT to be what the test authors had in mind. Most likelythey are assuming that the students know about the 3, 4, 5 right triangle. Hence bysimilarity the 6, 8, 10 triangle is also a right triangle. In this case, the problem doesnot really have a grade level. It could easily be solved by a third grade student, and isvery likely to be solvable by a sixth grade student. This is thus an example “pretendgeometry.”
(B) 7MG3.3, but I don’t like the open option. It’s a better use of the theorem if oneleg is also specified.
(C) 7MG3.3 - if nothing else, teach your students the 3-4-5 Pythagorean triple
Problem (6) Create a trapezoid that has an area of 48 square units. Makes sure that youinclude labels of all the side lengths that you used to calculate your area.
(M) 6MG3.1. The first issue is the very serious one that there are at least twodifferent meaning for “trapezoid” in common usage. The first is that a trapezoid is aquadrilateral with exactly one pair of parallel sides, and the second is that a trapezoidis a quadrilateral with at least one pair of parallel sides.15
Depending on the meaning one chooses for trapezoid one way of solving this problemis to assume the figure is a rectangle. Here the relevant standard is 5MG1.1 or lower.
In the remaining cases, this is still the relevant standard, though students will use theformulas with variables in them for the area of triangles and rectangles and solve forthe variables. In this case the relevant standard is 6MG3.1
(B) 7MG2.1, but I don’t like the open option. It’s too easy - make a rectangle and aright triangle to make up the rest of the area.
(C) 6MG3.1.
15 It is amusing to note that according to the Oxford English Dictionary, the correct usage is that a
trapezoid is a quadrilateral with no parallel sides.
33
Problem (7)
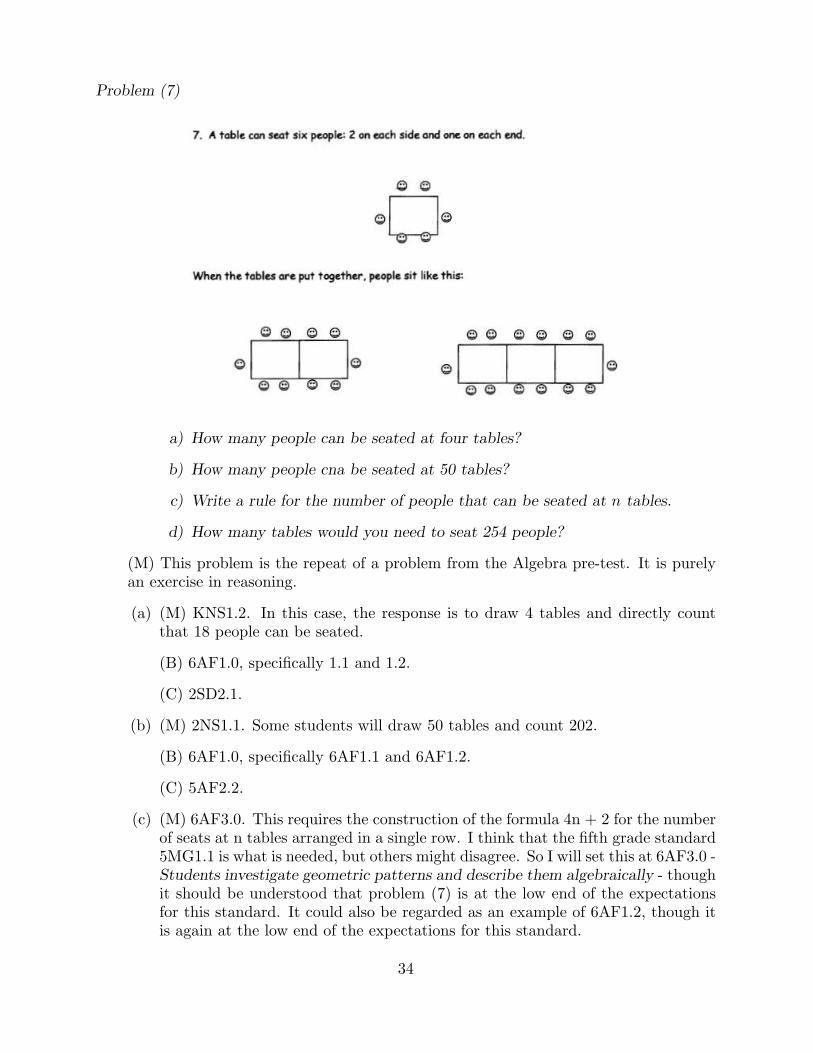
a) How many people can be seated at four tables?
b) How many people cna be seated at 50 tables?
c) Write a rule for the number of people that can be seated at n tables.
d) How many tables would you need to seat 254 people?
(M) This problem is the repeat of a problem from the Algebra pre-test. It is purelyan exercise in reasoning.
(a) (M) KNS1.2. In this case, the response is to draw 4 tables and directly countthat 18 people can be seated.
(B) 6AF1.0, specifically 1.1 and 1.2.
(C) 2SD2.1.
(b) (M) 2NS1.1. Some students will draw 50 tables and count 202.
(B) 6AF1.0, specifically 6AF1.1 and 6AF1.2.
(C) 5AF2.2.
(c) (M) 6AF3.0. This requires the construction of the formula 4n + 2 for the numberof seats at n tables arranged in a single row. I think that the fifth grade standard5MG1.1 is what is needed, but others might disagree. So I will set this at 6AF3.0 -Students investigate geometric patterns and describe them algebraically - thoughit should be understood that problem (7) is at the low end of the expectationsfor this standard. It could also be regarded as an example of 6AF1.2, though itis again at the low end of the expectations for this standard.
34
(B) 6AF1.0, specifically 1.1 and 1.2.
(C) 5AF2.2.
(d) (M) 5AF1.2. Presuming that (c) has been done correctly, then this is 5AF1.2 -Use a letter to represent an unknown number; write and evaluate simple algebraicexpressions in one variable by substitution. Illustrative example: 3x + 2 = 14.What is x?
(B) 6AF1.0, specifically 1.1 and 1.2.
(C) 5AF1.2.
Problem (8) Daveeda has three bags of M& M’s. She knows that:
a. Bags A and C together weigh 2.6 pounds.
b. Bags B and C together weigh 2.2 pounds.
c. Bags C and B together weigh 1.2 pounds.
Help Daveeda figure out how much each bag weighs. Show your work.
Bag A = Bag B = Bag C =
(M) 10-2.0. This is a problem where I would be very interested in knowing the resultsfor the three different schools. It is three linear equations in three unknowns with(easy) decimal coefficients. However, it is easily reduced to two linear equations intwo unknowns (8-9.0), but the relevant standard is 10-2.0.
(B) 10-2.0, but ridiculously short of the standard - sort of the first baby step.
(C) 8-9.0, but really 5NS2.1 guess and check, the algebra I standard isn’t even exactlycorrect.
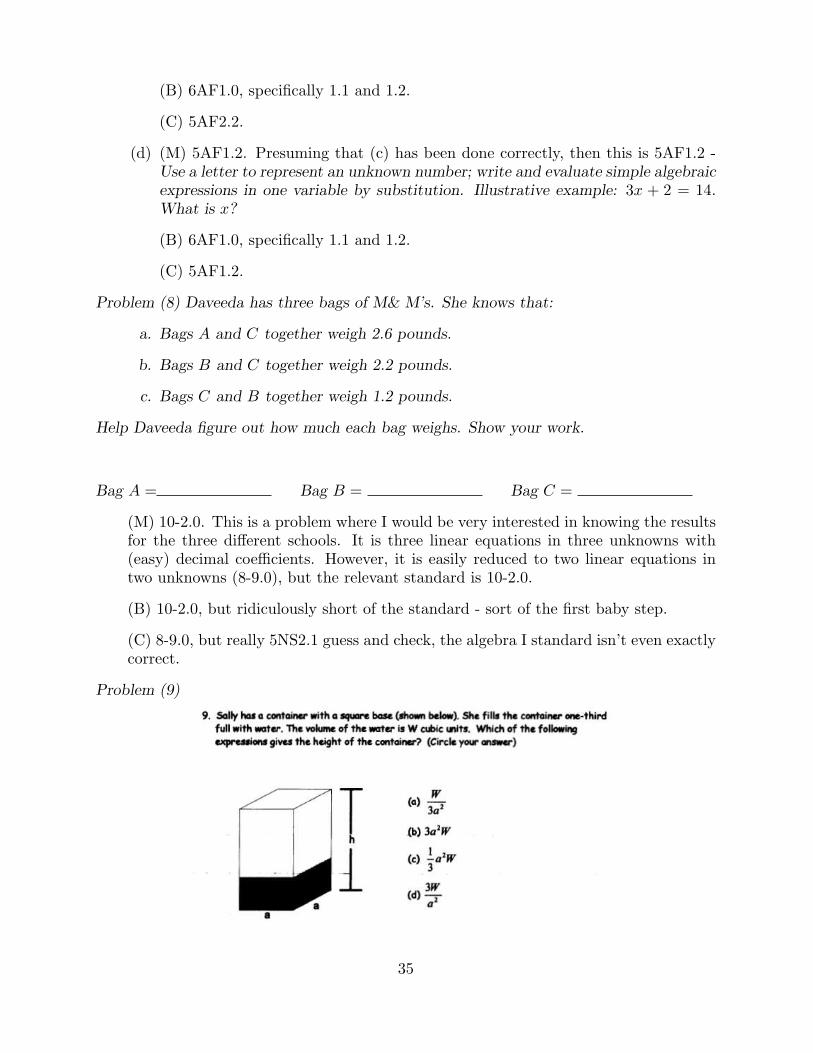
Problem (9)
35
(M) 6MG1.3, 6AF1.2. This is a good - though elementary - problem, except thatthe “container” should be better specified, perhaps “container which is a rectangularprism with a square base.” However, I would suspect that virtually all the studentswould automatically assume that it’s a rectangular prism.
To solve the problem students need to know that the volume of a rectangular prismis Ah where A is the area of the base and h is the height of the prism, or a2h. Sinceit is one third full W = (1/3)a2h, so, solving for h, h = 3W/a2. Here are the relevantstandards: for the volume, 6MG1.3 Know and use the formulas for the volume oftriangular prisms and cylinders (area of base height); compare these formulas andexplain the similarity between them and the formula for the volume of a rectangularsolid, for setting up and solving the equation 6AF1.2: Write and evaluate an algebraicexpression for a given situation, using up to three variables.
(B) 7MG2.1. I actually like the item.
(C) 6MG2.1.
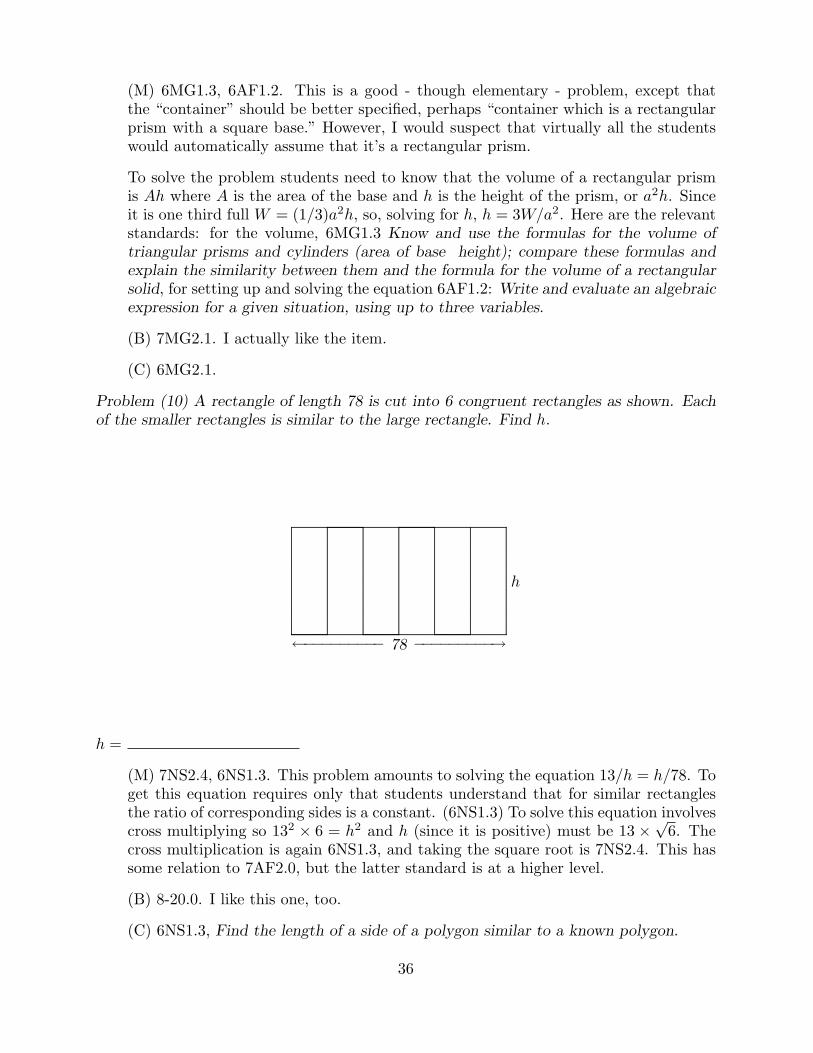
Problem (10) A rectangle of length 78 is cut into 6 congruent rectangles as shown. Eachof the smaller rectangles is similar to the large rectangle. Find h.
.......................................................................................................................................................................................................................................................................................................................................................................................................................................................................................................................................................................................................................................................................................................................................................................................................................................................................................................................................................................................................................................................................................................................
........
........
........
........
........
........
........
........
........
........
........
........
........
........
........
........
........
........
........
........
........................................................................................................................................................................................................................................................................................................................................................................................................................................................................................................................................................................................................................................................................................................................................................................
........
........
........
........
........
........
........
........
........
........
........
........
........
........
........
........
........
........
........
........
.
h
←−−−−−−−−− 78 −−−−−−−−−→
h =
(M) 7NS2.4, 6NS1.3. This problem amounts to solving the equation 13/h = h/78. Toget this equation requires only that students understand that for similar rectanglesthe ratio of corresponding sides is a constant. (6NS1.3) To solve this equation involvescross multiplying so 132 × 6 = h2 and h (since it is positive) must be 13 ×√6. Thecross multiplication is again 6NS1.3, and taking the square root is 7NS2.4. This hassome relation to 7AF2.0, but the latter standard is at a higher level.
(B) 8-20.0. I like this one, too.
(C) 6NS1.3, Find the length of a side of a polygon similar to a known polygon.
36
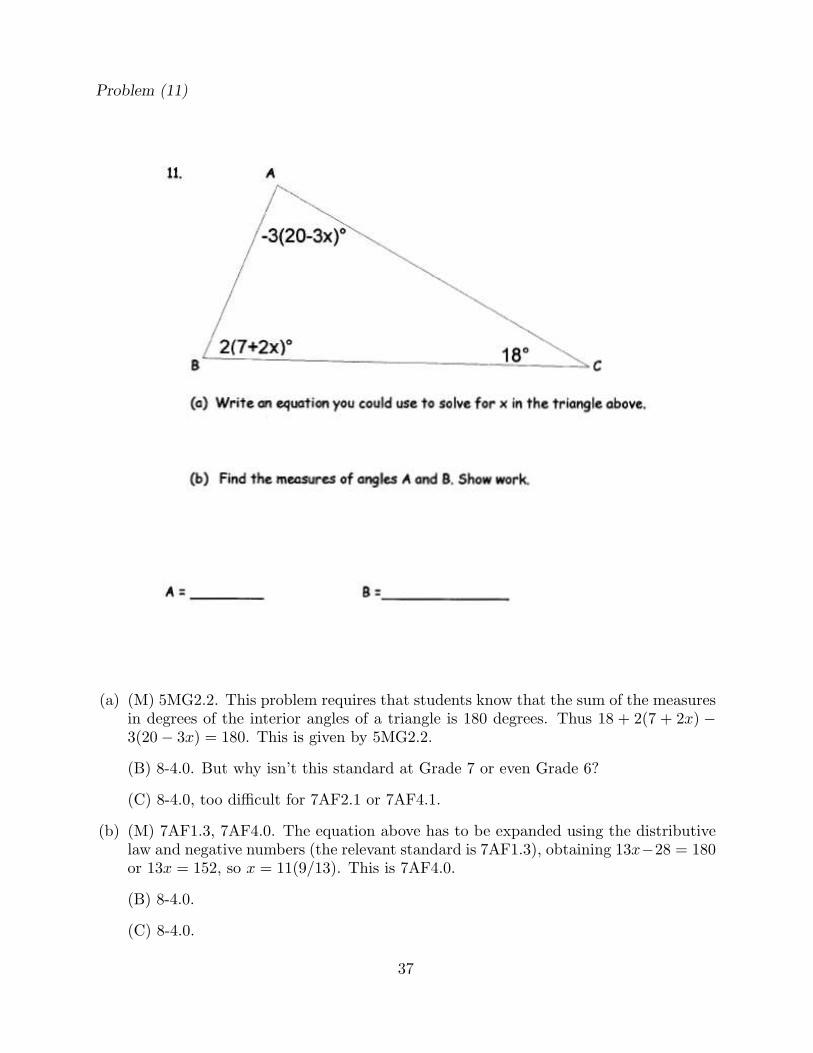
Problem (11)
(a) (M) 5MG2.2. This problem requires that students know that the sum of the measuresin degrees of the interior angles of a triangle is 180 degrees. Thus 18 + 2(7 + 2x) −3(20− 3x) = 180. This is given by 5MG2.2.
(B) 8-4.0. But why isn’t this standard at Grade 7 or even Grade 6?
(C) 8-4.0, too difficult for 7AF2.1 or 7AF4.1.
(b) (M) 7AF1.3, 7AF4.0. The equation above has to be expanded using the distributivelaw and negative numbers (the relevant standard is 7AF1.3), obtaining 13x−28 = 180or 13x = 152, so x = 11(9/13). This is 7AF4.0.
(B) 8-4.0.
(C) 8-4.0.
37
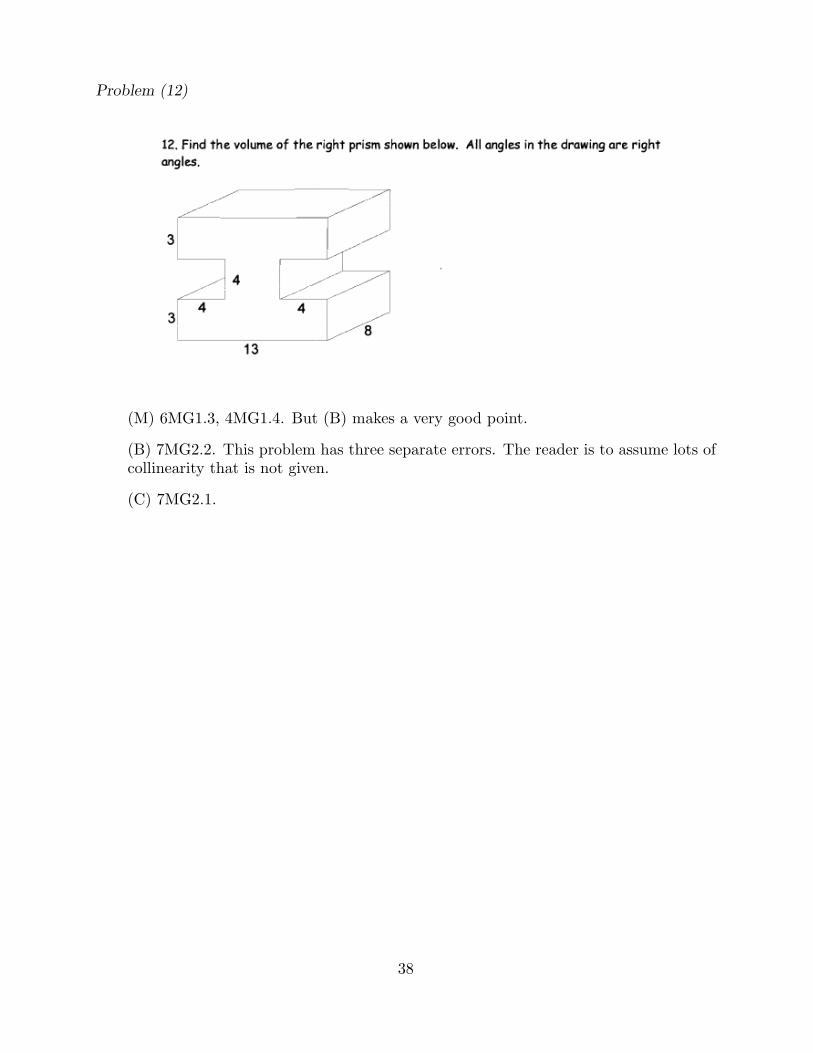
Problem (12)
(M) 6MG1.3, 4MG1.4. But (B) makes a very good point.
(B) 7MG2.2. This problem has three separate errors. The reader is to assume lots ofcollinearity that is not given.
(C) 7MG2.1.
38
Appendix 3: Test Validity
This is a very serious issue when tests are being used to determine student outcomes,so it might be helpful to give a brief review of the basic considerations that have to bemet in order that a test be viewed as a valid measure.
Here are the key issues:
(1) Item difficulty: This is the proportion of students who responded correctly to eachitem [There is no adequate discussion in this area of how one handles questions thatare incorrect or have no correct answer, and the tests in question have both kinds ofquestions.]
(2) Item discrimination: The extent to which an item differentiates between thosestudents with the highest and lowest scores on the total test.
(3) Test reliability: The extent to which a test measures consistently what it is thatit measures. There are a number of accepted techniques for establishing the reliabilityof tests. The usual one for tests that are only given once is the Kuder - RichardsonFormula 20, a technique for establishing the internal consistency of a test
(4) Test validity: The extent to which a test measures that which it is supposed tomeasure. [If it is supposed to measure competency in Algebra I, then how well doesit do this?] Within this area there are two sub-topics
4(a) Predictive validity: this is the extent to which a students performance on atest of unknown validity is related to his or her performance on a test of knownvalidity.
4(b) Content validity: The extent to which it measures the content that is to betaught.
39
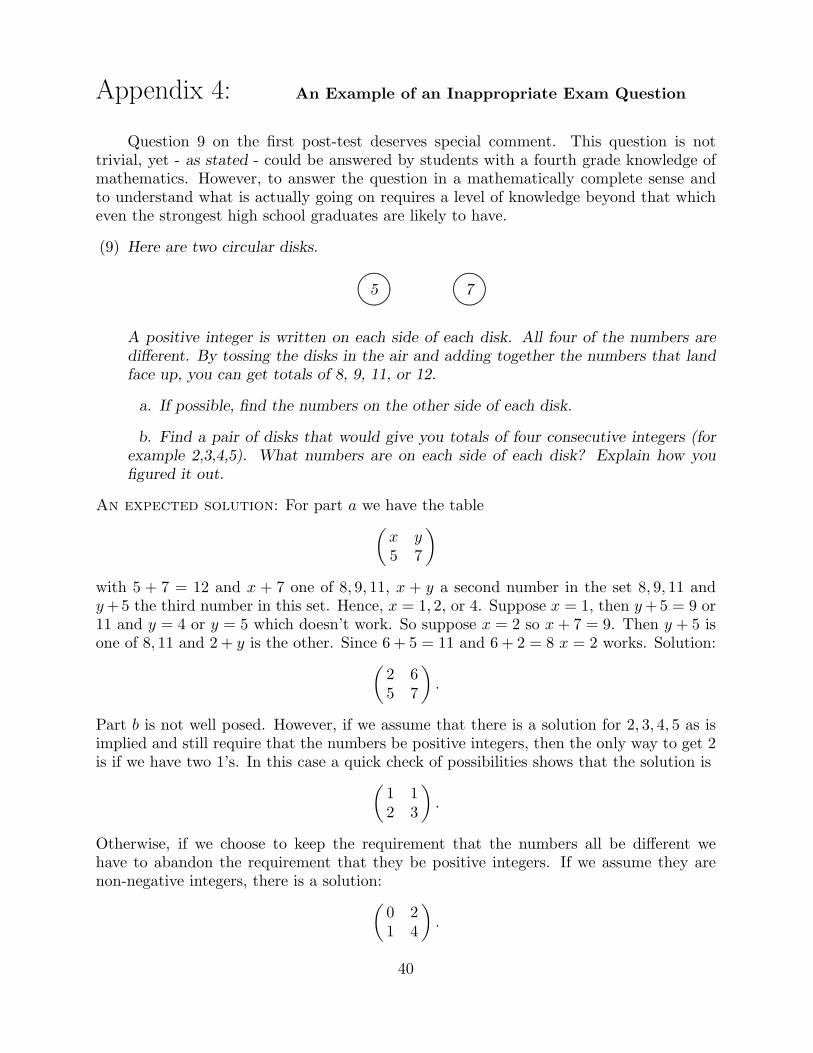
Appendix 4: An Example of an Inappropriate Exam Question
Question 9 on the first post-test deserves special comment. This question is nottrivial, yet - as stated - could be answered by students with a fourth grade knowledge ofmathematics. However, to answer the question in a mathematically complete sense andto understand what is actually going on requires a level of knowledge beyond that whicheven the strongest high school graduates are likely to have.
(9) Here are two circular disks.
........
.......................
............................................................................................................................... ............................................................
................................................
..................................................5 7
A positive integer is written on each side of each disk. All four of the numbers aredifferent. By tossing the disks in the air and adding together the numbers that landface up, you can get totals of 8, 9, 11, or 12.
a. If possible, find the numbers on the other side of each disk.
b. Find a pair of disks that would give you totals of four consecutive integers (forexample 2,3,4,5). What numbers are on each side of each disk? Explain how youfigured it out.
An expected solution: For part a we have the table(
x y5 7
)
with 5 + 7 = 12 and x + 7 one of 8, 9, 11, x + y a second number in the set 8, 9, 11 andy +5 the third number in this set. Hence, x = 1, 2, or 4. Suppose x = 1, then y +5 = 9 or11 and y = 4 or y = 5 which doesn’t work. So suppose x = 2 so x + 7 = 9. Then y + 5 isone of 8, 11 and 2 + y is the other. Since 6 + 5 = 11 and 6 + 2 = 8 x = 2 works. Solution:
(2 65 7
).
Part b is not well posed. However, if we assume that there is a solution for 2, 3, 4, 5 as isimplied and still require that the numbers be positive integers, then the only way to get 2is if we have two 1’s. In this case a quick check of possibilities shows that the solution is
(1 12 3
).
Otherwise, if we choose to keep the requirement that the numbers all be different wehave to abandon the requirement that they be positive integers. If we assume they arenon-negative integers, there is a solution:
(0 21 4
).
40
If the numbers are assumed to be integers, then there are many solutions, and if thenumbers are real then there are even more.
Aside from the difficulty coming from the fact that (b) is ill-posed, this is fourth gradelevel in California as was indicated in Appendix 1.
The method of solution above is characterized as guess and check with only a verylimited number of possibilities, so that most students will quickly find solutions, thoughthe question initially looks sophisticated. But suppose that the numbers were much bigger,or we changed the question to the more mathematical question that first does not assumeall the numbers are different, second asks for all whole number solutions, and third asksfor a demonstration that all the solutions have been obtained, or any of the other variantsindicated above.
Then the situation changes, and the question - basically the real question underlyingthe original problem #9 - becomes both much more interesting and far more difficult.Thus we classify this problem - as it is stated in the context of this test - as a pretendalgebra problem . But there is a more advanced context in which the problem is a verygood one.
A Mathematical context: Let us label the disks as follows, so the front sides of thetwo disks are A and C while the back side of the A disk is B and the back side of the Cdisk is D.
........
.......................
............................................................................................................................... ............................................................
................................................
..................................................A C
Then there are four possible results giving four linear equations:
A + C = t1
A + D = t2
B + C = t3
B + D = t4
Suppose we are given four unordered numbers 〈a, b, c, d〉. We want to know all theA,B, C, D so that the values of the four sums A + C, A + D, B + C, B + D give thenumbers a, b, c, d in some order. In other words we want to solve the inverse problem forall the (up to 24) different 4-vectors that have the coordinates a, b, c, d in some order.
This is what a great deal of college level linear algebra courses directly address, and thecomplete solutions for the equations above - both the constraints on the ti that guaranteesolutions exist and all the solutions when they do exist - are easily worked out by studentsin such a class.
A similar discussion works when we specialize to look at constrained sets such asthose in part ((b) where (a, b, c, d) consists of four successive integers, or more generallyan unordered set of the form 〈n, n + 1, n + 2, n + 3〉 for n any real or complex number.
41
Further, in the situation where the students are the proper level, this can lead todiscussions of symmetry - how does the structure of the solutions reflect what happenswhen we exchange the coins for example.
Summary: At the fourth grade level this is a good problem to teach exhaustive searchand interpretation of data because suitable answers involve small whole numbers andcan be found quickly by guess and check methods. A question like this will be seen bypeople who know only limited amounts of mathematics as entirely appropriate since theirtendency is to regard mathematics as lists of disconnected topics, most of which look likecombinatoric puzzles. They seem to believe that teaching students to handle (elementary)Putnam style challenge problems is training them in mathematics and problem solving.Thus, such people see including a question like this as the keystone problem in an otherwiseun-challenging algebra exam as perfectly legitimate. However, people with a larger graspof the subject realize that mathematics is incremental, and that solving a problem likethis at fourth grade level does not lead to deeper insights. Yet, a problem like this with2,3,4,5 replaced by integers with appropriate constraints would be a nice problem in acollege level linear algebra course.
42
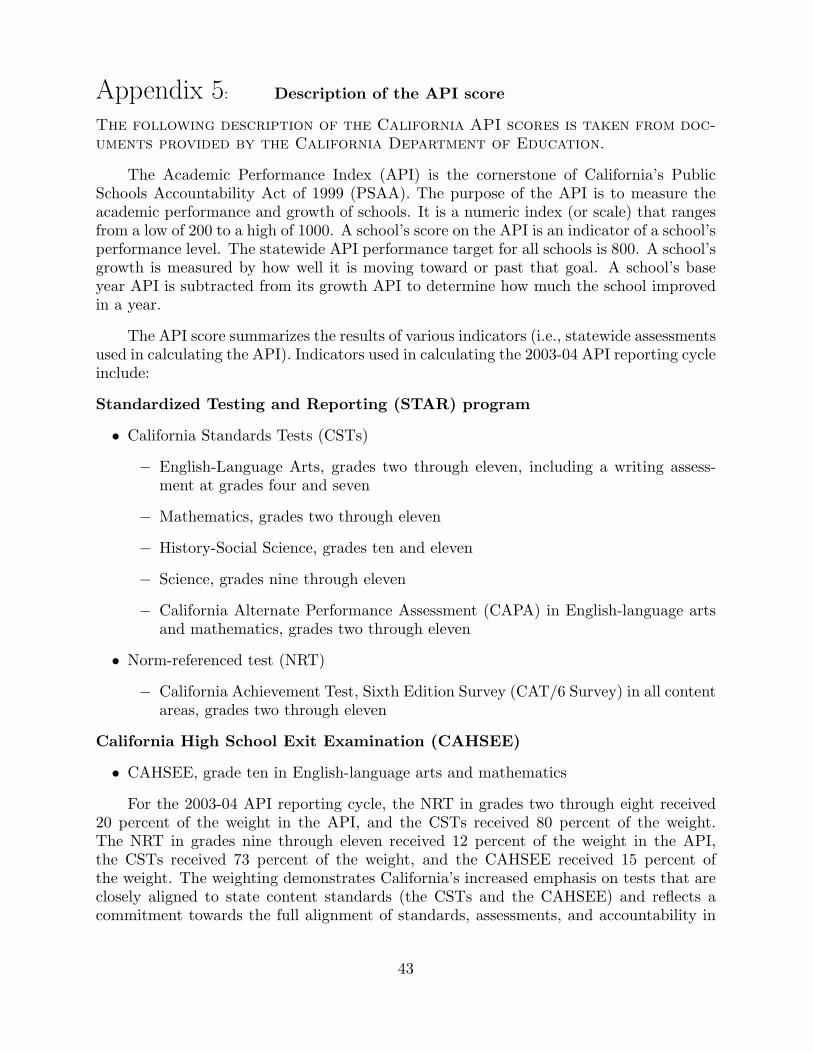
Appendix 5: Description of the API score
The following description of the California API scores is taken from doc-uments provided by the California Department of Education.
The Academic Performance Index (API) is the cornerstone of California’s PublicSchools Accountability Act of 1999 (PSAA). The purpose of the API is to measure theacademic performance and growth of schools. It is a numeric index (or scale) that rangesfrom a low of 200 to a high of 1000. A school’s score on the API is an indicator of a school’sperformance level. The statewide API performance target for all schools is 800. A school’sgrowth is measured by how well it is moving toward or past that goal. A school’s baseyear API is subtracted from its growth API to determine how much the school improvedin a year.
The API score summarizes the results of various indicators (i.e., statewide assessmentsused in calculating the API). Indicators used in calculating the 2003-04 API reporting cycleinclude:
Standardized Testing and Reporting (STAR) program
• California Standards Tests (CSTs)
− English-Language Arts, grades two through eleven, including a writing assess-ment at grades four and seven
− Mathematics, grades two through eleven
− History-Social Science, grades ten and eleven
− Science, grades nine through eleven
− California Alternate Performance Assessment (CAPA) in English-language artsand mathematics, grades two through eleven
• Norm-referenced test (NRT)
− California Achievement Test, Sixth Edition Survey (CAT/6 Survey) in all contentareas, grades two through eleven
California High School Exit Examination (CAHSEE)
• CAHSEE, grade ten in English-language arts and mathematics
For the 2003-04 API reporting cycle, the NRT in grades two through eight received20 percent of the weight in the API, and the CSTs received 80 percent of the weight.The NRT in grades nine through eleven received 12 percent of the weight in the API,the CSTs received 73 percent of the weight, and the CAHSEE received 15 percent ofthe weight. The weighting demonstrates California’s increased emphasis on tests that areclosely aligned to state content standards (the CSTs and the CAHSEE) and reflects acommitment towards the full alignment of standards, assessments, and accountability in
43
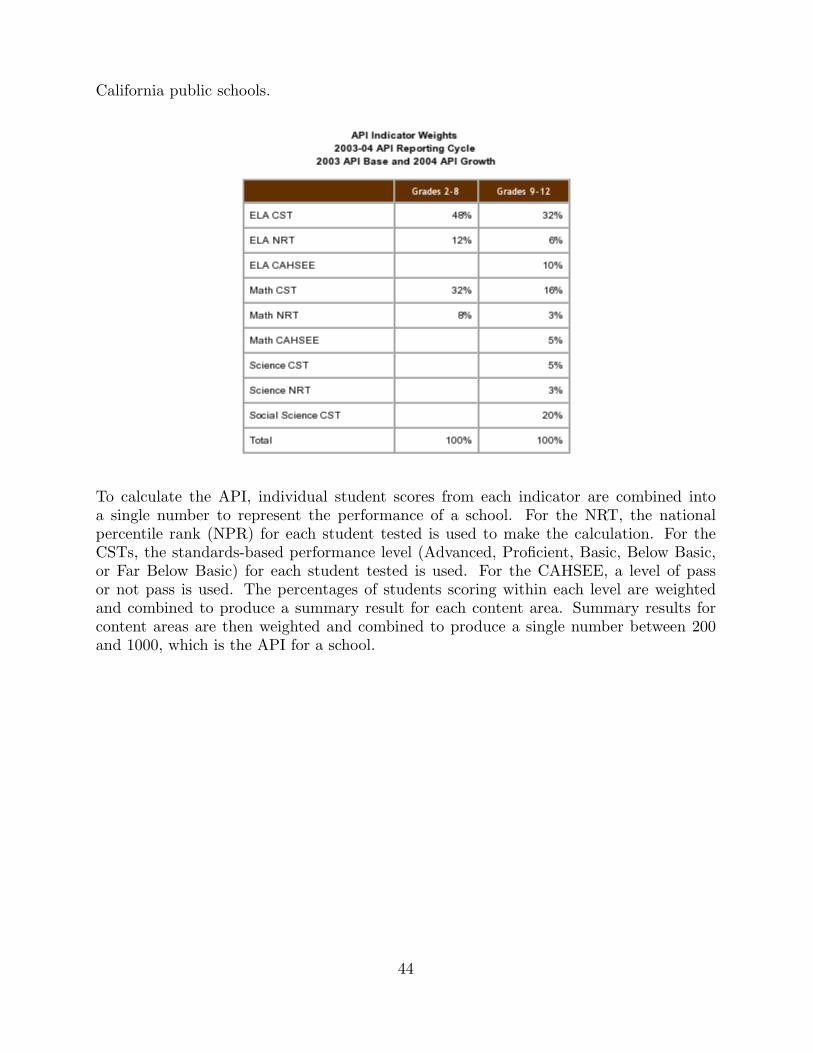
California public schools.
To calculate the API, individual student scores from each indicator are combined intoa single number to represent the performance of a school. For the NRT, the nationalpercentile rank (NPR) for each student tested is used to make the calculation. For theCSTs, the standards-based performance level (Advanced, Proficient, Basic, Below Basic,or Far Below Basic) for each student tested is used. For the CAHSEE, a level of passor not pass is used. The percentages of students scoring within each level are weightedand combined to produce a summary result for each content area. Summary results forcontent areas are then weighted and combined to produce a single number between 200and 1000, which is the API for a school.
44