Embed Size (px)
Citation preview

W&M ScholarWorks W&M ScholarWorks
Undergraduate Honors Theses Theses, Dissertations, & Master Projects
4-2011
A Closer Look at Nonprofit Evaluation A Closer Look at Nonprofit Evaluation
Samanthe E. Tiver College of William and Mary
Follow this and additional works at: https://scholarworks.wm.edu/honorstheses
Part of the Economics Commons
Recommended Citation Recommended Citation Tiver, Samanthe E., "A Closer Look at Nonprofit Evaluation" (2011). Undergraduate Honors Theses. Paper 349. https://scholarworks.wm.edu/honorstheses/349
This Honors Thesis is brought to you for free and open access by the Theses, Dissertations, & Master Projects at W&M ScholarWorks. It has been accepted for inclusion in Undergraduate Honors Theses by an authorized administrator of W&M ScholarWorks. For more information, please contact [email protected].
A Closer Look at Nonprofit Evaluation
A thesis submitted in partial fulfillment of the requirement
for the degree of Bachelor of Arts in Economics from
The College of William and Mary
by
Samanthe Tiver
Accepted for ___________________________________
(Honors)
________________________________________
Robert B. Archibald, Director
________________________________________
Monica D. Griffin
________________________________________
Melissa P. McInerney
Williamsburg, VA
April 21, 2011
1
INTRODUCTION
Today, 89% of American households donate to charity with a mean contribution of
$1,620 (Independent Sector, 2001). In Virginia, there are 8,941 501(c)(3) charitable
organizations who spent $27.4 billion in 2005 (Salamon, et al., 2009). The foundations alone
hold over $7 billion in assets. The average charitable donation is $3,650 per household—about
6.0% of median income—significantly greater than the United States average of 3.0% (VANNO,
2008). This sector of the economy continues to grow; Virginia‘s nonprofit expenditures
increased by 32% from 1998 to 2005 (Frumkin, 2001).
With 1.7 million volunteers, North Carolina nonprofit organizations provide more than
400,000 jobs, constituting almost 10% of all jobs (Corporation for National & Community
Service; NC Center for Nonprofits). Together, they contribute $33 billion per year to the
community through taxes on employees‘ salaries and consumption. This sector has been growing
rapidly over the past decade, at an average rate of 11% per year (NC Center for Nonprofits).
While North Carolinians don‘t give at the rate of Virginians, they still contribute 2.6% of their
income, a donation of $1,238 per household per year.
Despite the growing impact of nonprofits throughout the world, few researchers have
taken the opportunity to apply rigorous metrics to the nonprofit sector. As the demand for
funding increases, however, donors seek ways of finding the most worthy organization for their
donations. Many donors review nonprofit organization‘s overhead ratio as a proxy for success.
The overhead ratio is the proportion of a nonprofit organization‘s total revenue that is spent on
administrative and fundraising costs as opposed to programming efforts. The federal government
even restricts their grant funding, such that only 15% can be spent on administrative costs and
overhead (Nonprofit Overhead Cost Study Brief #3). Charity Navigator highlight the overhead
2
ratio in ranked lists, encouraging donors to give to organizations with low paid CEOs and
discouraging donations to ―inefficient fundraisers‖ (Charity Navigator). Grant making
organizations often require recipients‘ overhead ratio to be between zero and eight percent
(Hager, et al., 2005). Yet, what exactly is ‗overhead ratio‘ measuring and what is an appropriate
amount?
POLICY BACKGROUND & LITERATURE REVIEW
―CASE STUDY‖
Consider a small (fictional) nonprofit, Housing For All, whose mission is to provide
affordable housing to low-income residents through new construction and renovation of existing
buildings. Because they want to be competitive for government and other grants, they only will
pay $30,000 to hire a new executive director. Someone with experience and a Masters of
Business Administration could get hired at any other local business with a salary of at least
$50,000. Housing For All settles for a woman with 20 years of experience and no formal
education; she‘s the only one who can afford to live in the city on this low salary. The new
executive director is responsible for managing volunteer groups, coordinating with contractors
and other builders, selecting recipient families, running publicity and fundraising drives, as well
as administrative tasks. Administration can take all day as the organization still uses desktop
computers from the 90s and hasn‘t yet purchased a scanner. The executive director can choose to
hire an administrative assistant, but as a small nonprofit, this would raise Housing For All‘s
overhead ratio to 20%, well above the 15% government designation.
If Housing For All spent $100,000 more a year, they could hire an administrative
assistant, an executive director with more formal education, and maybe invest in new computers
3
and infrastructure. What does this mean for programmatic outcomes? Will these investments
result in sufficient increases in square footage developed? Unlike for-profit businesses, Housing
For All cannot measure its success solely in profit, but how much of an increase in programmatic
outcomes is enough to justify increased investments? Many of these questions remain unclear
not only to researchers, but to the thousands of executive directors, nonprofit board members,
and grant-making foundations seeking to provide high quality, diverse services to communities
across the nation.
BUSINESS-BACKED THEORY
In for profit business, every dollar invested in administration is a dollar less in profit.
This idea that dollars spent on administration are dollars ‗lost‘ established the ideological
background for the minimization of overhead ratio (Crutchfield 2007). For a nonprofit, every
dollar on overhead is one less dollar going to ‗help people‘ and so, donors should encourage the
maximum amount of money to be spent on programs or the mission. However, for-profit
businesses attempt to maximize returns to investors and recognize the investment in
infrastructure and employees make increase profits well beyond the cost of employment. Still,
charity watchdogs emphasize low overhead for nonprofit organizations, not maximization of
revenue.
NONPROFIT THEORY
Several researchers of nonprofit management argue against the use of nonprofit overhead
ratio as a measure of success and encourage donors to seek other more holistic measures of
effectiveness (Hager and Greenlee 2004; Frumkin 2001). Yet, because of the easy access to
nonprofit financial statistics and watchdog organizations such as Guidestar and Charity
Navigator, overhead ratio has become the primary measure of success (Hager and Greenlee

4
2004). In a survey conducted in 1994, Glaser found that 82 percent of respondents considered an
adequate amount spent for program to be important or very important in making a funding
decision (Glaser 1994). In startling contrast a survey conducted by Princeton Survey Research
Associates in 2001, only 6 percent of respondents considered fulfills a genuine need or makes a
difference as their primary reason for giving to a nonprofit organization (PSRA 2001).
Researcher Dan Pallotta claims that nonprofit overhead ratio does not measure anything
useful for donors (2008). His argument is that low overhead ratio does not indicate high quality
performance, nor does high overhead inherently indicate low quality performance. Instead,
overhead ratio is simply a mark of organizational structure and donors should be more concerned
with measuring outcomes. Mark Hager and Janet Greenlee (2004) echo Pallotta‘s claims and
further that overhead ratio has created a false ―bottom line‖ for nonprofit organizations which
only led to distortions and omissions. Today, many grant-making foundations and government
grants still rely on overhead ratio as an accountability measure for nonprofit despite the many
concerns.
THEORY
Researchers have been trying to better understand nonprofit effectiveness for years, with
little progress (Herman 1990; Au 1996). The ease of measurement of the overhead ratio makes it
an appealing tool for comparison, but only comparison between similar types of organizations
result in meaningful conclusions (Weber 1994). Then one may ask, where do we derive the
maximum percentage of overhead ratio? The answer remains unclear.
As aforementioned, the United States Government requires government grant recipients
to spend 15 percent or less on administrative and infrastructure costs, many granting
organizations specify that overhead must be between zero to eight percent, and charity watchdog
5
organizations suggest less than 25 percent (Nonprofit Overhead Cost Study Brief #3; Hager,
et.al. 2005; Charity Navigator). Throughout professional literature, authors make claims of how
the government should lower the maximum overhead ratio or make 100% of donations go to
charity (Gregory and Stid 2009). Yet the current theoretical and empirical research does not
seem to identify a clear optimal overhead ratio.
In 1999, the Urban Institute and Indiana University Center on Philanthropy began the
Nonprofit Overhead Cost Study, performing surveys and empirical testing on overhead ratios.
This five year study is the first large empirical study ever undertaken on overhead ratio.
Researchers suggest that too little overhead was as much of a problem as too much overhead
(Nonprofit Overhead Cost Study Brief #3). The authors found that lack of infrastructure led to
problems such as limited grant eligibility, financial bookkeeping errors, and limited fundraising
abilities.
The two largest factors which lead to poor infrastructure are small size and high levels of
restricted funds. Government funding, in particular, led to low investment in overhead and
therefore inadequate resources as government grants require extra administrative work to file the
necessary data and paperwork. Additionally, low overhead ratio can lead to poor recruitment and
retention of staff and an overworked executive director. Hager ,et al., suggest that policy makers
increase the maximum level of overhead, but also recommend that watchdog organizations set a
floor for overhead in order to encourage adequate infrastructure funding (Nonprofit Overhead
Cost Study Brief #3). A clear definition of excess and insufficient does not exist in the literature.
HYPOTHESIS
The theoretical belief that low overhead should lead to increased efficiency and the
empirical research that too little investment in administrative costs and infrastructure leads to
6
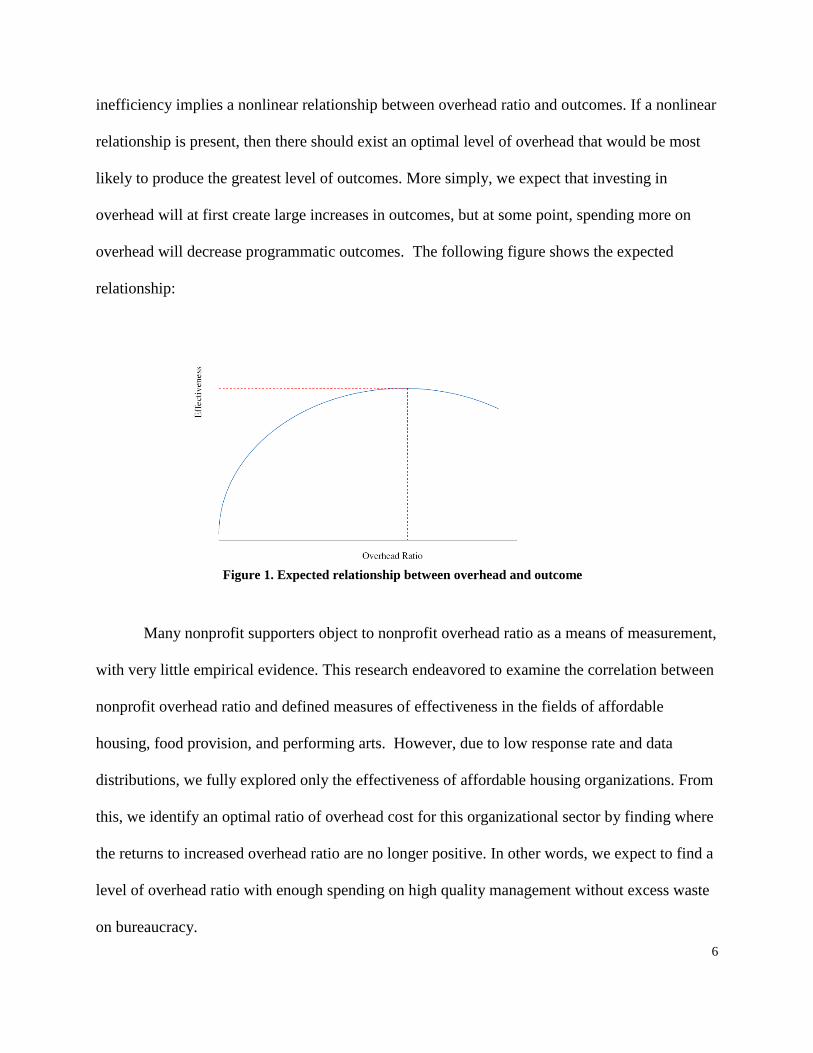
inefficiency implies a nonlinear relationship between overhead ratio and outcomes. If a nonlinear
relationship is present, then there should exist an optimal level of overhead that would be most
likely to produce the greatest level of outcomes. More simply, we expect that investing in
overhead will at first create large increases in outcomes, but at some point, spending more on
overhead will decrease programmatic outcomes. The following figure shows the expected
relationship:
Many nonprofit supporters object to nonprofit overhead ratio as a means of measurement,
with very little empirical evidence. This research endeavored to examine the correlation between
nonprofit overhead ratio and defined measures of effectiveness in the fields of affordable
housing, food provision, and performing arts. However, due to low response rate and data
distributions, we fully explored only the effectiveness of affordable housing organizations. From
this, we identify an optimal ratio of overhead cost for this organizational sector by finding where
the returns to increased overhead ratio are no longer positive. In other words, we expect to find a
level of overhead ratio with enough spending on high quality management without excess waste
on bureaucracy.
Figure 1. Expected relationship between overhead and outcome
7
Because survey data is based on self-selection, we employ the Heckman model, which
will be explored in more detail later. Simply, the Heckman model is a two step model which first
uses probit to identify the probability an organization would respond and then uses maximum
likelihood estimation to estimate the effects of the independent variables on programmatic
outcomes. In the first part of the model, we use organizational characteristics as well as an
exclusion restriction of ‗state‘ to predict the likelihood of response. Secondly, we regress
overhead ratio and its square on outcome data using basic econometric techniques while
controlling for community characteristics and financial features of the organization. In this way,
the regression will measure the effects of overhead ratio on outcome allowing for observing
marginal effects.
DATA & METHODOLOGY
SAMPLE SELECTION
This research restricts the universe to only include nonprofit organizations within
Virginia and North Carolina. This limits the breadth of the study and increase accuracy and
specificity, as unobservable factors decrease with decreased variation in geography. North
Carolina and Virginia have similar demographics of urbanization, wealth distribution,
geography, and law (Census 2000). These similarities help to control for possible variations
between organizations by governing body.
In order to define a dependent variable of outcomes, we decided to term successful
outcomes as those defined by the goal-attainment approach of nonprofit evaluation. Under this
method, researchers evaluated to what extent nonprofit organizations met their defined goals or
missions. The assumption in measuring goal-attainment is that missions are clear, less

8
ambiguous and measurable and that no other factors except goal attainment affect organizational
effectiveness (Forbes 1998, p.185-186).
We decided to focus on three organizational types whose missions have significant
overlap and clearly defined and measurable outcomes. These include affordable housing
developers, food providers to low-income individuals, and performing arts groups. Affordable
housing organizations provide quality affordable housing to low-income families. Low-income
food providers offer prepared and unprepared food to people at risk for hunger. Performing Arts
organizations make available high quality arts, through education, performances, and other
techniques. These organizations include, but are not limited to, dance, musical, and theatre.
Nonprofit organizations were identified based on their National Taxonomy of Exempt
Entities Classifications Core Codes (NTEE-CC). NTEE-CC was developed by the National
Center for Charitable Statistics and is employed by the Internal Revenue Service for reviewing
nonprofit organizations (NCCS NTEE-CC Overview). Our categories were defined as:
Table 1. National Taxonomy of Exempt Entities Classification
Organizational Category NTEE Category
Performing Arts A60
Low-income food provision K30
Affordable Housing Development L20*
*As defined below, not all L20 organizations included.
‗Performing Arts‘ (A60) contains the subgroups of dance, ballet, theater, music,
symphony orchestras, opera, performing arts centers, singing & choral groups, bands &
ensembles, and performing arts schools. All of these, and other categories, lie under the umbrella
of Category A of ‗Arts, Culture, and Humanities.‘ The category of ‗Food Programs‘ (K30)
includes the subcategories of food banks & pantries, congregate meals, soup kitchens, and meals
on wheels. These are classified under ‗Food, Agriculture, & Nutrition‘ (Category K). ‗Housing

9
Development, Construction, & Management‘ (L20) includes low-income & subsidized rental
housing, senior citizens‘ housing & retirement communities, independent housing for people
with disabilities, & housing rehabilitation. Unlike the other two, more clearly defined categories,
not all organizations within L20 are construction organizations and no one subcategory clearly
dominates. Therefore, we filtered these organizations based on their mission to provide low-
income housing and compared this list to the online databank via the Housing Association for
Nonprofit Developers. These organizations largely identified as L25 (housing rehabilitation) and
L20 generally. All Category L organizations are defined as ‗Housing & Shelter‘ groups.
These organizations created the universe from which we gathered and analyzed our data.
DEPENDENT VARIABLE
The dependent variable, programmatic outcomes, exist as a measure of effectiveness for
each organization. The definition of programmatic outcome varied based on organizational
category, but did not vary within a given category. Affordable housing developers succeed by
providing homes for low-income individuals. More quantifiably, their programmatic outcome is
defined as square footage of housing provided from new construction or renovation. Low-
income food providers supply meals to low-income individuals. This is measured by the number
of prepared or unprepared meals served or distributed in 2008. Unprepared meals are 1.3 pounds
of food as defined by the USDA guidelines for healthy consumption (Carlson, 2006).
Of these three categories, performing arts is the most difficult to define outcome measure
because quality of performance and many other factors are not quantifiable. A successful
performing arts organization could be those with the largest number of participants, the sold out
shows, or the highest quality performance. We seek to encapsulate many of these aspects by
10
measuring effectiveness as the number of tickets sold. The magnitude of ticket sales captures
frequency of performances and demand for performances, which are a function of both quality
and organization size. While we recognize the challenges in capturing varied levels of quality,
number of clients served, and value of their experience, these measurements provide
quantifiable, comparable statistics which reflect the major themes in these organizations‘
missions.
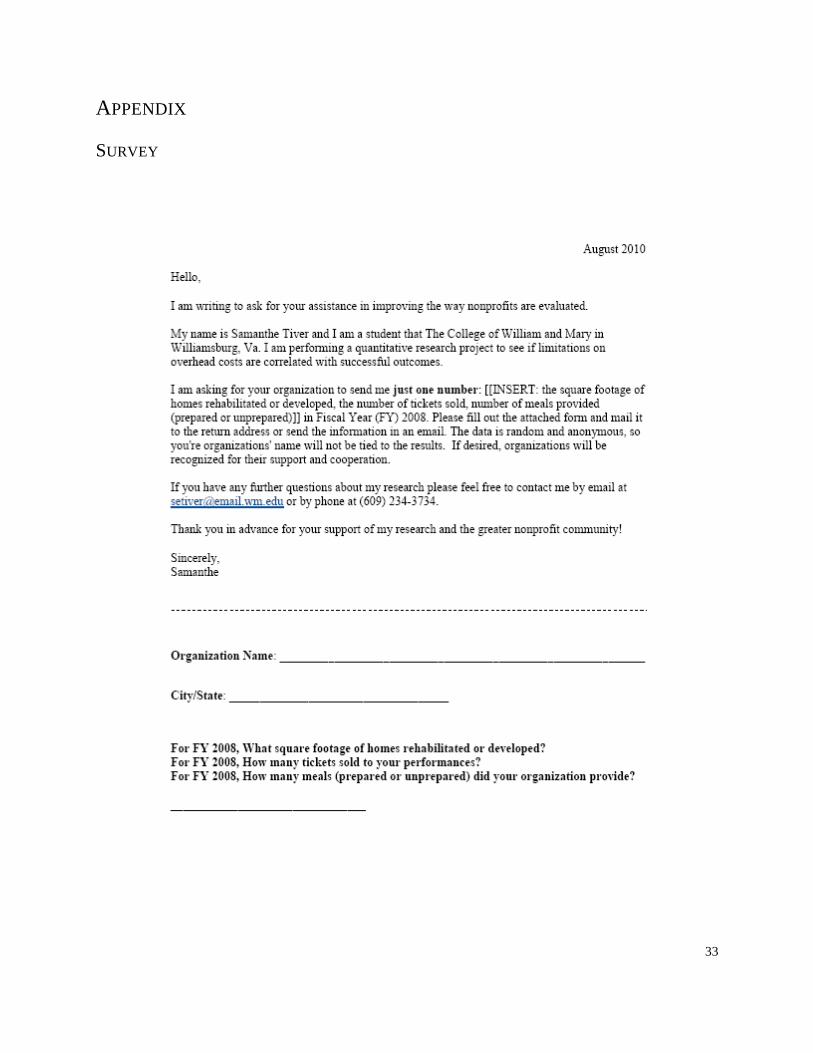
These dependent variables were collected via opened ended surveys (Appendix) during
August 2010. These surveys were mailed via US Postal service and included one self-addressed
return envelope. For affordable housing organizations, we contacted 704 organizations and
received 66 responses, a response rate of 9.38%. We mailed surveys to 152 food provision
organizations and received 18 responses; a response rate of 11.84%.We contacted 517
performing arts organizations and received 69 usable results as well as 3 responses with non-
numeric information, a response rate of 13.93%.
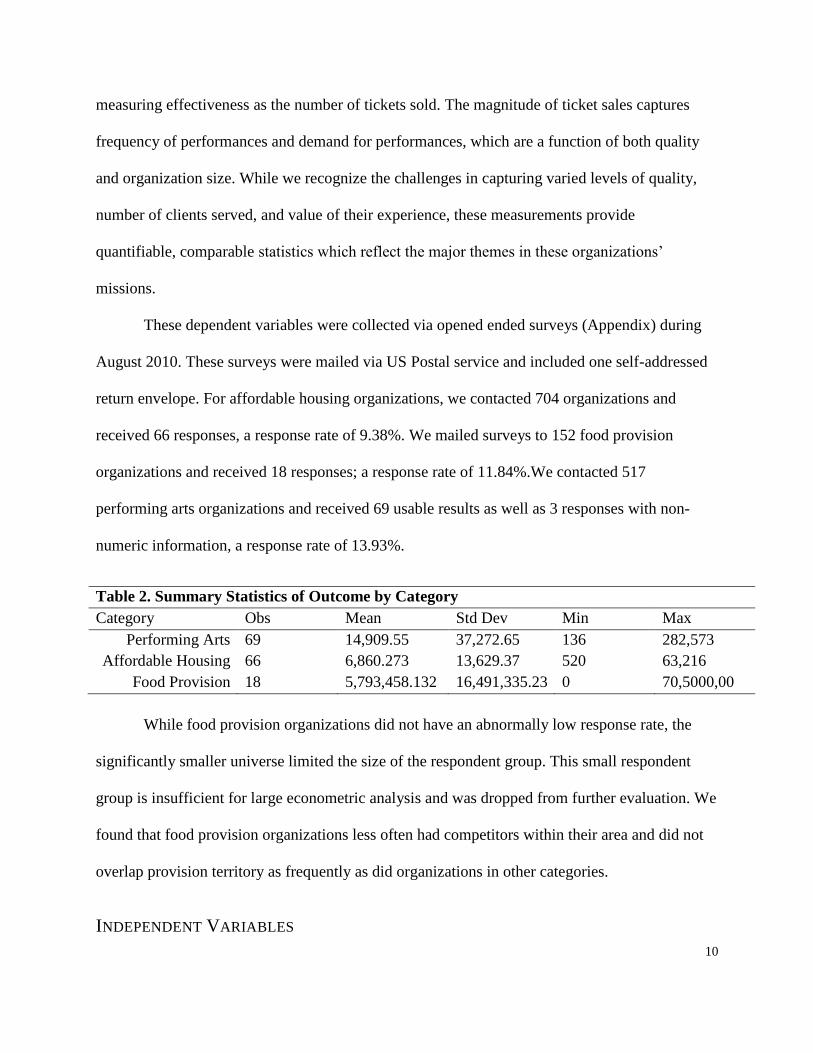
Table 2. Summary Statistics of Outcome by Category
Category Obs Mean Std Dev Min Max
Performing Arts 69 14,909.55 37,272.65 136 282,573
Affordable Housing 66 6,860.273 13,629.37 520 63,216
Food Provision 18 5,793,458.132 16,491,335.23 0 70,5000,00
While food provision organizations did not have an abnormally low response rate, the
significantly smaller universe limited the size of the respondent group. This small respondent
group is insufficient for large econometric analysis and was dropped from further evaluation. We
found that food provision organizations less often had competitors within their area and did not
overlap provision territory as frequently as did organizations in other categories.
INDEPENDENT VARIABLES
11
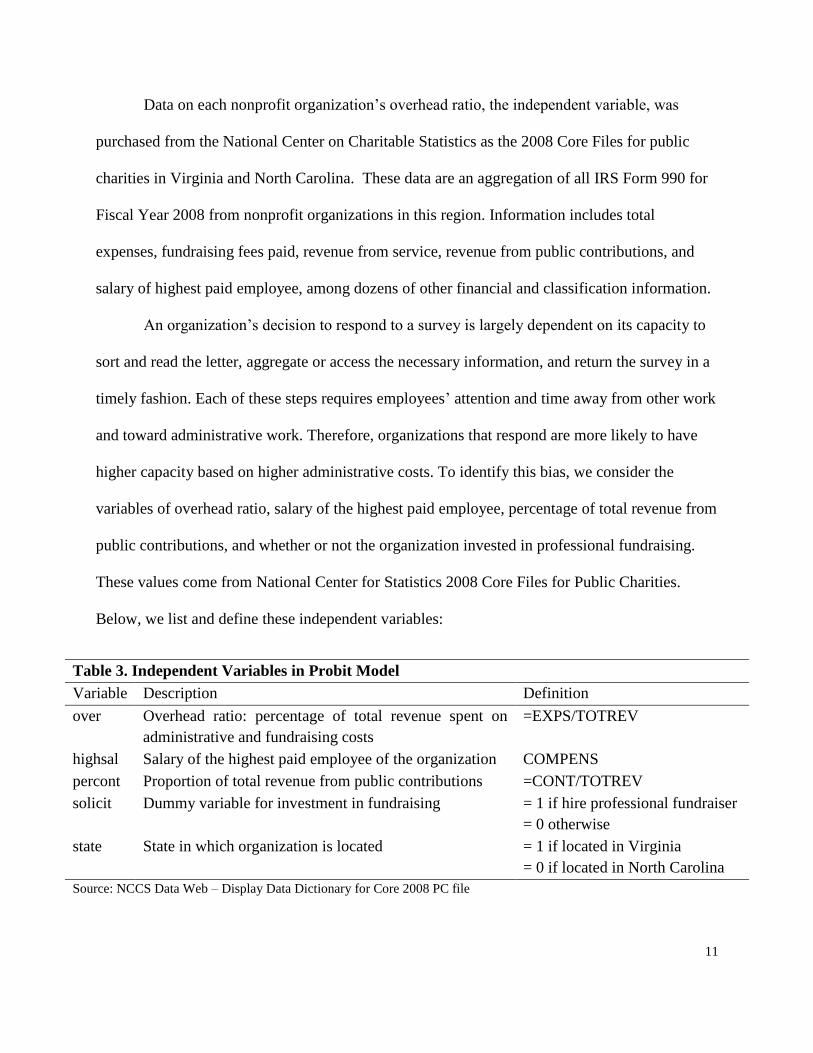
Data on each nonprofit organization‘s overhead ratio, the independent variable, was
purchased from the National Center on Charitable Statistics as the 2008 Core Files for public
charities in Virginia and North Carolina. These data are an aggregation of all IRS Form 990 for
Fiscal Year 2008 from nonprofit organizations in this region. Information includes total
expenses, fundraising fees paid, revenue from service, revenue from public contributions, and
salary of highest paid employee, among dozens of other financial and classification information.
An organization‘s decision to respond to a survey is largely dependent on its capacity to
sort and read the letter, aggregate or access the necessary information, and return the survey in a
timely fashion. Each of these steps requires employees‘ attention and time away from other work
and toward administrative work. Therefore, organizations that respond are more likely to have
higher capacity based on higher administrative costs. To identify this bias, we consider the
variables of overhead ratio, salary of the highest paid employee, percentage of total revenue from
public contributions, and whether or not the organization invested in professional fundraising.
These values come from National Center for Statistics 2008 Core Files for Public Charities.
Below, we list and define these independent variables:
Table 3. Independent Variables in Probit Model
Variable Description Definition
over Overhead ratio: percentage of total revenue spent on
administrative and fundraising costs
=EXPS/TOTREV
highsal Salary of the highest paid employee of the organization COMPENS
percont Proportion of total revenue from public contributions =CONT/TOTREV
solicit Dummy variable for investment in fundraising = 1 if hire professional fundraiser
= 0 otherwise
state State in which organization is located = 1 if located in Virginia
= 0 if located in North Carolina
Source: NCCS Data Web – Display Data Dictionary for Core 2008 PC file
12
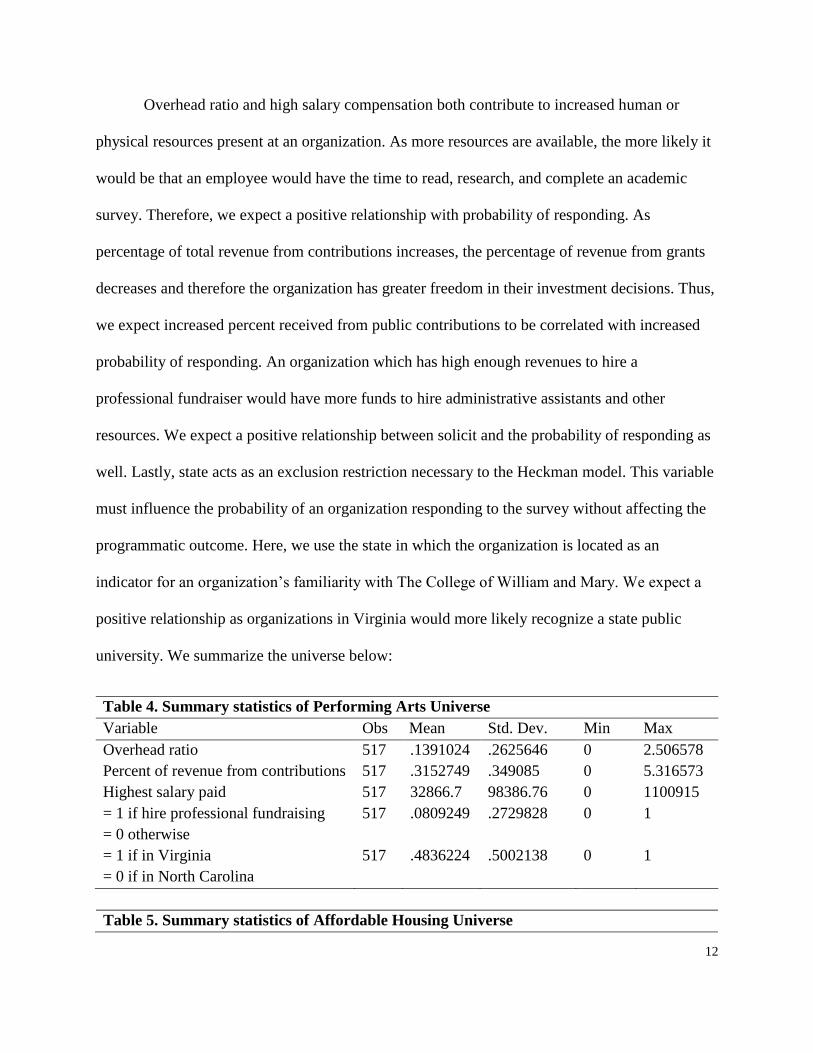
Overhead ratio and high salary compensation both contribute to increased human or
physical resources present at an organization. As more resources are available, the more likely it
would be that an employee would have the time to read, research, and complete an academic
survey. Therefore, we expect a positive relationship with probability of responding. As
percentage of total revenue from contributions increases, the percentage of revenue from grants
decreases and therefore the organization has greater freedom in their investment decisions. Thus,
we expect increased percent received from public contributions to be correlated with increased
probability of responding. An organization which has high enough revenues to hire a
professional fundraiser would have more funds to hire administrative assistants and other
resources. We expect a positive relationship between solicit and the probability of responding as
well. Lastly, state acts as an exclusion restriction necessary to the Heckman model. This variable
must influence the probability of an organization responding to the survey without affecting the
programmatic outcome. Here, we use the state in which the organization is located as an
indicator for an organization‘s familiarity with The College of William and Mary. We expect a
positive relationship as organizations in Virginia would more likely recognize a state public
university. We summarize the universe below:
Table 4. Summary statistics of Performing Arts Universe
Variable Obs Mean Std. Dev. Min Max
Overhead ratio 517 .1391024 .2625646 0 2.506578
Percent of revenue from contributions 517 .3152749 .349085 0 5.316573
Highest salary paid 517 32866.7 98386.76 0 1100915
= 1 if hire professional fundraising
= 0 otherwise
517 .0809249 .2729828 0 1
= 1 if in Virginia
= 0 if in North Carolina
517 .4836224 .5002138 0 1
Table 5. Summary statistics of Affordable Housing Universe

13
Variable Obs Mean Std. Dev. Min Max
Overhead ratio 704 .1389968 .226726 0 3.742931
Percent of revenue from contributions 704 .2340919 .3006134 0 1.091971
Highest salary paid 704 25307.13 87853.16 0 1106058
= 1 if hire professional fundraising
= 0 otherwise
704 .0508475 .2198414 0 1
= 1 if in Virginia
= 0 if in North Carolina
704 .474212 .4996926 0 1
Our independent variables seek to identify the relative weight between different
organizational and community characteristics which affect the effectiveness of the organization.
The financial characteristics include:
Table 6. Independent Financial Variables for MLE
Variable Description Definition from NCCS Data
OVER Overhead ratio: percentage of total revenue spent on
administrative and fundraising costs
=EXPS/TOTREV
OVERSQ Squared overhead ratio
PERCONT Proportion of total revenue from public contributions =CONT/TOTREV
HIGHSAL Salary of the highest paid employee of the organization COMPENS
SOLICIT Dummy variable for investment in fundraising =1 if hire professional fundraiser
=0 otherwise
Source: NCCS Data Web – Display Data Dictionary for Core 2008 PC file
As our earlier stated hypothesis suggests, we expect a positive relationship with overhead
ratio and a negative relationship with the square of overhead ratio. This identifies the
diminishing marginal returns to investment in overhead. Similarly as explained above,
percentage of revenue from contribution is expected to increase capacity. With increased
capacity, we expect greater output and so we predict a positive relationship between percont and
outcome. Likewise, investing in high quality employees increases the capabilities of an
organization and so increases their ability to produce. Thus, high maximum salaries should
correlate to increased outcomes. Lastly, an organization that invests in professional fundraising
14
would likely have money to invest in many opportunities. Thus, we expect a positive
relationship.
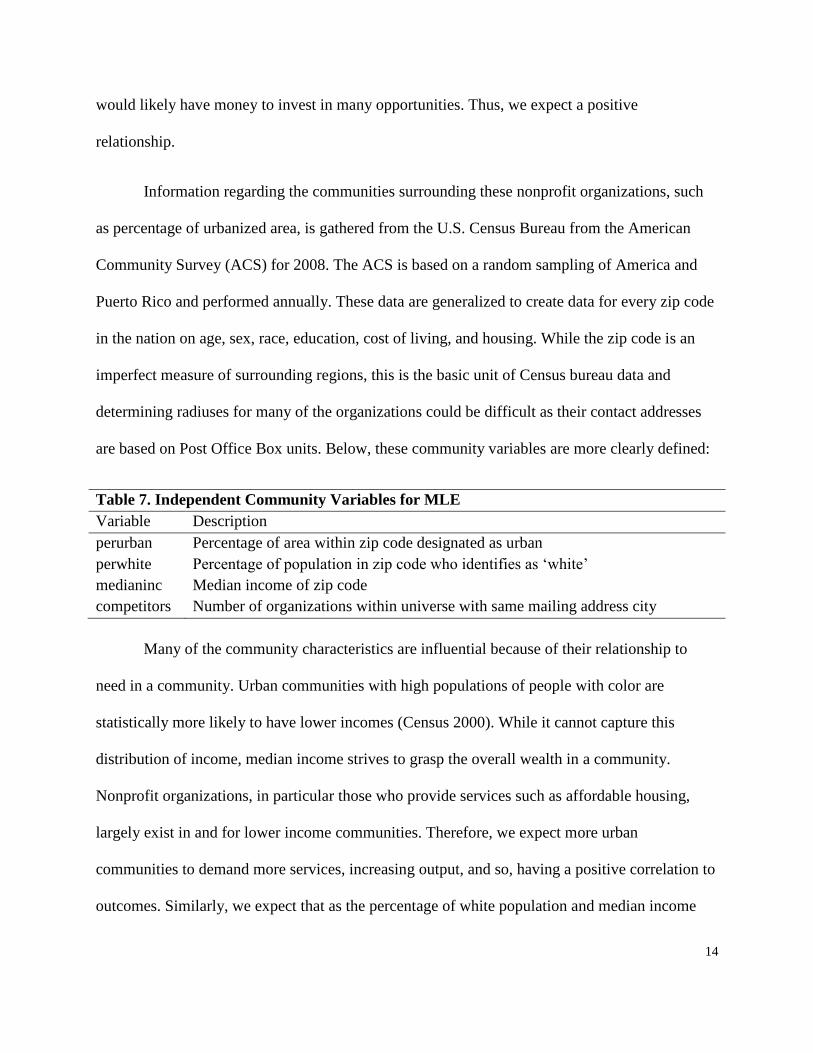
Information regarding the communities surrounding these nonprofit organizations, such
as percentage of urbanized area, is gathered from the U.S. Census Bureau from the American
Community Survey (ACS) for 2008. The ACS is based on a random sampling of America and
Puerto Rico and performed annually. These data are generalized to create data for every zip code
in the nation on age, sex, race, education, cost of living, and housing. While the zip code is an
imperfect measure of surrounding regions, this is the basic unit of Census bureau data and
determining radiuses for many of the organizations could be difficult as their contact addresses
are based on Post Office Box units. Below, these community variables are more clearly defined:
Table 7. Independent Community Variables for MLE
Variable Description
perurban Percentage of area within zip code designated as urban
perwhite Percentage of population in zip code who identifies as ‗white‘
medianinc Median income of zip code
competitors Number of organizations within universe with same mailing address city
Many of the community characteristics are influential because of their relationship to
need in a community. Urban communities with high populations of people with color are
statistically more likely to have lower incomes (Census 2000). While it cannot capture this
distribution of income, median income strives to grasp the overall wealth in a community.
Nonprofit organizations, in particular those who provide services such as affordable housing,
largely exist in and for lower income communities. Therefore, we expect more urban
communities to demand more services, increasing output, and so, having a positive correlation to
outcomes. Similarly, we expect that as the percentage of white population and median income

15
increase, the outcome of services provided will decrease. Finally, as the number of competitors
rises, we expect the programmatic outcome to decrease as each organization shares only a part of
the demand for their service or good in a community.
A summary of all of the above mentioned characteristics are as follows:
Space space space space space space jfdsakfjdsakfldsjafkdslajfkdslajflkdsajfdlksajfkdslajfdskla
CHALLENGES
Table 8. Summary of Performing Arts Variables
Variable Obs Mean Std. Dev. Min Max
Percentage of urban area in zip code 72 .7268056 .3355879 0 1
Percentage of white population in zip code 72 .6894444 .2280591 .13 .98
Number of competing organizations 72 3.763889 4.184118 0 18
Median income of zip code 72 41151.86 15934.54 11306 89862
= 1 if hire professional fundraising
= 0 otherwise
72 .0809249 .2729828 0 1
Highest salary paid 72 32866.7 98386.76 0 1100915
Overhead ratio 72 .1391024 .2625646 0 2.506578
Squared overhead ratio 72 .0881563 .3942352 0 6.282933
Percent of revenue from contributions 72 .3152749 .349085 0 5.316573
= 1 if in Virginia; = 0 if in North Carolina 72 .1884058 .3939006 0 1
Table 9. Summary of Affordable Housing Variables
Description Obs Mean Std. Dev Min Max
Percentage of urban area in zip code 66 .5568182 .3430594 0 1
Percentage of white population in zip code 66 .7278788 .1994108 .04 .98
Number of competing organizations 66 1.651515 3.88881 0 21
Median income of zip code 66 39122.5 13530.92 15779 89862
= 1 if hire professional fundraising
= 0 otherwise 66 .0508475 .2198414 0 1
Highest salary paid 66 25307.13 87853.16 0 1106058
Overhead ratio 66 .1389968 .226726 0 3.742931
Squared overhead ratio 66 0.2492542 0.4441899 0 2.069391
Percent of revenue from contributions 66 .2340919 .3006134 0 1.091971
= 1 if in Virginia; = 0 if in North Carolina 66 .5081967 .5040817 0 1

16
Upon examining these data, one may notice overhead ratios greater than 100% or
organizations with zero expenses or revenue. Many nonprofits do not possess the resources to
thoroughly complete their Form 990s and misrepresent the actual numbers by including
programming costs as administrative costs, not accounting for all revenue, or simply writing
inaccurate numbers (Froelich, Knoepfle, & Pollack, 2000). Froelich, Knoepfle, and Pollack
(2000) have found the Form 990 to be an overall reliable and adequate source of data to analyze
nonprofits, while simultaneously containing flaws from uninformed preparers of these
documents.
In our data, 17 performing arts organizations report overhead ratios greater than 100%
and only 5 affordable housing organizations report overhead ratios greater than 100%. As
displayed in the results section, dropping these variables does not alter the relationship or
statistical significance of any of the estimated coefficients in the Heckman model. However, due
to the sensitivity of ordinary least squares (OLS) regressions to outliers, we drop these
observations in these exploratory regressions.
THE HECKMAN MODEL
SELECTION BIAS
When handling survey data, one must consider what affects the organization‘s choice or
ability to respond to a survey. We examine the similarities and differences between our
respondents and the universe of possible respondents. Considering both housing and performing
arts, the mean revenue (derived from programmatic revenue, the sale of goods, and
contributions) is greater in the universe than in the sample of respondents. Thus, respondent
organizations are smaller, on average. Contrastingly, the highest salary given by the organization
and the percentage spent on overhead are higher for organizations in our sample than the entire
17
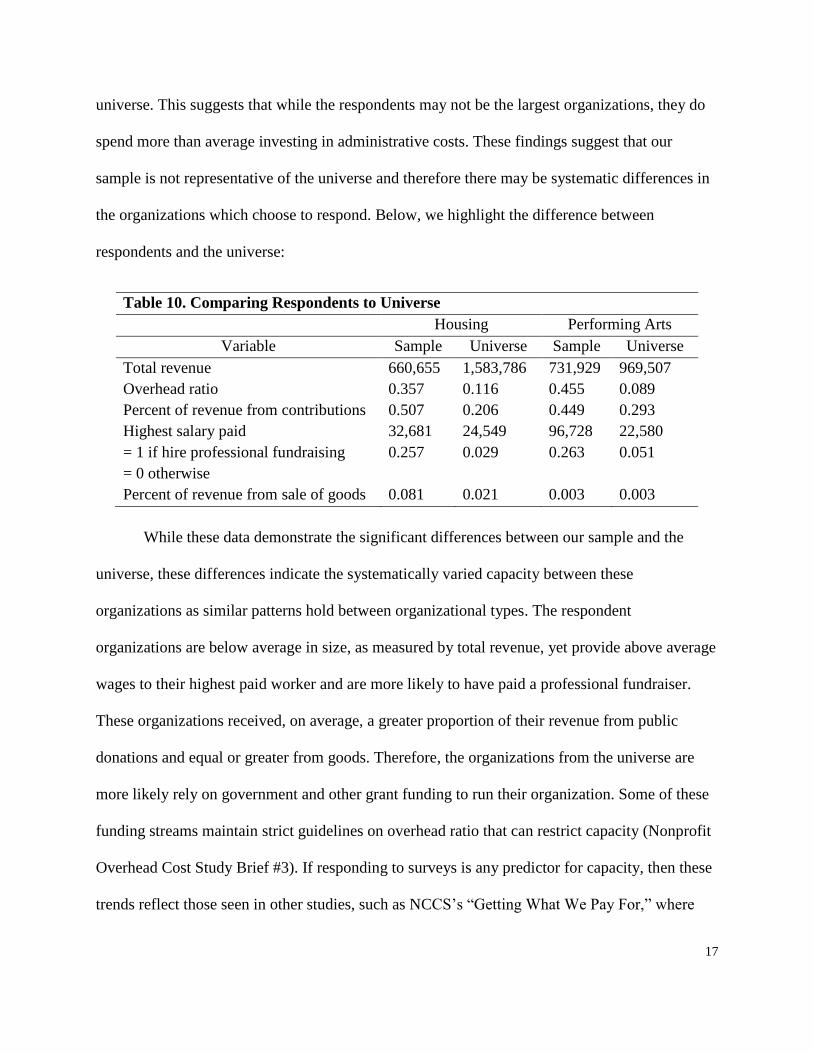
universe. This suggests that while the respondents may not be the largest organizations, they do
spend more than average investing in administrative costs. These findings suggest that our
sample is not representative of the universe and therefore there may be systematic differences in
the organizations which choose to respond. Below, we highlight the difference between
respondents and the universe:
Table 10. Comparing Respondents to Universe
Housing Performing Arts
Variable Sample Universe Sample Universe
Total revenue 660,655 1,583,786 731,929 969,507
Overhead ratio 0.357 0.116 0.455 0.089
Percent of revenue from contributions 0.507 0.206 0.449 0.293
Highest salary paid 32,681 24,549 96,728 22,580
= 1 if hire professional fundraising
= 0 otherwise
0.257 0.029 0.263 0.051
Percent of revenue from sale of goods 0.081 0.021 0.003 0.003
While these data demonstrate the significant differences between our sample and the
universe, these differences indicate the systematically varied capacity between these
organizations as similar patterns hold between organizational types. The respondent
organizations are below average in size, as measured by total revenue, yet provide above average
wages to their highest paid worker and are more likely to have paid a professional fundraiser.
These organizations received, on average, a greater proportion of their revenue from public
donations and equal or greater from goods. Therefore, the organizations from the universe are
more likely rely on government and other grant funding to run their organization. Some of these
funding streams maintain strict guidelines on overhead ratio that can restrict capacity (Nonprofit
Overhead Cost Study Brief #3). If responding to surveys is any predictor for capacity, then these
trends reflect those seen in other studies, such as NCCS‘s ―Getting What We Pay For,‖ where

18
researchers witness significantly lowered abilities, infrastructure, and competitiveness among
government grant recipient organizations.
Traditional maximum likelihood estimation assumes that the given sample is
representative and therefore information about these organizations can be extended and applied
as an image of the entire universe. This fundamental assumption has been violated here as
demonstrated above.
MODEL
We employ a Heckman sample selection model to identify and correct sample selection
bias. This model uses two steps: First, we estimate a probit model to determine the probability
that a given organization would respond to the survey based on the financial characteristics of
the organization. Second, we estimate maximum likelihood estimation for the continuous portion
of the data to predict a given organization‘s observed outcome.
The Heckman model is based on James Heckman‘s 1976 article on ―the common
structure of statistical models‖ which explores models for truncation, sample selection, and
limited dependent variables (Stata Corporation). This model assumes there exists the relationship
of
yj = xjβ + u1j
as the regression equation of interest. Because the dependent variable is not always observed,
Heckman calculates characteristics for which predict the likelihood of observing a dependent
variable. The model assumes that for observation j the dependent variable will be observed if
zjγ + u2j > 0.
19
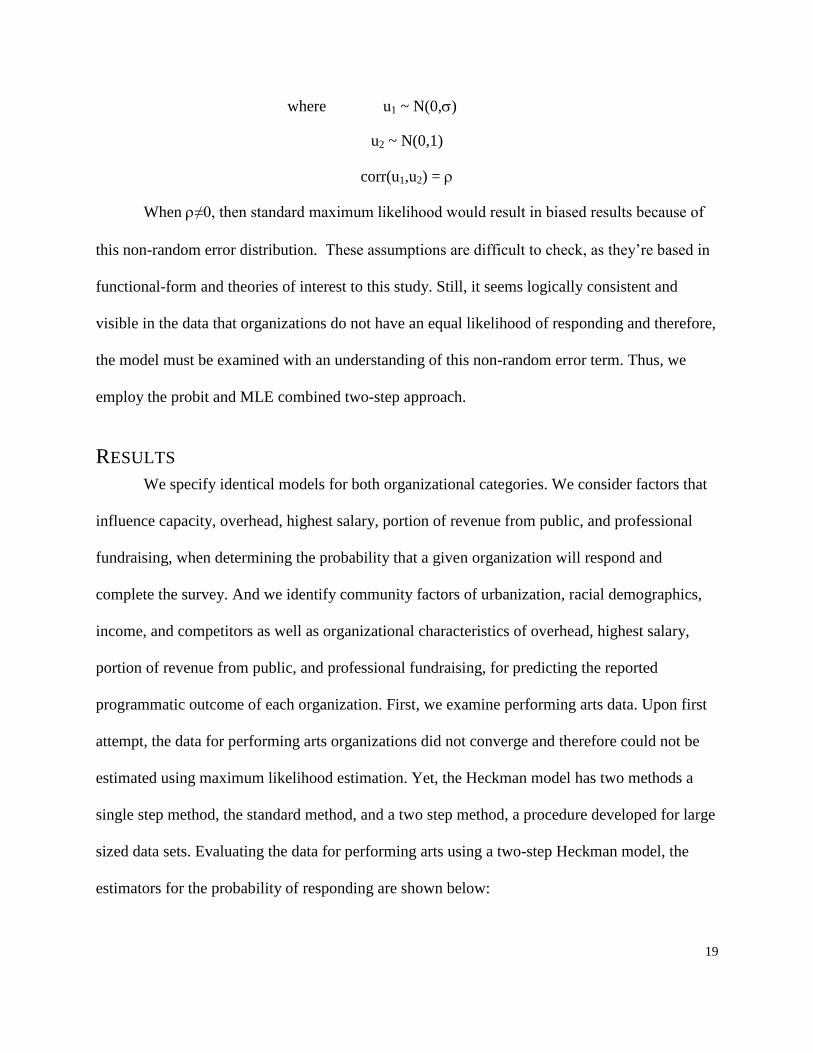
where u1 ~ N(0,)
u2 ~ N(0,1)
corr(u1,u2) =
When ≠0, then standard maximum likelihood would result in biased results because of
this non-random error distribution. These assumptions are difficult to check, as they‘re based in
functional-form and theories of interest to this study. Still, it seems logically consistent and
visible in the data that organizations do not have an equal likelihood of responding and therefore,
the model must be examined with an understanding of this non-random error term. Thus, we
employ the probit and MLE combined two-step approach.
RESULTS
We specify identical models for both organizational categories. We consider factors that
influence capacity, overhead, highest salary, portion of revenue from public, and professional
fundraising, when determining the probability that a given organization will respond and
complete the survey. And we identify community factors of urbanization, racial demographics,
income, and competitors as well as organizational characteristics of overhead, highest salary,
portion of revenue from public, and professional fundraising, for predicting the reported
programmatic outcome of each organization. First, we examine performing arts data. Upon first
attempt, the data for performing arts organizations did not converge and therefore could not be
estimated using maximum likelihood estimation. Yet, the Heckman model has two methods a
single step method, the standard method, and a two step method, a procedure developed for large
sized data sets. Evaluating the data for performing arts using a two-step Heckman model, the
estimators for the probability of responding are shown below:

20
Table 11. Heckman Probit Estimation for
Performing Arts Organizations
Select
Overhead ratio 2.1804
(0.3835)***
Highest salary paid 8.13e-07
(8.98e-07)
Percent of revenue from contributions 0.3144
(0.1880)**
= 1 if hire professional fundraising
= 0 otherwise
-0.0248
(0.3142)
= 1 if in Virginia
= 0 if in North Carolina
-0.6262
(0.1716)***
constant -1.4228
(0.1389)***
Standard errors in parentheses.
*p<.10;** p<.05; *** p<.01.
Overhead ratio and percentage of revenue from contributions both exhibit significant, positive
effects on the probability an organization would respond to a survey. Highest salary explains
almost zero effects and fundraising investment may exhibit negative relationship to response, yet
both of these show very little significance. An organization located in Virginia is actually less
likely to respond to the survey and this coefficient holds strong statistical significance.
Table 12. Two-Step Heckman Estimation for
Performing Arts Organizations
Variable Coefficient
Outcome
Percentage of urban area in zip code -7076.421
(17365.49)
Percentage of white population in zip code 30503.93
(26799.71)
Median income of zip code -0.1337
(0.3690)
Number of competing organizations -357.9615
(1347.564)
Overhead ratio 61693.16
(55947.31)
21
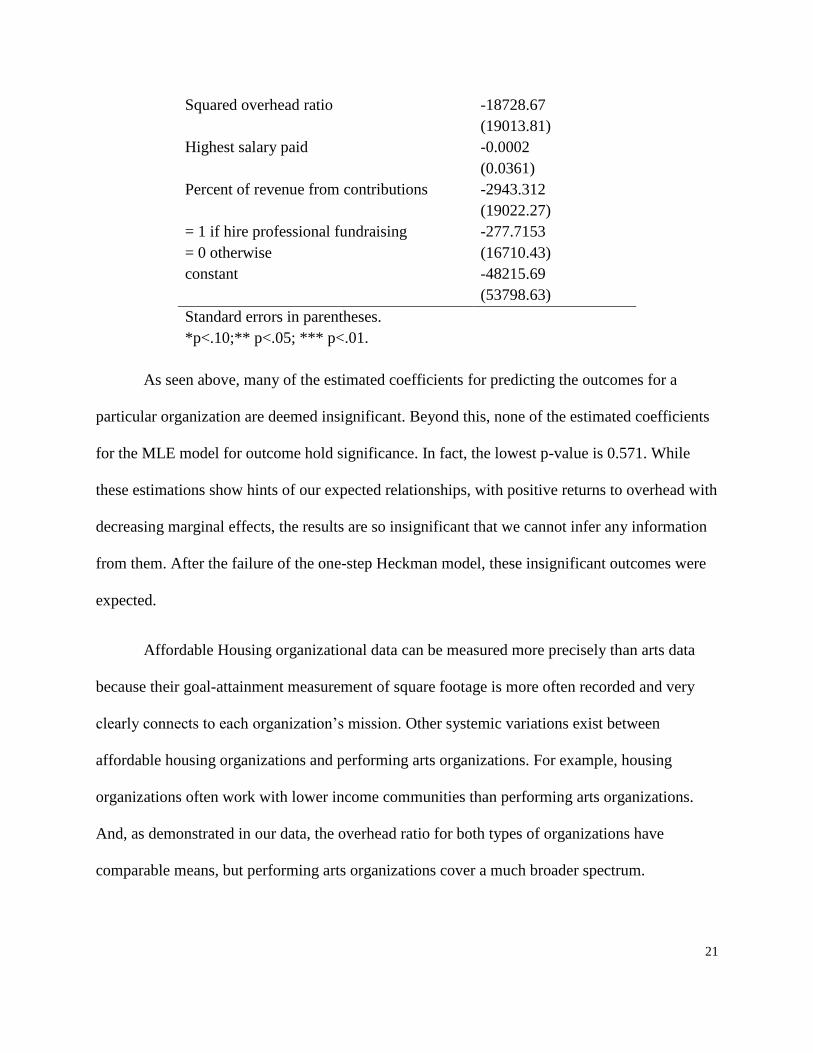
Squared overhead ratio -18728.67
(19013.81)
Highest salary paid -0.0002
(0.0361)
Percent of revenue from contributions -2943.312
(19022.27)
= 1 if hire professional fundraising
= 0 otherwise
-277.7153
(16710.43)
constant -48215.69
(53798.63)
Standard errors in parentheses.
*p<.10;** p<.05; *** p<.01.
As seen above, many of the estimated coefficients for predicting the outcomes for a
particular organization are deemed insignificant. Beyond this, none of the estimated coefficients
for the MLE model for outcome hold significance. In fact, the lowest p-value is 0.571. While
these estimations show hints of our expected relationships, with positive returns to overhead with
decreasing marginal effects, the results are so insignificant that we cannot infer any information
from them. After the failure of the one-step Heckman model, these insignificant outcomes were
expected.
Affordable Housing organizational data can be measured more precisely than arts data
because their goal-attainment measurement of square footage is more often recorded and very
clearly connects to each organization‘s mission. Other systemic variations exist between
affordable housing organizations and performing arts organizations. For example, housing
organizations often work with lower income communities than performing arts organizations.
And, as demonstrated in our data, the overhead ratio for both types of organizations have
comparable means, but performing arts organizations cover a much broader spectrum.

22
Performing arts is less standardized in their approach to providing quality arts than affordable
housing organizations are in providing housing.
Seen below, we include the estimators involved in predicting an affordable housing
organization‘s probability of responding and the same regression with robust standard errors
calculated for comparison:
Table 13. Heckman Probit Estimation for Affordable Housing Organizations
Select
Probit Model Probit Model without outliers
Overhead ratio 0.7880
(0.1111)***
1.7420
(0.2703)***
Highest salary paid 3.34e-07
(3.31e-07)
-1.81e-07
(3.71e-07)
Percent of revenue from contributions 1.3515
(0.1539)***
1.3723
(0.1571)***
= 1 if hire professional fundraising
= 0 otherwise
0.8497
(0.1947)***
0.6795
(0.2220)***
= 1 if in Virginia
= 0 if in North Carolina
-0.0012
(0.0002)***
-0.0012
(0.0002)***
constant -2.0819
(0.1373)***
-2.2234
(0.1641)***
Robust standard errors in parentheses.
*p<.10;** p<.05; *** p<.01.
Affordable housing organizations experience increased probability to respond when overhead is
high, the highest salary is high, the percentage of revenue from public contributions is great, and
professional fundraisers are hired. Again, organizations are less likely to respond if located in
Virginia than North Carolina. This outcome is different than expected. Even though this figure is
statistically significant, the impact is small with a comparative increase of only 0.12%. Of these,
all are statistically significant with p<0.01 except the salary of the highest paid employee which
is not statistically significant.
23
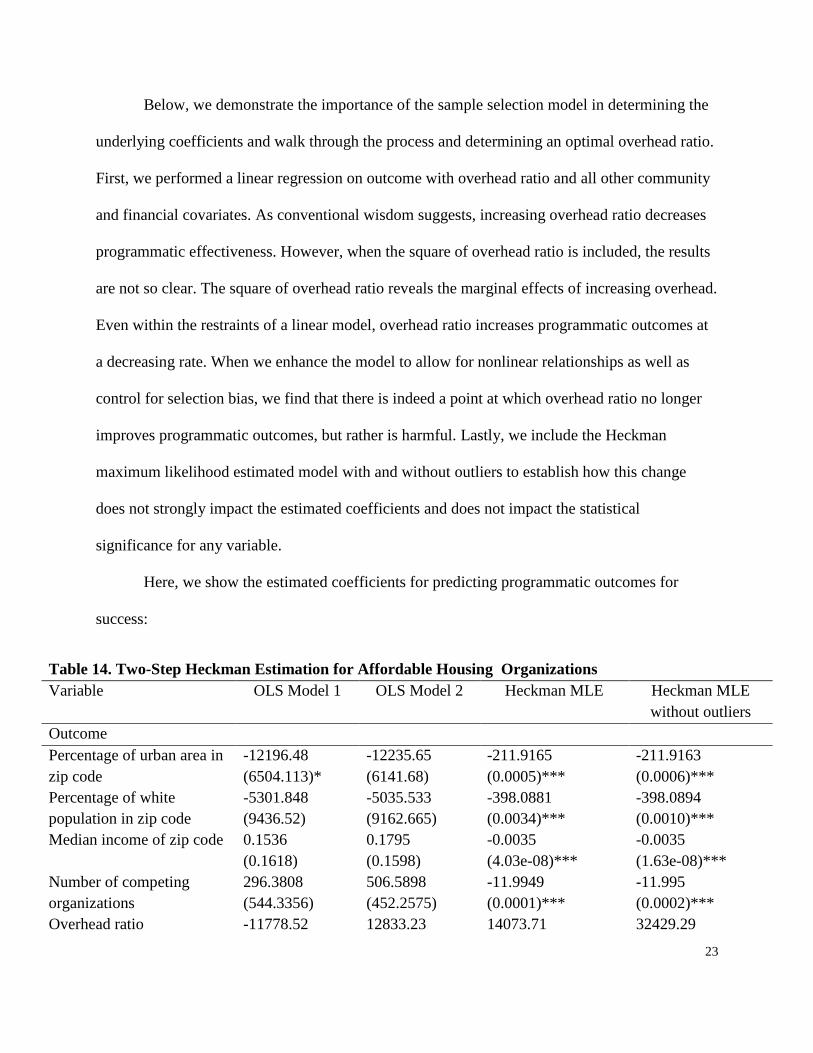
Below, we demonstrate the importance of the sample selection model in determining the
underlying coefficients and walk through the process and determining an optimal overhead ratio.
First, we performed a linear regression on outcome with overhead ratio and all other community
and financial covariates. As conventional wisdom suggests, increasing overhead ratio decreases
programmatic effectiveness. However, when the square of overhead ratio is included, the results
are not so clear. The square of overhead ratio reveals the marginal effects of increasing overhead.
Even within the restraints of a linear model, overhead ratio increases programmatic outcomes at
a decreasing rate. When we enhance the model to allow for nonlinear relationships as well as
control for selection bias, we find that there is indeed a point at which overhead ratio no longer
improves programmatic outcomes, but rather is harmful. Lastly, we include the Heckman
maximum likelihood estimated model with and without outliers to establish how this change
does not strongly impact the estimated coefficients and does not impact the statistical
significance for any variable.
Here, we show the estimated coefficients for predicting programmatic outcomes for
success:
Table 14. Two-Step Heckman Estimation for Affordable Housing Organizations
Variable OLS Model 1 OLS Model 2 Heckman MLE Heckman MLE
without outliers
Outcome
Percentage of urban area in
zip code
-12196.48
(6504.113)*
-12235.65
(6141.68)
-211.9165
(0.0005)***
-211.9163
(0.0006)***
Percentage of white
population in zip code
-5301.848
(9436.52)
-5035.533
(9162.665)
-398.0881
(0.0034)***
-398.0894
(0.0010)***
Median income of zip code 0.1536
(0.1618)
0.1795
(0.1598)
-0.0035
(4.03e-08)***
-0.0035
(1.63e-08)***
Number of competing
organizations
296.3808
(544.3356)
506.5898
(452.2575)
-11.9949
(0.0001)***
-11.995
(0.0002)***
Overhead ratio -11778.52 12833.23 14073.71 32429.29

24
(7009.255)* (22361.37) (3273.974)*** (4825.246)***
Squared overhead ratio -- -30740.52
(24612.59)
-1121.213
(0.0081)***
-1121.211
(0.0029)***
Highest salary paid 0.0030
(0.0357)
-0.0209
(0.0374)
0.0018
(0.0061)
-0.0075
(0.0069)
Percent of revenue from
contributions
-2408.127
(7075.609)
-3379.97
(6614.939)
23509.08
(3834.243)***
24971.31
(4097.169)***
= 1 if hire professional
fundraising
= 0 otherwise
6553.195
(7611.213)
6513.739
(7429.146)
15115.27
(3761.247)***
12629.1
(4544.128)***
constant 14539.24
(11548.74)
11695.33
(11249.26)
-35032.45
(4247.13)***
-39318.32
(4175.564)***
Robust standard errors in parentheses.
*p<.10;** p<.05; *** p<.01.
In predicting programmatic outcome, every community characteristic is negatively
related to outcome. So, increased urbanized relates to decreased outcome, increased white
population relates to decreased outcomes, higher median income explains a very small decrease
in outcome, and more competitors explains a significant decrease in outcomes. Percentage of
revenue from public contributions explains an increase in outcomes as the percentage increases
and an organization which invests in professional fundraising exhibits higher outcomes on
average. Overhead, most importantly, is positively correlated to increased programmatic
outcomes with decreasing marginal returns as increases the square of overhead explains
decreases in outcomes. Lastly, while the highest salary holds a positive coefficient, this
estimation holds no statistical significance.
A simple test for heteroskedasticity is not possible with the Heckman model; therefore,
we compare the difference between our standard model and a robust calculation. We find that
with the robust calculation, while there are changes in the standard errors, there are no changes in
the significance of any estimated coefficients. With such interrelated concepts and information, a
25
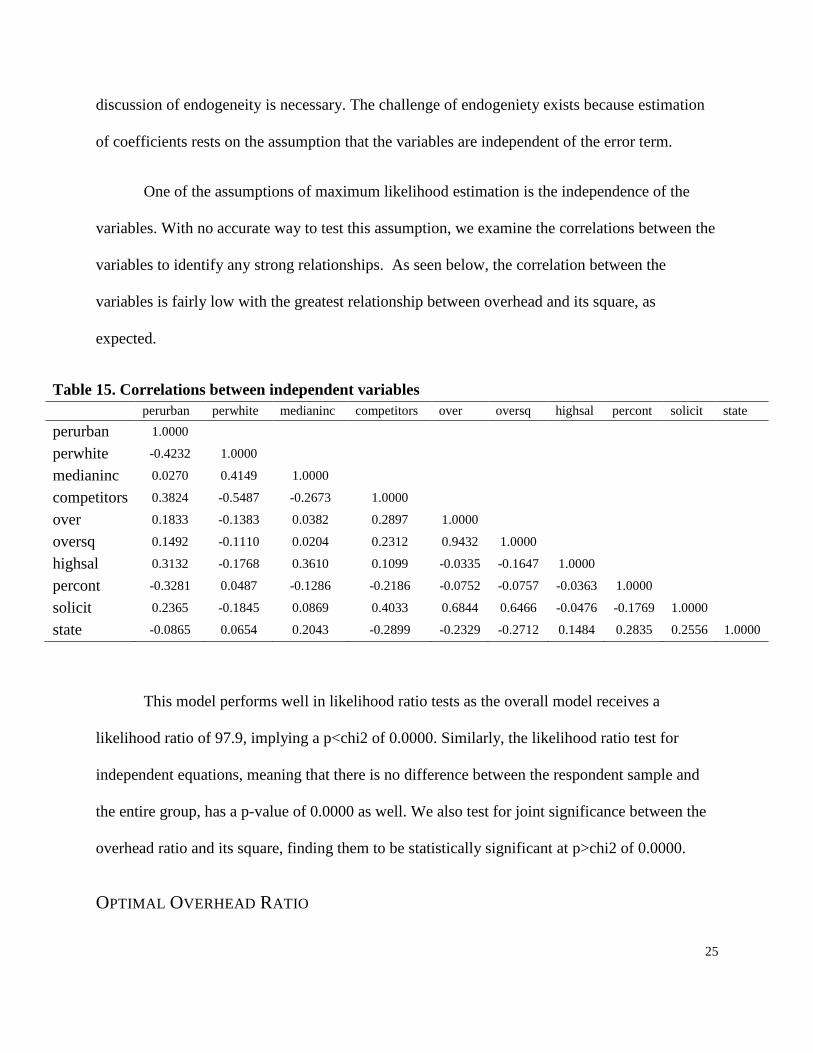
discussion of endogeneity is necessary. The challenge of endogeniety exists because estimation
of coefficients rests on the assumption that the variables are independent of the error term.
One of the assumptions of maximum likelihood estimation is the independence of the
variables. With no accurate way to test this assumption, we examine the correlations between the
variables to identify any strong relationships. As seen below, the correlation between the
variables is fairly low with the greatest relationship between overhead and its square, as
expected.
Table 15. Correlations between independent variables
perurban perwhite medianinc competitors over oversq highsal percont solicit state
perurban 1.0000
perwhite -0.4232 1.0000
medianinc 0.0270 0.4149 1.0000
competitors 0.3824 -0.5487 -0.2673 1.0000
over 0.1833 -0.1383 0.0382 0.2897 1.0000
oversq 0.1492 -0.1110 0.0204 0.2312 0.9432 1.0000
highsal 0.3132 -0.1768 0.3610 0.1099 -0.0335 -0.1647 1.0000
percont -0.3281 0.0487 -0.1286 -0.2186 -0.0752 -0.0757 -0.0363 1.0000
solicit 0.2365 -0.1845 0.0869 0.4033 0.6844 0.6466 -0.0476 -0.1769 1.0000
state -0.0865 0.0654 0.2043 -0.2899 -0.2329 -0.2712 0.1484 0.2835 0.2556 1.0000
This model performs well in likelihood ratio tests as the overall model receives a
likelihood ratio of 97.9, implying a p<chi2 of 0.0000. Similarly, the likelihood ratio test for
independent equations, meaning that there is no difference between the respondent sample and
the entire group, has a p-value of 0.0000 as well. We also test for joint significance between the
overhead ratio and its square, finding them to be statistically significant at p>chi2 of 0.0000.
OPTIMAL OVERHEAD RATIO

26
After defining the probit portion of the model, the remaining information is a maximum
likelihood estimation. Below, we calculate the optimal overhead based on estimated coefficients
from our calculations for affordable housing organizations. For the sake of clarity, we represent
this relationship through a linear model as follows:
Effectiveness = β0 + β1(perurban) + β2(perwhite) + β3(medianinc) + β4(competitors) + β5(over)
+ β6(oversq) + β7(highsal) + β8(percont) + β9(solicit)
In order to find the maximum of this equation, we take the derivative with respect to overhead
ratio (over) and solve for when the equation equals 0. At this point, the slope with respect to
overhead is flat, at the top of a parabola.
0 = β5 + 2β6(over)
We solve for overhead ratio (over) to make the calculation:
over = -β5 / 2β6(over)
We can substitute our estimated coefficients from our model and find:
over = -32,429.29 / (2 -1,121.211) = 0.1446
We find the optimal overhead ratio to be around 14.5%. This is fairly in line with the existing
guidelines for government grantmaking, but falls above many guidelines set forth by watchdog
organizations. One may note that the above overhead ratio is calculated without outliers because
we lack sufficient data to estimate optimal overhead at this extreme end of the spectrum. Should
these observations be included, the optimal ratio drops to 6.3%. This drastic difference after
removing only 5 observations demonstrates the sensitivity and variability of this estimation.
27
Future estimations with larger sample sizes, more diverse organizational types, and more
complex calculations could produce a more reliable estimate.
DISCUSSION
Overall, this model seems to have successfully supported our hypothesis that overhead
ratio is correlated to programmatic outcomes, and both too little and too much overhead can
inhibit these outcomes. While this research helps to begin a path toward more informed nonprofit
funding, many more questions remain unanswered.
First, the programmatic outcomes for performing arts organizations vary largely in
expected quality (from elementary school ballet to Symphony Orchestra). While we sought to
capture this information through ticket sales, this requires assuming the only factors to influence
an individual‘s choice to attend a performance are price and quality. One may suggest they go
because a relative or friend is in the production, even this as providing recruitment for attendance
and number of individuals impacted by the organization can be helpful information. Yet, what
happens when an individual wants to attend the performance but no seats remain? The number of
tickets sold may simply be a function of the size of the venue. Because of these many factors,
tickets are the best, but imperfect measure, and likely contributed to the difficulties in modeling
this data.
Once the performing arts data did not converge or produce significant results, we lost the
ability to compare results across organizational types. This weakens the generalizability of the
results. Because we cannot ensure that identical patterns for prediction of programmatic
overhead exist in other organizational categories, we cannot simply apply these findings to every
organization, but rather need to study this further. For example, while the mean of overhead ratio

28
was comparable between performing arts and housing organizations, the range of overhead was
greater for performing arts organizations with a standard deviation of 0.26 compared to 0.16
from housing. We must caution policymakers and donors from using this guideline as a general
rule for all nonprofit organizations. We instead encourage similar studies of larger regions and
more organizational categories to help create guidelines which fit the organizational type better
and highlight any larger patterns within nonprofit organizations.
This model, because of its quantitative nature, only pertains to organizations which can
satisfy goal-attainment missions. These missions must be measurable and consistent between
organizations. One can imagine many organizations that cannot fit this mold such as disaster
relief or education organizations.
CONCLUSION
From this research, we find that investing in infrastructure increases capacity, as
measured by ability to respond, and effectiveness, as measured by programmatic outcomes.
Individual donors, grant-making foundations, and government agencies should consider their
goals in selecting recipient organizations and may want to support organizations who partake in
the long process of developing high quality infrastructure. Rather than strictly limiting an
organization‘s overhead ratio, funders should allow organization‘s overhead to increase to invest
in necessary improvements like qualified employees. Government agencies already allow
nonprofit organizations to spend up to 15% of their funding on administrative costs and they
should continue to do so. Future research should consider a broader range of nonprofit
organizations to see if this optimal overhead ratio of 15% fits more organization types than
affordable housing. Donors should discourage charity organizations to simplify organizational
29
comparisons and rankings to rewarding low overhead, without regard to quality of service and
effectiveness.
The issue of nonprofit evaluation is complicated and only starting to be understood. This
research should empower and caution practitioners to take the risks to invest in their
organizations, while maintaining their focus on programmatic outcomes and accomplishing their
mission. We hope to call researchers to examine these issues more fully to improve our
communities with efficient and effective nonprofit services.
30
WORKS CITED
Au, C. (1996). Rethinking organizational effectiveness: Theoretical and methodological issues in
the study of organizational effectiveness for social welfare organizations. Administration in
Social Work, 20(4), 1.
Carlson, A., Lino, M., Juan, W., Hanson, K., & Basiotis, P. P. (2007). Thrifty food plan,
2006 No. CNPP-19)Center for Nutrition Policy and Promotion U.S. Department of
Agriculture. Retrieved
fromhttp://www.cnpp.usda.gov/Publications/FoodPlans/MiscPubs/TFP2006Report.pdf
Charity Navigator. (2011). America's largest charity evaluator. Retrieved 10 Apr, 2011,
from http://www.charitynavigator.org/
Corporation for National & Community Service. (2008). North carolina profile - volunteering in
america. Retrieved 8 April, 2011, from http://www.volunteeringinamerica.gov/NC
Crutchfield, L., & University).,Fuqua School of Business Duke. (2008). Forces for good : The
six practices of high-impact nonprofits (1st ed. ed.). San Francisco: Jossey-Bass.
Forbes, D. (1998). Measuring the unmeasurable: Empirical studies of nonprofit organizational
effectiveness. Nonprofit and Voluntary Sector Quarterly, 27(2), 183-184-202.
Froelich, K. A., & Knoepfle, T. W. (1996). Internal revenue service 990 data: Fact or
fiction? Nonprofit and Voluntary Sector Quarterly, 25(1), 40.
Frumkin, P. (2001). Going beyond efficiency. Nonprofit Quarterly, 8(2)
31
Glaser, J. (1994). The united way scandal: An Insider’s account of what went wrong and why.
New York, NY: John Wiley & Sons, Inc.
Gregory, A. G., & Stid, D. (2009, How government can spur charity
performance. Philanthropy, Retrieved from http://philanthropy.com/article/How-
Governments-Can-Spur-High/57677/
Hager, M., & Greenlee, J. (2004). How important is a nonprofit's bottom life? the uses and
abuses of financial data. In P. Frumkin, & J. B. Imber (Eds.), In search of the nonprofit
sector (1st ed., pp. 85-86-96). New Brunswick, NJ: Transaction Publishers.
Hager, M., Pollak, T., Rooney, P., & Wing, K. (2005). Paying for not paying for
overhead. Foundation News and Commentary, 46(3)
Herman, R. (1990). Methodological issues in studying the effectiveness of nongovernmental and
nonprofit organizations Nonprofit and Voluntary Sector Quarterly, 26, 185-186-206.
Independent Sector. (2001). Giving and volunteering in the united states, Retrieved from
http://www.independentsector.org/PDFs/GV01keyfind.pdf
National Center for Charitable Statistics. NCCS national taxonomy of exempt entities - core
codes (NTEE-CC). Unpublished manuscript. Retrieved 2011,
fromhttp://nccs.urban.org/classification/NTEE.cfm
Nonprofit Overhead Cost Study. Getting what we pay for: Low overhead limits nonprofit
effectiveness (Research Brief No. 3) National Center for Charitable Statistics.
32
North Carolina Center for Nonprofits. Why nonprofits matter: Quick facts. Unpublished
manuscript. Retrieved from, http://www.ncnonprofits.org/NAM/quickfacts.pdf
Pallotta, D. (2008). Uncharitable: How restraints on nonprofits undermine their potential.
Lebanon, NH: Tufts University Press.
Princeton Survey Research Associates. (2001). Final report: BBB wise giving alliance donor
expectations survey. Princeton, NJ: Princeton Survey Research Associates.
Salamon, L., Lessans Geller, S., & Wojclech Sokolowski, S. (2008). Virginia's nonprofit sector:
An economic force No. 32) Retrieved
fromhttp://www.ccss.jhu.edu/pdfs/NED_Bulletins/NED_Virginia_Final.pdf
VANNO. (2008). The virginia nonprofit sector Retrieved from http://www.vanno.org
Weber, N. (1994). Misusing charitable statistics in evaluating fundraising performance. New
Directions for Philanthropic Fundraising, (3), 115-116-128.
33
APPENDIX
SURVEY