Embed Size (px)
Citation preview
A closer look to the foreign investments in the NetherlandsErasmus University Rotterdam
Erasmus School of Economics
Department of Economics
Supervisor: Prof. Dr. Giovanni Facchini
Name: Eric Koppenol
Student number: 287566
Email address: [email protected]
Key-words: FDI, the Netherlands, panel data, OLS analysis, sector-level, fixed/random effects.

2
Content
1. Abstract.............................................................................................................4
2. Introduction.......................................................................................................5
3. Overview Literature..........................................................................................8
3.1 Theories with respect to motivation behind FDI...............................................................83.1.1 Motivation.................................................................................................................................................93.1.2 Forms.......................................................................................................................................................10
3.2 Effect of inward FDI on host-country development.......................................................113.2.1 Market effects..........................................................................................................................................113.2.3 Spill-over effects......................................................................................................................................13
3.3 FDI Stocks vs. FDI Flows...............................................................................................14
3.4 Traditional Determinants of FDI.....................................................................................15
4. FDI in the Netherlands....................................................................................16
4.1 Inward FDI in the Netherlands........................................................................................16
4.2 Sector characteristics.......................................................................................................194.2.1 Agriculture & Fishing.............................................................................................................................224.2.2 Mining, quarrying and petroleum...........................................................................................................234.2.3 Metal and electro-technique....................................................................................................................244.2.4 Food, beverages and tobacco..................................................................................................................264.2.5 Construction............................................................................................................................................274.2.6 Trade.......................................................................................................................................................284.2.7 Transport, storage and communication..................................................................................................294.2.8 Finance....................................................................................................................................................30
5. Methodology...................................................................................................32
5.1 The explanatory variables...............................................................................................32
5.2 Motivation of the variables:............................................................................................335.2.1 Size of the domestic sector.......................................................................................................................335.2.2 Sectoral labor productivity......................................................................................................................335.2.3 Capital-labor ratio..................................................................................................................................345.2.4 Sector wage level.....................................................................................................................................355.2.5 Sector R&D Expenses.............................................................................................................................35
6. Empirical Study...............................................................................................37
6.1 The model........................................................................................................................376.1.1 Simple OLS Method.................................................................................................................................386.1.2 Simple OLS Method with period Fixed Effects.......................................................................................406.1.3 Simple OLS Method with sector Fixed Effects........................................................................................426.1.4 Simple OLS Method with period and sector Fixed effects......................................................................436.1.5 Simple OLS Method with period Random Effects...................................................................................446.1.6 Simple OLS Method with sector Random Effects....................................................................................45

3
7. Conclusions.....................................................................................................47
8. Limitations.......................................................................................................49
9. Literature.........................................................................................................50
10. Appendices....................................................................................................54

4
1. Abstract
This paper tries to investigate the drivers of foreign investors to invest in the
Netherlands. There is a lot of literature about determinants of Foreign Direct
Investments (FDI), and this literature is used in the paper. Determinants from
this literature, together with new determinants from this paper are tested for the
Netherlands in eight different sectors. The results are that the size of the market,
the labor productivity, the capital-labor ratio, the wage level and the expenses
for research and development in sectors, all have impact on the level of FDI
stock in the sectors.
5
2. Introduction
FDI are the cross-border investments made by an enterprise located in the
investing country into another enterprise, which is located in a different country.
The motivation of the direct investor is a strategic long-term relationship with
the enterprise which is invested in, to ensure a significant degree of influence in
the management of the direct investment enterprise.
The Organization for Economic Co-operation and Development (OECD)
suggests that FDI is “a key element in the rapidly evolving international
economic integration, also referred to as globalization. FDI provides a means
for creating direct, stable and long-lasting links between economies. Under the
right policy environment, it can serve as an important vehicle for local
enterprise development, and it may also help improve the competitive position of
both the recipient (host) and the investing (home) economy. In particular, FDI
encourages the transfer of technology and know-how between economies. It also
provides an opportunity for the host economy to promote its products more
widely in international markets. FDI, in addition to its positive effect on the
development of international trade, is an important source of capital for a range
of host and home economies.”
What we see from these definitions is that FDI is, for the direct investor, the
‘home-country’, a way to gain a strategic relationship on the long-term to get
influence in the other economy, while the recipient, the ‘host-country’, can
develop to the level of the home-country. In this sense it is not surprising that
countries take efforts to attract FDI and that all countries that are in the financial
position to invest abroad will do this.
In this paper the focus will be on the inward FDI in the Netherlands. The
Netherlands is an interesting case, because while serving as a host-country, it
does not need to grow to the level of home-country because the Netherlands
6
itself is already developed very well. But it does attract 2,7% of all investments
in Europe1. There are a lot of studies that researched inward FDI for developing
countries, but not for developed countries.
On the other hand it is not surprising that the Netherlands tries to attract FDI and
that it succeeds in this, because, following Markusen (1995), the developed
countries, like the Netherlands, are not only the largest sources of FDI
worldwide, but also the most important destinations of FDI flows.
This research will try to explain the motives that other countries have to invest
in the Netherlands in specific sectors. Sectors have different characteristics
when we look at economic variables. We can think of size of the sector, labor
productivity, employment, and so on. In this paper I will use a model that
combines some of these variables in an economic model. This model will, after
some econometric techniques, identify the most important variables. The
techniques will take into account the evolution of the significance of the
variables across sectors and time.
The FDI data that will be used are yearly FDI stocks across eight sectors in the
Netherlands in the period 1984-2008. In this period the FDI stocks developed
enormously in all sectors and the goal of this paper is to explain this
development.
Chapter 3 will start with an overview of FDI. It will present the history about the
definitions and findings about FDI and demonstrate the motives, types, effects
and determinants of FDI. Chapter 4 will show the FDI stocks and other relevant
characteristics in the Netherlands at sectoral level. Chapter 5 will cover the
methodology used in this paper, and will describe the explanatory variables
used. Also it will show the source of the data. Chapter 6 will show the results of
the statistical research and how we must interpret these results. Chapter 7 will
1 Marc van den Eerenbeemt, Strijd om buitenlandse investeringen harder, de Volkskrant, 2008
7
cover the concluding remarks, and chapter 8 will end up with some limitations
of the research.
8
3. Overview Literature
3.1 Theories with respect to motivation behind FDI
One of the oldest theories concerning FDI is due to Hymer (1960). In his work
Hymer stated that FDI has a function for a firm to transfer knowledge and other
tangible and tacit firm assets, to organize the production abroad. Firms are
searching for circumstances that cause a firm to control an enterprise in a
foreign country. His findings are focussed on the benefits for the home-country.
He did not write about location and internalization2 yet. Vernon (1966)
suggested instead that producers choose their locations for production in
countries that have most factors3 available for the products to survive, while
Buckley and Casson (1976) emphasised the ability to innovate as the basis for
internalization of the cross-border economic activity. Dunning (1980) presented
a more general framework based on ownership, location and internalization
(OLI) to analyse the motives and locations to invest abroad. He identified three
main advantages:
- Ownership advantages: These advantages are most of the times intangible
and can be transferred at low cost within the Multinational Enterprise
(MNE). They give higher revenues or lower costs which will compensate
the costs coming from operating abroad. Examples are brand name and
economies of scale.
2 Internalization is the measure of involvement in a foreign country. A MNE can decide to
take control all foreign firm’s specific assets but also choose to do some transactions with it.3 As example Vernon used the U.S. which had, in that time, the highest average income, but
also the highest labor costs. The high labor costs however, increased the demand for
consumer goods. He gives as practical example that the high costs of laundresses contributed
to the origins of the home washing machine.

9
- Location advantages: These advantages are important for the destination
of the investment abroad. The host-country must have factors, which are
connecting with the MNE’s strengths.
- Internalization advantages: These advantages are relevant when choosing
the mode of entry. MNE’s often choose internalization to carry out a
transaction when the market does not exist or functions poorly to avoid
high transactions costs.
Many of the papers published after 1980 are based on the OLI model from Dunning.
3.1.1 Motivation
According to Dunning (1980), in his OLI model, the motivation behind a MNE
deciding to invest abroad can be separated in different types:
- Market Seeking FDI: The aim of this type of FDI is to create access to
regional markets and to try to compete with local suppliers with finished
products.
- Efficiency Seeking FDI: With this type of FDI investors are trying to
structure the investments in a way that they are efficiently allocated across
international economic activities. This can be achieved by lower wages,
lower taxes or higher productivity (via reduced processing) and better
logistics and transportation.
- Resource Seeking FDI: The aim of this type of FDI is to create access to
natural resources, which are not available or available only at high costs
in the home country.
- Strategic asset-seeking FDI: Investors are protecting or augmenting the
current ownership specific advantages of the MNE or trying to reduce
those advantages of the competitors with this type of FDI.
10
3.1.2 Forms
Two forms of FDI are horizontal and vertical FDI. With horizontal FDI a MNE
carries out the same activities in different countries worldwide. There will be
similar factories in all countries, producing the same good. For example, the
biggest automotive producers use horizontal FDI, having a separate plant in
different countries. Examples are the investments by the German BMW in South
Carolina from 2000 until now, or the Japanese Nissan in Canton, Mississippi in
2003.
Vertical FDI takes place when the multinational fragments the production
process internationally, locating a stage of production in the country where it
can be produced at the lowest costs. This means that these investment-projects
are different in different countries. For example oil companies, who invest in all
stages of the production process. They invest in mining, manufacturing and
distribution of oil4, but they do this in different countries.
An implication of this distinction is that plants that will export a large share of
their output back to the home-country will have more vertical FDI, because they
are not aiming on the market in the foreign country, but they are aiming on
gaining lowest production costs5, while firms that are selling in other countries6
will have more horizontal FDI to gain a market share in the foreign market.
Furthermore most vertical FDI is between countries which have different factor
endowments. Each country is most efficient in producing the good which needs
the production factor that is abundant in this country7. Before a MNE decides to
4 Some oil companies also hold investment further downstream in the production of petro-
chemicals widely used as intermediate products by other branches of manufacturing.5 These products will be intermediate products most of the times.6 The motive depends on the level of development of the host country. For instance, Japanese
firm investing in the Netherlands will do this to gain a market-share in the Netherlands, but
when they would invest in Russia it can be for the resources or the lower wages.7 Many developed firms choose their host-countries that have a lot of cheap labor.
11
carry out a vertical FDI project, it must make an important consideration. Are
the extra trade costs coming with vertical FDI (think of transportation and
import costs) less than the extra benefits? If so, then it can be a good choice to
invest vertically.
3.2 Effect of inward FDI on host-country development
As economic activities have become more global, investors have started to use
more and more international financing. An increase in inward investments by
foreign direct investors implies that additional capital is injected into the host-
economy and it is likely that this will have an impact on the economic
performance of the host-economy. Within a proper policy framework, FDI
assists host-countries in developing local enterprises. FDI also promotes
international trade through access to markets and it contributes to the transfer of
technology and know-how. Caves (1974) found out that FDI improves the host-
country productivity by stimulating better resource allocation among firms and
industries, and by transferring technology from foreign firms to local firms in
the host-country. Globerman (1979) and Blomström and Persson (1983) also
concluded that the host-country productivity can increase when there is FDI
injected to a country.
In addition to these effects, FDI has an impact on the development of the market
and the factor market, and influences other aspects of economic performance
through additional spill-over effects (Barba Navaretti and Venables 2004).
These effects are explained in detail in the following subchapters.
3.2.1 Market effects
There are not only benefits related to the presence of foreign firms. Negative
effects for local producers might also occur. For instance, new entrants may
cause some less productive local firms to exit the market due to heavier
competition. Also, these more productive entrants can cause the price to drop, an
12
effect which will be welcomed by the consumers, but may be negative for
government earnings8.
More competition means also that the quality of the products is likely to
increase, because different competitors will try to create better products to gain
the largest market share, or there will be more varieties available for the
consumers, when competitors decide to compete with the production of
substitutes.
3.2.2. Factor market effects
Factor market effects are another consequence of inward FDI. New entrants will
bring capital, so the supply of capital in the host-country will increase. As
mentioned before, this will have a positive economic impact on the host-
country. Other interesting effects take place in labor markets, where different
issues arise. The first issue is whether the presence of MNEs raises
employment9. The second issue concerns the labor demand and in particular its
skill composition. Does the presence of MNEs raise the demand for skills in the
host-economy10? How will the factor prices react to the changes in factor
demands? Wage effects depend on the relative skill intensity of the activities
carried out by MNEs and on the relative skill abundance of the countries where 8 Extra entrants will increase the supply of the product, and this extra supply will drop the
price. This is called tariff-jumping. For some firms competing at the lower price will be
impossible because they can not retain profitable at this price. Also the taxes earned by the
government on the product will be lower. On the other hand, a lower tariff can lead to higher
demand, which will increase the government revenues.9 New investments can raise the employment when the level of the work is matching the level
of the available workforce, but when MNE’s will do technological investments which need a
small but skilled workforce, that creates a better or a cheaper product, domestic competitors,
that are using a lot of unskilled labor, have to adjust and increase the product or exit the
market.10 Depends on the skill level of the FDI project and the current skill level of the workforce in
the host economy.
13
they operate. The investments made in a country must match the available skill
level in the host-country to have a positive effect in the host-country.
3.2.3 Spill-over effects
Domestically owned firms might benefit from the presence of foreign firms via
spill-over effects. Workers employed by foreign firms or participating in joint
ventures may accumulate knowledge, which is valued outside the firm. As
experienced workers leave the foreign firms, following Aitken and Harrison
(1999) this human capital becomes available to other domestic firms, raising
their labor productivity. These spill-over effects are called technological
externalities. Other forms of technological externalities are technology transfer
and learning about markets. For instance, following Blomström and Kokko
(1999), due to heavier competition caused by the entrance of multinationals,
domestic firms are forced to use their existing resources more efficiently or
search for new technologies.
Following Markusen and Venables (1999) there might be also pecuniary
externalities. These arise when there are national and international firms using
intermediate products on the market. In this situation MNEs will strengthen the
local producers through backward linkages, by increasing the productivity, the
product diversity and the quality11. It is also possible that domestic firms gain
access to improved or cheaper intermediate input. These are called forward
linkages.
11 Javornic (2004) explains that these spillovers may take place through (i) direct knowledge
transfer from foreign customers to local suppliers (ii) higher requirements for product quality
and on-time delivery introduced by multinationals, which provide incentives to domestic
suppliers to upgrade their production management or technology and (iii) multinational entry
increasing demand for intermediate products, which allows local suppliers to reap the benefits
of scale economies.

14
3.3 FDI Stocks vs. FDI Flows
I have to clarify an important difference between FDI stocks, which I will use in
the rest of this paper, and FDI flows. As mentioned before, the concept of direct
investment involves the acquisition of a lasting interest in a foreign enterprise’s
capital, with the aim of having an effective voice in the management. FDI stock
is the value of the share of their capital and reserves (including retained profits)
attributable to the parent enterprise (equal to total assets minus total liabilities),
plus the net indebtedness of the associate or subsidiary to the parent firm. FDI
flows consist of the net sales of shares and loans (including non-cash
acquisitions made against equipment, manufacturing rights, etc.) to the parent
company plus the parent firm’s share of the affiliate’s reinvested earnings plus
total net intra-company loans (short- and long-term) provided by the parent
company. In the dataset used in this paper the FDI stocks in a year are the sum
of the FDI flows of all the previous years and the year itself. However, there are
a lot of factors which can change the value of the FDI stock12.
12 Stock data may change as the result of many factors such as changes in capital participation
and in intra-group lending positions, which are the capital flows and may be due to such
transactions and purchases or sales of shares and the granting or repayment of intra-group
credits and loans. Changes ensuing from the retention of profits or the absorption of losses by
subsidiaries or changes ensuing from exchange rate differences, other revaluations and
adjustments may also lead to changes in stock data.
15
3.4 Traditional Determinants of FDI.
Reuber et al (1973) identified traditional determinants of FDI:
- A lucrative market
- Liberal host government policies
- Technological infrastructure
- Skilled labor
- Cultural proximity
Lim (2001) added to these determinants:
- Economic distance
- Production factor costs
- Business climate
- Fiscal incentives
The research in this paper will be based on these determinants. Not all
determinants can be taken into account in my analysis, because I do not have
information on the country of origin of the investments.
The benefits of inward FDI are obvious for less developed countries and there
are a lot of studies which did research on this question, but also developed
countries like the Netherlands are trying to attract FDI. But what drives foreign
investors to invest in the Netherlands? I will try to determine these motives after
I presented an overview of the inward FDI in the Netherlands and the statistical
research in this paper.
16
4. FDI in the Netherlands
All countries try to attract investments from foreign countries because
investments can, and in most of the times will, improve economic performance,
as explained in the previous section of this paper. Also for the Netherlands
inward FDI is very important.
4.1 Inward FDI in the Netherlands
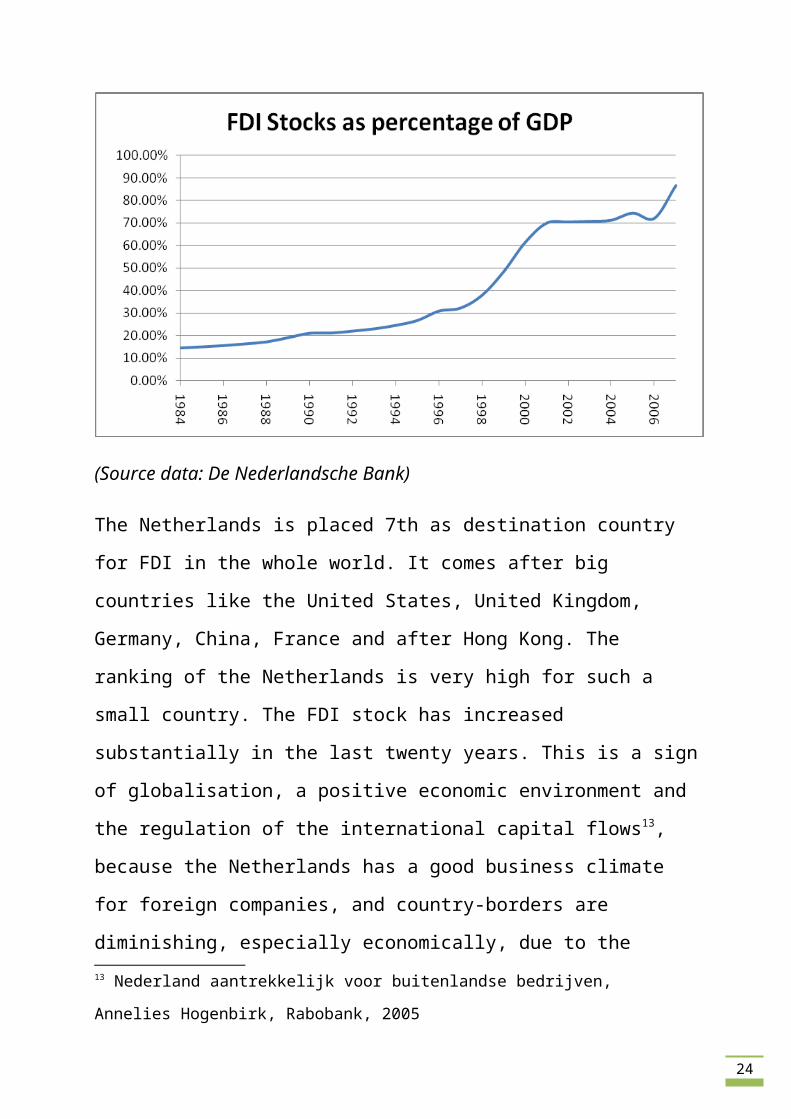
The ratio of inward FDI stocks compared to the total GDP in the Netherlands is
increasing, which is an indication that FDI is becoming more and more
important. This ratio can be a measure of the rate of globalisation of the
Netherlands and a measure of relative attractiveness of the economy. The
development of the FDI stock as a percentage of GDP is shown in the following
graph.
Graph 1: FDI Stocks as percentage of GDP
(Source data: De Nederlandsche Bank)
17
The Netherlands is placed 7th as destination country for FDI in the whole world.
It comes after big countries like the United States, United Kingdom, Germany,
China, France and after Hong Kong. The ranking of the Netherlands is very high
for such a small country. The FDI stock has increased substantially in the last
twenty years. This is a sign of globalisation, a positive economic environment
and the regulation of the international capital flows13, because the Netherlands
has a good business climate for foreign companies, and country-borders are
diminishing, especially economically, due to the globalisation and the
international regulations that resulted from this. The Netherlands is a very open
country with respect to foreign investors.
The Netherlands is favored by foreign companies especially as a location for
European sales offices, headquarters and distribution centers.
Projects from Asia account for 60% of the total stock of FDI. In 2003 Asian
projects only took up 40%. The Asian projects represent more than half of the
new jobs. The number of projects from India, Korea and China grows most
rapidly, followed by Singapore and Japan. This is in line with the bigger
acquisition effort made in upcoming markets (Asia and the Gulf Region) where
the Netherlands Foreign Investments Agency (NFIA) now has 11 offices.
An organization created to attract investments in the Netherlands, the NFIA, is a
department of the Ministry of foreign affairs. This organization gives the
following reasons to invest in the Netherlands:
1. Strategic location in Europe: The ideal location, the high level
infrastructure, combined with the great accessibility makes the
Netherlands very attractive for foreign companies.
13 Nederland aantrekkelijk voor buitenlandse bedrijven, Annelies Hogenbirk, Rabobank, 2005
18
2. International business environment: The Netherlands has a ‘pro-business’
environment, which makes it easier for new investors to establish. Trade
and openness to trade are burnt in the Dutch culture. Dutch business-
partners are world class.
3. Superior logistics and technology infrastructure: The Netherlands has one
of the largest ports in the world, located in Rotterdam, and an above
average airport, next to Amsterdam, which is of high standards. Also the
technology level of communication and electronic commerce is of high
standards in the Netherlands. Companies looking for a country to take
advantage of a very modern technology system might be thinking of
investing in the Netherlands.
4. Highly educated, multilingual and flexible workforce: The workforce in
the Netherlands belongs to the best educated and flexible workers in
Europe. The professionals are educated multilingual individuals, and this
makes it easy for them to work in any industry, serving customers
worldwide.
5. Quality of life: The standards of living in the Netherlands are high, while
the costs of education, housing and cultural activities are low compared to
other Western European countries.
6. Favorable fiscal climate: Corporate tax is 25,5%, which is lower than the
European average. Dividend tax is 15% since 2007, while it was 25%
before. Together with other features of the tax regime this makes the
Netherlands a very good place to invest in. Some headquarters of
international firms even locate in the Netherlands, like IKEA.
19
These reasons do match the key determinants in attracting FDI we have
identified in the previous section.
Following a press release from this year, I conclude that the NFIA is making
progress, despite the current economic situation in the world14. Investments rose
in 2007 and 2008, but for 2009 the Ministry of Economic Affairs expects a
decrease of new investment projects. The goal for the NFIA in 2010 is to retain
the current investors and stimulate the expansion of the investments.
In 2005 and 2006 the numbers of foreign R&D projects also rose. The Ministry
of Economic Affairs states that this is really important for the Netherlands,
because the acquisition of foreign R&D is a key factor in the strengthening of
Dutch innovation power.
4.2 Sector characteristics
As mentioned in the introduction this research focuses on the foreign
investments in specific sectors. Each sector can have different characteristics
which makes the sector attractive. These characteristics will be inserted in an
economic model which will be presented in the next chapter. This part of the
paper is a discussion of the characteristics of the sectors.
The FDI data I collected from DNB (De Nederlandsche Bank) and the data
about the explanatory variables are from CBS (Centraal Bureau Statistiek). The
data is aggregated following a hierarchic classification, called SBI’93. This
classification is based on the classifications from the European Union and the
United Nations. The data available covers these sectors:
- Agriculture & Fishing
- Mining, quarrying and petroleum
- Metal and electro-technique
14 We are in a economic crisis right now
20
- Food, beverages and tobacco
- Construction
- Trade
- Transport, storage and communication
- Finance
For Agriculture & Fishing and Construction sectors there is no FDI stock data
available from 2003 and further. The stocks were very small, so the DNB
decided to add these stocks to the industry sectors. It was added to the sector
called ‘other industry’ which I removed from the dataset together with the sector
‘other services’ because of the broad coverage it is impossible to say something
relevant about these sectors.
What is the percentage of FDI stocks per sector in the total GDP in the
Netherlands? I mentioned before GDP is generally used to assess the
comparative attractiveness of countries to foreign investors. FDI stock per sector
as percentage of total GDP 1985, 1995 and 2005 is shown in the table on the
next page.
21
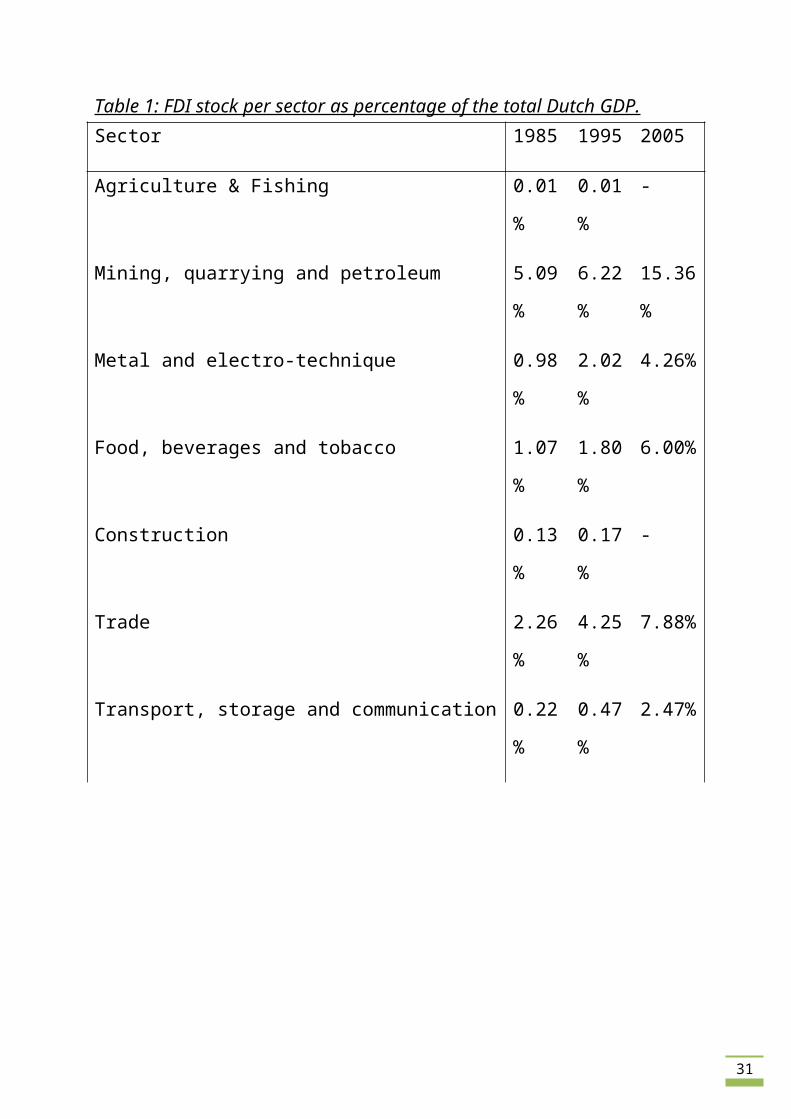
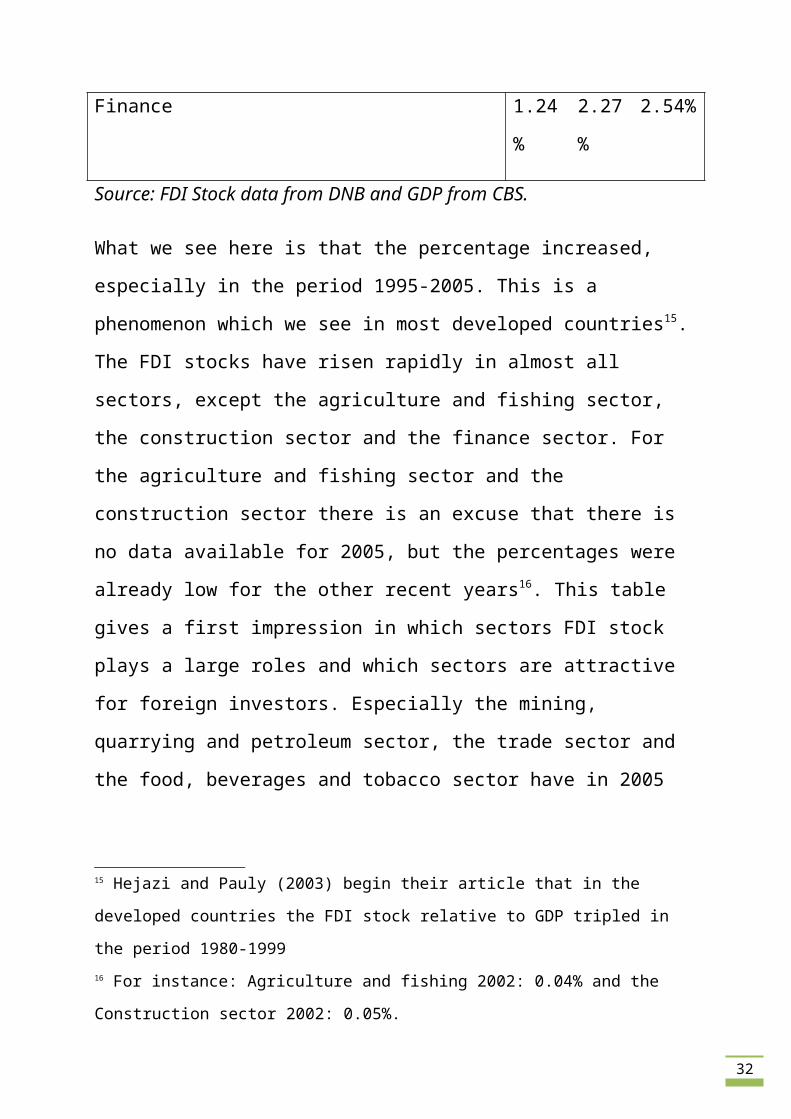
Table 1: FDI stock per sector as percentage of the total Dutch GDP.Sector 1985 1995 2005
Agriculture & Fishing 0.01% 0.01% -
Mining, quarrying and petroleum 5.09% 6.22% 15.36%
Metal and electro-technique 0.98% 2.02% 4.26%
Food, beverages and tobacco 1.07% 1.80% 6.00%
Construction 0.13% 0.17% -
Trade 2.26% 4.25% 7.88%
Transport, storage and communication 0.22% 0.47% 2.47%
Finance 1.24% 2.27% 2.54%
Source: FDI Stock data from DNB and GDP from CBS.
What we see here is that the percentage increased, especially in the period 1995-
2005. This is a phenomenon which we see in most developed countries15. The
FDI stocks have risen rapidly in almost all sectors, except the agriculture and
fishing sector, the construction sector and the finance sector. For the agriculture
and fishing sector and the construction sector there is an excuse that there is no
data available for 2005, but the percentages were already low for the other
recent years16. This table gives a first impression in which sectors FDI stock
plays a large roles and which sectors are attractive for foreign investors.
Especially the mining, quarrying and petroleum sector, the trade sector and the
food, beverages and tobacco sector have in 2005 high FDI stocks compared to
the total Dutch GDP and they look promising for foreign investors.
15 Hejazi and Pauly (2003) begin their article that in the developed countries the FDI stock
relative to GDP tripled in the period 1980-199916 For instance: Agriculture and fishing 2002: 0.04% and the Construction sector 2002: 0.05%.
22
The new investment projects in the Netherlands took place mainly in industries
such as information technology, machinery & equipment, electronic
components, medical technology and food & nutrition. The majority of the
projects are related to marketing & sales, distribution and headquarters
operations. This is confirmed by the big rise in some of the sectors in table 1.
I will now cover some macro-economic facts about the sectors and give
motivations for investors concerning whether to invest in this sector or not.
4.2.1 Agriculture & Fishing
The total GDP in the Netherlands is almost 529 billion euro. The agriculture &
fishing sector contributes for 9,4 billion euro, which is a share of 1,7%. The
sector consists of livestock breeding, arable farming, horticulture and fishing.
The production and the exports are very dependent on the situation of the
weather in a certain year. This makes the output in this sector very volatile. In
the period 1984-2008 the production in this sector increased by almost 40%. The
increase has not been smooth. From 1984 to 1999 there was only a small
difference in production, but starting from 1999 the production began to rise
faster. The imports in this sector were around 10% of the production during the
whole period. The exports on the other hand did increase a lot. Around 25% of
production in 1984 was exported, which became 40% in 1995 and 50% in 2008.
The domestic investments in this sector grew as well. Especially in the most
recent years the domestic investments rose with around 12,5% per year. Total
employment in this sector has also increased from 75 thousand people in 1984,
to 121 thousand in 2008. However, 2008 was not the peak year with respect to
employment. The peak was in 2001 and 2002 with 128 thousand people, but
from there, there was a small decrease in the number of people employed in the
sector. Nevertheless, in the period 2002-2008 the production grew faster than
before, thus this is an indication that the productivity grew sharply in the last
years. This is confirmed by the statistics about labor productivity as presented
23
by the Central Bureau of Statistics. In the same period (1984-2008) the wages in
this sector almost tripled. The rise was almost at a relative constant level of
around 4,5% a year. This sector is labor-intensive. This makes the sector not
very promising with respect to foreign investments because labor costs are high
in the Netherlands. Nevertheless foreign investments in this sector rose very
fast, especially after 1997. In the period before there were ups and downs, with
ups being larger than downs. A reason for this is that the quality of Dutch
agriculture and fishing products are better than in foreign countries. Still the FDI
stock in this sector is very low compared to other sectors and we have already
seen that the FDI stock compared to the total Dutch GDP is almost zero. Based
on the characteristics of this sector plus the history of foreign involvement in
this sector it is not expected that this sector will be attractive for foreign
investors. Also the reasons from NFIA to invest in the Netherlands are not
relevant for this sector.
4.2.2 Mining, quarrying and petroleum
This sector deals mainly with the extraction of raw materials. It contains all the
different sorts of minerals, like liquid (petroleum), solid (coal, peat and ore) and
gas (natural gas), in all different stages of production. Extraction takes place by
underground mining, opencast mining and drillings. This sector also contains the
further processing, like necessary sales and transport. Most of this work takes
place in the North Sea and the Northern provinces of the country. The GDP of
this sector was in 2007 around 17 billion euro, which is more than 3% of the
total Dutch GDP. The production value of this sector did not follow any specific
path. In 1984 and 1985 the value rose, but from 1986 to 1990 the value almost
decreased by 50%. From 1990 to 1999 the value did not change remarkably and
from 1999 it grew very fast, by over 200%. The imports in this sector follow the
same patterns as the overall production. Only the ups and downs are less drastic.
Overall from 1984 to 2008 the imports rose by 300%. The exports also rose, but
24
just by 100% in the same period. The paths the production, export and import
followed, indicate that this sector is very volatile. The people working in this
sector are very small and the amount is decreasing from 11 thousand in 1984 to
7 thousand in 2008. With the relative high production-value this indicates that
this sector is capital-intensive and productive. This is confirmed with the labor
productivity in this sector, which is around 10 times as high as in other sectors.
The development of the labor productivity has taken the same route as the
production imports and exports, which is not a steady path, but overall a large
increase of around 150%. The domestic investments in this sector did not
change a lot. There are yearly differences, but these are small. In some years the
domestic investments are higher, in others they are lower, but there is no trend
or direction. The wage level did grow steadily but starting from 2004 there has
been a break in growth. However, in the whole period, the wage level almost
doubled. The FDI stock in this sector now is 10 times as high as in 1984 and
grew every year except one (1993). This sector looks very promising for foreign
investors, because it is very well developed. We also see that the FDI stock
compared to GDP is high for all years17. In the past there was a lot of foreign
involvement, and we can expect even more foreign activity because the labor
productivity is increasing much faster than the wage level.
4.2.3 Metal and electro-technique
In this sector there are very large producers of core metals but also very
specialized high-tech companies.
The sector consists of the following working sub-sectors:
- Core-metal industry
- Metal products industry
- Machines and mechanic industry
- Office and computer industry
17 Table 1
25
- Other electric mechanic industry
- Audio-, video-, telecom mechanics
- Car industry
- Medical mechanic industry
The size of the whole sector is 19,5 billion euro, which is almost 4% of the
Dutch total GDP. The production in this sector grew fairly steadily in the period
covered in this paper. Only from 2001 to 2003 there was a small decrease, but
the overall result is that the production almost doubled in the period. A main
difference with other sectors in the industry is that the sales of firms in this
sector are for a larger part in foreign countries. Almost 50% of the production is
for export, and just 10% for the consumption in the Netherlands. By overall
output levels, this is the largest industrial sector in the Netherlands. The sector
covers around 1/3rd of the total size of the industry. The imports show also a
fairly steady growth, with a small negative shock during 2001-2003. The
imports almost tripled. The employment in this sector decreased. With 240
thousand in 1984 it grew to 256 thousand in 1990, but from there it decreased
almost yearly. Now there are 200 thousand people working in this sector. The
domestic investments in this sector show ups and downs. There was a growth
from 1984 to 1990, a decrease from 1991 to 1994. From there investments grew
until 2000. They started to decrease again from 2000 to 2004 but now they are
growing again. Overall the domestic investments almost doubled. Having in
mind the growth in production and the decrease in employment it is not
surprising that the productivity in this sector rose. Almost at a constant level it
rose to 2,5 times as high as it was in 1984. The wage level also took a steady
growth and rose every year. It doubled in the period 1984-2008. The FDI stock
in this sector grew enormously. The growth was not the same every year, and
there was even a small decrease from 2004 to 2007, but the FDI stock is now 12
times as high as it was in 1984. We can expect a lot of foreign activity in this

26
sector, because of the sort of products (cars, telecom, and computers18) and the
fact that a large part of the production of the core metal-industry is for exports.
This indicates that this sectors deals for a large share with intermediate products,
which appear a lot with vertical FDI. Because the Netherlands itself also deals a
lot with a high technology infrastructure it seems that for this sector the
Netherlands is an ideal location.
4.2.4 Food, beverages and tobacco
This sector consists of the gathering of food and beverages, and the processing
of tobacco. Products from the agriculture & fishing sector are further processed
in this sector, to products that can be consumed by human or animals. The GDP
of this sector is around 15 billion euro, which is around 3% of the total GDP in
the Netherlands. A characteristic of this sector is that it is not sensitive to short
term market fluctuations. People will not eat or drink less in a declining
economy. The opposite happens in times of economic growth. People will not
eat and drink more. Only a substitution effect is possible. When this happens
people will change the current food to more luxurious food or to simple food.
This sector is more sensitive for external factors, like failure of harvesting, and
animal deceases. The production in this sector almost doubled in the period
1984-2008. It took a steady growth except for the years 1985-1987 and 2001-
2003. The imports followed exactly the same pattern. The people working in this
sector decreased. With 160 thousand in 1984 and 130 thousand in 2008, this is a
decrease of almost 20%. It grew until 1993 but from there it decreased almost
every year. The production is rather high in this sector but the employment is
not. This makes this sector not as capital-intensive as the mining, quarrying and
petroleum sector, but still we can say that this sector is capital-intensive. The
domestic investments in this sector followed a steady growth path and they 18 Especially the telecom and computer industry, which are IT products, are still developing
very fast. If we compare the use of telephones and computers now with 15 years ago, we see
incredibly differences. There are no signs that the development is over.
27
almost doubled in the period we are studying. The labor productivity doubled19.
Especially from 1995 it began to grow very fast. Before 1995 the labor
productivity did not change much. The wage level followed a steady growth
path during the whole period and it doubled. The FDI stock took an enormous
growth starting from 2002, with a small negative shock 2004-2006. The FDI
stock is now 25 times as high as it was in 1984. This sector is attractive for
foreign investors because it is capital-intensive, and the labor productivity is still
increasing. This increase happens at a higher rate than the wage levels. Also the
property that it is not sensitive for factors which firms cannot control it gives
some kind of security.
4.2.5 Construction
This sector entails all firms of contractors, installers and firms that finish the
building, like plasterers or housepainters. With a GDP of almost 31 billion this
sector represents a little more than 5% of the total GDP in the Netherlands in
2008. One out of ten firms in the Netherlands is a firm in this branch. From 2002
to 2005 this branch was contracting, despite the growth of the GDP in the
Netherlands, but from 2005 the sector also started growing. The production in
this sector rose almost every year in the period 1984-2008. In 2008 the
production was more than 3 times as high as in 1984. The import in this sector
shows exactly the same development. On the other hand exports increased
enormously. In 2008 the exports were almost 20 times higher than in 1984. The
amount of people working in this sector took another route. It rose from 1984 to
2001 but after that it started to decrease and stayed at a constant level after of
around 400 thousand people. Together with the development of production and
imports it is clear that there happened something in this sector in the period
2001-2004. The terrorist attacks on 11/9/01 caused a lot of economic problems20, 19 I could already derive this from the facts that the production increased and the working
people decreased20 The effects were the highest in the US, but the whole world suffered from this.
28
but not only in this sector. These attacks also have their consequences for
domestic investments, which tripled in the total period, but had a small fall from
2001 and following years. The labor productivity in this sector grew at a
constant level every year. In the whole period it has more than doubled. This
also holds for the wage level, but also for this variable we see that there was
stagnation in 2001 to 2004. The wages are 30% higher now than in 2000. The
foreign investments in this sector grew enormously. The peak was in 2002, but I
do not expect the foreign involvement to grow in this sector. Property is
expensive in the Netherlands because of the high population density. In times of
economic crises, like now, people and firms are not willing to spend money on
housing. This is one of the reasons that from 2003 the FDI stocks were not
enough for the DNB to report and they added it to the sector other industry21.
4.2.6 Trade
This sector contains of wholesale business and retail business and the catering
industry. We can think of trade and maintenance of cars and motors or other
consumer products, like clothes, electronic devices or cosmetics. The size of the
sector represents 15% of the total GDP of the Netherlands in 2008, with a GDP
of almost 76 billion. In the period covered in this paper (1984-2008) the
production more than tripled in this sector. Imports followed the same path
during the period. The wholesale business is an important business for the
export from the Netherlands. The exports in the sector trade rose every year
except for 2002, but in 2008 the value was more than 4 times as high as in 1984.
People working in this sector almost doubled in the given period. In terms of
employment this sector is relatively large, with a share of almost 1/5th of the
total employment in the Netherlands. More than 1,5 million people are working
in this sector. From 2000 however, the growth became very small. Domestic
investments have tripled up. However, just like the employment, there has not
21 Already mentioned at the beginning of this section.
29
been a real growth anymore since 1999. There are even large falls. The
productivity almost rose every year and it now 2,5 times as high as in 1984. The
wage level did increase faster. This rose every year and is now more than 3
times as high as in 1984 in this sector. The inward FDI stock in this sector took
an enormous growth. It is now 8 times as high as it was in 1984. The influence
of technology is in this sector very important. Because of the development of
internet, consumers can get more information about products, like the
availability or making orders. This means that the sector is innovative and still
developing. After the mining, quarrying and petroleum sector, this sector has the
highest R&D expenses. The sector looks very promising for foreign investors,
because of the size and the influence of technology.
4.2.7 Transport, storage and communication
There are a lot of different firms in this sector. Road transport, inland
navigation, aviation, shipping and firms in relation with these branches all
belong to this transport-branch. To the storage-branch are belonging firms like
storehouses, warehouses, forwarding companies. And to the communication-
branch firms like telecommunication companies and postal services. The 35
billion in GDP of this sector represents 7 percent of the GDP in the Netherlands
in 2008. The production in this sector rose every year and in 2008 it was almost
4 times as high as in 1984. The import started to grow later. From 1988 it started
to grow, but it did that very rapidly. The amount of imports in this sector is more
than 4 times as high as in 1984. Also the exports started to grow rapidly from
1988 but the amount now is 3 times as high as in 1984. The employment in this
sector grew every year until 2002. There was a break in the growth from that
year, but in the most recent years the sector’s employment is recovering. The
employment now is 30% higher as in 1984. Almost a half million of people are
working in this sector. Domestic investments in this sector grew rapidly from
1984 until 2000. From 2000 to 2008 the domestic investments rose and shrank,

30
but there is no trend in the amounts. The wage level in this sector grew every
year and is now 2,5 times as high as in 1984. This growth reflects the change in
labor productivity, which is exactly the same. The inward FDI stock in this
sector grew enormously. It is now almost 30 times as high as it was in 1984.
This sector is growing because of the mobility of people that is increasing,
which is also a cause of the globalization, and the more technological
communication that is developing in recent years. This makes this sector
promising for foreign investors.
4.2.8 Finance
This sector compasses all financial institutions except insurance companies and
pension funds. Think of mortgage banks, central banks, savings banks etc. The
GDP is with 33 billion more than 6% of the total Dutch GDP. In the period
covered in this paper this sector grew a lot. The production had a steady increase
of 400%. The imports and exports also grew very fast, and the exports even with
700%. With this growth in production, the employment also rose. With 128
thousand workers in 1984 it grew steadily (except for the period 2002-2004) to
more than 157 thousand workers. I guess the break in the employment-growth is
also a consequence of the terrorist attacks, because they hit the financial heart of
the world. The domestic investments in this sector did not follow a specific path,
but there is a rising tendency. The domestic investments more than tripled in the
period covered in this paper. The labor productivity did not change that much as
in the other sectors. It did grow almost every year, but the final result is an
increase of 75%. On the other hand the wages did follow a steady growth,
starting from 1990 and they are doubled now with respect to 1984. The FDI
stocks in this sector were quite volatile. It was rather constant in the beginning
years of the dataset. From 1988 until 2000 there was a rapid growth, except for
1993, and after this there was a decrease until now with a large positive shock in
2006. However, especially in the Netherlands the finance sector is very
31
important and of high level. I expect foreign investors to come the Netherlands,
because of the business environment and the high infrastructure in this sector.
For instance, the use of newer technology makes the communication better than
before.
32
5. Methodology
To understand the determinants of FDI stocks in specific sectors in the
Netherlands there is need of variables that are available for the sectors. These
variables must have characteristics which are important for a foreign investor in
his decision to invest in the sector in the Netherlands. When the characteristics
in the sector are not attractive, a possible investor can choose to invest in
another country.
5.1 The explanatory variables
I used the following explanatory variables:
- Size of the domestic sector
- Sector labor productivity
- Capital-labor ratio
- Sector wage level
- Sector R&D Expenses
The data of FDI stocks are available for period 1984-2008, so I matched the
sector data to this period, as completely as possible. For R&D expenses I missed
some observations.
I transformed the data series to logarithmic scale to interpret the coefficients
from the regression as an elasticity.
We thus estimated the following specification:
FDI(i,t) = α + β1*(size of domestic market) + β2*(sectoral labor productivity) +
β 3*(capital-labor ratio)+ β4*(wage level) + β5*(R&D expenses)
where i is the sector, and t the year of the observation.
33
5.2 Motivation of the variables:
The variables used in this paper are motivated in this section of the paper. Here I
will also show what measure of the variable I used. Not all the variables used in
my research were available easily, so I had to construct some of them myself.
5.2.1 Size of the domestic sector
The size of the market is one of the most commonly used variables in FDI
research22. A large sector, in terms of output, employment or exports, gives more
incentives to invest in. A good example of this is that countries also choose their
host-countries often as a developed country, with a high output. Agodo (1978)
stated that advantages such as market size are major reasons for MNEs to invest
and Markusen (1995) stated that multinationals are of greater importance
between countries that are relatively similar in size and per capita income and
similar in relative factor endowments. So when output is a sign of development
it is logical that the sectors with highest output are most attractive for foreign
investors. Larger sectors will reduce the costs of supplying the market because
of economies of scale and lower fixed costs per unit of output. Following Lim
(2001) this will encourage horizontal FDI. Output of a sector is a good measure
of the size of the sector. In my research I use the output of the sector plus the net
imports in the sector to proxy for the size of the domestic market. This gives a
good estimation about the size of the sector.
5.2.2 Sectoral labor productivity
The sectoral labor productivity is also important in the identification of which
sector to invest in. The measure of labor productivity is gross added value per
unit of labor volume. Higher productivity can indicate lower costs, and can be a
determinant for efficiency seeking FDI. Both Caves (1974) and Globerman
(1979) stated that the foreign involvement in an economy is correlated with the
22 Jaumotte (2004), Lim (2001), Markusen (1995), Jensen (2004), Dunning (1993)
34
labor productivity. Most of previous studies investigate the development of the
labor productivity as a consequence of inward FDI stock/flows23, but I was not
able to find one studying the opposite. When looking at the determinants from
Reuber et al (1973) and Lim (2001) in section 3.4 labor productivity has most
similarity with skilled labor24 from Reuber. Data for this variable are not
available for every sector during all years. To fill in the gaps I divided the output
in a sector by the number of employments in the sector, which is the same as the
gross added value per unit of labor.
5.2.3 Capital-labor ratio
In a country like the Netherlands it is important for investors to assess what the
capital-labor ratio is, because investors are interested in the most developed
sectors. Capital goods25 include factories, machinery, tools, equipment and
buildings that are used to produce products for consumption. Capital goods are
the key in reaching positive returns from the manufacturing of products. With
this in mind, a lot of capital goods are an indication that a sector is developed.
This variable is calculated by dividing the total value of the capital goods in a
sector by the total employment in the sector. The result is the value of capital
goods per worker in the sector. Labor in the Netherlands is expensive in
comparison with other countries. This is another characteristic which makes this
ratio an interesting driver. In most of the sectors we also see that a higher value
of capital goods indicate a higher labor productivity and the sectors with the
highest labor productivity have less people working in the sector and have a lot
of capital goods26. These two facts make the sign that a higher capital-labor ratio
23 Kokko (1996), Caves (1994), Haddad and Harrison (1993)24 This is the percentage skilled workers. Here I assume that skilled workers have higher
productivity than unskilled workers.25 Capital goods are real objects owned by individuals, organizations, or governments to be
used in the production of other goods or commodities.26 The mining, quarrying and petroleum sector is a perfect example for this.
35
means a higher labor productivity even stronger. The capital goods do not
include human capital27.
5.2.4 Sector wage level
The wage level in a sector is part of the total production factor costs. Vertical
FDI can be seen as production cost-minimizing FDI. When we have higher
wage levels in a sector than it other countries it is not likely that MNEs will
invest in this sector in the Netherlands vertically. Following Lim (2001) the
impact of lower factor costs, for instance a lower wage level, on FDI is positive.
More skill-intensive sectors pay higher wages per employer, but use more
advanced factors of production, which makes the productivity a lot higher, and
the need of workers is lower, while lower wages can indicate that the costs to
produce will be low and a sector is more labor-intensive, but the sector is still
developing. In the research in this paper the wage level is a measure of the
wages + the bonuses in a sector28 divided by the total employment in a sector.
The result is the total earnings per worker.
5.2.5 Sector R&D Expenses
The R&D expenses can be a predictor of how a sector will develop over time. It
captures the knowledge in a sector. R&D expenses are done to find cheaper
ways of production, or to create better products. There are a lot of models that
call R&D expenses one of the most important drivers for economic
development29. We can expect that foreign firms will invest easier or more in a
sector when the R&D expenses in this sector are higher, because of higher
output potential in this sector. Barrell and Pain (1997) show that the stock of
patents held by domestic British and German firms are strong determinants of
27 Intellectual and physical skills of the labor. To capture the knowledge of the sector, I
inserted the sector R&D expenses in the model.28 This is the same as the total earnings in a sector.29 Romer (1990), Grossman & Helpman (1991)
36
inward FDI into Britain and Germany. For R&D expenses there was no data
available for every year. For the years the data was available I used the expenses
for R&D of all firms in the sectors I am researching. I left the gaps in the data
empty, because it is hard to get an approximate for the R&D expenses.
37
6. Empirical Study
6.1 The model
In this part of the paper I will present statistical results on the drivers of the FDI
stock in specific sectors in the Netherlands. The theory discussed before
suggests the relationships illustrated in the table below30:
Table 2: Expected sign of the explaining variables
Variable Shortening Expected sign
Size of the domestic sector SDS +
Sector labor productivity SLP +
Capital-labor ratio CLR +
Sector wage level SWL -
Sector R&D expenses SR&D +
We can rewrite the model in shortenings:
where i stand for the sector and t for the year of the observation.
To start here is a table showing the correlation between the variables.
Table 3: Correlation between the variables
FDI SDS SLP CLR SWL SR&D
FDI 1 0.4284 0.6954 0.1530 0.4373 0.7091
SDS 0.4284 1 -0.1469 -0.5425 0.1217 0.1757
SLP 0.6954 -0.1469 1 0.5007 0.1945 0.8031
CLR 0.1530 -0.5425 0.5007 1 -0.1258 0.4589
SWL 0.4373 0.1217 0.1945 -0.1258 1 0.0945
SR&D 0.7091 0.1757 0.8031 0.4589 0.0945 1
30 For explanations see section 5.1
38
What we see here is that some variables are quite strongly related to each other.
In particular, the labor productivity and R&D expenses are correlated with the
FDI stock and the R&D expenses are also correlated with the labor productivity.
For the R&D expenses this is logical because, as explained in the previous
section, FDI stocks in a sector are expected to increase when the R&D expenses
in a sector grow. Also the labor productivity is expected to increase if the R&D
expenses increase. It is likely that R&D expenses will lead to some more
efficient methods of producing or that a better product can be produced at same
costs.
6.1.1 Simple OLS Method
Using the software EViews I started by analyzing the model with a simple
annual panel regression with SDL, SLP, CLR, SWL and SR&D as explanatory
variables and FDI as dependent variable using the ordinary least squares (OLS)
method. The goal from this type of analysis is to see which determinants have a
significant influence on the FDI stock.
Table 4: Main results from panel data 1984-2008, Dutch inward investments, no
control for effects.
Dependent Variable Explanatory Variable Coefficient Probability
FDI SDS 1.937152 0.0000SLP 1.727870 0.0000
CLR 0.364775 0.0001
SWL -0.526682 0.2207
SR&D 0.428247 0.0000
Constant -52.91093 0.0000
Adjusted R-Squared 0.837193
Observations 149
39
The results from this regression support the theoretical predictions. The signs for
all the variables are as expected, and all variables are significant at a 1% level of
significance except the wage level. The adjusted r-squared of this model is quite
high, which gives strength to the model. We can confirm that an increase in the
size of the sector, and the labor productivity in the sector have high positive
impact on the FDI stock in the sector. This indicates that foreign investors
choose to invest in the Netherlands in larger sectors, as measured by output31
and in those characterized by a labor productivity32. We also find a positive and
strongly significant influence of the capital-labor ratio and the R&D expenses.
These findings are also in theory with the previous chapter of this paper. A
higher capital-labor ratio, which means capital is increasing with respect to
labor, influences the FDI stock positively. This is attractive for investors
because a higher value of capital goods indicates that a sector is developed. Also
labor in the Netherlands is rather expensive in comparison with similar
countries. These phenomena indicate that we can expect the capital-labor ratio
(capital divided by labor) to be high33. The wage level is not significant but we
do find a negative sign. This result also follows the theoretical predictions,
because higher wages mean higher production costs, which are not interesting
for investors. Because of the transformation to log-values of the variables we
can interpret the coefficients as elasticities. For instance, a 1% increase in the
R&D expenses will increase the FDI stock with 0.428%. We can also compare
31 As explained in chapter 5 of this paper, a greater size of the domestic market will reduce the
costs of supplying the market because of economies of scale and lower fixed costs per unit of
output.32 As explained in chapter 5 of this paper higher labor productivity is an indication of lower
costs, and can be a determinant for efficiency seeking FDI33 The more capital in comparison with labor increases the ratio
40
the magnitude of each variable now and we see that the changes in labor
productivity and the changes in the size of the sector have the largest impact on
the FDI stock. For both of these variables an increase of 1% will make the FDI
stock grow with almost 2%.
6.1.2 Simple OLS Method with period Fixed Effects
To remove trends or effects that occur at sectoral level or over time34 we can test
the model by adding fixed and/or random effects. The core difference between
fixed and random effect models lies in the role of dummy variables35. In both
methods we add dummy variables to the model. If dummy variables are
considered as a part of the intercept, we have a fixed effect model. In a random
effect model, the dummy variables act instead as an error term. A fixed effect
model examines differences in intercepts, assuming the same slopes and
constant variance across entities or subjects. The dummy variables added allow
the intercept term to vary over time and/or sector. We continue with the same
simple regression from previous paragraph, but now we control for period36
fixed effects.
34 Unobserved heterogeneity35 If one cross-sectional or time-series variable is considered, this is called a one-way fixed or
random effect model. Two-way effect models have two sets of dummy variables for group
and/or time variables36 In this research we can also call it time or year
41
Table 5: Main results from panel data 1984-2008, Dutch inward investments,
period fixed effects.
Dependent Variable Explanatory Variable Coefficient Probability
FDI SDS 1.678898 0.0000SLP 1.799408 0.0000
CLR 0.259478 0.0083
SWL -1.040713 0.0259
SR&D 0.401788 0.0000
Constant -40.37845 0.0000
Adjusted R-Squared 0.863790
Observations 149
When controlling for the period fixed effects the results become even more as
the theory suggested. All the signs are as we expected37 and the variables are all
significant at 5%38. The r-squared is not affected by the introduction of the
period fixed effects. It increased slightly, which means that the fit of this
regression is slightly better. The coefficient of the market size becomes a little
smaller, but this variable still has a large significant impact on the FDI stock.
The biggest change is for the wage level. In the previous paragraph (without
period fixed effects) this variable was not significant and the coefficient was
minus 0.526. With the period fixed effects this variable becomes significant at
5% level and the magnitude of the coefficient doubles to minus 1.040. This
shows that the wage level has larger impact when we add fixed period effects. In
other words, when we add year-specific effects (so when we control for the
influence of time) the impact of the variable wage level becomes larger. It looks
like time influences the development of the wage level in a way that the wage
level will be a smaller turnoff for investors than without the influence of time. 37 See table 238 Most of the variables even at 1%
42
The coefficients on the capital-labor ratio, the labor productivity and the R&D
expenses did not change remarkably.
6.1.3 Simple OLS Method with sector Fixed Effects
Table 6: Main results from panel data 1984-2008, Dutch inward investments,
sector fixed effects.
Dependent Variable Explanatory Variable Coefficient Probability
FDI SDS 1.036597 0.0076SLP 0.470700 0.3210
CLR 0.415045 0.4306
SWL 2.010799 0.0012
SR&D -0.140318 0.1010
Constant -32.13829 0.0000
Adjusted R-Squared 0.965291
Observations 149
When we remove year dummies and only insert sector fixed effects, we get
implausible results. A higher wage level indicates higher FDI stocks (with a
strongly significant value of the coefficient of 2.01) and lower R&D expenses
indicating higher FDI stocks (coefficient of minus 0.140). Also the labor
productivity, the capital labor ratio and the R&D expenses are not significant.
However, the r-squared is very high. There is no logical explanation for these
results. However, these results do suggest that the size of the sector is less
important when we control for sector-specific effects. There must be a better
model than this one.
43
6.1.4 Simple OLS Method with period and sector Fixed effects
To remove trends or effects that occur at sectoral level and over time we can test
the model by adding period and cross-section fixed effects.
Table 7: Main results from panel data 1984-2008, Dutch inward investments,
fixed effects, both period and sector.
Dependent Variable Explanatory Variable Coefficient Probability
FDI SDS 0.353965 0.2621SLP 0.167195 0.6866
CLR 0.884939 0.0367
SWL -1.221126 0.0901
SR&D -0.326190 0.0000
Constant 19.58755 0.0073
Adjusted R-Squared 0.980073
Observations 149
When we include fixed effects estimation for both the sector and the time
variables the r-squared increases a lot. However it is not logical that the FDI
stocks in a sector will decrease with 0.32% when the R&D expenses in a sector
are increased with 1%. Also the size of the sector and the labor productivity are
not significant at a normal level of significance and the sizes of the coefficients
are small. In comparison with the model with just sector fixed effects this model
supports the theoretical predictions found in the literature slightly better. The
wage level is now significant and the value of the coefficient (minus 1.221) is as
expected. When controlling for fixed effects, the model with just period fixed
effects fits our expectations best.
44
6.1.5 Simple OLS Method with period Random Effects
Instead of adding fixed effects, we can add random effects. As discussed before,
in this model we add dummy variables that act as an error term. We assume that
the mean effects of time-series of cross-section variables are included in the
intercept, and the random deviations about the mean are equated to the error
components.
Table 8: Main results from panel data 1984-2008, Dutch inward investments,
period random effects.
Dependent Variable Explanatory Variable Coefficient Probability
FDI SDS 1.937152 0.0000SLP 1.727870 0.0000
CLR 0.364775 0.0001
SWL -0.526682 0.2280
SR&D 0.428247 0.0000
Constant -52.91093 0.0000
Adjusted R-Squared 0.837193
Observations 149
When we only estimate with period random effects included the signs of the
variables are all in line with theory discussed in this paper, but the wage level is
not significant. When we compare this with the model where we did not include
effects (section 6.1.1.) we see that the coefficients are the same as, which is
logical because we assume that the intercepts do not change, and the effects are
captured in the error components. When we look at the standard error terms and
the random effects specification in the table in appendix 10.5, we see that there
are no time period effects and the standard error of each variable only changed
slightly.
45
6.1.6 Simple OLS Method with sector Random Effects
Table 10: Main results from panel data 1984-2008, Dutch inward investments,
sector random effects.
Dependent Variable Explaining Variable Coefficient Probability
FDI SDS 1.021383 0.0007SLP 0.683287 0.0717
CLR 0.147067 0.6608
SWL 1.990452 0.0002
SR&D -0.097498 0.2384
Constant -31.72043 0.0000
Adjusted R-Squared 0.810762
Observations 149
With sector random effects we get the same implausible results as with sector
fixed effects. The wage level has positive strongly significant effect (1.99) on
the FDI stock and the R&D expenses a negative influence. Also the R&D
expenses and the capital labor ratio are not significant. It looks like the sector
effects are aiming to results I cannot explain and the period effects are directing
to results that are logical and that support the predictions from the theory.
46
To determine which model is better I included the Hausman specification test39:
Table 11: Hausman-specification test results 40
Tested Model Probability
Period Random Model 0.0189Sector Random Model 0.3702
We can reject the null hypothesis for the period random model, which makes for
period effects the fixed model better. This model also supports the theoretical
predictions. For the sector effects we cannot reject the null hypothesis, which
makes the random model best, although for sector effects both the random
model as the fixed model give unexplainable results.
39 The Hausman specification test (Hausman 1978) compares fixed effect and random effect
models. If the null hypothesis that the individual effects are uncorrelated with the other
regressors in the model is not rejected, a random effect model is better than its fixed
counterpart. 40 See the appendix for the whole tables
47
7. Conclusions
The goal of this paper was to investigate what drives foreign investors to choose
the Netherlands as an investment country. By giving an overview of FDI and the
economic situation in the Netherlands for each sector I built a model which I
tested with sectoral yearly data from 1984-2008. This model captures
determinants of FDI from literature together with self-added determinants. After
testing the model I added period and or cross-section fixed and random effects
to the model, to control for effects that can occur over sector or over time.
For all models the size of the domestic market has a strongly positive significant
influence on the FDI stock. This is not surprising, because Lim (2001) and
Reuber et al (1973) already found this out in their work.
The labor productivity also has a great impact on the FDI stock. It has a strong
significant impact, even when we control for fixed effects that happen over time,
which indicates that time does not affect the impact of labor productivity on the
FDI stock. The effect decreases when we control for sector fixed effects. This
indicates that the labor productivity has influence in specific sectors, but surely
not in all of them. There happened something in the sectors over time, which
makes the coefficient of labor productivity larger. However, when we control
for random variables (time and sector separately) this variable stays significant
and positive.
The capital-labor ratio is positive in all cases, which is conform the theory I
discussed in this paper. A higher capital-labor ratio can be achieved by more
capital, or lower use of labor. Both directions are interesting for foreign
investors. More capital goods are the key in reaching positive returns from the
manufacturing of products and lower less use of labor means less labor costs
which are expensive in the Netherlands.
48
The height of the wage level has a negative impact on the FDI stock in most of
the cases. When we control for period fixed effects the impact even doubled
compared to no effects. This indicates that time makes the impact of the wage
level lower. However, we also found implausible results for this variable. The
effect was positive when we controlled for sector effects (both fixed and
random). This might indicate that the wage level is not a good driver for all
sectors covered in this paper.
The last driver is the expenses to R&D. This determinant had a positive
influence on the FDI stock in most cases except for the fixed and random sector
effects (which is the same as for the wage level). This might indicate that the
R&D expenses in some sectors are not relevant for foreign investors or that this
sector does not have a lot of R&D expenses.
Summing these results up we get the results as we expected, which were the size
of the domestic sector, the labor productivity, the capital labor ratio and the
R&D expenses affecting the FDI stock positively and the wage level negatively.
49
8. Limitations
This work is done with some strong limitations.
The first one is the removal of FDI stock data from the sectors called ‘other
industry’ and ‘other services’ The motivation behind this was that these sectors
cover such a broad range of branches that I could not give relevant conclusions
from results I could find. This removal causes a large part of the FDI stock
unattended. Also it was impossible to find data about the determinants of FDI
that will match these sectors completely. For instance, what measure of capital–
labor ratio will the ‘other services’ have? Maybe in the future there comes more
detailed FDI stock data available for these wide ‘sectors’.
The other limitation is the missing of some observations about the determinant
R&D expenses. In my research this has cost me 39 observations in total.
Including these 39 observations with R&D expenses data will definitely have
impact on the results.
50
9. Literature
Agodo, O. (1978). The determinants of U.S. private manufacturing investments
in Africa. Journal of International Business Studies 9, 95-107
Aitken, J.B., Harrison, A.E. (1999). Do Domestic Firms Benefit from Direct
Foreign Investment? Evidence from Venezuela.The American Overview, 607
Babbie, E. (2004). The practice of social research, 10th edition. Thomson
Wadsworth
Barrell, R., Pain, N. (1997). Foreign Direct Investment, Technological Change,
and Economic Growth Withing Europe. The Economic Journal 107(445), 1770-
1786
Beumer, M.I.L., Over, J.A., Vrenken. P.G.M.J. (1995). Sectorstudie Transport-,
Opslag- en Communicatiebedrijven. Stichting Needis
Blomström, M., Globerman, S., Kokko, A. (1999).The Determinants of Host
Country Spillovers from Foreign Direct Investment: Review and Synthesis of
the Literature. Working Paper Series in Economics and Finance 339
Blomström, M., Persson, H. (1983). Foreign investment and spillover efficiency
in an underdeveloped economy: Evidence from the Mexican manufacturing
industry, World Development Elsevier 11(6), 493-501
Buckley, P.J., Casson, M.C. (1976). The Future of the Multinational Enterprise
Caves, R.E. (1974).Multinational firms, competition, and productivityi n host-
country markets. Economica 41(1). 76-193
51
CBS, Central Bureau of Statistics (2009) website link:
www.cbs.nl
Chung, W. (2001). Identifying Technology Transfer in Foreign Direct
Investment: Influence of Industry Conditions and Investing Firm Motives.
Journal of International Business Studies 32(2), 211-229
De Bontridder, M. (2003) Branche uitgebreid: de voedings- en
genotmiddelenindustrie . Industriemonitor 2003/10 CBS
DNB, De Nederlandsche Bank (2009) website Link:
www.dnb.nl
Dunning, J.H. (1980).Toward an eclectic theory of international production:
some empirical tests. Journal of International Business Studies 11(1) 9-31
Dunning, J.H. (1993). Internationalising Porter's 'Dramond'. Management
International Review 33(2), 7-15
Globerman, S. (1979). Foreign Direct Investment and `Spillover' Efficiency
Benefits in Canadian Manufacturing Industries. Canadian Journal of Economics
12(1),42-56
Grossman, G.M., Helpman, E. (1991). Trade, knowledge spillovers, and growth.
European Economic Review Elsevier 35(2-3), 517-526
Haddad M. & Harrison A. (1993). Are There Positive Spillovers from Direct
Foreign Investment? Evidence from Panel Data for Morocco. Journal of De-
velopment Economics, 42 (1), 51-74
52
Hejazi W., Pauly, P. (2003). Motivations for FDI and Domestic Capital
Formation. Journal of International Business Studies 34( 3), 282-289
Hymer, S.H. (1960) .The international operations of national firms: a study of
direct investment. Ph.D. thesis MIT Press: Cambridge, MA.
Jaumotte, R. (2004). Foreign direct investments and regional trade agreements:
The market size effects revisited. IMF Working Paper. Middle East and Central
Asia Department
Javorcik, B.S. (2004). Does Foreign Direct Investment Increase the Productivity
of Domestic Firms? In Search of Spillovers through Backward Linkages. The
American Economic Review 94( 3), 605-627
Jensen, N.M. (2004) Crisis, Conditions, and Capital: The Effect of International
Monetary Fund Agreements on Foreign Direct Investment Inflows.The Journal
of Conflict Resolution 48 (2), 194-210
Kokko, A. (1996). Productivity spillovers from competition between local firms
and foreign affiliates. Journal of International Development 8, 517-30
Lim, E.G. (2001). Determinants of, and the relation between, foreign direct and
growth: a summary of the recent literature. IMF Working Paper, 01/175
Markusen, J.R. (1995). The Boundaries of Multinational Enterprises and the
Theory of International Trade. Journal of Economic Perspectives 9(2), 169-189
Markusen, J.R., Venables, A.J. (1998). Multinational firms and The New Trade
Theory. Journal of International Economics 46, 183-204
53
Navaretti, G.B., Venables, A.J. (2004). Multinational Firms in the World
Economy. Princeton University Press
Pindyck, R.S., Rubinfeld, D.L. (1998) Econometric Models and Economic
Forecasts, 4th edition. McGraw-Hill, New York
Reuber, G.L., Crookel, H., Emerson, M. and Hamonno, Gallais (1973). Private
Foreign Investment in Development. Clarendon Press: Oxford.
Romer, P.M. (1990) Endogenous Technological Change. The Journal of
Political Economy (98)5, S71-S102
Van der Bosch, H. (2003). Branche uitgebreid: de metaal-, elektrotechnische en
transportmiddelenindustrie . Industriemonitor 2003/12 CBS
Vernon, R. (1966). International investments and international trade in the
product cycle. The quarterly Journal of Economics 90(2), 190-207
Wasantha Athukorala, P.P.A. (2003). The Impact of Foreign Direct Investment
for Economic Growth: A Case Study in Sri Lanka. Matara, Sri Lanka 9th
International Conference on Sri Lanka Studies 92
54
10. Appendices
10.1 Simple OLS Method without effects
Dependent Variable: LOGFDISTOCKMethod: Panel Least SquaresDate: 12/07/09 Time: 13:53Sample (adjusted): 1984 2007Cross-sections included: 8Total panel (unbalanced) observations: 149
Variable Coefficient Std. Error t-Statistic Prob.
LOGSIZESECTOR 1.937152 0.165154 11.72935 0.0000LOGCAPITALLABOUR 0.364775 0.088879 4.104181 0.0001
LOGRDEXPENSES 0.428247 0.058128 7.367279 0.0000LOGWAGELEVEL -0.526682 0.428225 -1.229920 0.2207
LOGLABOURPRODUCTIVITY 1.727870 0.165730 10.42580 0.0000C -52.91093 3.543669 -14.93112 0.0000
R-squared 0.842693 Mean dependent var 21.89392Adjusted R-squared 0.837193 S.D. dependent var 2.150700S.E. of regression 0.867794 Akaike info criterion 2.593710Sum squared resid 107.6885 Schwarz criterion 2.714675Log likelihood -187.2314 F-statistic 153.2102Durbin-Watson stat 0.120296 Prob(F-statistic) 0.000000
10.2 Simple OLS Method with Fixed Effects
Dependent Variable: LOGFDISTOCKMethod: Panel Least SquaresDate: 11/30/09 Time: 16:03Sample (adjusted): 1984 2007Cross-sections included: 8Total panel (unbalanced) observations: 149
Variable Coefficient Std. Error t-Statistic Prob.
LOGSIZESECTOR 0.353965 0.314067 1.127037 0.2621LOGLABOURPRODUCTIVITY 0.167195 0.413374 0.404464 0.6866
LOGCAPITALLABOUR 0.884939 0.418492 2.114588 0.0367LOGRDEXPENSES -0.326190 0.070768 -4.609275 0.0000LOGWAGELEVEL -1.221126 0.714365 -1.709386 0.0901
C 19.58755 7.168914 2.732289 0.0073
Effects Specification
55
Cross-section fixed (dummy variables)Period fixed (dummy variables)
R-squared 0.984785 Mean dependent var 21.89392Adjusted R-squared 0.980073 S.D. dependent var 2.150700S.E. of regression 0.303600 Akaike info criterion 0.660453Sum squared resid 10.41556 Schwarz criterion 1.386239Log likelihood -13.20374 F-statistic 208.9734Durbin-Watson stat 0.641146 Prob(F-statistic) 0.000000
10.3 Simple OLS with period Fixed Effects
Dependent Variable: LOGFDISTOCKMethod: Panel Least SquaresDate: 11/30/09 Time: 16:05Sample (adjusted): 1984 2007Cross-sections included: 8Total panel (unbalanced) observations: 149
Variable Coefficient Std. Error t-Statistic Prob.
LOGSIZESECTOR 1.678898 0.191587 8.763131 0.0000LOGLABOURPRODUCTIVITY 1.799408 0.170596 10.54778 0.0000
LOGCAPITALLABOUR 0.259478 0.096728 2.682562 0.0083LOGRDEXPENSES 0.401788 0.060651 6.624575 0.0000LOGWAGELEVEL -1.040713 0.461240 -2.256335 0.0259
C -40.37845 5.465134 -7.388375 0.0000
Effects Specification
Period fixed (dummy variables)
R-squared 0.863790 Mean dependent var 21.89392Adjusted R-squared 0.832007 S.D. dependent var 2.150700S.E. of regression 0.881506 Akaike info criterion 2.758438Sum squared resid 93.24636 Schwarz criterion 3.343098Log likelihood -176.5036 F-statistic 27.17820Durbin-Watson stat 0.137590 Prob(F-statistic) 0.000000
10.4 Simple OLS with sector Fixed Effects
Dependent Variable: LOGFDISTOCKMethod: Panel Least SquaresDate: 11/30/09 Time: 16:07Sample (adjusted): 1984 2007
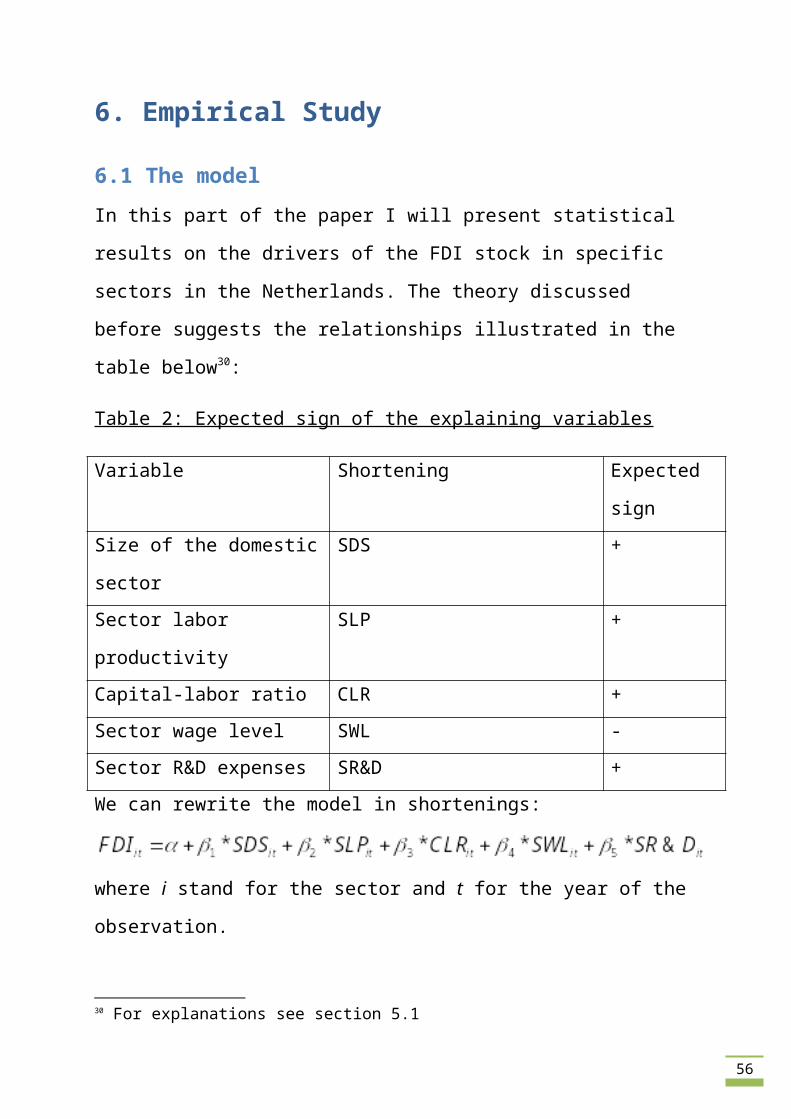
56
Cross-sections included: 8Total panel (unbalanced) observations: 149
Variable Coefficient Std. Error t-Statistic Prob. LOGSIZESECTOR 1.036597 0.382527 2.709866 0.0076
LOGLABOURPRODUCTIVITY 0.470700 0.472531 0.996125 0.3210LOGCAPITALLABOUR 0.415045 0.525045 0.790493 0.4306
LOGRDEXPENSES -0.140318 0.084977 -1.651248 0.1010LOGWAGELEVEL 2.010799 0.606111 3.317543 0.0012
C -32.13829 5.121742 -6.274876 0.0000Effects Specification
Cross-section fixed (dummy variables)R-squared 0.968105 Mean dependent var 21.89392Adjusted R-squared 0.965291 S.D. dependent var 2.150700S.E. of regression 0.400685 Akaike info criterion 1.091922Sum squared resid 21.83457 Schwarz criterion 1.354011Log likelihood -68.34819 F-statistic 343.9988Durbin-Watson stat 0.317182 Prob(F-statistic) 0.000000
10.5 Simple OLS with period Random Effects
Dependent Variable: LOGFDISTOCKMethod: Panel EGLS (Period random effects)Date: 11/30/09 Time: 16:08Sample (adjusted): 1984 2007Cross-sections included: 8Total panel (unbalanced) observations: 149Swamy and Arora estimator of component variances
Variable Coefficient Std. Error t-Statistic Prob.
LOGSIZESECTOR 1.937152 0.167764 11.54690 0.0000LOGLABOURPRODUCTIVITY 1.727870 0.168349 10.26362 0.0000
LOGCAPITALLABOUR 0.364775 0.090283 4.040339 0.0001LOGRDEXPENSES 0.428247 0.059047 7.252678 0.0000LOGWAGELEVEL -0.526682 0.434991 -1.210788 0.2280
C -52.91093 3.599663 -14.69886 0.0000
Effects SpecificationS.D. Rho
Period random 0.000000 0.0000Idiosyncratic random 0.881506 1.0000
Weighted Statistics
R-squared 0.842693 Mean dependent var 21.89392Adjusted R-squared 0.837193 S.D. dependent var 2.150700
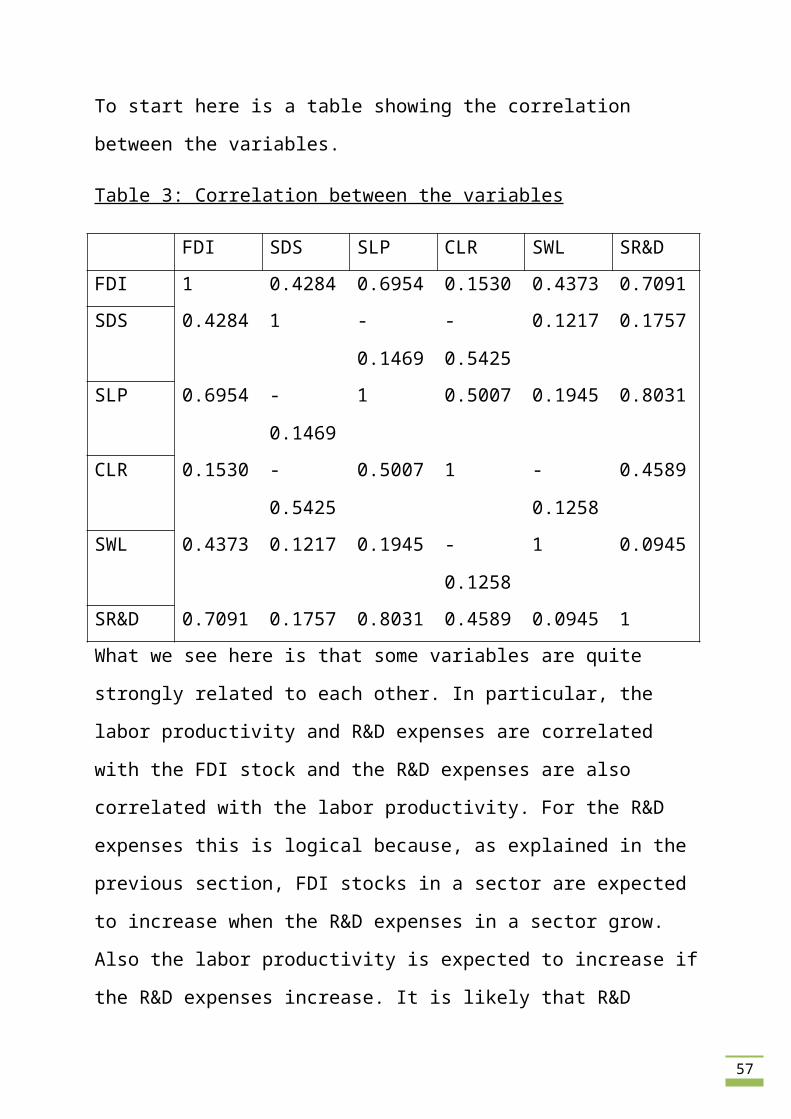
57
S.E. of regression 0.867794 Sum squared resid 107.6885F-statistic 153.2102 Durbin-Watson stat 0.120296Prob(F-statistic) 0.000000
Unweighted Statistics
R-squared 0.842693 Mean dependent var 21.89392Sum squared resid 107.6885 Durbin-Watson stat 0.120296
10.6 Simple OLS with sector Random Effects
Dependent Variable: LOGFDISTOCKMethod: Panel EGLS (Cross-section random effects)Date: 11/30/09 Time: 16:09Sample (adjusted): 1984 2007Cross-sections included: 8Total panel (unbalanced) observations: 149Swamy and Arora estimator of component variances
Variable Coefficient Std. Error t-Statistic Prob.
LOGSIZESECTOR 1.021383 0.293139 3.484294 0.0007LOGLABOURPRODUCTIVITY 0.683287 0.376598 1.814365 0.0717
LOGCAPITALLABOUR 0.147067 0.334499 0.439663 0.6608LOGRDEXPENSES -0.097498 0.082343 -1.184053 0.2384LOGWAGELEVEL 1.990452 0.529007 3.762620 0.0002
C -31.72043 4.469555 -7.097001 0.0000
Effects SpecificationS.D. Rho
Cross-section random 1.374954 0.9217Idiosyncratic random 0.400685 0.0783
Weighted Statistics
R-squared 0.817155 Mean dependent var 1.469191Adjusted R-squared 0.810762 S.D. dependent var 0.923374S.E. of regression 0.401681 Sum squared resid 23.07276F-statistic 127.8167 Durbin-Watson stat 0.295997
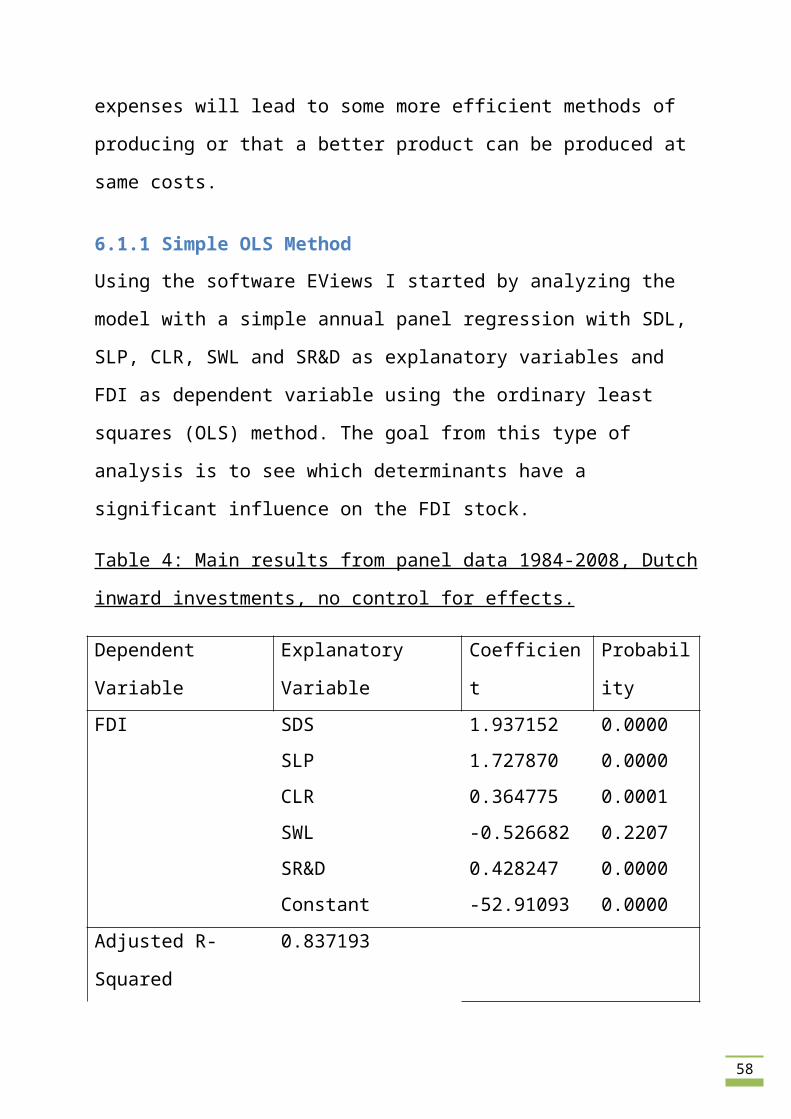
58
Prob(F-statistic) 0.000000
Unweighted Statistics
R-squared 0.645027 Mean dependent var 21.89392Sum squared resid 243.0062 Durbin-Watson stat 0.028104
10.7 Period Random Effects, Hausman Test
Correlated Random Effects - Hausman TestEquation: UntitledTest period random effects
Test Summary Chi-Sq. Statistic Chi-Sq. d.f. Prob.
Period random 13.528322 5 0.0189
10.8 Sector Random Effects, Hausman Test
Correlated Random Effects - Hausman TestEquation: UntitledTest cross-section random effects
Test Summary Chi-Sq. Statistic Chi-Sq. d.f. Prob.
Cross-section random 5.389788 5 0.3702