Embed Size (px)
Citation preview
A comparative analysis of
China and India
Isha Dayal
ICRIER
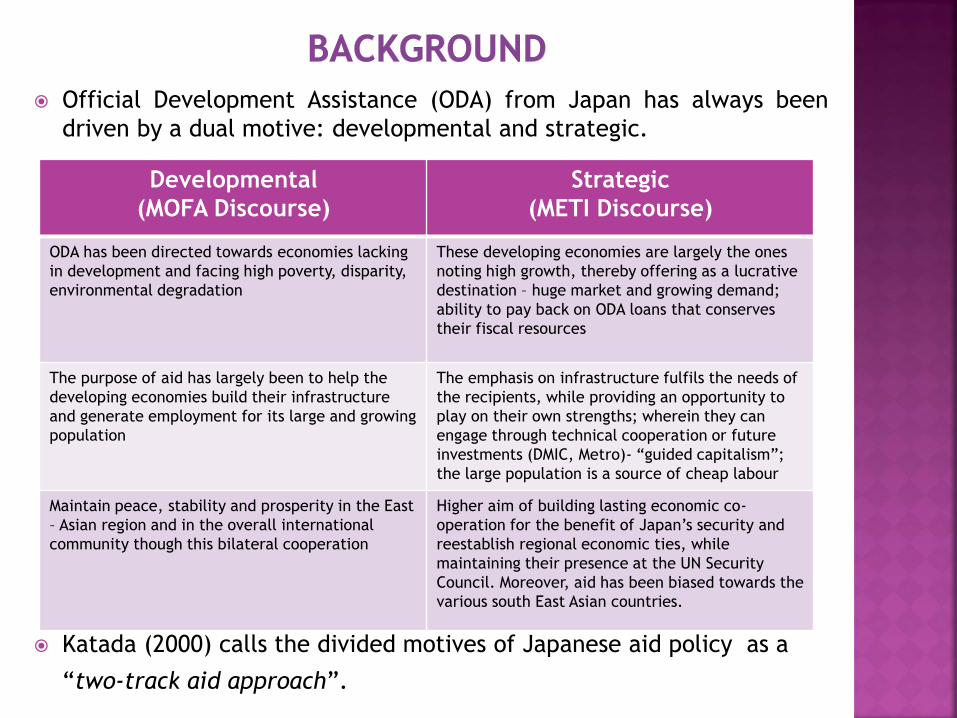
Official Development Assistance (ODA) from Japan has always been
driven by a dual motive: developmental and strategic.
Katada (2000) calls the divided motives of Japanese aid policy as a
“two-track aid approach”.
Developmental
(MOFA Discourse)
Strategic
(METI Discourse)
ODA has been directed towards economies lacking
in development and facing high poverty, disparity,
environmental degradation
These developing economies are largely the ones
noting high growth, thereby offering as a lucrative
destination – huge market and growing demand;
ability to pay back on ODA loans that conserves
their fiscal resources
The purpose of aid has largely been to help the
developing economies build their infrastructure
and generate employment for its large and growing
population
The emphasis on infrastructure fulfils the needs of
the recipients, while providing an opportunity to
play on their own strengths; wherein they can
engage through technical cooperation or future
investments (DMIC, Metro)- “guided capitalism”;
the large population is a source of cheap labour
Maintain peace, stability and prosperity in the East
– Asian region and in the overall international
community though this bilateral cooperation
Higher aim of building lasting economic co-
operation for the benefit of Japan’s security and
reestablish regional economic ties, while
maintaining their presence at the UN Security
Council. Moreover, aid has been biased towards the
various south East Asian countries.
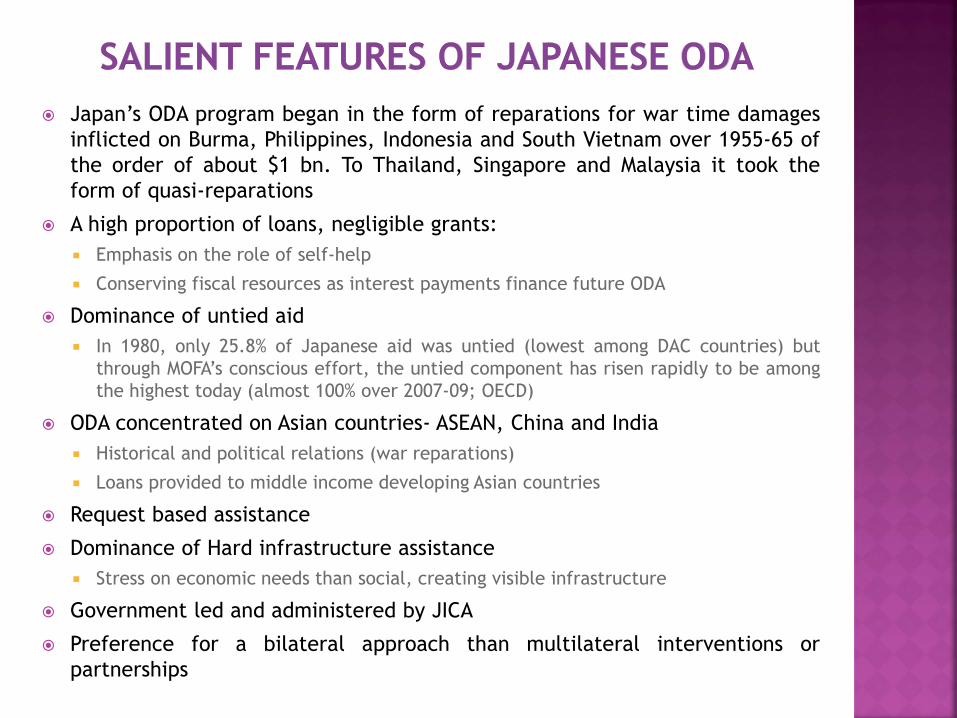
Japan’s ODA program began in the form of reparations for war time damages
inflicted on Burma, Philippines, Indonesia and South Vietnam over 1955-65 of
the order of about $1 bn. To Thailand, Singapore and Malaysia it took the
form of quasi-reparations
A high proportion of loans, negligible grants:
Emphasis on the role of self-help
Conserving fiscal resources as interest payments finance future ODA
Dominance of untied aid
In 1980, only 25.8% of Japanese aid was untied (lowest among DAC countries) but
through MOFA’s conscious effort, the untied component has risen rapidly to be among
the highest today (almost 100% over 2007-09; OECD)
ODA concentrated on Asian countries- ASEAN, China and India
Historical and political relations (war reparations)
Loans provided to middle income developing Asian countries
Request based assistance
Dominance of Hard infrastructure assistance
Stress on economic needs than social, creating visible infrastructure
Government led and administered by JICA
Preference for a bilateral approach than multilateral interventions or
partnerships
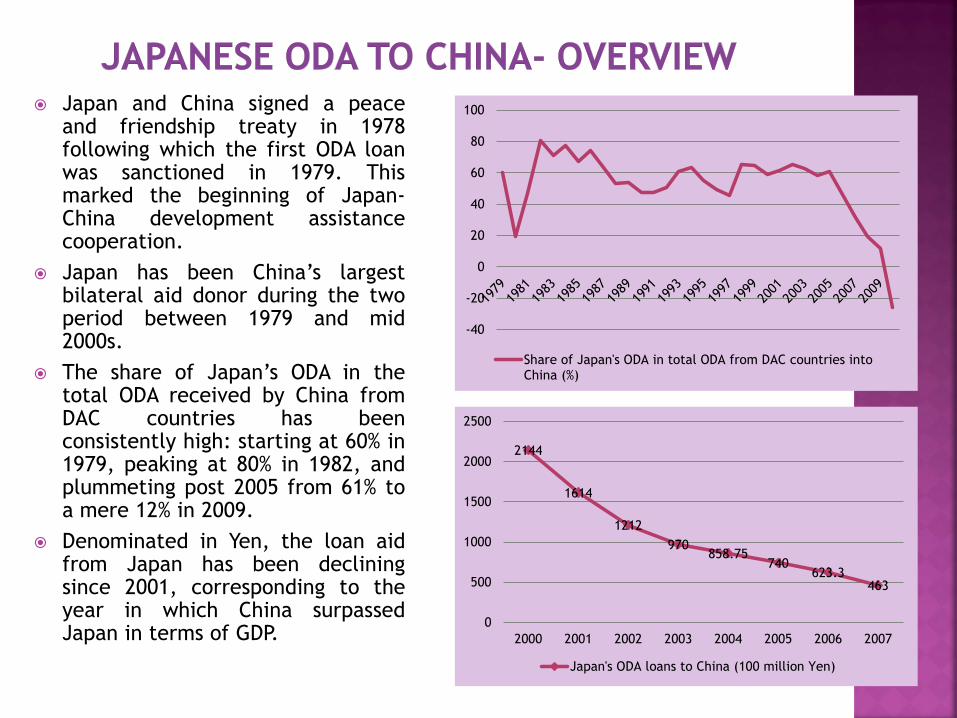
Japan and China signed a peace and friendship treaty in 1978 following which the first ODA loan was sanctioned in 1979. This marked the beginning of Japan-China development assistance cooperation.
Japan has been China’s largest bilateral aid donor during the two period between 1979 and mid 2000s.
The share of Japan’s ODA in the total ODA received by China from DAC countries has been consistently high: starting at 60% in 1979, peaking at 80% in 1982, and plummeting post 2005 from 61% to a mere 12% in 2009.
Denominated in Yen, the loan aid from Japan has been declining since 2001, corresponding to the year in which China surpassed Japan in terms of GDP.
2144
1614
1212
970 858.75
740 623.3
463
0
500
1000
1500
2000
2500
2000 2001 2002 2003 2004 2005 2006 2007
Japan's ODA loans to China (100 million Yen)
-40
-20
0
20
40
60
80
100
Share of Japan's ODA in total ODA from DAC countries intoChina (%)

Japan has recently reviewed its ODA policy for China, approving no new loans since FY2007; even
though grant aid and technical cooperation continue. Japan’s view and criticism of providing aid to
China are:
• Japan dealing with fiscal strains and political turmoil within the economy
• China gaining national power to become the 2nd largest economy after US, and surpassing Japan in terms of GDP
• Astounding development in China’s coastal regions; with private firms now being able to raise funds from international markets, than rely only on ODA
• With the ‘hard’ aspects of development in terms of infrastructure having dealt with, China now requires soft assistance in the form of institution building, development of legal systems etc; that cannot be solved using monetary assistance / funds
Economic
• Modernization of Chinese military and their presence in the Japanese waters
• Maritime disputes with Chinese in the South and East China sea
• Nuclear testing by China, that questions the ‘use’ of Japanese ODA for defense purposes and reinforcing military power rather than undertaking developmental activities.
• Lack of transparency in usage of funds
Political
• China assisting and providing ODA to other 3rd World countries
• Lack of appreciation and gratitude for ODA from Chinese side Strategic
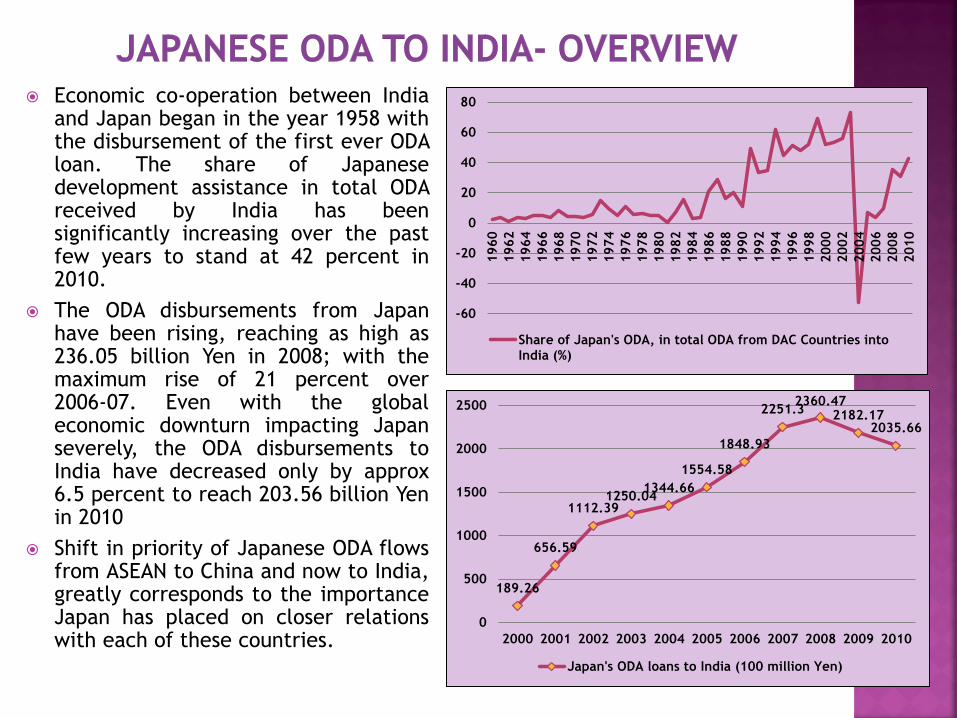
Economic co-operation between India and Japan began in the year 1958 with the disbursement of the first ever ODA loan. The share of Japanese development assistance in total ODA received by India has been significantly increasing over the past few years to stand at 42 percent in 2010.
The ODA disbursements from Japan have been rising, reaching as high as 236.05 billion Yen in 2008; with the maximum rise of 21 percent over 2006-07. Even with the global economic downturn impacting Japan severely, the ODA disbursements to India have decreased only by approx 6.5 percent to reach 203.56 billion Yen in 2010
Shift in priority of Japanese ODA flows from ASEAN to China and now to India, greatly corresponds to the importance Japan has placed on closer relations with each of these countries.
-60
-40
-20
0
20
40
60
80
1960
1962
1964
1966
1968
1970
1972
1974
1976
1978
1980
1982
1984
1986
1988
1990
1992
1994
1996
1998
2000
2002
2004
2006
2008
2010
Share of Japan's ODA, in total ODA from DAC Countries intoIndia (%)
189.26
656.59
1112.39 1250.04
1344.66
1554.58
1848.93
2251.3 2360.47
2182.17 2035.66
0
500
1000
1500
2000
2500
2000 2001 2002 2003 2004 2005 2006 2007 2008 2009 2010
Japan's ODA loans to India (100 million Yen)
Agri, Forest,
Fish 11%
Commodity Loans
3%
Electric Power and
Gas 33%
Irrigation and Flood Control
5%
Mining and Manufactu
ring 11%
Social Services
15%
Tele-communic
ations 4%
Transport 17%
Others 1%
Agri, Forest,
Fish 9%
Commodity Loans
1% Electric Power and
Gas 13%
Irrigation and Flood Control
3%
Mining and Manufactu
ring 1%
Social Services
32% Tele-communic
ations 6%
Transport 35%
Others 0%
India
India China
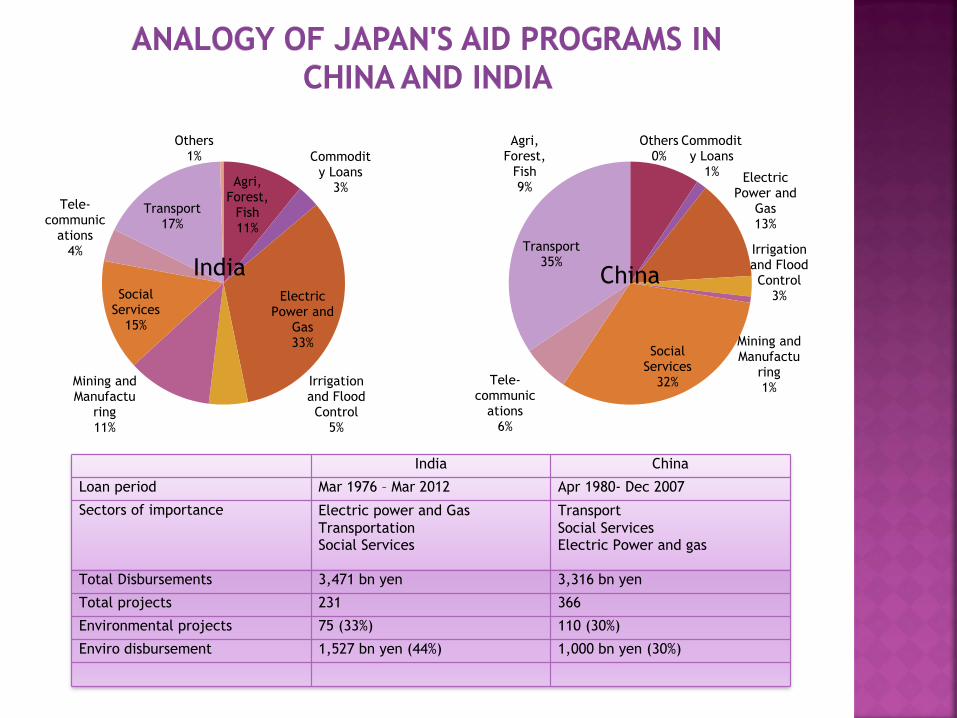
Loan period Mar 1976 – Mar 2012 Apr 1980- Dec 2007
Sectors of importance Electric power and Gas
Transportation Social Services
Transport
Social Services Electric Power and gas
Total Disbursements 3,471 bn yen 3,316 bn yen
Total projects 231 366
Environmental projects 75 (33%) 110 (30%)
Enviro disbursement 1,527 bn yen (44%) 1,000 bn yen (30%)
China
-400
-200
0
200
400
600
800
1000
1200
1400
1600
Net Bilateral Aid flows from Japan in India(current Mn US$)
Net Bilateral Aid flows from Japan in China(current Mn US$)
0
2,000
4,000
6,000
8,000
10,000
12,000
14,000
2000 2001 2002 2003 2004 2005 2006 2007 2008 2009 2010 2011
Japan's Outward FDI (US $ millions)
India China
CIA, 2011
Export
Partners
Import
Partners
China US, Hong
Kong, Japan
Japan, South
Korea, US
India
UAE, US,
China
China, UAE,
Switzerland
Japan
China, US,
South Korea
China, US,
Australia
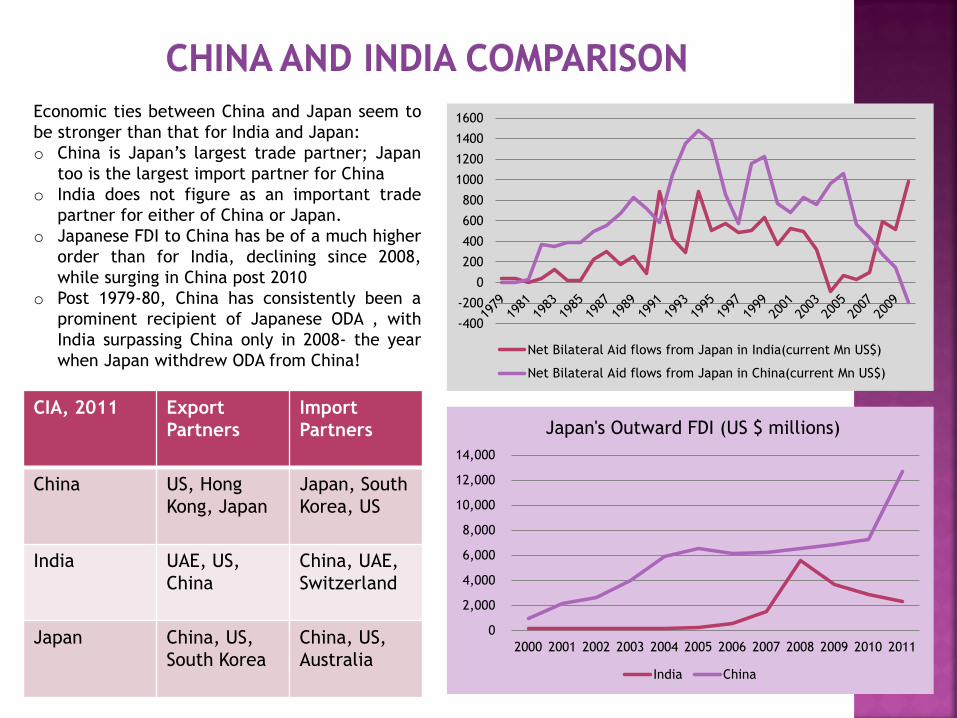
Economic ties between China and Japan seem to
be stronger than that for India and Japan:
o China is Japan’s largest trade partner; Japan
too is the largest import partner for China
o India does not figure as an important trade
partner for either of China or Japan.
o Japanese FDI to China has be of a much higher
order than for India, declining since 2008,
while surging in China post 2010
o Post 1979-80, China has consistently been a
prominent recipient of Japanese ODA , with
India surpassing China only in 2008- the year
when Japan withdrew ODA from China!
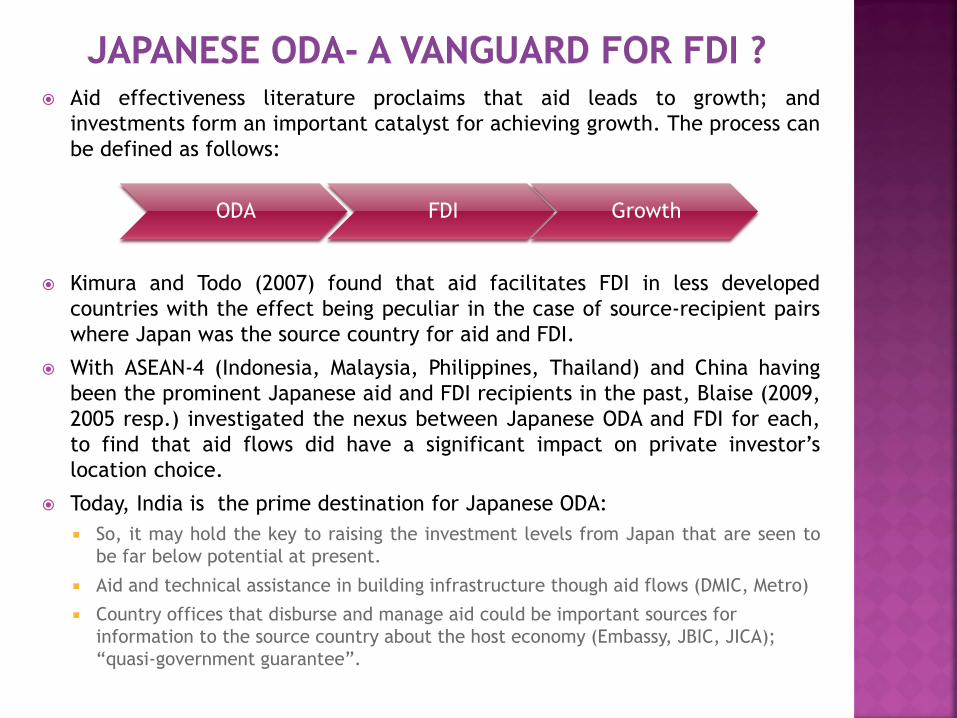
Aid effectiveness literature proclaims that aid leads to growth; and
investments form an important catalyst for achieving growth. The process can
be defined as follows:
Kimura and Todo (2007) found that aid facilitates FDI in less developed
countries with the effect being peculiar in the case of source-recipient pairs
where Japan was the source country for aid and FDI.
With ASEAN-4 (Indonesia, Malaysia, Philippines, Thailand) and China having
been the prominent Japanese aid and FDI recipients in the past, Blaise (2009,
2005 resp.) investigated the nexus between Japanese ODA and FDI for each,
to find that aid flows did have a significant impact on private investor’s
location choice.
Today, India is the prime destination for Japanese ODA:
So, it may hold the key to raising the investment levels from Japan that are seen to
be far below potential at present.
Aid and technical assistance in building infrastructure though aid flows (DMIC, Metro)
Country offices that disburse and manage aid could be important sources for
information to the source country about the host economy (Embassy, JBIC, JICA);
“quasi-government guarantee”.
ODA FDI Growth
We recently conducted an analysis to test the effect of ODA flows on
FDI received by India from five major donor and investor countries:
Japan, United States, United Kingdom, Germany and France
Time period: 1995-2010.
We used robust OLS and System GMM estimation methods. The results
are as follows:
Aid inflows in India (total, for infra activities or humanitarian
purposes) has a significant and positive impact on FDI from DAC
countries; 1% increase in ODA resulting in about 0.3% increase in FDI.
In the case of Japan, aid of all forms (infra or total) are seen to have
an even higher positive impact on FDI; 1% rise in ODA leads to 1%
increase in FDI
The vanguard effect of ODA was found to be absent in the case of all
the other DAC countries
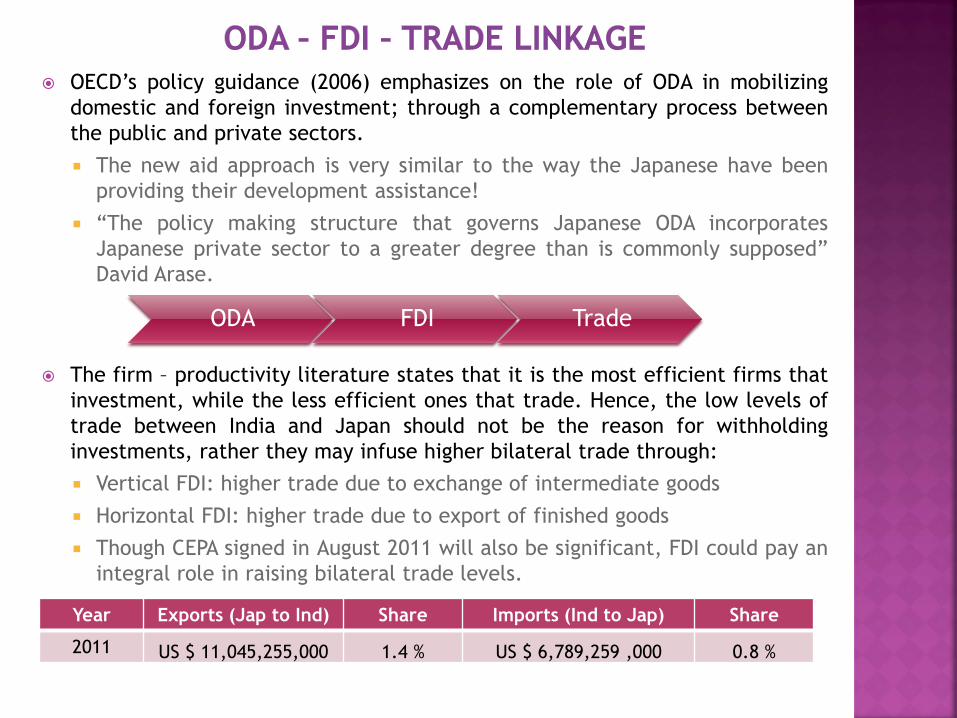
OECD’s policy guidance (2006) emphasizes on the role of ODA in mobilizing
domestic and foreign investment; through a complementary process between
the public and private sectors.
The new aid approach is very similar to the way the Japanese have been
providing their development assistance!
“The policy making structure that governs Japanese ODA incorporates
Japanese private sector to a greater degree than is commonly supposed”
David Arase.
The firm – productivity literature states that it is the most efficient firms that
investment, while the less efficient ones that trade. Hence, the low levels of
trade between India and Japan should not be the reason for withholding
investments, rather they may infuse higher bilateral trade through:
Vertical FDI: higher trade due to exchange of intermediate goods
Horizontal FDI: higher trade due to export of finished goods
Though CEPA signed in August 2011 will also be significant, FDI could pay an
integral role in raising bilateral trade levels.
ODA FDI Trade
Year Exports (Jap to Ind) Share Imports (Ind to Jap) Share
2011 US $ 11,045,255,000 1.4 % US $ 6,789,259 ,000 0.8 %
According to the Ministry of Foreign Affairs Japan, ODA for India is one of the important tools to strengthen India-Japan relations set forth by “Japan-India Strategic and Global Partnership.”
The strengthening bilateral cooperation and the rising importance of India for Japan could bring higher investment which could potentially raise Indo-Japan bilateral trade as well.
Since mid 2000’s the growth of Japanese companies in India has been phenomenal, second only to China with 926 Japanese Companies registered in Oct’12.
As per Japanese investor’s perception, India emerges as the most promising country for overseas business in the next 10 years (JBIC Survey Report 2012)
Tamil Nadu (followed by Maharashtra, Karnataka, Haryana and Delhi) is going to be the most promising state for investments in the next three years
Though India and Japan relations have been growing stronger, they are far below China – Japan economic relations and are likely to rise as and when Japan withdraws from China. But the question is, would India be able to rise as high as China did?
Prof. Shinji Takagi claims that “India will not be the next China” seeing the abysmal investment and trade relations between India and Japan.
But rising levels of ODA and investments to make India a production and export base may prove otherwise!
Japanese relations with ASEAN and China hold lessons for India; but the withdrawal of aid from China should make India wary of the future of its relationship with Japan
Kawai M. and Takagi S. (2001), Japan’s Official Development Assistance:
Recent Issues and Future Directions, World Bank Policy Research Working
Paper; 2722
Joshi S. and Dayal I. (2012), Trends in Japanese Overseas Development
Assistance to India, Foreign Policy Research Centre Journal No.12, pg.
205 – 217
OECD (2006); Promoting Private Investment for Development- Role of ODA
Alesina A. and Dollar D. (1998); Who Gives Foreign Aid to Whom and
Why?; NBER Working Paper Series 6612
Kimura H. and Todo Y. (2007); Is Foreign Aid a Vanguard for FDI? A Gravity
Equation Approach, RIETI Discussion Paper Series 07-E-007
Blaise S. (2009); Japanese Aid as a Prerequisite for FDI: The Case of
Southeast Asian Countries; Asia Pacific Economic Papers No.385
Blaise S. (2005); On the Link Between Japanese ODA and FDI in China: a
microeconomic evaluation using conditional logit analysis; Applied
Economics 37:1, 51-55
MOFA, Japan
Embassy of Japan in India