Embed Size (px)
Citation preview

Procedia Economics and Finance 32 ( 2015 ) 790 – 794
2212-5671 © 2015 The Authors. Published by Elsevier B.V. This is an open access article under the CC BY-NC-ND license (http://creativecommons.org/licenses/by-nc-nd/4.0/).Selection and peer-review under responsibility of Asociatia Grupul Roman de Cercetari in Finante Corporatistedoi: 10.1016/S2212-5671(15)01463-X
ScienceDirectAvailable online at www.sciencedirect.com
Emerging Markets Queries in Finance and Business
A comparative analysis of the administration for markets and fairs public service for three major cities in Romania: Craiova,
Iasi and Timisoara
Mircea Aurel Ni a,* aNational School of Political and Administrative Studies, Faculty of Public Administration, Povernei Street no.6, Bucharest, Romania
Abstract
Click here and insert your abstract text. Administration of Markets and Fairs Public Services from Craiova, Iasi, and Timisoara are providing public services consumed by the user, by means of contracts and subscription agreements with individuals or legal entities, either to achieve or to exploit the operation of commercial spaces. Administration is done in order to meet common public interest, but in terms of economic efficiency. Managerial success of the Administration of Markets and Fairs Public Service is determined by its ability to identify customer needs and provide products and/or services to satisfy their need by the attraction of small producers and farmers offering organic products. In public service, the results have to be oriented to citizens concomitantly with cost optimization. This paper presents a comparative analysis of Civil Service for the Administration of Markets and Fairs for three major cities in Romania, with a common set of indicators and indices. The commons variable are: population served, the total population of each city, market areas, their number and their distribution for each city, etc.. This analysis helps halls to get closer to the citizen by identifying directions for action in order to increase the satisfaction of citizens served. © 2015 Authors. Published by Elsevier B.V. This is an open access article under the CC BY-NC-ND license (http://creativecommons.org/licenses/by-nc-nd/3.0/). Selection and peer-review under responsibility of the Emerging Markets Queries in Finance and Business local organization. Keywords: management; public service; market administration; citizens’ satisfaction
* Corresponding author. Tel.: +40-21-318-0897. E-mail address: [email protected].
© 2015 The Authors. Published by Elsevier B.V. This is an open access article under the CC BY-NC-ND license (http://creativecommons.org/licenses/by-nc-nd/4.0/).Selection and peer-review under responsibility of Asociatia Grupul Roman de Cercetari in Finante Corporatiste
791 Mircea Aurel Niță / Procedia Economics and Finance 32 ( 2015 ) 790 – 794
1. Introduction
Economic and financial year starts on 1 January and ends on 31 December of each year. Public Service may carry out receipts and payments within the scope of activity. From the profit, the public service may constitute a prize fund, according to official regulations. Current and capital expenditure financing related to the public service shall be made from its own budget and local budget. The income and expenses of administration Markets and Fairs shall be adopted by the Local Council of Craiova. From an economic perspective, there are several indicators that an institution / company needs to calculate and to analyze from which enumerate: turnover, the margin on variable costs, operational result, breakeven point, etc.
2. Indicators and indices of management and market public service in Iasi, Craiova, Timisoara
In order to achieve the following appendices, tables and figures I consulted the official websites of the following public institutions: Craiova Municipality City Hall, National Institute of Statistics, Ia i Municipality City Hall, Timi oara Municipality City Hall, using statistics from the period 1992-2014. In this respect, financial performance was analyzed for the years 2012 and 2013 on the following indicators: • Total income indicator, where there is an increase on the 2013 compared to 2012 with 0.16% • Revenue indicator from the supplies of services and other activities where there is an increase on the 2013
compared to 2012 with 0.25% • Professional training indicator, which is an increase of 2013 compared to 2012 with 0.22% • Indicator publicity and advertising, where it is found that the amounts allocated for year 2013 compared to
2012 decreased with 0.34%. In the situation described above, there is a positive development because the institution has no budget deficit
in 2013 compared to 2012. To obtain the number of people that they belong to a market in the city of Craiova, I did an analysis of quantitative indicators and measurement, according to the National Institute of Statistics, Census data recorded in the period 1992-2011 as well as on the website of the analyzed City Halls, and as comparable variables we took into account the population and the number of existing markets in the city Craiova compared to the other two municipalities Iasi and Timisoara.
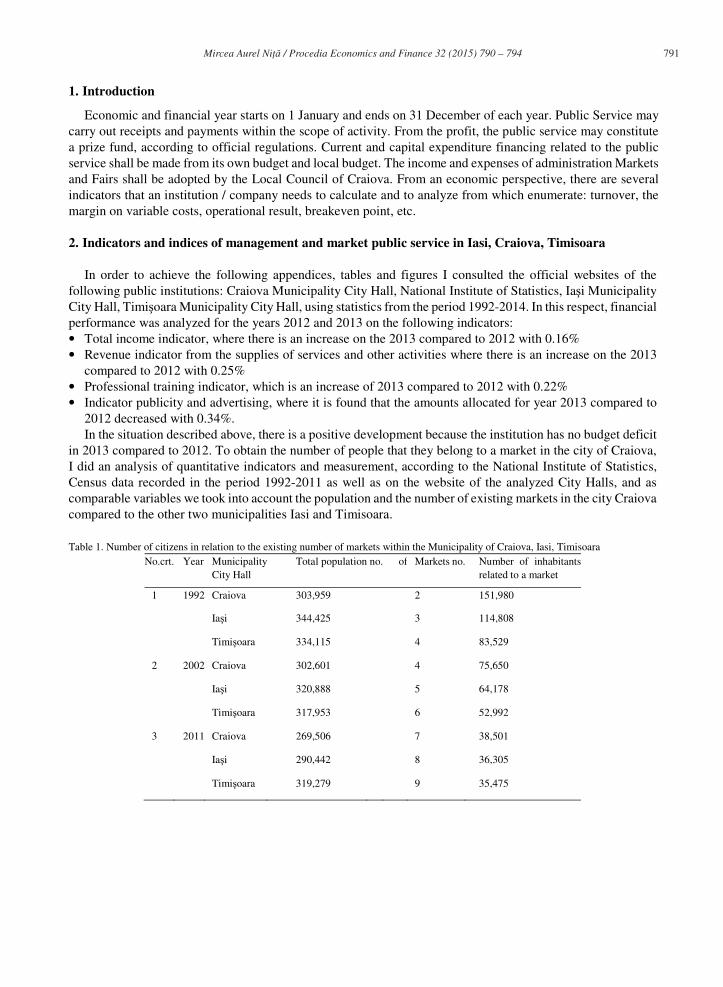
Table 1. Number of citizens in relation to the existing number of markets within the Municipality of Craiova, Iasi, Timisoara No.crt. Year Municipality
City Hall Total population no. of Markets no. Number of inhabitants
related to a market
1 1992 Craiova 303,959 2 151,980
Ia i 344,425 3 114,808
Timi oara 334,115 4 83,529
2 2002 Craiova 302,601 4 75,650
Ia i 320,888 5 64,178
Timi oara 317,953 6 52,992
3 2011 Craiova 269,506 7 38,501
Ia i 290,442 8 36,305
Timi oara 319,279 9 35,475

792 Mircea Aurel Niță / Procedia Economics and Finance 32 ( 2015 ) 790 – 794
According to aforementioned, is noticeable that the population decreased considerably, but has increased the number of markets in the analyzed cities, indicating fewer people which are subordinated to a market. This is evident from the following figures, according to the analysis performed within the analyzed City Halls, respectively Craiova, Ia i, and Timisoara. In order to obtain the amount of expenditure allocated to a resident of the city of Craiova I made an analysis of quantitative indicators and measurement, according to the National Institute of Statistics, Census data recorded in the period 1992-2011 as well as on the websites of the analyzed City Halls, and as comparable variables we took into account the population and the amount of the budget allocated to the Municipality of Craiova compared with two other municipalities, namely Ia i and Timi oara.
Table 2. Indicators and indices on the amount of expenditure allocated to a resident of the Municipality of Craiova, Iasi, Timisoara
No.crt. Year MunicipalityCity hall
Total no. population of Allocated budget Amount allocated expenditure / capita
1 1992 Craiova 303,959 3,000,000,000 lei 9,870 lei
Ia i 34,425 3,400,000,000 lei 9,872 lei
Timi oara 334,115 2,900,000,000 lei 8,680 lei
2 2002 Craiova 302,601 1,500,000,000 lei 4,957 lei
Ia i 320,888 1,700,000,000 lei 5,298 lei
Timi oara 317,953 1,600,000,000 lei 5,032 lei
3 2011 Craiova 269,506 8,000,000 lei 29.68 lei
Ia i 290,442 9,200,000 lei 31.68 lei
Timi oara 319,279 10,000,000 lei 31.32 lei
According to the aforementioned, is noticeable that the population decreased considerably and with it fell the amount of the annual budget of the municipalities analyzed, indicating a considerable decrease in the amount of expenditure allocated per capita.
Fig. 1. Indicators and indices regarding expenditure per capita in Craiova
793 Mircea Aurel Niță / Procedia Economics and Finance 32 ( 2015 ) 790 – 794
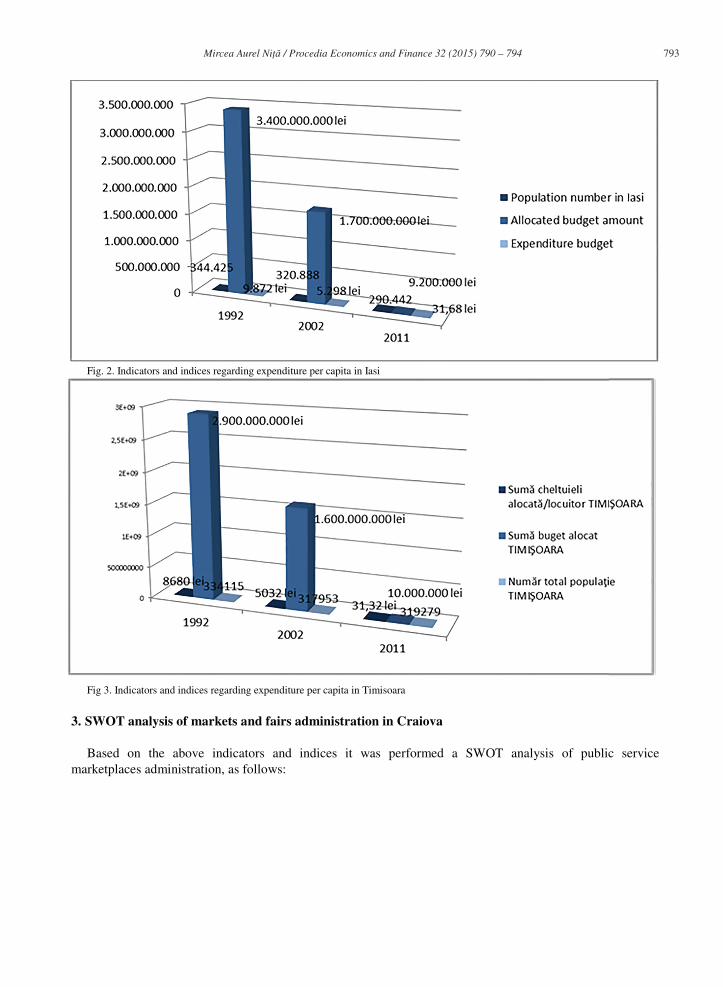
Fig. 2. Indicators and indices regarding expenditure per capita in Iasi
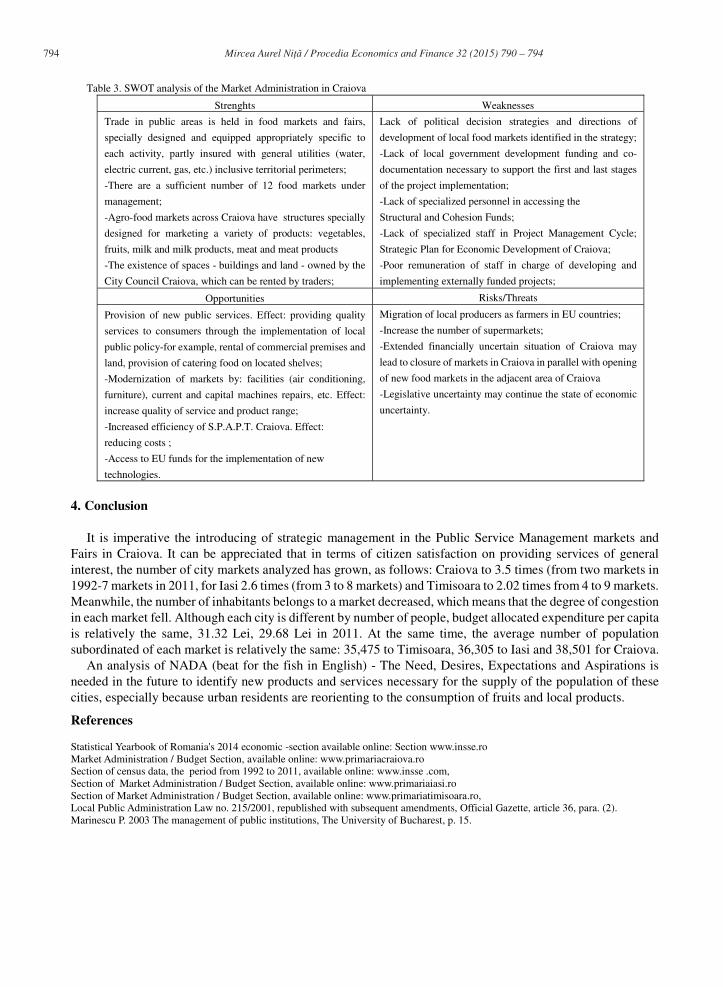
Fig 3. Indicators and indices regarding expenditure per capita in Timisoara
3. SWOT analysis of markets and fairs administration in Craiova
Based on the above indicators and indices it was performed a SWOT analysis of public servicemarketplaces administration, as follows:
794 Mircea Aurel Niță / Procedia Economics and Finance 32 ( 2015 ) 790 – 794
Table 3. SWOT analysis of the Market Administration in Craiova
Strenghts Weaknesses
Trade in public areas is held in food markets and fairs,
specially designed and equipped appropriately specific to
each activity, partly insured with general utilities (water,
electric current, gas, etc.) inclusive territorial perimeters;
-There are a sufficient number of 12 food markets under
management;
-Agro-food markets across Craiova have structures specially
designed for marketing a variety of products: vegetables,
fruits, milk and milk products, meat and meat products
-The existence of spaces - buildings and land - owned by the
City Council Craiova, which can be rented by traders;
Lack of political decision strategies and directions of
development of local food markets identified in the strategy;
-Lack of local government development funding and co-
documentation necessary to support the first and last stages
of the project implementation;
-Lack of specialized personnel in accessing the
Structural and Cohesion Funds;
-Lack of specialized staff in Project Management Cycle;
Strategic Plan for Economic Development of Craiova;
-Poor remuneration of staff in charge of developing and
implementing externally funded projects;
Opportunities Risks/Threats
Provision of new public services. Effect: providing quality
services to consumers through the implementation of local
public policy-for example, rental of commercial premises and
land, provision of catering food on located shelves;
-Modernization of markets by: facilities (air conditioning,
furniture), current and capital machines repairs, etc. Effect:
increase quality of service and product range;
-Increased efficiency of S.P.A.P.T. Craiova. Effect:
reducing costs ;
-Access to EU funds for the implementation of new
technologies.
Migration of local producers as farmers in EU countries;
-Increase the number of supermarkets;
-Extended financially uncertain situation of Craiova may
lead to closure of markets in Craiova in parallel with opening
of new food markets in the adjacent area of Craiova
-Legislative uncertainty may continue the state of economic
uncertainty.
4. Conclusion
It is imperative the introducing of strategic management in the Public Service Management markets andFairs in Craiova. It can be appreciated that in terms of citizen satisfaction on providing services of general interest, the number of city markets analyzed has grown, as follows: Craiova to 3.5 times (from two markets in 1992-7 markets in 2011, for Iasi 2.6 times (from 3 to 8 markets) and Timisoara to 2.02 times from 4 to 9 markets. Meanwhile, the number of inhabitants belongs to a market decreased, which means that the degree of congestion in each market fell. Although each city is different by number of people, budget allocated expenditure per capita is relatively the same, 31.32 Lei, 29.68 Lei in 2011. At the same time, the average number of population subordinated of each market is relatively the same: 35,475 to Timisoara, 36,305 to Iasi and 38,501 for Craiova.
An analysis of NADA (beat for the fish in English) - The Need, Desires, Expectations and Aspirations is needed in the future to identify new products and services necessary for the supply of the population of these cities, especially because urban residents are reorienting to the consumption of fruits and local products.
References
Statistical Yearbook of Romania's 2014 economic -section available online: Section www.insse.ro Market Administration / Budget Section, available online: www.primariacraiova.ro Section of census data, the period from 1992 to 2011, available online: www.insse .com, Section of Market Administration / Budget Section, available online: www.primariaiasi.ro Section of Market Administration / Budget Section, available online: www.primariatimisoara.ro, Local Public Administration Law no. 215/2001, republished with subsequent amendments, Official Gazette, article 36, para. (2). Marinescu P. 2003 The management of public institutions, The University of Bucharest, p. 15.