Embed Size (px)
Citation preview

University of Kentucky University of Kentucky
UKnowledge UKnowledge
MPA/MPP/MPFM Capstone Projects James W. Martin School of Public Policy and Administration
2017
A Comparative Analysis of the Organizational Effectiveness of A Comparative Analysis of the Organizational Effectiveness of
Three Korea Land and Housing Corporation Construction Field Three Korea Land and Housing Corporation Construction Field
Groups Groups
Jachoon Koo University of Kentucky, [email protected]
Follow this and additional works at: https://uknowledge.uky.edu/mpampp_etds
Part of the Business Administration, Management, and Operations Commons, Korean Studies
Commons, Organizational Communication Commons, Organization Development Commons, and the
Public Affairs, Public Policy and Public Administration Commons
Right click to open a feedback form in a new tab to let us know how this document benefits you. Right click to open a feedback form in a new tab to let us know how this document benefits you.
Recommended Citation Recommended Citation Koo, Jachoon, "A Comparative Analysis of the Organizational Effectiveness of Three Korea Land and Housing Corporation Construction Field Groups" (2017). MPA/MPP/MPFM Capstone Projects. 294. https://uknowledge.uky.edu/mpampp_etds/294
This Graduate Capstone Project is brought to you for free and open access by the James W. Martin School of Public Policy and Administration at UKnowledge. It has been accepted for inclusion in MPA/MPP/MPFM Capstone Projects by an authorized administrator of UKnowledge. For more information, please contact [email protected].

1
A Comparative Analysis of the Organizational Effectiveness
of Three Korea Land and Housing Corporation
Construction Field Groups
Jachoon Koo
Fall 2017
Graduate Capstone
Advisor: Dr. Nick Petrovsky

- 1 -
Table of Contents
Executive summary ……………………………………………………………………….. 2
1. Introduction …………………………………………………………………………….. 3
2. Problem definition …………………………………………………………….……….. 4
3. Research purpose …………………………………………………………….………… 6
4. Subjects ……………………………………..…………………………….………..…… 6
5. Research scope ……………………………………………………………..…………… 6
6. Literature review ……………………………………………………………….………. 7
7. Research questions …………………………………….………………………….…… 11
8. Research method ……………………………………………………………………….. 11
9. Results …………………………………………………………………….….………… 22
10. Research finding, conclusion, and suggestion …………………………………..….. 29
11. Limitations of research ………………………………………………………..……... 29
References .………………………………………………………………………………... 30
Appendix ………………………………………………………………………………….. 32

- 2 -
Executive summary
The purpose of this study is to propose a performance evaluation method (organizational
effectiveness value) that is most suitable for LH field organizations and to suggest an
improvement plan by comparing and analyzing the results from organizational perspective.
I compared and contrasted three LH construction fields. The following is my research
findings: First, the main factors which determine successful or unsuccessful field are
organizational cohesion and inter-organizational communication. Mutual communication of field
groups affects the quality more, if the field conditions are difficult. Second, if field groups fail to
cohere and communicate, it is likely to lead to low performance in cost management,
construction management, and quality management.
In this study, I recommend that LH field organizations consider more organization
effectiveness values and maintain harmony, coordination, diversity and balance with other field
organizations. I suggest that LH should play a leading role in terms of organization management
for the future.

- 3 -
1. Introduction
According to Statistics Korea, 60.1% of housing units in South Korea are apartments
(See Figure1). The share of apartments has been steadily increasing. Korea Land and Housing
Corporation (LH) plays a big role in supplying apartments. LH has built the largest number of
apartments in Korea. LH has been contributing to the stabilization of the housing supply for
Korean low to middle income families by providing 2.43 million housing units1 since its
foundation as Korea National Housing Corporation in 1962.
Figure 1. Change in housing types of South Korea by year
(Source: Statistics Korea, Complete Enumeration Results of the 2016 Population and Housing Census)
In 2017, LH is building 129,061 housing units across 168 residential construction
projects, where numerous construction companies are participating in on-site units. LH is in a
supervisory position, overseeing contractors in various construction types such as architecture,
1 1.18 million housing units for sale, 1.25 million rental housing units. 2.43 million housing unit is almost 13.4% of
all housing units (18.13 million housing units) in Korea (LH brochure, 2013).

- 4 -
civil engineering, machinery, electricity. Cooperative relationships with contractors are very
important, as it is necessary to integrate many processes to build flawless apartments efficiently.
However, there has been no research on LH construction projects to link the inter-
organizational interactions or to suggest improvement of the field organization on the theoretical
basis. The reason is that the field organization is temporary and it is made up of a community of
groups dispatched from different organizations. Integrating them and resolving problems
between the organizations is difficult. This is a recurring phenomenon at the organizational level,
but many people have thought that this is a personal problem.
The framework and role of the organization in the field are very important to LH to cope
with many changes in the construction industry. My research attempts to explore and study the
organization itself in the field, away from existing researches which focus on technical and
administrative field systems. This Capstone is important because it is rare to study the inter-
organizational relationship in the construction fields.
2. Problem definition
LH is short of on-site supervisory personnel due to continuous expansion of business
and differentiation of work. Most of the supervisory personnel are concurrently in charge of two
or three fields which are away from each other. Contractors are also experiencing difficulties as
revenue has decreased due to the stagnation of the construction market, and it is hard to hire
technicians, which it leads to the increase of labor costs. Changes in labor law and the activation
of labor unions are changing the environment of the construction industry to be less hierarchical.
These trends are changing the organizations within the LH field.

- 5 -
A construction field is a collection of project organizations that are temporarily
organized to build structures as contracted. It takes a few months from the beginning of a project
for field organizations to have stable structures, and it is only about halfway through the
construction period that the participating organizations establish mutual trust. LH, as a public
organization, encourages contractors and supervises to check if their works satisfy the
specifications.
LH is in the commanding position, and the constructors carry out the order. This
relationship is often found in principal-agent relations. Here, the agent is typically under pressure
because the supervisor is well aware of the problems that can occur in the field. These
differences in positions often provoke distrust between supervisors and contractors in technical,
administrative, and cost related matters. Inter organizational communication is interrupted, and
in this process, difficulties and friction arise.
When performing a labor-intensive project in a construction field, there are many
organizational conflicts since there are several companies with different interests. Those conflicts
are mainly caused by the cost of construction. The three components of construction
management are time, quality, and cost management. The relationships of these factors are 1)
cost increases in the less time there is for a project, 2) quality increases as the cost increases, and
3) quality increases as the time allotted to a project increases. Generally, supervisors fix the
construction period and cost, then concentrate on quality management. However, construction
companies tend to focus on cost management to maximize their profits. So, they tend to neglect
quality as much as supervisors will allow them.

- 6 -
3. Research purpose
The purpose of this study is to propose a performance evaluation method (organizational
effectiveness value) that is most suitable for LH field organizations and to suggest an
improvement plan by comparing and analyzing the results from organizational viewpoint.
4. Subjects
I compare and contrast LH construction fields. They are: Seongnam JD (JD), Jecheon GJ
(GJ), and Chungju CD (CD). All have already been completed, allowing me to review all phases
of each project. The main details of the three construction fields are as follows (see Table1).
Table 1. Construction Status
Status JD GJ CD
Construction period May 8, 2009 ~ Jun 6, 2012 Feb 19, 2014 ~ Sep 30, 2015 Jun 25, 2015.~Nov 12 2016
Total floor area 89,891M2 17,325M
2 13,852M2
Number of Buildings
& households 11 APT buildings/
545 households 2 APT buildings/
268 households 3 APT buildings/
296 households
Floors 13-21 15 5-8
Cost of construction 63,334,000,000 KRW
($55,073,043) 11,296,698,000 KRW
($9,823,216) 12,562,610,000 KRW
($10,924,001)
Contractor Company L Company D Company S
5. Research scope
The scope of the study is limited to LH’s on-field supervisory organization and main
contractor organization (usually architecture, machinery, and civil engineering companies),

- 7 -
which plays a major role in construction management. In a LH construction field, more than 30
companies usually work together and one main construction company accounts for more than 70%
of total construction cost. Therefore, the relationship between groups is also limited to the
relationship between the main contractor and the supervisory organization of LH.
The field organizations that were formed in three fields are group level organizations
dispatched from each head office. Because the field organization is based on the organizational
design already implemented by the headquarters, the research takes place at the group level, not
at the organizational level such as LH’s headquarters and local branch, or contractors’
headquarters.
6. Literature Review
In previous research, Lee & other (1997) was directly focused on the efficiency and
performance of the construction field. They proposed a construction field evaluation model. By
applying the model, all fields can be evaluated in terms of efficiency and performance. However,
it should be reviewed according to the needs of each organization and situation. Based on this
evaluation model, my research will find out the fit of task structure, performance norms,
workforce composition and human relations applied as elements of organizational cohesion. In
order to investigate the relationship between organizations, communication will be added to the
level of organizational interaction. Next, as more quantitative data are needed to ensure
objectivity, quantitative indicators will be added.
In order to examine the relationship between organizations, previous studies have shown
that organizations form exchange mechanisms and inter-organizational linkages due to

- 8 -
interdependence (Jo and Lee, 2008). Ngidang (1993)(Jo and Lee, 2008, recite) suggested this
system to be characterized by two basic interdependent structures: organizing and
communicating. Then, the study extracted these elements as follows (See Table 2).
Table 2. Organizational Performance Influencing Factors
Non-interdependent
factors
(Organizational
management
factors)
Interdependency factors
1) Organizational perspective 2) Communication perspective
Resource
organization
Full
systemization Resource dependent Group survival
Trust,
Public service,
Motivation,
Leadership,
Organizational
Structure, Institution,
Organizational
culture
Resource
management,
Program
management,
Personnel
management
Relationship
With community,
Organizational
Citizenship,
Social capital
Linkage program
(joint project),
Information sharing
(customer retention
/ program information),
Materials support
(funding, material
support)
Interpretation and
interaction between
managers, documents
of agreement among
organizations
Source : Jo & Lee ( 2008). P234, The table is reorganized
Here, ‘Organizational perspective’ and ‘Communication perspective’ are handled
separately in equal positions. Inter-organizational communication has been recognized as an
important factor in improving organizational performance. If so, is it possible to judge that the
organization’s performance, such as quality improvement, has been improved by relatively
unofficial factors such as inter-organizational communication? We can refer to the Hawthorne
experiments of Roethlisberger and Dickson (1939)2 as a basis for this. They concluded that
socio-psychological conditions such as job motivation in humans, rather than physical work
conditions such as intensity of light, may further affect production efficiency. In other words,
they found that employees’ organizational and job attitudes, human treatment of employees of
2 Roethlisberger and Dickson (1939) investigated the effects of changes in physical working conditions, such as
lighting, working hours and break, on productivity in Hawthorne workers at an electric company in the US in the
late 1920s. They found that the productivity increased even when the lighting of the workshop was dimmed or the
rest time was reduced. (Eun, 2013)

- 9 -
sympathetic and understanding supervisory organizations, and informal groups have more
impact on production efficiency. This Capstone covers different organizations, but there are
similarities of relationship between supervisory and employee. In addition, two components of
the communication perspective; the content of indicators for resource dependence and group
survival, are well suited to field organization. Therefore, one hypothesis that ‘communication
between field organizations affects quality’ is established.
I refer to contractor evaluation of Lee and other (2017) to find out which factors are
appropriate for evaluating. They treated construction management capability and organizational
management capability as the owner’s capacity assessment. This suggests that there is an
additional need for organizational capacity building on the LH field, which focuses exclusively
on management skills. I only refer to the factors (See table3), since the number of questionnaires
collected is too small.
Table 3 Owner capability evaluation items
Construction Management Capability Organizational Management Capability
Business, planning, Design, Process, Material,
Contract, Cost, Information, Quality, Safety,
Personnel, Financial, General
In-Organizational support and control system,
Executive leadership,
Education and training
(Source : Lee and other (2017). P149. The table is reorganized
Finally, I refer to a ‘Framework of the comparative performance measurement in the
construction industry’ (Yu and others, 2004) about what to look for in order to evaluate the
organizational effectiveness value. They set out performance indicators in terms of (1) financial,
(2) customer, (3) internal work process, and (4) learning and growth. Among these indicators,
items (3) and (4) are the most relevant indicators of organization. The main items are as follows
(See Table 4).

- 10 -
Table 4. Measuring element
Measurement element Factor Contractor Owner
(3) Internal process
Competitive
factors
R & D investment amount,
technology capacity
R & D investment amount,
Technology capacity
Business
process
Accident rate, sales and general
management rate,
Processing speed
-
Customer
management - Market demand reflect level
Operational
efficiency -
Achievement of business goal,
Cost reduction performance,
Sales and general management ratio
Fund recovery rate,
Accuracy of funding plan
(4) Learning growth Organizational
Capability
Contractor Excellent manpower
ratio,
employee turnover rate,
Education and training costs,
Knowledge sharing level,
Employee productivity
Owner Excellent manpower ratio,
Education and training costs,
Knowledge sharing level
Employee productivity
Source : Yu and others. (2004). P179-180. The table is reorganized
Taken together, the preceding research shows that the tendency of construction industry
performance measurement takes into consideration various aspects without evaluating the
present financial value alone. In particular, considering the public nature of LH, it is reasonable
to quantify the organizational capacity by group cohesion and communication. It is better to
evaluate a value concept considering cost management, construction management and quality
management as existing researches.
7. Research questions
The research question of this study and the hypotheses for this question are as follows.

- 11 -
7.1 Question
What distinguishes successful public-private partnerships / contracts in apartment
complex construction from unsuccessful ones?
7.2 Hypotheses
Hypothesis 1: The better the group cohesion of field organizations, the better the
performance.
Hypothesis 2: The better the group communication of field organization, the better the
performance.
8. Research Method
8.1 Items of organization evaluation
According to previous study (Lee and other, 1997), the effectiveness of a group can be
measured by group cohesion and group performance. I added group communication (See Table5).
Table 5. Items for group evaluation
Group Cohesion (Ci) Group Communication (Ii) Group Performance (Pi)
Task structure,
Performance norms,
Workforce composition
Proximity,
Human-Interaction fairness, Integrity,
Consultation and communication level
Cost management level,
Construction management level
Quality management level
8.2 Definition of indicators
8.2.1 Group cohesion

- 12 -
The components of organizational cohesion in previous research (Lee & others, 1997),
are qualitative and ambiguous. I adapted and enhanced them to fit the present situation of LH.
First, organizational cohesion is divided into three categories: task structure, performance norms,
and workforce composition. Eight measurement of indicators were selected. Task structure
consisted of number of participating companies, the speed at which processes were completed,
and percentage of full-time employees. Performance norms consisted of contractor’s ranking, the
contractors’ technical staff retention, and defect repair rate. Workforce composition consisted of
the persistence rate (1-turnover among all employees on a construction field) and technology
workforce ratio.
Generally, a large number of groups are effective for large and complex constructions
(ex, nuclear power plants, etc.), and a small number of groups are effective for simple and
repetitive constructions. The latter is advantageous to LH apartments, because LH builds a fairly
standardized apartment building. Nevertheless, the number of companies participating in one
apartment project is increasing in Korea. Contracts are also becoming more diverse. Laws have
been changed to require LH to directly purchase materials and to put them into the field in order
to protect SMEs (Small and Medium Enterprises) in recent year. As a result, a large number of
material companies have become involved. Now that there are too many companies involved in
one field (See Figure2), coordination problems are getting worse.
Another obstacle to the task structure is process promotion. If the process is delayed, it
can not keep up with the precedence and follow-up sequence, causing much confusion in the task.
If too many participants are involved in a limited construction period, the task structure becomes
more difficult. Therefore, the number of participating companies was given according to the
degree of intensiveness and the degree of process completion was evaluated at the point at which

- 13 -
Figure 2. General organizations of LH construction field
80 percent of construction time3 had been completed. Also, it is meaningful to review the
structure of the main contractor, which is at the core of construction work. In the case of the CD
field, the staffing of the field personnel was temporary, and frequent turnover during the
construction caused difficulties due to vacancies in the work structure, especially for essential
positions such as safety staff. Of course, in order for an organization to be able to perform its
functions, there must be people to perform it. In reality, there may be frequent manpower
replacement situations in the field, so, no matter how good organizational structure it is, it cannot
perform its normal functions.
3 At this time most processes should have been completed (up to installing furniture)

- 14 -
Second is the performance norms. The relationship between group cohesion and
productivity depends on performance norms4. Although the quality standards are presented in the
specifications, the performance norms tend to depend on qualitative aspects such as conversation
methods and attitudes of employees. Therefore, performance norms were determined by
questionnaire according to the degree of its clarity and uncertainty in the previous research (Lee
& others, 1997). However, the method of this study is a quantitative measurement, so, the
following three indicators were set as the measurement. First, if the level of contractors is called
‘large corporations’ in Korea, the selection process of employees is strict, and then excellent
talent joins, and they show high group norms in a stable work environment and high standard of
performance. This can be seen as a typical case of the company L of the SD field. Each year, the
government announces the contractor’s ranking of construction companies with the evaluation
value of construction capability. This also includes the total number of technical personnel of
construction companies. The number of technical personnel can be used to assess the status of
technical departments and systematic manpower management. In addition, the speed of work that
occupies an important part of the construction project needs to be seen. In the case of the defect
repair rate measurement, it is necessary to systematically move the entire groups in a given time
(within 1 month in most cases) to obtain a high maintenance rate (97% or more). It can be
evaluated objectively by LH headquarters5.
Third, it is constituent of human resources. Work experience was indexed in the
previous study (Lee & others, 1997), but the higher the skill level of the members, the easier it
4 It can be defined as the standard of action for how hard you work and how much you need to adjust the level of
output. It is a standard action that must be kept in order to achieve the goal.
5 In Korea, according to the relevant laws, people who will move into the apartment unit will visit the field in
advance 30 days before moving in. Through this visit, they investigate their house unit, and point out the contents.
LH Headquarters will check the repair rate after one month later and inform field of the score.

- 15 -
was to deal with the problem. As the field organization is a temporary organization, short-term
technical cohesion is more effective than trust formation through mutual continuous work.
Technological abilities that can handle the difficulties in the field will strengthen the learning
ability of each other and the capacity of human resources will be influenced by the skillfulness of
the leader groups.
8.2.2 Group communication
Group communication need to be examined at the horizontal and vertical levels. In
addition, the promptness in communication and decision making is also an important factor. If
the task is easy, mutual division of labor will be also simple, but if it is complicated, mutual
cooperation needs to be activated and someone need to be in charge of presenting problem and
solving by discussing with diverse groups. To measure the level of group communication,
proximity of the field should be considered. If there is a LH supervisory office and a contractor
office in the same field, a positive effect can be expected in communication because they can
have lots of opportunities to contact immediately, but if the LH supervisor does not reside in the
field, it would be hard to communicate frequently. In the case of GJ field, there were few
opportunities for face-to-face meeting since it is 200km away from LH’s branch office.
Secondly, the ‘Integrity Assessment’ conducted by the ‘Auditing Department’ of LH’s
headquarters can be used as a measurement tool. It yearly evaluates fields of LH and its three out
of six questions are about the attitude of the supervisor, transparency and fairness of the work
process. Indeed, the authoritarian attitude of supervisors in the field can cause the antagonism of
participating companies even if there is no corruption, thus significantly lowering the integrity
score.

- 16 -
Lastly, the contract execution rate is another important factor because securing
appropriate profit by changing contract is very important for the contractors. It is not easy to
change the cost or period of the contract because the supervisor cannot change the contract
simply by the contractors’ request. The supervisors are required to be conservative because they
need to go through the screening of branch office and the LH’s headquarters. It accompanies a
lot of paper works to get an approval, so there must be constant formal or informal meetings and
consultation between the staff to meet the requirements and to be approved. As the decision
process is complex and there are various constraints, the time span for changing the contract can
be an indicator to measure the level of cooperation. If the contract is changed in the first half of
the process, the coordination at the field can be considered to be good. On the other hand, if most
of the contract changes are made near the completion date, there must be some delay in the
decision making. In this case, the contract changing would have caused the friction between the
groups, and lead to difficulties in inter-relationship.
8.2.3 Group performance
The economic feasibility of group performance was measured by the total cost of
construction management cost to the total construction cost. The cost of construction
management is based on the cost per person for a year of LH’s supervising staff. It was
calculated as 0.5 person in case of working simultaneously in other fields, and 0.3 person in case
of working in the regional branches at the same time for the estimation of the number of
supervisors. In the case of the supervision service fields, LH staff’s average annual salary was
added to the annual supervision service cost.
The group performance of construction management was based on the evaluation score

- 17 -
of ‘Construction Management Department’ of LH headquarters. Objectivity is secured as the
cases of integrity and defect repair rate.
To evaluate the quality of group performance, defect rate is used. The rate of defects is
the total number of defects after completion when the residents inspected before they move each
units. However, since the floor areas of the units are different, it is not possible to use the defects
occurrence number. Therefore, the total number of defects was divided by the total floor areas of
the apartment to compare.

- 18 -
8.3 Composition of indicators
The measurement items and indicators are as follows (See table 6).
Table 6. Composition of indicators
Item Measurement
index Indicators Contents
Cohesion
Task structure
Number of
participating
companies
The smaller the number of participants in a certain
period, the more clearly the task structure.
Timeliness of
process completion
The better the process promotion, the more clearly
the division of labor
Percentage of full-
time staff
Having a large percentage of full-time employees
makes it easier to divide and integrate tasks.
Performance
norms
Contractor ranking The higher the competence of the company, the
better the group norms
Number of
contractor’s technical
staff
A high standard of performance for quality by
securing technical personnel
Defect repair rate The higher the defect repair rate, the higher the
norms for quality
Workforce
Composition
Persistence ratio
(1-employee
turnover)
The fewer changes in field technicians and
supervisors, the better the workforce composition.
Percentage of staff
who are highest
grade engineers6
The high technical ability of the field workforce
makes construction easier and provides mutual
learning opportunities
Communication
Contactability Proximity Physical proximity helps to form positive
relationships by increasing contact opportunities
Fairness,
integrity Integrity score
Improving communication, transparency, fairness,
and openness can improve organizational
relationships
Negotiability,
Cooperation
Communication
Degree of contract
changes
Communication facilitates the proper timing of
contract changes
Performance
Cost
management Supervising cost
The cost of the construction management of the
owner and supervision service cost
Construction
management
Construction
management score Construction management level
Quality
management Defect rate Quality management level
6 In Korea, under the Construction technology Promotion Act, construction engineers are managed in four grades;
Beginner, Intermediate, Advanced, and Highest

- 19 -
8.4 Evaluation of each indicator
For each of the 14 evaluation criteria, I obtained the distribution of values. Using the
distribution, I defined the rating five level, poor to excellent. For the standard setting, by
analyzing the relative distribution, I obtained data from LH’s headquarters. The criteria for the
evaluation of each indicator are as follows (See Table 7).
Table 7. Rating table7
No Indicators
Rating Level
1
(Poor)
2
(Insufficient)
3
(Moderate)
4
(Good)
5
(Excellent)
1 Number of participating
companies 2.5 or more 2.49 ~ 2 1.99 ~ 1.5 1.19 ~ 1 Less than 1
2 Timeliness of process
completion Less than 68% 68.1% ~ 72% 72.1% ~ 76% 76.1% ~ 80% More than 80%
3 Percentage of full-time staff Less than 60% 61% ~ 70% 71% ~ 80% 81% ~ 90% More than 90%
4 Contractor ranking Below 201th 200th ~ 101th 100th ~ 51th 50th ~ 11th 10th~ 1th
5 Number of contractor’s
technical staff Less than 50 50 ~ 99 100 ~ 499 500 ~ 999 More than 1000
6 Defect repair rate Less than 92% 92% ~ 94.4% 94.5% ~ 95.4% 95.5% ~ 96.4% 96.5% ~ 100%
7 Persistence ratio
(1-employee turnover) Less than 50% 51% ~ 60% 61% ~ 70% 71% ~ 80% 81% ~ 100%
8 Percentage of staff who
are highest grade engineers Less than 20% 21% ~ 30% 31% ~ 40% 41% ~ 50% More than 50%
9 Proximity More than
30Km 5Km ~ 30km
Within 5km but Impossible on foot
Accessible on foot Together inside
of field
10 Integrity score Less than 9.05 9.05 ~ 9.324 9.325 ~ 9.574 9.575 ~ 9.824 9.825 ~ 10
11 Degree of contract changes Less than 20% 21% ~ 30% 31% ~ 40% 41% ~ 50% More than 50%
12 Supervising cost More than 4% 3.1% ~ 4% 2.1% ~ 3% 1.1% ~ 2% Within 1%
13 Construction
management score Less than 86.2 86.2 ~ 88.1 88.2 ~ 91.9 91 ~ 93.4 93.5 ~ 100
14 Defect rate Less than0.1325 0.121 ~ 0.1325 0.09126 ~ 0.12 0.0776 ~ 0.09125 0.0775 or less
7 Refer to Table A-1 of Appendix (p32-35) basis for the criteria for setting the interval of this table, In particular,
regarding the range of 5 grades.

- 20 -
8.5 Grading
For each three fields, the results of measuring the grade according to the indicators are as
follows. (See Table 8)
Table 8. Grading
No Indicators Measurement
Target field
JD GJ CD Bench
Mark
1 Number of participating
companies
Total number of participating
contractors / Total construction month 4 2 2 5
2 Timeliness of process
completion Cost payment rate of time pass at 80% 1 5 2 5
3 Percentage of full-time
staff
Number of irregular employees / number
of full-time employees 5 4 1 5
4 Contractor ranking Construction contractor ranking 5 2 1 5
5 Number of contractor’s
technical staff Number of technicians of contractor 5 2 1 5
6 Defect repair rate Repair defect rate percentile 2 5 5 5
7 Persistence ratio
(1-employee turnover)
Number of staff remained the same
during the project / Total number of staff 4 4 2 5
8 Percentage of staff who
are highest grade engineers
Number of highest grade technical staff /
Total number of staff 1 3 5 5
9 Proximity Distance between field groups (access
method and time) 4 1 2 5
10 Integrity score Integrity score percentile 2 4 4 5
11 Degree of contract changes
Number of contract changes at 80% of
construction period/ Total number of
change
1 4 1 5
12 Supervising cost Supervision cost / Total cost 4 1 1 5
13 Construction
management score
Construction Management evaluation
score 1 3 1 5
14 Defect rate Total number of defect occurrences /
total floor area of apartment 3 5 2 5

- 21 -
8.6 Applying weights
The weights were determined by the AHP8 (Analytic Hierarchy Process) method
according to the category of the indicator.
Table 9. Weights
No Indicators weights λ max9 C.I.
10 λ max C.I.
1 Number of participating companies 0.33**
3.05400 0.02700
3.03267 0.01633
2 Timeliness of process completion 0.07
3 Percentage of full-time staff 0.26*
4 Contractor ranking 0.06
3.09567 0.04783 5 Number of contractor’s technical staff 0.001
6 Defect repair rate 0.02
7 Persistence ratio (1-employee turnover) 0.23*
- -
8 Percentage of staff who are highest grade
Engineers 0.04
9 Proximity 0.49**
3.00899 0.00449 - - 10 Integrity score 0.07
11 Degree of contract changes 0.44**
12 Supervising cost 0.06
3.05433 0.02716 - - 13 Construction management score 0.16*
14 Defect rate 0.78***
*** Weights greater than 0.5, ** Weights greater than 0.3 and less than 0.5, * Weights greater than 0.1 and less than 0.3
8 AHP is a structured multi-attitude decision method (Saman & others, 2013).The main advantage of AHP is its
capability to check and reduce the inconsistency of expert judgment. This is a pairwise comparison of the indicators
by a table of 9 intervals. Refer to Table A-2 of Appendix (p36) .
9 λ max is maximum eigenvalue of the comparison matrix
10 C.I (Consistency Index) = (λ max – n)/(n-1), as an indicator for verifying the logical contradiction in response, if
it is less than 0.1, it means that it is compared with consistency.
- 22 -
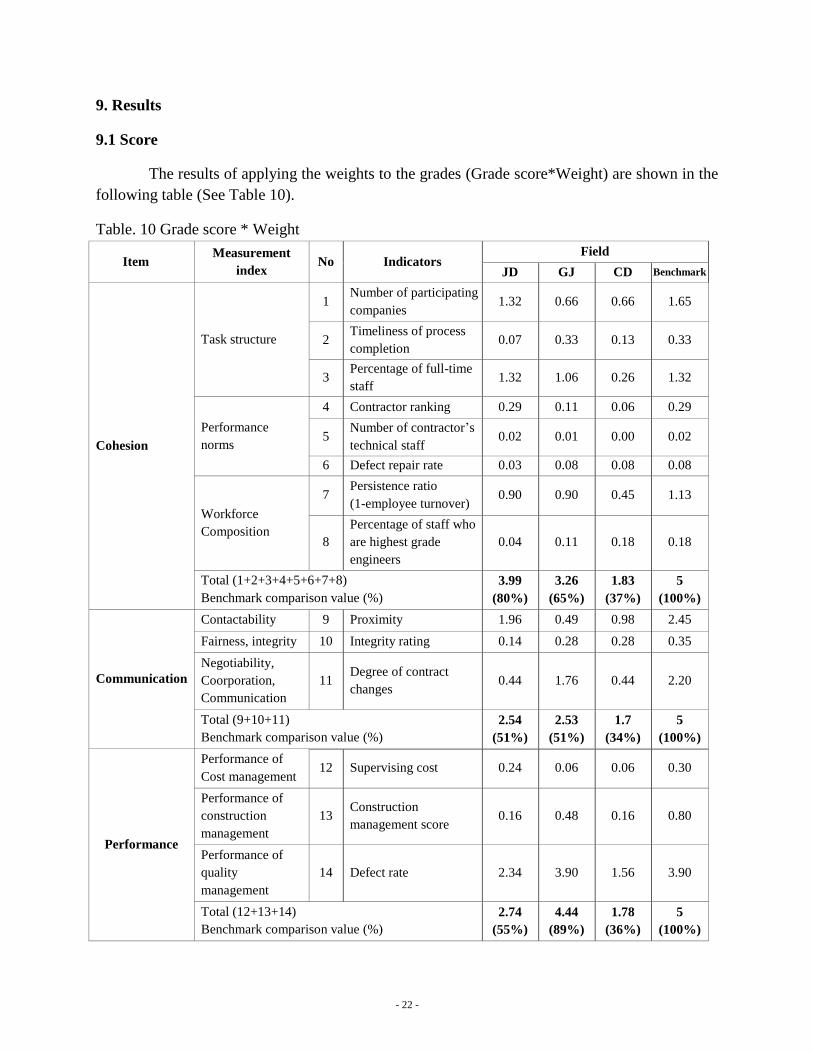
9. Results
9.1 Score
The results of applying the weights to the grades (Grade score*Weight) are shown in the
following table (See Table 10).
Table. 10 Grade score * Weight
Item Measurement
index No Indicators
Field
JD GJ CD Benchmark
Cohesion
Task structure
1 Number of participating
companies 1.32 0.66 0.66 1.65
2 Timeliness of process
completion 0.07 0.33 0.13 0.33
3 Percentage of full-time
staff 1.32 1.06 0.26 1.32
Performance
norms
4 Contractor ranking 0.29 0.11 0.06 0.29
5 Number of contractor’s
technical staff 0.02 0.01 0.00 0.02
6 Defect repair rate 0.03 0.08 0.08 0.08
Workforce
Composition
7 Persistence ratio
(1-employee turnover) 0.90 0.90 0.45 1.13
8
Percentage of staff who
are highest grade
engineers
0.04 0.11 0.18 0.18
Total (1+2+3+4+5+6+7+8)
Benchmark comparison value (%)
3.99
(80%)
3.26
(65%)
1.83
(37%)
5
(100%)
Communication
Contactability 9 Proximity 1.96 0.49 0.98 2.45
Fairness, integrity 10 Integrity rating 0.14 0.28 0.28 0.35
Negotiability,
Coorporation,
Communication
11 Degree of contract
changes 0.44 1.76 0.44 2.20
Total (9+10+11)
Benchmark comparison value (%)
2.54
(51%)
2.53
(51%)
1.7
(34%)
5
(100%)
Performance
Performance of
Cost management 12 Supervising cost 0.24 0.06 0.06 0.30
Performance of
construction
management
13 Construction
management score 0.16 0.48 0.16 0.80
Performance of
quality
management
14 Defect rate 2.34 3.90 1.56 3.90
Total (12+13+14)
Benchmark comparison value (%)
2.74
(55%)
4.44
(89%)
1.78
(36%)
5
(100%)

- 23 -
9.2 Group cohesion, group communication, and performance comparison
The group cohesion was highest in JD field with 3.99 points out of 5 points, followed by
GJ (3.26) and CD (1.83). In the group communication, there were 2.54 points in JD, 2.53 in GJ
and 1.7 in CD. The performance results were in descending order: 4.44 in GJ, 2.74 in JD, and
1.78 in CD. The leaderboards are as follows (See Table11).
Table 11. Field groups score (vs Bench marking of all indicators earn 5 points)
Item JD GJ CD
Group Cohesion 0.80 0.65 0.37
Group Communication 0.51(.508) 0.51(.506) 0.34
Performance 0.55 0.89 0.36
The performance result was the highest in GJ. In the case of JD, cohesion level was the
highest among the three sites, but communication was somewhat low. In the case of CD, where
both organizational cohesion and communication scores were low, group cohesion and
communication seemed to influence performance. These results suggest that if group cohesion
and communication are both low, performance will be also low.
However, if either of group cohesion and communication is good, the field can show
better performance. Even though JD has strong organizational cohesion, it was not linked to
performance, and GJ has done well despite the fact that they have kept the two factors at a
medium level. The cause of these cases should be analyzed further. In case of JD, the sum of
organizational cohesion and communication was higher than other fields, but the performance
was poor compared to GJ. The biggest feature of JD is that the contractor L is a large company in
Korea ranked 8th in construction industry. However, the communication score is similar to GJ.
This means that organizational structure and communication are separate factors. Especially, in

- 24 -
the LH field, the larger the company, the more time is delayed due to the mutual fixed document
system and their own decision making system. Such factors can be seen from the fact that the
contract change is overdue and that there is a mutual distrust between them. JD’s integrity score
is lower.
In addition, the external environment that influenced these achievements is the
construction conditions. Those were considerably more difficult than other fields. JD had an
excessive slope forming six floors of underground parking lots.
From the viewpoint of construction conditions, company D of GJ was a relatively small
and medium-sized company, but there was a good construction site for building an apartment
complex. The third company S of CD was lacking in competence as a local small company and
the construction conditions were too difficult due to the insufficient construction time.
Construction conditions are given by project, site, and environmental conditions with each
company. This difficulty can be overcome by organizational cohesion and communication.
9.3 Group effectiveness value model
Cost performance, management performance and quality performance were applied to
evaluate the value of collective effectiveness. These three factors were used as relative
comparison numbers for the score of benchmark (all 5 points). The cost value of the group (the
first equation, Vi(cost)) is derived from the cohesion (Ci), inter-organizational communication
interaction (Ii), and the result of cost performance(Pi(cost)). On the other hand, group effectiveness
value (Vi(effect)) are evaluated as collective of Ci and Ii with the performance of cost, construction
and quality management (Pi(effect)).

- 25 -
Vi(cost) = (Ci + Ii)/2 * Pi(cost) …….. (1)
Vi(effect) = (Ci + Ii)/2 *Pi(effect) …….. (2)
Here,
Vi(cost) = Group cost value
Vi(effect) = Group effectiveness value
Ci = Group cohesion
Ii = Group communication
Pi = Group performance
9.4 Result of model application
The results of model application are as follows (See Table 11).
Table 12. Evaluation results
Division JD GJ CD
Group cost value …(1) 0.81 0.18 0.11
Group effectiveness value …(2) 0.60 0.88 0.16
First, JD is more than 4 times cost-effective than GJ, and 8 times more cost-effective
than CD in the group cost value. Compared to this, the results of GJ and CD are very poor, which
is caused by the implementation of supervisory service that replaces the shortage of LH’s
supervisory personnel. In other words, the service cost of over 1 billion KRW($901,063) paid by
the supervisor is usually 4 to 8 times more expensive than the self-supervised field. Currently,
there are 32 (19%) supervision service fields among 168 LH fields11
. As problem of LH’s lack of
manpower has increased, the number of on-field supervision has decreased significantly. Since
the supervisory service field is determined by the headquarters prior to the formation of the field
11
Source from September 2017 LH Construction Status

- 26 -
organization, the increase expenses due to the burden of the supervisory service is inappropriate
as an evaluation factor.
The cost value ranking changes when construction and quality management performance
is taken into account. Considering the results of valuation based on quality, GJ is more than 1.5
times as good as JD.
Now the remaining question is that which of the two indicators is valid as a performance.
The answer can be found in the common goal of the field organization. The common goal of LH
field is to produce good quality apartments within a given period. The given period means
construction process management and good quality means quality management.
These criteria are very important in the evaluation of public organizations such as LH.
Cost reductions by low manpower deployment resulting from existing cost-performance-oriented
field operations can adversely affect quality and increase avoiding supervisory work with heavy
workloads. Therefore, it is more desirable to achieve optimal efficiency by quality orientation
and organizational harmonization. In LH field, it should be evaluated as improvement direction
of field organization for the future.
9.5 Discussion: ‘Contingency Theory’ as a useful guide for LH
A large academic literature fits with my finding about the need to consider a broader set
of factors to achieve effectiveness in future construction fields. LH has established a very
efficient and strong field operating system since 1962 but this is now out of date. ‘Table 12’
shows four different perspectives on organizations. LH currently is in the first dimension, which

- 27 -
is closed-rational organization theory. The view of field organization in first dimension is
mechanical and closed. The theory is based on Taylor’s scientific methodology, Weber's
bureaucratic theory, and Fayol’s management theory.
Table 13. Classification of major organizational theory and representative organizational theorist
Organizational
Perspective
Perspectives on humans
Rational Social
Closed
1900-1930
Taylor (1991)
Weber (1947)
Feyol (1949)
1930-1960
Mayo (1945)
Seiznick (1948)
McGregor (1960)
First
Dimension
Second
Dimension
Third
Dimension
Fourth
Dimension
Open
1960-1970
Chandler (1962)
Lawrence & Lorsch (1967)
Thompson (1967)
1970~
March (1976)
Weick (1997)
Senge (1990)
(Source: W.R. Scott, Organizations: Rational, Natural, and Open Systems, p128, revised)
According to Chandler’s theory of organizational growth and organizational structure,
an organization initially started with a limited production and a centralized structure. In the case
of LH, since the organization has a long history, it has been segmented, highly structured, and
rigid. However, because the field organization is temporary and is different from the LH’s
organizational structure from the beginning, it has a disorganized organization tendency, so a
suitable model should be sought. According to Lawrence and Lorsch’s theory, LH should follow
the proposition that the subordinate units should have a structure that adapts to the environment
if each subordinate unit’s organizational environment is different. LH’s field organization so far
has often been understood as a miniature of organization of the LH headquarters or local
branches. However, the environment of construction industry is deteriorating for many reasons.

- 28 -
In particular, the fourth dimensional theories represent the final direction that the field
organization of LH should aim for. Fourth dimensional theories emphasize the importance of
activeness, mutual cooperation, openness, and democratic inquiry to create knowledge for the
survival of an organization as an open-social organization theory. Currently, the reality
surrounding LH is in the open-rational system, which is a third-upper limit dimension, but LH’s
field organization management is based on closed-rational view that does not yet reach the upper
limit of first. Such management reduces site-to-site flexibility in cases where rules and
regulations can not keep up with current contingencies and environmental changes. The rigid
procedures of LH’s supervisory organization and the preference of rule of dehumanization
approach frustrate the contractors.
According to ‘Contingency Theory’, situations and organizational characteristics can
respond positively to a variety of situations provided that conformity determines organizational
effectiveness. ‘Contingency Theory’ focuses on organizational effectiveness as an objective
result, suggesting that each organization facing various situations should have certain
characteristics. This organizational theory again reminds us that when we measure organizational
effectiveness values, good results could have been achieved if JD field had been more committed
to communication and CD field had been more committed to cohesion.
The variables in this theory depend on the suitability of the situation and organization
characteristics. When an organization places importance on achieving its goals, productivity,
profit, and sales are the organizational effectiveness variables. When an organization places
importance on process, job satisfaction, organizational commitment, quality of work, and
turnover rate are important variables. It is time for LH to focus on the later one that regards field
organization as an open system and focus on the development of technology, social peace,

- 29 -
environmental and legal changes, and the operation of the field organization to accommodate the
uncertainties.
10. Research finding, conclusion, and suggestion
Based on the results of comparative analysis of the three construction fields, the
following findings and conclusions can be drawn.
First, the main factors which determine successful or unsuccessful field are
organizational cohesion and inter-organizational communication. The main finding of this study
is that mutual communication affects the quality more if the field conditions are difficult.
Second, if field groups fail to cohere and communicate, it is likely to lead to low
performance in all aspects of performance; cost management, construction management, and
quality management. It was unquestionably revealed in the poor results of CD field.
By combining all these results, I recommend that LH field organizations consider more
organization effectiveness values and maintain harmony, coordination, diversity and balance
with other field organizations. I suggest that LH should play a leading role in terms of
organization management for the future.
11. Limitations of Research
The purpose of this study is to establish indicators and models of group effectiveness
value and apply it to the field. However, the some data, for example, construction management

- 30 -
evaluation, defect repair rate, and integrity evaluation, used to measure in the research are
difficult to obtain. So those are limited to the LH field. The concept of generalization used in this
Capstone is only applicable to other LH construction fields, not those outside LH.

- 31 -
References
Bolman, Lee G. and Terrence E. Deal. (2013). Reframing Organizations: Artistry, Choice, &
Leadership. Jossey-Bass press
Choi&other. (2008). An Empirical Study on the Effect of Interorganizational Communication on
Organizational Performance. Korean Government Scholarship, Volume 42, 229–252.
Cho, Yoon Hyung. (2014). The Effect of Interactional Justice on Innovative Behavior-The
Moderate Role of Perceived Organizational Vision
Complete Enumeration Results of the 2016 Population and Housing Census.
http://kostat.go.kr/portal/eng/pressReleases
Eun, jonghwan. (2013). Public and Private Organizations Comparative Analysis of Job
Satisfaction- Focused on the effect of shortening the legal working hours.
Lee, Jae-seob and Lee, hyun-Soo (1997). A Method for Evaluating the Optimum Level of
Construction Field Orgarization.
Lee, Siwook., Woo, Sungkwon., and Kim, Okki. (2017). A Study on Evaluation of Construction
Project Owner’s Organizational Competency, Korean journal of construction
engineering and management.
Saman Aminbakhsh, Murat Gunduz, Rifat Sonmez. (2013). Safety risk assessment using analytic
hierarchy process(AHP) during planning and budgeting of construction projects, Journal
of Safety Research
Yu, Il-Han., Kim, Kyung-Rai., Jung, Youngsoo., Chin, Sangyoon., and Kim, Yea-Sang. (2004).
A Framework of the Comparable Performance Measurement in the Construction
Industry. Korean Institute of Construction Engineers, Vol 5 5th(October)

- 32 -
Appendix
Table A-1. Rating basis
No Basis for setting the grade interval
1
1) Number of contractors
2) Measurement: Total participating companies÷construction months
: The reason for dividing by the construction period is that as the number of companies in a certain
construction period is getting bigger, there is a lot of coordination problems and inefficiency.
3) Benchmarking based on estimates of the minimum eligible participants and average construction period:
42companies/24months = 1.75
4) There are 5 general construction companies, 16 sub-cons, 17material suppler, 5 service contractors:
5+16+17+4=42
5) Source and data from ‘Official Completion Document’ of each field.
2
1) Timeliness of process completion
2) Measurement: Percentage of construction cost paid at 80% of time pass.
3) The process of 80% of the time pass of construction is directly related to completion.
4) Base rate: Received 80% of construction cost at 80% time pass means excellent level because the
construction cost is postpaid. Monthly payment of construction costs is general in LH.
5) The grade range was set by 4% gap from 80%, because 100%÷24month = 4.1%. As a usual 4% means one
month of fast or late.
6) Source and data from ‘Official Completion Document’ of each field.
3
1) Percentage of full-time staff
2) Measurement: Number of full-time staff ÷Total staff
3) Absolute value From 100% to 60% (10% gap)
4) Source and data from ‘Official Completion Document’ of each field.
4
1) Contractor ranking
2) Measurement: Ranking, Relative value according to distribution
3) Sample number : 300
4) It has important meaning within 10th
. It sharply decreases after 10th
.
5) Source and data from Government announcement of year 2016.

- 33 -
5
1) Number of technical staff of the contractor
2) Measurement: Ranking, Relative value according to distribution
3) Sample number : 300
4) It seems similar to the company rankings. The setting of the interval is a sharply decreasing from 10th.
3) Source and data from Government announcement of year 2016.
6
1) Defect repair rate
2) Measurement: Distribution analysis, Relative value according to distribution
3) Sample number : 100
4) Based on the distribution of 100 scores of LH fields in 2016,
Top 10% : more than 96.5%
10% ~ 20% : 95.5% ~ 96.5%
20% ~ 30% : 94.5% ~ 95.5%
30% ~ 50% : 92% ~ 94.5%
Below 50% : Less than 92%
4) Source of 100 results of field from ‘Rental Property Management Department’ of head office
7
1) Persistence ratio (1-staff turnover)
2) Measurement: The number of field staff replaced or changed ÷ Total number of field staff
3) Absolute value From 100% to 50%
4) Source and data from ‘Official Completion Document’ of each field.

- 34 -
8
1) % of staff who are highest grade engineers
2) Measurement: The number of field staff who has highest grade÷Total number of field staff
2) Source and data from ‘Official Completion Document’ of each field.
9 1) Proximity: Physical proximity supervisor’s office and contractors’ office
2) Measurement: Whether on-site, on foot, by car, or on business trip (over 30km).
10
1) Integrity Score
2) Measurement: Distribution analysis, Relative value according to distribution
3) Sample number : 100
4) Based on the distribution of 157 scores of 2012~2016
5) Distribution analysis
Top 10% : more than 9.825
10% ~30% : 9.575 ~ 9.825
30% ~50% : 9.35 ~ 9.575
50% ~70% : 9.05 ~ 9.35
Below 70% : Less than 9.05
6) Source from Headquarters Audit Department’s Integrity Survey Report of 2012, 2015 and 2016.
11
1) Degree of Contract changes (cost overruns)
2) Measurement: The number of contract changes completed at 80% of construction time÷The total
number of contract changes.
3) Absolute value From 0% to 50%
4) Normally more than 1 change at 80% time pass
5) Source and data from ‘Official Completion Document’ of each field.
12
1) Supervising cost ratio
2) Measurement: Supervision cost÷Total construction cost.
2) Usually more than 1 billion KRW need to 2 years
3) Source and data from ‘Official Completion Document’ of each field.

- 35 -
13
1) Construction management evaluation score
2) Measurement: Distribution analysis, Relative value according to distribution
3) Sample number : 86
3) Based on the distribution of 86 scores of 2016,
Top 10% : more than 93.5
10% ~ 30% : 91 ~ 93.5
30% ~ 50% : 88.2 ~ 93.5
50% ~ 70% : 86.2 ~ 88.2
Below 70% : Less than 86.2
4) Source and data from Evaluation report of head office construction management department
14
1) Defect rate = Total number of defects÷Total floor area of apartment(M2)
2) Measurement: Distribution analysis, Relative value according to distribution
3) Sample number : 40
4) Based on the distribution of 40 fields’ total number of defects from Assessment of rental property
management department of head office
Top 10% : Less than 0.0775
10% ~ 20% : 0.0775 ~ 0.09125
20% ~ 50% : 0.09125 ~ 0.12
50% ~ 70% : 0.12% ~ 0.1325
Below 70% : Less than 0.1325
5) Data of floor area from Official completion documents and data of total number of the three field from
preliminary inspection of customers.

- 36 -
Table A-2. AHP input data
Indicators Left item is more important(<-), Relative importance (0 = equal), Right item is more important(->) Indicators
Number of participating
companies 9 8 7 Ⅴ 5 4 3 2 1 0 1 2 3 4 5 6 7 8 9 Process propulsion rate
Number of participating
companies 9 8 7 6 5 4 3 2 Ⅴ 0 1 2 3 4 5 6 7 8 9
Percentage of full-time
employees
Process propulsion rate 9 8 7 6 5 4 Ⅴ 2 1 0 1 2 3 4 5 6 7 8 9 Percentage of full-time
employees
Contractor ranking 9 Ⅴ 7 6 5 4 3 2 1 0 1 2 3 4 5 6 7 8 9 Contractor technical staff
retention
Contractor ranking 9 8 7 6 Ⅴ 4 3 2 1 0 1 2 3 4 5 6 7 8 9 Defect repair rate
Contractor technical staff
retention 9 8 7 6 5 4 3 2 1 0 1 2 3 Ⅴ 5 6 7 8 9 Defect repair rate
Persistence ratio of
employees 9 8 7 Ⅴ 5 4 3 2 1 0 1 2 3 4 5 6 7 8 9
Technology workforce
Ratio
Task structure 9 8 Ⅴ 6 5 4 3 2 1 0 1 2 3 4 5 6 7 8 9 Performance norm
Task structure 9 8 7 6 5 4 Ⅴ 2 1 0 1 2 3 4 5 6 7 8 9 Workforce
composition
Performance norms 9 8 7 6 5 4 3 2 1 0 1 2 3 Ⅴ 5 6 7 8 9 Workforce
composition
Proximity 9 Ⅴ 7 6 5 4 3 2 1 0 1 2 3 4 5 6 7 8 9 Integrity rating
Proximity 9 8 7 6 5 4 3 2 1 0 Ⅴ 2 3 4 5 6 7 8 9 Contract change promotion
rate
Integrity rating 9 8 7 6 5 4 3 2 1 0 1 2 3 4 5 Ⅴ 7 8 9 Contract change promotion
rate
Supervising cost 9 8 7 6 5 4 3 2 1 0 1 2 Ⅴ 4 5 6 7 8 9 Construction management
score
Supervising cost 9 8 7 6 5 4 3 2 1 0 1 2 3 4 5 6 7 8 Ⅴ Defect rate
Construction management
score 9 8 7 6 5 4 3 2 1 0 1 2 3 4 5 Ⅴ 7 8 9 Defect rate
Table A-3. Application data
Indicators Three Fields data Rating Level
JD GJ CD Poor Insufficient Moderate Good Excellent
Number of participating companies 1.08 2.13 2.31 GJ/CD JD
Process propulsion rate 65 82 71 JD CD GJ
Percentage of full-time employees 100 80 33 CD GJ JD
Contractor ranking 8 112 256 CD GJ JD
Contractor technical staff retention 1896 93 25 CD GJ JD
Defect repair rate 92.13 96.95 96.84 JD GJ
Persistence ratio of employees 74 74 55 CD JD/GJ
Technology workforce Ratio 15 37 55 JD GJ CD
Proximity 10 120 300 GJ CD JD
Integrity rating 9.19 9.63 9.71 JD CD
Contract change promotion rate 17% 43% 0% JD/CD GJ
Supervising cost 1.78% 11.10% 9.29% GJ/CD JD
Construction management score 85.9 88.26 80.52 JD/CD GJ
Defect rate 0.098 0.074 0.120 CD JD GJ

- 37 -
Table A-4. Basic data of three fields
Item JD GJ CD
Block
A4BL B5BL
City Seongnam Jacheon Chungju
Type General sale apartment National rental housing Happy house
Total floor area(㎡) 99,158 14,783 13,844
Number of Buildings 10 2 3
Total units 636 268 296
Floors 16-18 15 7-8
Construction period May 2009~Jun 2012 Feb 2014~Sep 2015 Jun 2015~Nov 2016
Total construction period (days) 1,125 588 515
Total construction period (months) 37 19 17
Final cost of construction 91,105 11,297 14,987
Bid dropping (%) 78.46 70.03 80.51
CM cost (Supervision service cost) 0 996 1167
Supervision cost (LH) 1,623 258 226
Total cost of supervision 1,623 1,254 1,393
Total cost of supervision/Final cost of construction 1.78% 11.10% 9.29%
Total Contractor Labor Cost 5,680 963.93 844.26
Total Contractor Labor Cost/Final cost of construction 6.23% 8.53% 5.63%
Supplied materials cost
2,838 2,643
Number of field workforce of construction company 22 10 10
Number of field workforce of CM company 0 9 7
Number of field workforce of supervision company 5.5 1.7 1.7
Number of Total management personnel 27.5 20.7 18.7
Number of Total supervisory personnel 5.5 10.7 8.7
Initial cost of construction 71,714 11,432 12,031
Number of Alteration of contract 18 7 2
Extension of construction period (Day) 48 0 9
Total input of field workforce 157,946 20304 21,937
Total input of field equipment 6,807 105 4,710
Number of major contractors 2 5 5
Number of Sub-con 35 16 16
Number of Supplied materials 0 17 14
Number of waste companies 3 3 4
Total Participation Contractor 40 41 39
Total number of defects 5631 1076 1,549
Total Apartment Floor Area 57,679 14,611 12,897
Total number of defects/Total Apartment Floor Area 0.098 0.074 0.120
Defect repair rate score 92.13 96.95 96.84
Ranking of contracts 8 112 256
Estimated construction capacity 5,310 194 80
Total number of technical staff 1896 93 25
Integrity rating score 9.19 9.63 9.71
Construction management score 85.9 88.26 80.52