Embed Size (px)
Citation preview

A COMPARATIVE STUDY BETWEEN THE EARLY STAGES HYDRATION OF A
HIGH STRENGTH AND SULPHATE RESISTANT PORTLAND CEMENT AND THE
TYPE II F PORTLAND CEMENT THROUGH NON CONVENTIONAL
DIFFERENTIAL THERMAL ANALYSIS AND THERMOGRAVIMETRY.
A.Neves Junior 1*, M. M. Viana2, J. Dweck2, R. D. T. Filho3,
*Av Fernando Corrêa da Costa n°2367 – Bairro Boa Esperança. Cuiabá – MT-78060-900, [email protected]
1College of Architecture, Engineering and Technology – FAET – Federal University of Mato Grosso - Cuiabá, Brazil
2School of Chemistry - Federal University of Rio de Janeiro, Brazil
3Civil Engineering Program – COPPE – Federal University of Rio de Janeiro, Brazil
ABSTRACT
This work presents a study, which compares the early stages of hydration of a
High Initial Strength and Sulphate Resistant Portland Cement (HS SR PC) with those
of Type II F Portland Cement (PC II), by Non Conventional Differential Thermal
Analysis (NCDTA) within the first 24 hours of hydration. Water/cement (w/c) ratios
equal to 0.5, 0.6 and 0.66 were used to prepare the pastes. The hydration of these
two types of cement was monitored on real time by NCDTA curves, through the
thermal effects of the hydration reactions, from which cumulative evolved energy
curves were obtained. These techniques allow one to analyse the influence of each
type of cement on the main stages that occur during the hydration process.
Thermogravimetric analysis were also performed at 4 and 24h of hydration for both
cements, to analyse the influence of each kind of cement on the amount of the main
formed hydrated products.
21º CBECIMAT - Congresso Brasileiro de Engenharia e Ciência dos Materiais09 a 13 de Novembro de 2014, Cuiabá, MT, Brasil
1144

Keywords: HS SR Portland cement, type II Portland cement, early stage hydration, NCDTA,
thermogravimetry.
INTRODUCTION
Thermogravimetric (TG) and derivative thermogravimetric (DTG) analyses have been
used as a tool to study the hydration reactions in cementitious pastes (1,2,3).These
techniques allows to determine the quantitative of the main formed hydration products, to
study the effects of different mineral additives, as fly ash, silica fume, for example, by
pozzolanic activity (4,5,6), to determine the carbonation degree of cementitious materials,
by the consumption of Ca(OH)2 and consequently formation of CaCO3, as an indicative of
durability or quantifying the CO2 captured in the own matrix (7,8).
The non-conventional differential thermal analysis (NCDTA), different from the
differential thermal analysis (DTA), where the thermal effects are measured, by the control
of an external heating or cooling device (2,9), is a system which operates semi-adiabatically
allowing to measure, the temperature difference between a sample and an inert reference,
as DTA operates, but due to the thermal effects promoted by the spontaneous cement
hydration exothermal reactions. The NCDTA has been used in several studies to monitoring,
on real time, the hydration reaction, by the water to cement (w/c) ratio variation (2), the
mineral additives in the pozzolanic activity (4) and the use of residues within the cement in a
solidification process (9).
In this work, the hydration behavior of two types of cement pastes during their first 24
h of hydration was evaluated from NCDTA and TG/DTG analysis. W/c ratios equal to 0.5, 0.6
and 0.66 were used to evaluate and compare the influence of these two types of cement on
the cumulative energy evolved, as well as to investigate, the amount of the mainly hydrated
products formed with 4 and 24h for each type of cement, at the same time.
MATERIALS
21º CBECIMAT - Congresso Brasileiro de Engenharia e Ciência dos Materiais09 a 13 de Novembro de 2014, Cuiabá, MT, Brasil
1145

In this study, two types of cement were used, a Type II F Portland cement (PC II) and a
High Initial Strength Sulphate Resistance Portland Cement (HIS SR PC), according to the
Cement Portland Brazilian Association (ABCP). The PC II it’s a type of cement largely used
and commercialized in the most of the applications in civil engineering, characterized by the
presence of 6 to 10% of carbonate material, as filler, and pozzolanic material (10). The HIS SR
PC is mainly characterized to reach high strengths at early hydration stages, due to a higher
milling degree of the cement, to accelerate its reactions with water, by the higher specific
external area of the particles, reaching a higher strength in a shorter time. This kind of
cement may have a maximum of 5 % of carbonates addition and aggregation of blast furnace
slag or pozzolanic materials (11,12).
The chemical composition of the both cements is presented on the Table 1. The
granulometric distribution curve of the PC II and HIS SR PC, is presented in Fig. 1.
Fig.1 – Granulometric curve of the HIS SR PC and PC II
21º CBECIMAT - Congresso Brasileiro de Engenharia e Ciência dos Materiais09 a 13 de Novembro de 2014, Cuiabá, MT, Brasil
1146
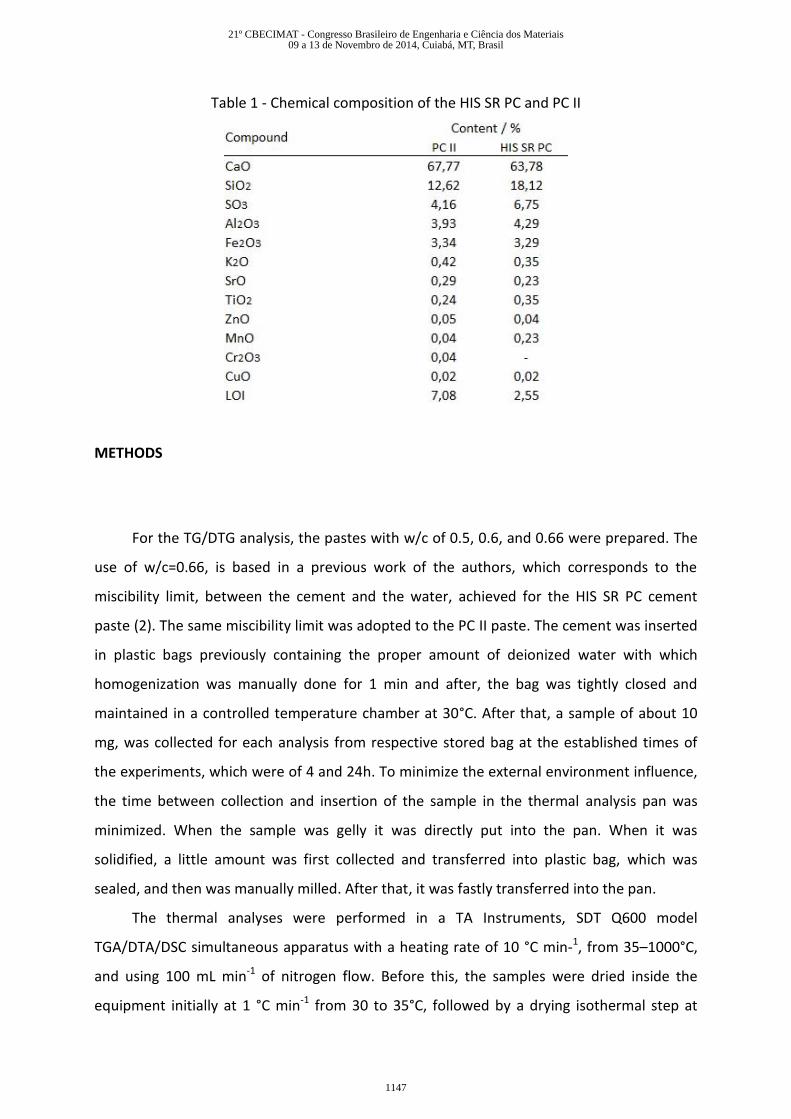
Table 1 - Chemical composition of the HIS SR PC and PC II
METHODS
For the TG/DTG analysis, the pastes with w/c of 0.5, 0.6, and 0.66 were prepared. The
use of w/c=0.66, is based in a previous work of the authors, which corresponds to the
miscibility limit, between the cement and the water, achieved for the HIS SR PC cement
paste (2). The same miscibility limit was adopted to the PC II paste. The cement was inserted
in plastic bags previously containing the proper amount of deionized water with which
homogenization was manually done for 1 min and after, the bag was tightly closed and
maintained in a controlled temperature chamber at 30°C. After that, a sample of about 10
mg, was collected for each analysis from respective stored bag at the established times of
the experiments, which were of 4 and 24h. To minimize the external environment influence,
the time between collection and insertion of the sample in the thermal analysis pan was
minimized. When the sample was gelly it was directly put into the pan. When it was
solidified, a little amount was first collected and transferred into plastic bag, which was
sealed, and then was manually milled. After that, it was fastly transferred into the pan.
The thermal analyses were performed in a TA Instruments, SDT Q600 model
TGA/DTA/DSC simultaneous apparatus with a heating rate of 10 °C min-1, from 35–1000°C,
and using 100 mL min-1 of nitrogen flow. Before this, the samples were dried inside the
equipment initially at 1 °C min-1 from 30 to 35°C, followed by a drying isothermal step at
21º CBECIMAT - Congresso Brasileiro de Engenharia e Ciência dos Materiais09 a 13 de Novembro de 2014, Cuiabá, MT, Brasil
1147
35°C for 1 h, to eliminate the residual non-combined free water (1,2). The material of
reference and sample pans was platinum.
The contents of the products were calculated using the procedure described in
previous works of the authors (1,4). It uses the TG and DTG data on the initial cement mass
basis for the determination of the hydration products and the correct comparison between
the curves. On this basis, all the TG and DTG curves, from which the contents of the
following products were determined, were plotted:
• The water released from the tobermorite and ettringite phases decomposition,
between 50 and 200 °C;
• The total combined water released during analysis, including the water lost from
dehydroxylation of the Ca(OH)2 between 35 and 450 °C;
• The water lost during the dehydroxylation of Ca(OH)2, between 380 and 450 °C;
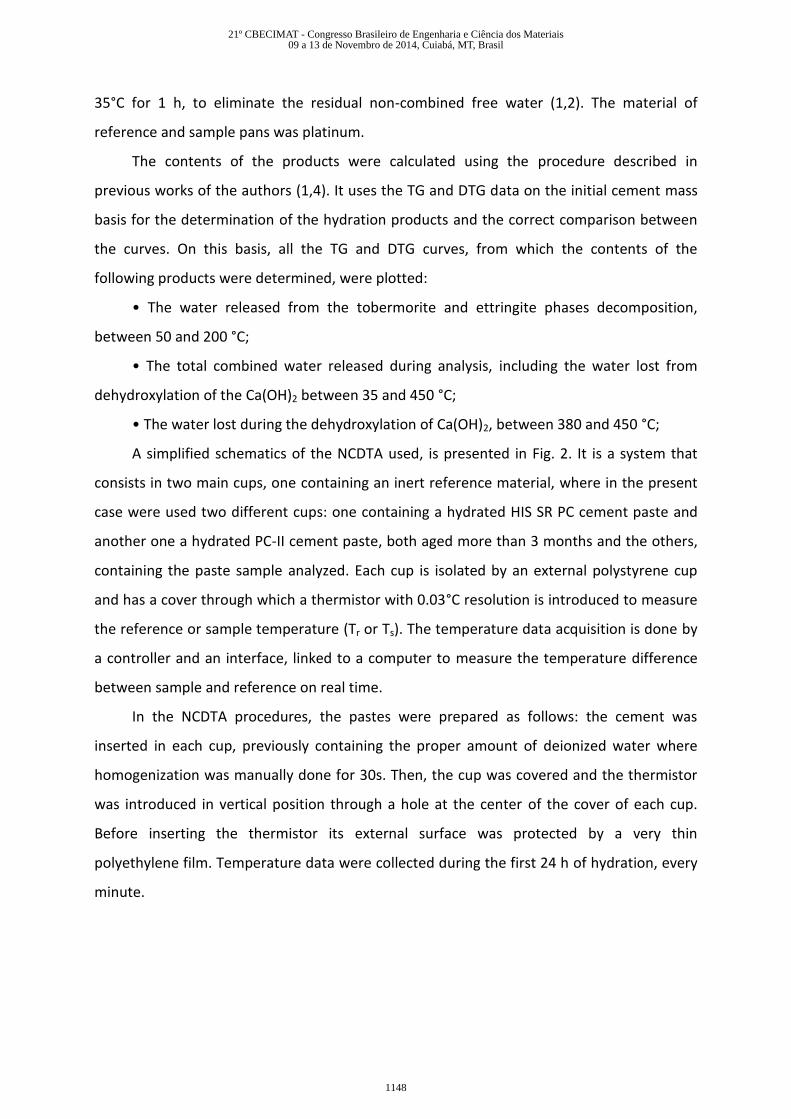
A simplified schematics of the NCDTA used, is presented in Fig. 2. It is a system that
consists in two main cups, one containing an inert reference material, where in the present
case were used two different cups: one containing a hydrated HIS SR PC cement paste and
another one a hydrated PC-II cement paste, both aged more than 3 months and the others,
containing the paste sample analyzed. Each cup is isolated by an external polystyrene cup
and has a cover through which a thermistor with 0.03°C resolution is introduced to measure
the reference or sample temperature (Tr or Ts). The temperature data acquisition is done by
a controller and an interface, linked to a computer to measure the temperature difference
between sample and reference on real time.
In the NCDTA procedures, the pastes were prepared as follows: the cement was
inserted in each cup, previously containing the proper amount of deionized water where
homogenization was manually done for 30s. Then, the cup was covered and the thermistor
was introduced in vertical position through a hole at the center of the cover of each cup.
Before inserting the thermistor its external surface was protected by a very thin
polyethylene film. Temperature data were collected during the first 24 h of hydration, every
minute.
21º CBECIMAT - Congresso Brasileiro de Engenharia e Ciência dos Materiais09 a 13 de Novembro de 2014, Cuiabá, MT, Brasil
1148
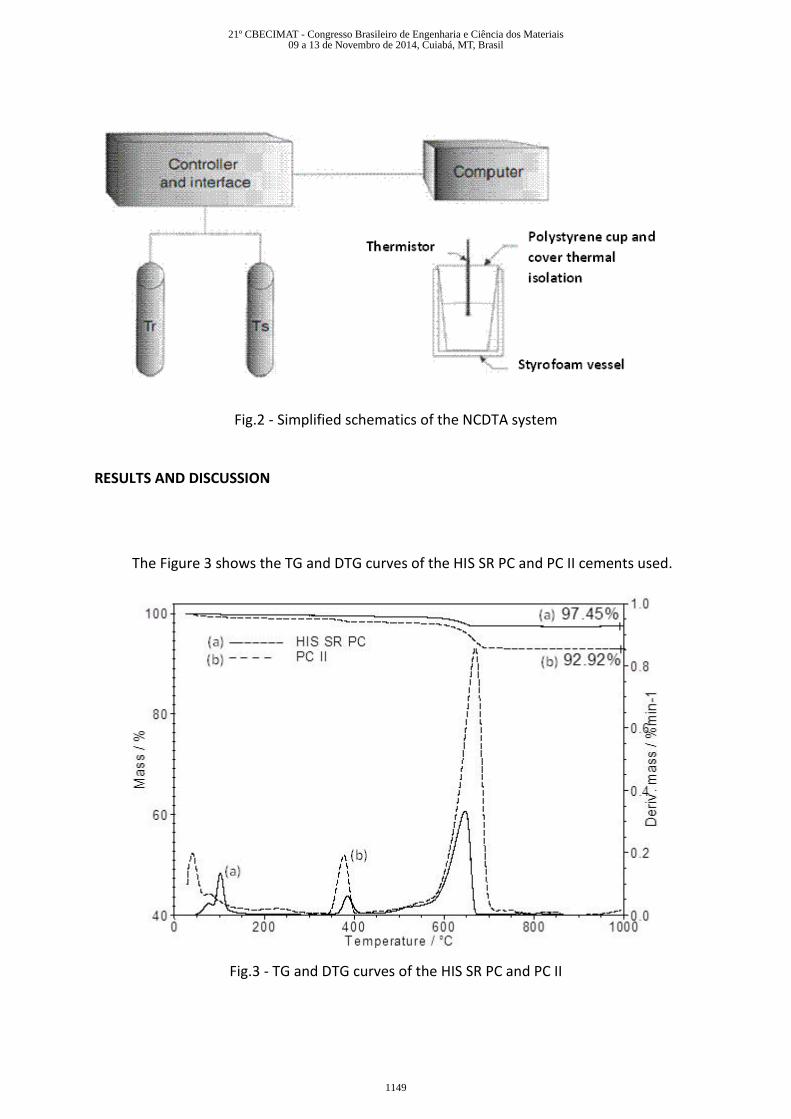
Fig.2 - Simplified schematics of the NCDTA system
RESULTS AND DISCUSSION
The Figure 3 shows the TG and DTG curves of the HIS SR PC and PC II cements used.
Fig.3 - TG and DTG curves of the HIS SR PC and PC II
21º CBECIMAT - Congresso Brasileiro de Engenharia e Ciência dos Materiais09 a 13 de Novembro de 2014, Cuiabá, MT, Brasil
1149

In Fig.3, the first mass loss step, for the both cements, up to 150°C, refers to the
gypsum dehydration. The second mass loss step from 350 to 450°C is due to calcium
hydroxide decomposition, which indicates an initial hydration step, due to water released
from the previously gypsum dehydration. From 450 to 700 °C occurs calcium carbonate
decomposition, where we can notice the higher amount of CaCO3, added as filler, presented
in the PC II cement in relation to the HIS SR PC cement.
The Figure 4, shows the NCDTA curves of the HIS SR PC and PC II pastes.
Fig.4 - NCDTA curves from 0.5 to 0.66 w/c ratio in the first 24h of hydration for the HIS SR PC and PC II pastes.
We can see from the NCDTA curves in Fig.4 that until 4h, all the PC II pastes studied
presented higher temperature differences than the HIS SR PC pastes. This behavior changes
after 4h until 12h, where we can notice that all HIS SR PC pastes present higher temperature
differences. Until 0,5h, the temperature of the HIS SR PC paste is higher than the PC II
pastes, which can be explained by the more reactivity of the former one due to it fineness.
When the HIS SR PC pastes reaches the induction period and does not occur increase of
temperature, the PC II pastes reaches the induction period at a higher temperature
difference, starting the acceleration period before the HIS SR PC paste. When the
acceleration period of the HIS SR PC pastes starts, the higher increase of temperature, leads
to a higher maximum temperature difference between 8,5 and 9,5h. Due to its faster setting,
21º CBECIMAT - Congresso Brasileiro de Engenharia e Ciência dos Materiais09 a 13 de Novembro de 2014, Cuiabá, MT, Brasil
1150

the HIS SR PC paste reaches a strength and lower porosity earlier than the PC II pastes, which
explains the faster increase and decrease of the temperature difference and the higher
temperature difference. In the PC II pastes, after 14h, the higher temperature difference,
can be explained by the later reach of strength, where influences the decrease of the
temperature later and gradually.
For the HIS SR PC and PC II pastes from 0.55 to 0.66 w/c ratio, where the pastes were
homogeneous, it was possible to normalize the respective NCDTA curves and by integration,
to obtain the respective cumulative energy curves, in arbitrary units as presented in Fig.5.
Fig.5 - Cumulative evolved energy from 0.5 to 0.66 w/c ratio in the first 24h of hydration for the HIS SR PC and PC II pastes.
We can see from the Fig.5 that for the HIS SR PC pastes, from 0.5 to 0.66 w/c, presents
the higher total cumulative evolved energy from hydration reactions at 24 h, than the
respective w/c ratios of the PC II pastes. With 4h, in spite of the PC II pastes presented a little
higher cumulative evolved energy than the HIS SR PC pastes, all the curves were very close.
It was explained previously by the authors due to the more fluid pastes in this stage where
the cement content is the regulating factor [2]. With the consumption of the water by the
hydration reactions, the more fluid pastes in each case of cement pastes, which presents
higher water content, formed more hydrated products and presented higher cumulative
21º CBECIMAT - Congresso Brasileiro de Engenharia e Ciência dos Materiais09 a 13 de Novembro de 2014, Cuiabá, MT, Brasil
1151

evolved energy (1,2). The higher temperature difference of the HIS SR PC pastes during the
acceleration period showed in the Fig.5, contributed to the higher cumulative evolved
energy results in the end of 24h in relation to the PC II pastes. As proven previously by the
authors [2] the more fluid pastes also presented the higher cumulative evolved energy in the
end of 24h.
Figure 6 shows the TG and DTG curves of the HIS SR PC and PC II pastes from 0.55 to
0.66 w/c ratio.
(a) (b)
(c) (d)
21º CBECIMAT - Congresso Brasileiro de Engenharia e Ciência dos Materiais09 a 13 de Novembro de 2014, Cuiabá, MT, Brasil
1152

(e) (f)
Fig.6 – TG/DTG curves of the HIS SR PC and PC II pastes (a) for w/c=0.5 with 4h, (b) for w/c=0.5 with 24h, (c) for w/c=0.6 with 4h, (d) for w/c=0.6 with 24h, (e) for w/c=0.66 with 4h, (f) for w/c=0.66 with 24h.
From these TG/DTG curves, the main phases were quantified as detailed in materials
and methods. Results are shown in the next figures, with respective discussions. In the
respective DTG curves appear two decarbonation steps. The first one is referred to the less
crystalized CaCO3 decarbonation, and the second, to the more crystallized one [7]. A possible
carbonation of the samples during the experiments, which could have changed the final
amount of Ca(OH)2 formed, were determined and compensated stoichiometrically.
Figure 7 shows the content of the hydrated products of the HIS SR PC and PC II pastes
from 0.55 to 0.66 w/c ratios.
(a) (b)
21º CBECIMAT - Congresso Brasileiro de Engenharia e Ciência dos Materiais09 a 13 de Novembro de 2014, Cuiabá, MT, Brasil
1153
(c) (d)
(e) (f)
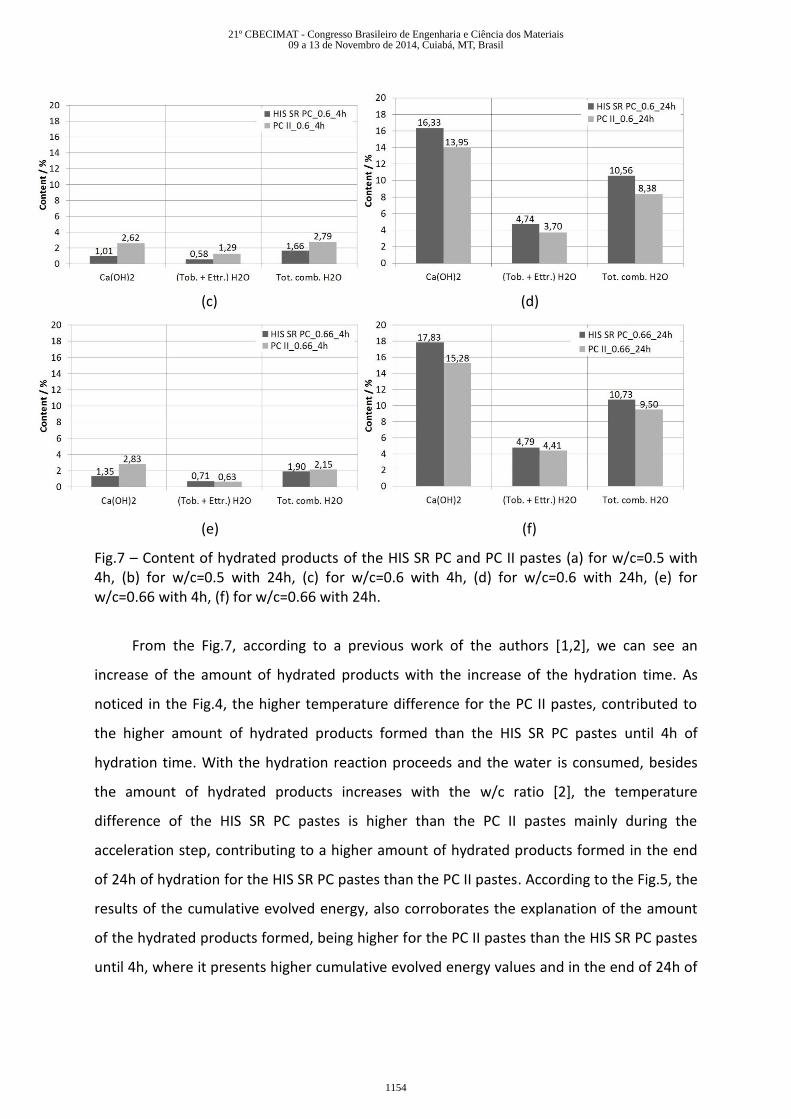
Fig.7 – Content of hydrated products of the HIS SR PC and PC II pastes (a) for w/c=0.5 with 4h, (b) for w/c=0.5 with 24h, (c) for w/c=0.6 with 4h, (d) for w/c=0.6 with 24h, (e) for w/c=0.66 with 4h, (f) for w/c=0.66 with 24h.
From the Fig.7, according to a previous work of the authors [1,2], we can see an
increase of the amount of hydrated products with the increase of the hydration time. As
noticed in the Fig.4, the higher temperature difference for the PC II pastes, contributed to
the higher amount of hydrated products formed than the HIS SR PC pastes until 4h of
hydration time. With the hydration reaction proceeds and the water is consumed, besides
the amount of hydrated products increases with the w/c ratio [2], the temperature
difference of the HIS SR PC pastes is higher than the PC II pastes mainly during the
acceleration step, contributing to a higher amount of hydrated products formed in the end
of 24h of hydration for the HIS SR PC pastes than the PC II pastes. According to the Fig.5, the
results of the cumulative evolved energy, also corroborates the explanation of the amount
of the hydrated products formed, being higher for the PC II pastes than the HIS SR PC pastes
until 4h, where it presents higher cumulative evolved energy values and in the end of 24h of
21º CBECIMAT - Congresso Brasileiro de Engenharia e Ciência dos Materiais09 a 13 de Novembro de 2014, Cuiabá, MT, Brasil
1154

hydration, where the HIS SR PC forms more hydrated products, presenting higher values of
cumulative evolved energy.
CONCLUSIONS
Thermogravimetric and derivative thermogravimetric analysis allow one to quantify
the hydrated products and to evaluate the influence of the HIS SR PC and PC II in the
hydration reactions that occur in the first 24h.
The NCDTA analysis allow one to study on real time, the influence of the w/c ratio
and the HIS SR PC and PC II in the hydration reactions, by the heat released from exothermic
effect.
From the NCDTA results of the HIS SR PC and PC II pastes, was possible to correlate
the exothermic effect by the temperature difference registered with the amount of hydrated
products calculated by thermogravimetric and derivative thermogravimetric analysis.
Until 4h of hydration, where the PC II pastes presents higher temperature difference
from the NCDTA analysis and consequently higher cumulative evolved energy, the amount of
the main hydrated products were higher than the HIS SR PC pastes. With 24h of hydration,
due to the higher exothermic effect of the HIS SR PC pastes during the acceleration step,
shown in the NCDTA analysis and the cumulative evolved energy results at 24h of hydration,
explains the higher amount of the main hydrated products than the PC II pastes at this time.
ACKNOWLEDGEMENTS
The authors acknowledge the experimental assistance of the Chemical School Thermal
Analysis and Civil Engineering Structure Laboratories of the Federal University of Rio de
Janeiro.
REFERENCES
21º CBECIMAT - Congresso Brasileiro de Engenharia e Ciência dos Materiais09 a 13 de Novembro de 2014, Cuiabá, MT, Brasil
1155
1. NEVES JUNIOR A, DWECK J, TOLEDO FILHO RD. Early stages hydration of high initial strength Portland cement—Part I—thermogravimetric analysis on calcined mass basis. Journal of Thermal Analysis Calorimetry. 2012;108:725–31. 2. NEVES JUNIOR A, LEMOS MS , DWECK J, TOLEDO FILHO RD. Early stages hydration of high initial strength Portland cement—Part II—NCDTA and Vicat analysis. Journal of Thermal Analysis Calorimetry. 2013; 113:659–665. 3. DWECK J, SILVA PFF, BUECHLER PM, CARTLEDGE FK. Study by thermogravimetry of the evolution of ettringite phase during type II Portland cement. Journal of Thermal Analysis Calorimetry. 2002;69(1):179–86. 4. CUNHA ALC, GONC¸ALVES JP, BUCHLER PM, DWECK J. Effect of metakaolin pozzolanic activity in the early stages of cement type II paste and mortar hydration. Journal of Thermal Analysis Calorimetry. 2008;92(1):115–9. 5. DWECK J, CUNHA ALC, PINTO CA, GONÇALVES JP, BUECHLER PM. Thermogravimetry on calcined mass basis—hydrated cement phases and pozzolanic activity quantitative analysis. Journal of Thermal Analysis Calorimetry. 2009;97:85–9. 6. DWECK J, BUCHLER PM, COELHO ACV, CARTLEDGE FK. Hydration of a Portland cement blended with calcium carbonate. Thermochim Acta. 2000;346:105–13. 7. NEVES JUNIOR A, DWECK J, TOLEDO FILHO RD, FAIRBAIRN EMR. CO2 sequestration by high initial strength Portland cement pastes. Journal of Thermal Analysis Calorimetry. 2013;113:1577–84. 8. NEVES JUNIOR A, DWECK J, TOLEDO FILHO RD. A study of the carbonation profile of cement pastes by thermogravimetry and its effect on the compressive strength. Journal of Thermal Analysis Calorimetry (2014) 116:69–76. 9. MELCHERT MBM, VIANA MM, LEMOS MS, DWECK J, BUCHLER PM. Simultaneous solidification of two catalyst wastes and their effect on the early stages of cement hydration. Journal of Thermal Analysis Calorimetry. 2011;105(2):625–33. 10. BRAZILIAN ASSOCIATION OF TECHNICAL STANDARDS. Portland cement type II. Rio de Janeiro: NBR 11578; 1991 (in Portuguese). 11. BRAZILIAN ASSOCIATION OF TECHNICAL STANDARDS. High initial strength Portland cement. Rio de Janeiro: NBR 5733; 1991 (in Portuguese). 12. BRAZILIAN ASSOCIATION OF TECHNICAL STANDARDS. Moderate sulphate resistance Portland cement and moderate hydration heat (MRS) and high sulphate resistance. Rio de Janeiro: NBR 5737; 1986 (in Portuguese).
21º CBECIMAT - Congresso Brasileiro de Engenharia e Ciência dos Materiais09 a 13 de Novembro de 2014, Cuiabá, MT, Brasil
1156