Embed Size (px)
Citation preview

[1]
A COMPARATIVE STUDY IN SOIL PLASTICITY OF
HALL AREA AND LECTURE COMPLEX AREA OF NIT
ROURKELA
Parit Yadav
Kuldeep Kumar Meena
Department of Civil Engineering,
National Institute of Technology Rourkela,
Rourkela – 769008, India.
[2]
A COMPARATIVE STUDY IN SOIL PLASTICITY OF
HALL AREA AND LECTURE COMPLEX AREA OF NIT
ROURKELA
Project Report Submitted in fulfillment of the requirements for the degree of
Bachelor of Technology
in
Civil Engineering
by
Parit Yadav (107CE012)
Kuldeep Kumar Meena (107CE028)
Under the guidance of
Prof. N. Roy
National Institute of Technology Rourkela,
Rourkela – 769008, India.

[3]
Department of Civil Engineering
National Institute of Technology Rourkela
Rourkela – 769008, India www.nitrkl.ac.in
CERTIFICATE
This is to certify that the project entitled A COMPARATIVE STUDY IN SOIL
PLASTICITY OF HALL AREA AND LECTURE COMPLEX AREA OF NIT ROURKELA submitted
by Mr. Parit Yadav (Roll No. 107CE012) and Mr. Kuldeep Kumar Meena (Roll. No.
107CE028) in fulfillment of the requirements for the award of Bachelor of Technology
Degree in Civil Engineering at NIT Rourkela is an authentic work carried out by them
under my supervision and guidance.
Date: 09-5-2011
Prof. N. Roy
Professor
Department of Civil Engineering
National Institute of Technology Rourkela

[4]
ACKNOWLEDGEMENT
We would like to thank NIT Rourkela for giving us the opportunity to use
their resources and work in such a challenging environment.
First and foremost we take this opportunity to express our deepest sense of
gratitude to our guide Prof. N. Roy for his able guidance during our project work. This
project would not have been possible without his help and the valuable time that he has
given us amidst his busy schedule.
We would also like to extend our gratitude to Prof. M. Panda, Head, Department of
Civil Engineering, who has always encouraged and supported us in doing our work.
I am also thankful to the Geotechnical Engineering Laboratory, and the staff
members working there for helping and guiding me during the experiments.
Last but not the least we would like to thank all the staff members of Department of
Civil Engineering who have been very cooperative with us.
Parit Yadav
Kuldeep Kumar Meena

[5]
Contents
List of Figures...................................................................................................................... 6
Introduction......................................................................................................................... 8
Literature Review ............................................................................................................. 10
Experimental Work .......................................................................................................... 13
Liquid Limit Test: ........................................................................................................... 13
Procedure for finding Plastic Limit .................................................................................. 18
Procedure for finding the Gradation curve ....................................................................... 19
Results ............................................................................................................................... 22
Conclusions ........................................................................................................................ 30
References.......................................................................................................................... 31

[6]
List of Figures
Figure 1 Liquid Limit Apparatus ......................................................................................... 13
Figure 2 Grooving Tools ..................................................................................................... 15
Figure 3 Soil Pat of Liquid Limit Test ................................................................................. 17
Figure 4 USCS Chart .......................................................................................................... 21
Figure 5 Flow Curve for VS Hall ........................................................................................ 22
Figure 6 Flow Curve for Lecture Complex .......................................................................... 23
Figure 7 Gradation Curve for VS Hall ................................................................................. 26
Figure 8 Gradation Curve for Lecture Complex ................................................................... 27
Figure 9 Gradation Curve Comparison ................................................................................ 28
Figure 10 Plasticity Chart .................................................................................................... 29
[7]
Abstract
The aim of this study is to classify and compare between soil samples from two areas of NIT
Rourkela campus using plasticity tests. The two areas chosen are- (i) area near site of Vikram
Sarabhai Hall of Residence and (ii) area near site of new Lecture Complex building. Along
with plasticity tests other tests such as specific gravity test and soil gradation test were also
done to find respective geotechnical properties. On the basis of these experiments the
conclusions are drawn.

[8]
Chapter 1
Introduction
Albert Mauritz Atterberg (March 19, 1846 – April 4, 1916) from Sweden was an agriculturist
and a chemist. While working on chemistry, he started focussing his efforts on the
classification and plasticity of soils, for which he is most remembered. He laid down seven
“limits of consistency” also known as Atterberg’s Limits, to classify fine-grained soils. These
were later modified by Arthur Casagrande.
In current engineering practice only two of these limits, the liquid limit and plastic limit, are
generally used. A third limit, called the shrinkage limit, is also used occasionally. The
Plasticity characteristics are used as an essential constituent of many engineering
classification systems to characterise the fine grained fraction of the soil. The Liquid limit,
Plastic limit and Plasticity Index of soils are also used in a widespread way, either singly or
together with other soil properties to correlate with geo-technical behaviour such as shear
strength, compressibility, compactibilty, shrinkage, swelling and permeability.
Liquid limit is significant to know the stress history and general properties of the soil met
with construction. From the results of liquid limit the compression index may be estimated.
The compression index value will help us in settlement analysis. If the natural moisture
content of soil is closer to liquid limit, the soil can be considered as soft if the moisture
content is lesser than liquids limit, the soil can be considered as soft if the moisture content is
lesser than liquid limit. The soil is brittle and stiffer.
The uses of soil include its use in building of bricks, tiles, soil cement blocks, etc apart from
its use as foundation for structures. It may be difficult to deal with soils which have large
change in volume with change in water content.

[9]
The results of grain size analysis are widely used in soil classification. The information
obtained from grain size distribution curves is used in the design of filters for earth dams to
determine the suitability of soils for road construction.
[10]
Chapter 2
Literature Review
Soil consistency shows the degree of cohesion and adhesion between the soil particles which
causes the resistance of the soil to deform or rupture. Cohesion is the attraction of one water
molecule to another due to hydrogen bonding. Whereas, adhesion involves the attraction of a
water molecule to a non-water molecule. These consistency limits are mostly used for fine
grained soil and are based on water content. Consistency specifies the degree of firmness of
soil which may be classified as soft, firm, stiff or hard. When water is added to fine grained
soil, a plastic paste is formed which can be moulded into different shapes under stresses.
Addition of water causes reduction in cohesion of soil, hence it becomes easier to mould.
Further addition of water causes reduction in cohesion until the soil mass not able to retain its
shape under its own weight, and flows as a liquid. Addition of more water causes the soil
particles to get dispersed in a suspension. Now, if water is evaporated from such a
suspension, the soil passes through various stages of consistency. These stages are:
i. Liquid state
ii. Plastic state
iii. Semi-solid state
iv. Solid state
Atterberg divided these stages by arbitrary limits on basis of water content which are called
Atterberg limits. These limits are expressed as percent water content.
Liquid Limit
Liquid limit (LL / wl ) is defined as the water content corresponding to the transition between
the liquid and plastic states of a soil. Experimentally speaking, it is also the water content at

[11]
which a pat of soil, cut by a groove of standard dimensions, will move together for a distance
of 12 mm under the impact of 25 blows of a standard liquid limit device. Also, it is the
minimum water content at which soil mass is still in liquid state but has enough shearing
strength to prevent flowing.
Plastic Limit
Plastic limit (PL / wp) is defined as the water content corresponding to the transition between
the plastic and semi-solid states of a soil. Experimentally speaking, it is the water content at
which a soil will just begin to crumble when rolled into a thread of approximately 3mm
diameter.
Shrinkage Limit
Shrinkage limit (SL / ws) is that water content of soil where further loss of moisture will not
cause any more reduction of volume. Also, it is the lowest value of water content at which the
soil can be saturated.
Plastic Index (Ip)
Plastic Index (Ip) is the numerical difference between liquid limit and plastic limit of a soil.
The plasticity index indicates the range of consistency within which soil shows plastic
behaviour. This range of plasticity is called plastic range. When the plastic limit of a soil is
same or greater than the liquid limit of the soil, then in that case plastic index is taken as zero.
Besides their use for identification, the plasticity tests give information concerning the
cohesion properties of soil and the amount of capillary water which it can hold. They are also
used directly in specifications for controlling soil for use in fill.

[12]
Flow Index (If)
It is indicative of the rate of loss of shear strength upon increase in water content of soil. A
soil sample with higher value of flow index (steeper flow curve) has lower shear strength,
while the sample with lower value of flow index (flatter flow curve) has higher shear
strength. If the flow curve is extended at both ends so as to intersect the ordinates
corresponding to 10 and 100 blows, the numerical difference in water contents at 10 and 100
blows gives the value of flow index. `
Toughness Index (It)
It is ratio of Plasticity Index and Flow Index of a soil sample. This gives us an idea of shear
strength of soil at its plastic limit. When toughness index is less than 1, the soil is said to be
friable, which means it can be easily crushed at plastic limit.
Grain Size Analysis
The percentage of various sizes of particles in a dry soil sample is found by a process called
particle size analysis. Among the several methods available to find the different size
fractions, two are- Sieve analysis and Hydrometer test. Sieve analysis, is a better
representation of grain size distribution as it is not much affected by temperature, etc.

[13]
Chapter 3
Experimental Work
All the tests have been carried out in accordance with Indian Standard Methods for the test of
soils- IS 2720.
Liquid Limit Test:
The apparatus used are as follows:
1. Casagrande’s Apparatus (Liquid Limit Device) -This is a mechanical device
consisting of a brass cup suspended from a carriage, which is designed to control its
drop on to a hard rubber base. Figure 1 depicts the essential features of the device and
provides the critical dimensions. The device may be operated either by a hand crank
or by an electric motor. Different parts of the Liquid limit device should confirm to
the standards listed below.
Figure 1

[14]
Base
The base shall be hard rubber having a Durometer hardness of 80 to 90, and resilience that an
8mm diameter polished steel ball, when dropped from a height of 25 cm will have an average
rebounce of at least 80% but not more than 90%. The test shall be conducted on the finished
base with feet attached.
Feet
The base shall be supported by rubber feet designed to provide isolation of the rubber base
from the work surface. When the finished feet is attached to the base it should provide
Durometer hardness less than 60.
Cup
The cup should be brass and have a weight (inclusive of cup hanger) of 185 - 215 g.
Cam
The cam shall raise the cup smoothly and continuously to its maximum height, over a
distance of at least 1800 of cam rotation. The preferred cam motion is a uniformly accelerated
lift curve. The design of the cam and follower combination shall be such that there is no
upward or downward velocity of the cup when the cam follower leaves the cam.
Carriage
The cup carriage shall be constructed in a way that allows convenient but secure adjustment
of the height of drop of the cup to 10 mm. The cup hanger shall be attached to the carriage by
means of a pin which allows removal of the cup and cup hanger for cleaning and inspection.

[15]
Optional motor drive
As an alternative to the hand crank, the drive may be equipped with a motor to turn earn at 2
revolutions per second.
Grooving Tool
The tool shall be made of plastic or non corroding metal and shall conform to the following
dimensions.
Figure 2
Grooving tools (all dimensions are in mm)
Containers
Small containers for moisture content determination.
Balance
A balance readable to at least 0.01 g is used.

[16]
Storage Containers
Containers are used to store the prepared soil sample so that contamination or moisture loss is
prevented. A porcelain, glass or plastic dish about 11.5 cm in diameter and a plastic bag large
enough to enclose the dish and be folded over is adequate.
Ground Glass Plate
A ground glass plate at least 45 cm2 by 1cm thick for mixing soil and rolling plastic limit
threads is used.
Spatulas
A spatula having a blade about 2 cm wide by 8 cm long.
Sieve
A 425µm sieve is required.
Wash bottle
Wash bottle or a smaller container for adding controlled amounts of water to the soil and
washing fines from coarser particles.
Drying Oven
A thermostatically controlled oven capable of continuously maintaining a temperature of
105° –110°C is used. The oven shall be equipped with a thermometer of suitable range and
accuracy for monitoring the oven temperature.
Rod
A metal or plastic rod or tube of about 3.2 mm (1/8 inch) diameter and about 10 cm long for
judging the size of plastic limit threads.

[17]
Procedure for finding Liquid Limit
120 g of soil passing through 425-micron IS Sieve is mixed thoroughly with water in
evaporating dish or on the flat glass plate to form a paste. The paste should have a
consistency that would require 30 to 35 drops of the cup to make the required closing of the
standard groove. In the case of clayey soils, the soil paste shall be left to stand for a sufficient
time (24 hours) so as to ensure uniform distribution of moisture throughout the soil mass.
The soil is then mixed thoroughly before the test. A part of the paste is placed in the
cup above the spot where the cup stays on the base. It is then pressed down and put in
position from a spatula. It is then reduced down to a depth of one centimetre at its maximum
thickness. The soil in the cup is parted with the help of the grooving tool along the diameter
through the centre line of the cam follower so as to get a clean, sharp groove of proper
dimension. In cases where grooving tool, Type A does not give a clear groove as in sandy
soils, grooving tool Type B or Type C are used.
Figure 3
The cup is fitted and dropped by rotating the crank at a rate of two revolutions per second till
the two halves of the soil cake come in contact with bottom of the groove along a length of

[18]
12 mm. The length is measured with the end of the grooving tool or a ruler. The number of
drops required to cause the groove to close for the length of 12 mm is recorded.
Small quantity of soil mixture is added again to the cup and remixed with the soil. The new
pat is made in the cup and the test repeated. This procedure is repeated till two consecutive
trials give the same under of drops for closing of the groove. Care is taken to check that the
soil paste does not dry out too between repeat tests and also there is no sliding of soil on the
surface of the cup. In each of these repeat tests, the number of blows is noted down and the
moisture content determined.
Determination of Liquid Limit and Flow Index
Liquid Limit - A flow curve is plotted on a semi-logarithmic graph representing water content
on the arithmetical scale and the number of drops on the logarithmic scale. The flow curve is
a straight line drawn through the plotted points. The moisture content corresponding to 25
drops is read from the curve and is rounded off to the nearest whole number and reported as
the liquid limit of the soil.
Flow Index (If) - The flow curve plotted on semi-logarithmic graph is extended at either end
so as to intersect the ordinates corresponding to 10 and 100 drops. The slope of this line
which shows the difference in water contents at 10 drops and at 100 drops is calculated and it
is called the flow index.
Procedure for finding Plastic Limit
A sample weighing about 20 g of soil passing 425-micron IS Sieve is obtained. When after
mixing soil and water, the mass becomes plastic enough to be easily shaped into a ball; a part
of the soil sample in this state is taken for the plastic limit test. The soil sample is mixed
thoroughly with water in an evaporating dish or on the fiat glass plate till it becomes plastic

[19]
enough to be easily moulded with fingers. In the case of clayey soils the plastic soil mass has
to be left to stand for 24 hours to ensure uniform distribution of moisture in the soil. A ball
should be of about 8 g and rolled between the fingers and the glass plate with just enough
pressure so as to roll the mass into a thread of uniform diameter throughout its length. The
rolling is done as one complete motion of the hand forward and back. The rolling is done till
the threads are of 3 mm diameter. The soil is then kneaded together to a uniform mass and
rolled again. This process of alternate rolling and kneading is done again and again until the
thread crumbles under the pressure and soil can no longer be rolled into a thread. The
moisture content is computed separately to determine the Plastic Limit of the soil. Plasticity
Index is reported as the difference between Liquid Limit and Plastic Limit.
Procedure for finding the Gradation curve
Sieve Analysis
Sieving is conducted by arranging the various sieves over one another in order of their mesh
openings- biggest aperture at the top and smallest at the bottom. A holder is kept at the
bottom and a cover is put at the top of the whole setup. The soil is put through the top sieve
and adequate amount of shaking is done to let the soil particles pass through the various
sieves. 20mm, 10mm, 6mm, 4.25mm, 2mm, 1mm, 425 micron, 150micron and 75micron IS
sieves were used to perform the sieving.
The results of sieve analysis are plotted in a graph of percent passing versus the sieve size.
On the graph the sieve size scale is logarithmic. To find the percent of aggregate passing
through each sieve, the percent retained in each sieve is found. The following equation is
used for this:

[20]
%Retained = ×100%
where WSieve is the weight of aggregate in a particular sieve and WTotal is the total weight of
the aggregate. After this the cumulative percent of aggregate retained in a sieve is found. To
do so, the total amount of aggregate that is retained in each sieve and the amount in the
previous sieves are added up. The cumulative percent passing of the aggregate is found by
subtracting the percent retained from 100%.
The values are then plotted on a graph with cumulative percent passing on the y axis and
logarithmic sieve size on the x axis.
Uniformity Coefficient (Cv) = D60÷D10

[21]
The Unified Soil Classification System (or USCS) is one of the soil classification system
used in engineering and geology disciplines to describe the texture and grain size of a soil.
The classification system can be applied to most unconsolidated materials, and is represented
by a two-letter symbol.
Figure 4

[22]
Chapter 4
Results
LIQUID LIMIT- VS HALL
sample number 1 2 3 4 5
mass of empty can 13.19 5.54 5.62 5.58 5.56
mass of can+ wet soil 34.08 23.1 27.6 18.4 19.1
mass of can+ dry soil 28.64 18.6 21.7 15 15.4
mass of soil solids 15.45 13.06 16.08 9.42 9.84
mass of pore water 5.44 4.5 5.9 3.4 3.7
water content % 35.21 34.46 36.69 36.09 37.60
no. of blows 26 34 16 24 20
Liquid limit from graph= 35.85
Figure 5
Flow curve for soil from VS Hall
Flow Index= 14.135

[23]
LIQUID LIMIT Lecture Complex
sample number 1 2 3 4 5
mass of empty can 5.54 5.56 5.62 5 5.42
mass of can+ wet soil 18.2 24.1 24.2 15.3 23.6
mass of can+ dry soil 14.6 18.6 18.6 12.2 18.1
mass of soil solids 9.06 13.04 12.98 7.2 12.68
mass of pore water 3.6 5.5 5.6 3.1 5.5
water content % 39.74 42.18 43.14 43.06 43.38
no. of blows 37 33 24 28 32
Liquid limit from graph= 43.631
Figure 6
Flow Index= 20.659

[24]
PLASTIC LIMIT- VS Hall
sample number 1 2 3
mass of empty can 4.8 5.74 5.57
mass of can+ wet soil 12 12.1 12.6
mass of can+ dry soil 10.7 10.9 11.4
mass of soil solids 5.9 5.16 5.83
mass of pore water 1.3 1.2 1.2
water content % 22.03 23.26 20.58
Avg. Plastic Limit= 21.9576
Plastic Index= 13.892
PLASTIC LIMIT- Lecture Complex
sample number 1 2 3
mass of empty can 4.7 4.5 6.19
mass of can+ wet soil 9.1 9 10.9
mass of can+ dry soil 8.3 8.2 10
mass of soil solids 3.6 3.7 3.81
mass of pore water 0.8 0.8 0.9
water content % 22.22 21.62 23.62
Avg. Plastic Limit= 22.48863
Plastic Index= 21.142

[25]
SPECIFIC GRAVITY VS Hall
sample number 1.00 2.00 3.00
mass of empty bottle (M1) 116.49 116.50 121.16
mass of bottle+ dry soil (M2) 166.49 166.50 171.16
mass of bottle + dry soil + water (M3) 396.60 397.70 401.10
mass of bottle + water (M4) 365.28 364.58 369.20
specific gravity 2.68 2.96 2.76
Avg. specific gravity 2.80
SPECIFIC GRAVITY Lecture Complex
sample number 1.00 2.00 3.00
mass of empty bottle (M1) 124.15 116.25 118.36
mass of bottle+ dry soil (M2) 174.15 166.25 168.36
mass of bottle + dry soil + water (M3) 404.53 396.20 401.96
mass of bottle + water (M4) 373.49 365.10 370.76
specific gravity 2.64 2.65 2.66
Avg. specific gravity 2.65

[26]
GRAIN SIZE DISTRIBUTION BY SIEVING VS Hall Soil
Sieve sizes retained(g) %retained cummulative %
retained
cummulative %
finer
20mm 0 0 0 100
10mm 94.300 11.098 11.098 88.902
6.25mm 180.900 21.290 32.388 67.612
4.75mm 119.400 14.052 46.440 53.560
2mm 337.500 39.720 86.160 13.840
1mm 32.500 3.825 89.985 10.015
0.425mm 32.000 3.766 93.751 6.249
0.150mm 37.20 4.38 98.13 1.87
0.075mm 14.6 1.718 99.85 0.15
below 0.075mm 1.3 0.153 100.00 0.00
Figure 7
Uniformity Coefficient= 4.11/2.55= 1.611

[27]
GRAIN SIZE DISTRIBUTION BY SIEVING Lecture Complex Soil
Sieve sizes retained(g) %retained cummulative %
retained
cummulative %
finer
20mm 0 0 0 100
10mm 83.980 9.938 9.938 90.062
6.25mm 126.410 14.960 24.898 75.102
4.75mm 64.150 7.592 32.490 67.510
2mm 447.580 52.968 85.458 14.542
1mm 18.940 2.241 87.699 12.301
0.425mm 23.910 2.830 90.529 9.471
0.150mm 9.76 1.16 91.68 8.32
0.075mm 5.96 0.705 92.39 7.61
below 0.075mm 64 7.574 99.96 0.04
Figure 8
Uniformity Coefficient= 4.15/2.57= 1.614

[28]
Comparison of soil from VS Hall and Lecture Complex
Figure 9
Property VS Hall Lecture Complex
Liquid Limit 35.85 43.631
Plastic Limit 21.95 22.488
Plasticity Index 13.892 21.14
Flow Index 14.135 20.659
Specific Gravity 2.8 2.65
Toughness Index 1.0175 0.9772
Uniformity Coefficient 1.611 1.614
[29]
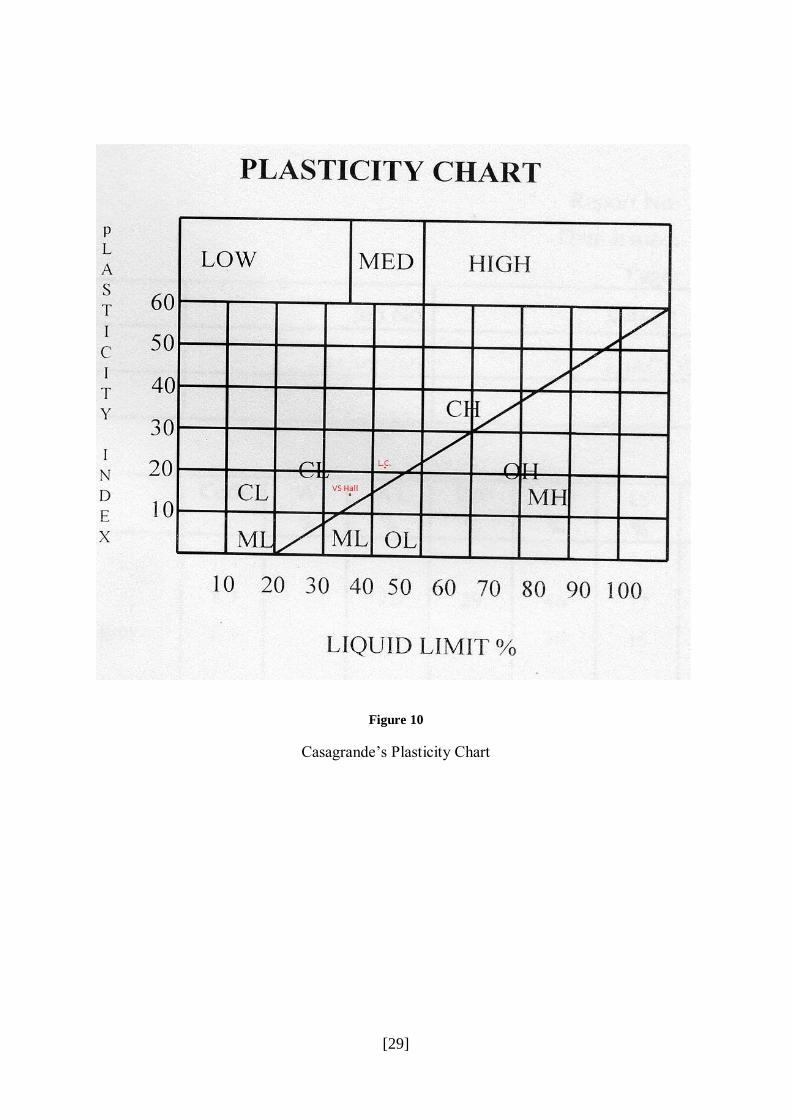
Figure 10
Casagrande’s Plasticity Chart

[30]
Chapter 5
Conclusions
On the basis of present experimental study, the following conclusions are drawn:
1. From the Plasticity chart (figure 10) it can be seen that, soil taken from Vikram
Sarabhai hall area and Lecture Complex area both lie in the CL region. This means
that the soils are inorganic clayey in nature with low plasticity.
2. The Toughness Index of soil from Lecture Complex has value 0.9772. Soils with
toughness index less than 1 are called friable soil, which means they can be easily
crumbled.
3. From the gradation curve (figure 9), it can be seen that soil in both the areas has
similar grain size distribution. The Uniformity coefficient of both soils is
approximately equal to 1.61.
4. For use in embankments and foundations, these soils have good bearing value and
require no special seepage control measures.

[31]
References
1. Determination of consistency Limits http://home.iitk.ac.in/~madhav/expt5.html
2. Ince, I. and Özdemir, A.,2010, Soil Type Investigation of the Doganhisar Clays,
Central Anatolia, Turkey, Ozean Journal of Applied Sciences 3(3), 2010
3. Engineering Properties of Soils Based on Laboratory Testing, Prof. Krishna Reddy,
UIC
4. ASTM D 2487-00, 2003, Standard Practice for Classification of Soils for
Engineering Purposes (Unified Soil Classification System), In: Annual Book of ASTM
Standards. Volume 04.08, West Conshohocken, PA.
5. Indian Standards Code- IS 2720
6. Indian Standards Code- IS 9259
7. Laboratory Tests: To determine liquid limit and plastic limit of a soil
http://aboutcivil.com/to-determine-liquid-limit-plastic-limit-of-soil.html
8. Particle distribution for soil test http://www.civilcraftstructures.com/materials-
testing/particle-distribution-for-soil-test/
9. Sieve Analysis- Wikipedia the free encyclopedia
http://en.wikipedia.org/wiki/Sieve_analysis
10. Classification of Soils for Engineering Purposes: Annual Book of ASTM Standards,
D 2487-83, 04.08, American Society for Testing and Materials, 1985, pp. 395–408 Evett,
Jack and Cheng Liu (2007), Soils and Foundations (7 ed.), Prentice Hall
11. Google Docs- Determination of Plasticity Characteristics of soils, Department of Civil
Engineering, University of Moratuwa, Sri Lanka http://bit.ly/lM1rN9
12. Soil Mechanics and Foundations By Dr. B.C. Punmia, Ashok Kumar Jain, B.C.
Punmia, Arun Kr. Jain
13. Basic and Applied Soil Mechanics, By Gopal Ranjan and ASR Rao