Embed Size (px)
Citation preview

International Journal of Advancements in Research & Technology, Volume 5, Issue 5, May-2016 34 ISSN 2278-7763
Copyright © 2016 SciResPub. IJOART
A COMPARATIVE STUDY OF FREE SPACE AND OKUMURA-HATA MODELS IN
GSM SIGNAL PATH LOSS PREDICTION IN SOUTH-SOUTH NIGERIA.
OYUBU A.O
Department of Electrical/Electronic Engineering, Delta State University, Abraka, Oleh
Campus,
Nigeria.
Email:[email protected]
ABSTRACT
One of the most fundamental tasks in Radio network planning is Radio propagation prediction. This is
done to foresee the coverage of the proposed system whilst considering the practical limitations that
characterize the propagation environment. As a result, many prediction models have been developed and deployed over the years. In this paper, two of such models; Okumura-Hata, and Free Space, are
comparatively studied at three different locations in Ughelli, a suburban terrain of Delta state in South-
South, Nigeria with the sole aim of comparing their accuracy in Path loss prediction. A netmonitor software installed in a smart phone, and a Garmin Nuvi Global Positioning System (GPS) device were
used to measure the Received Signal Strength (RSS) and Distances between Base Transceiver Stations
(BTS), and Mobile Station (MS) respectively. The analysis of the result showed that Okumura-Hata
model is more accurate in pathloss prediction.
Key Words: Path Loss, Netmonitor software, Garmin Nuvi, GPS, MS, RSS, BTS.
1. INTRODUCTION
The performance of wireless communication
systems relies largely on the design of the
transmission strategy. Over the years,
various propagation models have been
developed for assessing wireless
communication system for high quality and
service delivery. These models differ in their
properties with locations due to
environmental and geographical conditions
[1][2].The power loss involved in
transmission between the Base Transceiver
Station (BTS) and the Mobile Station (MS)
is known as path loss and it depends
particularly on the antenna height, carrier
frequency, and distance. Since path loss is
essentially the reduction in power density of
an electromagnetic wave as it propagates
through space, it can also be influenced by
terrain contours, environment (urban or rural,
vegetation and foliage), propagation medium
(dry or moist air). At higher frequencies, the
range for a given path loss is reduced;
therefore, more cells are required to cover a
given area.
Ekpeyong et al [3] comparatively studied
three propagation models-COST 231,ECC
33 and the Lee path models for UMTS based
cellular systems with the aim of knowing the
most reliable one (through simulation)
suitable for efficient use of the available
resources. In his work, Shoewu (2011),
showed that the Okumura-Hata model is
IJOART

International Journal of Advancements in Research & Technology, Volume 5, Issue 5, May-2016 35 ISSN 2278-7763
Copyright © 2016 SciResPub. IJOART
very effective for radio wave propagation
path loss prediction in suburban areas in the
western part of Nigeria [4].Similarly, Sharma
(2010) concluded that propagation path loss
model may give different results if they are
used in different environment other than the
environment in which they are designed.
Data collected from the test locations were
compared with free space, and Okumura-
Hata model’s calculations for path loss. The
result obtained clearly depicts that the
Okumura-Hata model predicts better even
with increasing distances from the Base
transceiver Stations
2. TYPE OF PATH-LOSS
PROPAGATION PREDICTION
MODELS
2.1. Theoretical models
It is derived by physical hypothetical
assumption, in addition to some moderate
conditions. For instance, when we consider
the over-rooftop, diffraction model is derived
using physical optics, assuming constant
heights and spacing of buildings [5]. The
propagation models are divided into two
basic types; namely: Free space propagation
and Plane earth propagation model.
2.1.1 Free Space Propagation Model
In free space, the wave is not reflected or
absorbed. Ideal propagation implies equal
radiation in all directions from the radiating
source and propagation to an infinite
distance with no degradation. Spreading the
power over greater areas causes attenuation.
Equation (1) illustrates how the power flux
is calculated.
Pd = Pt / 4πd² (1)
Where Pt is known as transmitted power
(W/m2) and Pd is the power at a distance d
from antenna. If the radiating element is
generating a fixed power and this power is
spread over an ever-expanding sphere, the
energy will be spread more thinly as the
sphere expands.
By having identified the power flux
density at any point of a given distance
from the radiator, if a receiver antenna is
placed at this point, the power received by
the antenna can be calculated. The
formulas for calculating the effective
antenna aperture and received power are
shown in equations (2) and (3) below. The
amount of power ‘captured’ by the
antenna at the required distance d, depends
upon the ‘effective aperture’ of the
antenna and the power flux density at the
receiving element. Actual power received
by the antenna depends on the following:
(a) The aperture of receiving antenna Ao,
(b) the wavelength of received signal λ, (c)
and the power flux density at receiving
antenna Pd.
Effective area Ae of an isotropic antenna is:
Ae = λ² / 4π (2)
While power received is:
Pr = Pd × Ae = Pt ×λ² /(4πd)²
(3)
IJOART

International Journal of Advancements in Research & Technology, Volume 5, Issue 5, May-2016 36 ISSN 2278-7763
Copyright © 2016 SciResPub. IJOART
While equation (4) illustrates the path loss
(Lp):
Lp = Power transmitted (Pt ) - Power
received (Pr ) (4)
When substituting equation (3) in equation
(4), it yields equation (5):
Lp (dB) = 20 log10 (4π) + 20 log10 (d)
- 20 log10 (λ) (5)
Then substituting (λ) (in km) = 0.3 / f
(in MHz) and rationalizing the equation
produces the generic free space pathloss
formula, which is stated in equation (6):
Lp(dB) =
32.5 + 20 log10 (d) + 20 log10 ( f ) (6)
2.1.2 Plane Earth Propagation Model
The free space propagation model does not
consider the effects of propagation over
ground. When a radio wave propagates
over ground, some of the power will be
reflected due to the presence of ground and
then received by the receiver. Determining
the effect of the reflected power, the free
space propagation model is modified and
referred to as the ‘Plain-Earth’ propagation
model. This model better represents the true
characteristics of radio wave propagation
over ground. The plane earth model
computes the received signal to be the sum
of a direct signal and that reflected from a
flat, smooth earth. The relevant input
parameters include the antenna heights, the
length of the path, the operating frequency
and the reflection coefficient of the earth.
This coefficient will vary according to the
terrain type (e.g. water, desert, wet ground
etc). Path Loss Equation for the plane (1)
Earth Model is illustrated in equation (7).
Lpe =
40log10 (d)-20log10 (h1)-20log10 (h2) (7)
Where d represents the path length in meters
and h1 and h2 are the antenna heights at the
base station and the mobile, respectively.
The plane earth model in not appropriate for
mobile GSM systems as it does not consider
the reflections from buildings, multiple
propagation or diffraction effects.
Furthermore, if the mobile height changes
(as it will in practice) then the predicted path
loss will also be changed.
2.2. Empirical Propagation
Model
It is derived from in-depth field
measurements. It is efficient and simple to
use. The input data for the empirical models
are generally qualitative, also not very
correct, for instance like dense urban area,
rural area and so on [6-8]. The two basic
propagation models (free space loss and
plane earth loss) would require detailed
knowledge of the location, dimension and
constitutive parameters of every tree,
building, and terrain feature in the area to be
covered. This is far too complex to be
practical and [10] would yield an
unnecessary amount of detail. One
appropriate way of accounting for these
complex effects is via an empirical model.
There are various empirical prediction
IJOART
International Journal of Advancements in Research & Technology, Volume 5, Issue 5, May-2016 37 ISSN 2278-7763
Copyright © 2016 SciResPub. IJOART
models which include, Okumura – Hata
model, Cost 231 – Hata model, [11] Cost 231
Walfisch – Ikegami model, Sakagami- Kuboi
model,the Lee model. These models depend
on location, frequency range and clutter type
such as urban, sub-urban and countryside.
2.2.1 Okumura’s Measurements
Okumura carried out extensive drive test
measurements with range of clutter type,
frequency, transmitter height, and
transmitter power. It states that, the signal
strength decreases at much greater rate with
distance than that predicted by free space
loss [11].
2.2.2 Okumura-Hata’s Propagation
Model
Hata model was based on Okumura’s field
test results and predicted various equations
for path loss with different types of clutter.
The limitations on Hata Model due to range
of test results from carrier frequency(fc)
150MHz to 1500MHz, the distance from the
base station ranges from 1Km to 20Km, the
height of base station antenna (hb) ranges
from 30m to 200m and the height of mobile
antenna (hm) ranges from 1m to 10m. Hata
created a number of representative path loss
mathematical models for each of the urban,
suburban and open country environments, as
illustrated in equations (6-8), respectively.
Path Loss for urban clutter:
Lp (urban) = 69.55+ 26.16log10 ( fc )-
13.82log10(hb) -a(hm) + (44.9-6.55log10(hb )
log10 (d) (8)
a(hm) = (1.1log10( fc )-0.7)hm -
(1.56log10 ( fc )-0.8) (9)
Lp (suburban) = Lp (urban)-
2{log10 ( fc /28)}²-5.4 (10)
Path loss for the open country is :
Lp (open rural area) = Lp (urban)-4.78{log10
( fc )}² +18.33log10 ( fc )-40.94 (11)
Hata model is not suitable for micro-cell
planning where antenna is below roof
height and its maximum carrier frequency
is 1500MHz. It is not valid for 1800 MHz
and 1900 MHz systems. [12]
2.2.3 COST 231-Hata model
Committee 231 of the European
Cooperation in the field of Scientific and
Technical Research (EURO- COST)
extends the Hata model for scientific
frequencies of interest (900MHz &
1800MHz). The model, which was
renamed COST – Hata model, is applicable
for only cases in which the antenna heights
are above the rooftops of the surrounding
buildings. COST 231 has extended Hata’s
model to the frequency band of 1500MHz
≤ fc ≤ 2000MHz by analysing Okumura’s
propagation curves frequency band
[12].The proposed model for path loss is
given as:
IJOART
International Journal of Advancements in Research & Technology, Volume 5, Issue 5, May-2016 38 ISSN 2278-7763
Copyright © 2016 SciResPub. IJOART
PL (dB) = 46.3+33.9log (fc) -13.82log (hr)
+[44.9-6.55log(ht)]log(d)+Cm
(12)
For a small to medium sized city,
a(hr) = [1.1log(fc) -0.7] hr –
[1.56log (fc) – 0.8] (13)
For a large city,
a(hr) =8.29 [log(1.54 hr )]2 hr –1.1
for fc ≤ 300MHz (14)
a(hr) =3.2 [log(11.75 hr )]2 hr- 4.9
for fc ≥300MHz (15)
0 dB for a medium-sized city and suburban areas
3 dB for metropolitan areas Cm =
Range of parameters
f : 1500-2000MHz
ht : 30 – 200m
hr : 1 – 10m
3. METHODOLOGY
A GSM signal Analyser, NETMONITOR
application, installed in a Tecno phantom A3
android phone with functions which include
on-air survey, signal strength evaluation, and
interrogation of cells of a base transceiver
station to find and identify the network
operator type was used to measure the
received signal strength at five different test
points of 200m apart from the Base Station
for three different locations within Ughelli
for MTN network. This software provided
various parameters such as the operator code
of the network, the operator type, location
area code (LAC), cell identification (CID),
signal strength in dBm, GPS parameters and
the location of the base transceiver station
from which the phone was obtaining service
at that instance. A Garmin Nuvi GPS device
was used to obtain the distance between MS
and BTS at each test point for each of the
three locations where this investigation was
conducted.
4. RESULT PRESENTATION/
ANALYSIS
A. Measurement Details for All Locations
Investigated.
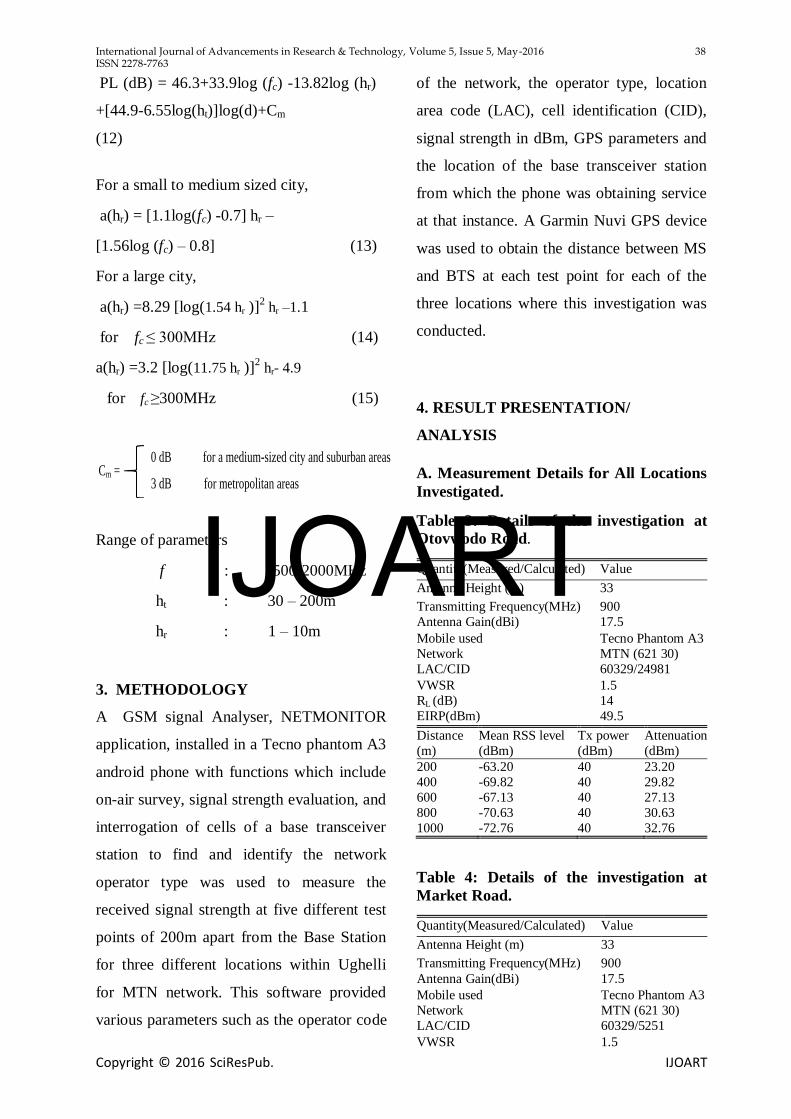
Table 3: Details of the investigation at
Otovwodo Road.
Quantity(Measured/Calculated) Value
Antenna Height (m) 33
Transmitting Frequency(MHz) 900
Antenna Gain(dBi) 17.5
Mobile used Tecno Phantom A3
Network MTN (621 30)
LAC/CID 60329/24981
VWSR 1.5
RL (dB) 14
EIRP(dBm) 49.5
Distance
(m)
Mean RSS level
(dBm)
Tx power
(dBm)
Attenuation
(dBm)
200 -63.20 40 23.20
400 -69.82 40 29.82
600 -67.13 40 27.13
800 -70.63 40 30.63
1000 -72.76 40 32.76
Table 4: Details of the investigation at
Market Road.
Quantity(Measured/Calculated) Value
Antenna Height (m) 33
Transmitting Frequency(MHz) 900
Antenna Gain(dBi) 17.5
Mobile used Tecno Phantom A3
Network MTN (621 30)
LAC/CID 60329/5251
VWSR 1.5
IJOART

International Journal of Advancements in Research & Technology, Volume 5, Issue 5, May-2016 39 ISSN 2278-7763
Copyright © 2016 SciResPub. IJOART
RL (dB) 14
EIRP(dBm) 49.5
Distance
(m)
Mean RSS level
(dBm)
Tx power
(dBm)
Attenuation
(dBm)
200 -71.88 40 31.88
400 -71.94 40 31.94
600 -79.25 40 39.25
800 -81.25 40 41.25
1000 -82.75 40 42.75
Table 5: Details of the investigation at
Warri-Patani Road.
Quantity(Measured/Calculated) Value
Antenna Height (m) 33
Transmitting Frequency(MHz) 900
Antenna Gain(dBi) 17.5
Mobile used Tecno Phantom A3
Network MTN (621 30)
LAC/CID 60329/7553
VWSR 1.5
RL (dB) 14
EIRP(dBm) 49.5
Distanc(m) Mean RSS level
(dBm)
Tx power
(dBm)
Attenuation
(dBm)
200 -53.00 40 13.00
400 -65.25 40 25.25
600 -71.32 40 31.32
800 -69.19 40 29.19
1000 -80.94 40 40.94
B. Obtained pathloss at various
distances for all investigated
locations.
Table 6: Pathloss obtained, based
on field data/calculation
Distance
(m)
Pathloss for
Otovwodo Road (dBm)
Pathloss for
Market Road (dBm)
Pathloss for
Warri-Patani Road (dBm)
200 112.69 121.38 102.50
400 119.88 121.44 114.75
600 114.63 128.75 120.82
800 120.13 130.75 118.69
1000 122.56 132.25 130.44
Table 7: Pathloss obtained from
calculation, based on the
Okumura-Hata model
Distance
(m)
Pathloss for
Otovwodo Road (dBm)
Pathloss for
Market Road (dBm)
Pathloss for
Warri-Patani Road (dBm)
200 102.67 104.73 100.85
400 113.20 115.68 110.98
600 119.35 122.09 116.91
800 123.72 126.62 121.11
1000 127.11 130.16 124.38
Table 8: Pathloss obtained from
calculation, based on the free
space model
Distance
(m)
Pathloss for
Otovwodo
Road (dBm)
Pathloss for
Market Road
(dBm)
Pathloss for
Warri-Patani
Road (dBm)
200 77.56 77.56 77.56
400 83.56 83.56 83.56
600 87.10 87.10 87.10
800 89.60 89.60 89.60
1000 91.53 91.53 91.53
D. Screen Shots of Received
Signal Strength Measurement
For all locations investigated.
Figure 2: Otovwodo Road
IJOART

International Journal of Advancements in Research & Technology, Volume 5, Issue 5, May-2016 40 ISSN 2278-7763
Copyright © 2016 SciResPub. IJOART
Figure 3: Market Road
Figure 4: Warri-Patani Road
E. RESULT ANALYSIS
Figure 5: Graph comparing pathloss for all the locations investigated based on
field data.
Figure 6: Graph comparing Pathloss based on field data with Pathloss based on both
models for Otovwodo Road.
0
20
40
60
80
100
120
140
0 200 400 600 800 1000 1200
Pat
hlo
ss (
dB
m)
Distance(m)
Pathloss for Otovwodo Road (dBm)
Pathloss for Market Road (dBm)
Pathloss for Warri-Patani Road (dBm)
0
20
40
60
80
100
120
140
0 200 400 600 800 1000 1200
Pat
hlo
ss (
dB
m)
Distance(m)
Field data Pathloss for Otovwodo Road (dBm)
Okumura-Hata model Pathloss for Otovwodo Road (dBm)
Free Space Pathloss for Otovwodo Road (dBm)
IJOART

International Journal of Advancements in Research & Technology, Volume 5, Issue 5, May-2016 41 ISSN 2278-7763
Copyright © 2016 SciResPub. IJOART
Figure 7: Graph comparing Pathloss based on field data with Pathloss based on both
models for Market Road.
Figure 8: Graph comparing Pathloss based on field data with Pathloss based on both
models for Warri-Patani Road.
0
20
40
60
80
100
120
140
0 200 400 600 800 1000 1200
Pat
hlo
ss (
dB
m)
Distance (m)
Field data Pathloss for Warri-Patani Road (dBm)
Okumura-Hata model Pathloss for Warri-Patani Road (dBm)
Free Space Pathloss for Warri-Patani Road (dBm)
0
20
40
60
80
100
120
140
0 200 400 600 800 1000 1200
Pat
hlo
ss(d
Bm
)
Distance (m)
Field data Pathloss for Market Road (dBm)
Okumura-Hata model Pathloss for Market Road (dBm)
Free Space Pathloss for Market Road (dBm)
IJOART
International Journal of Advancements in Research & Technology, Volume 5, Issue 5, May-2016 42 ISSN 2278-7763
Copyright © 2016 SciResPub. IJOART
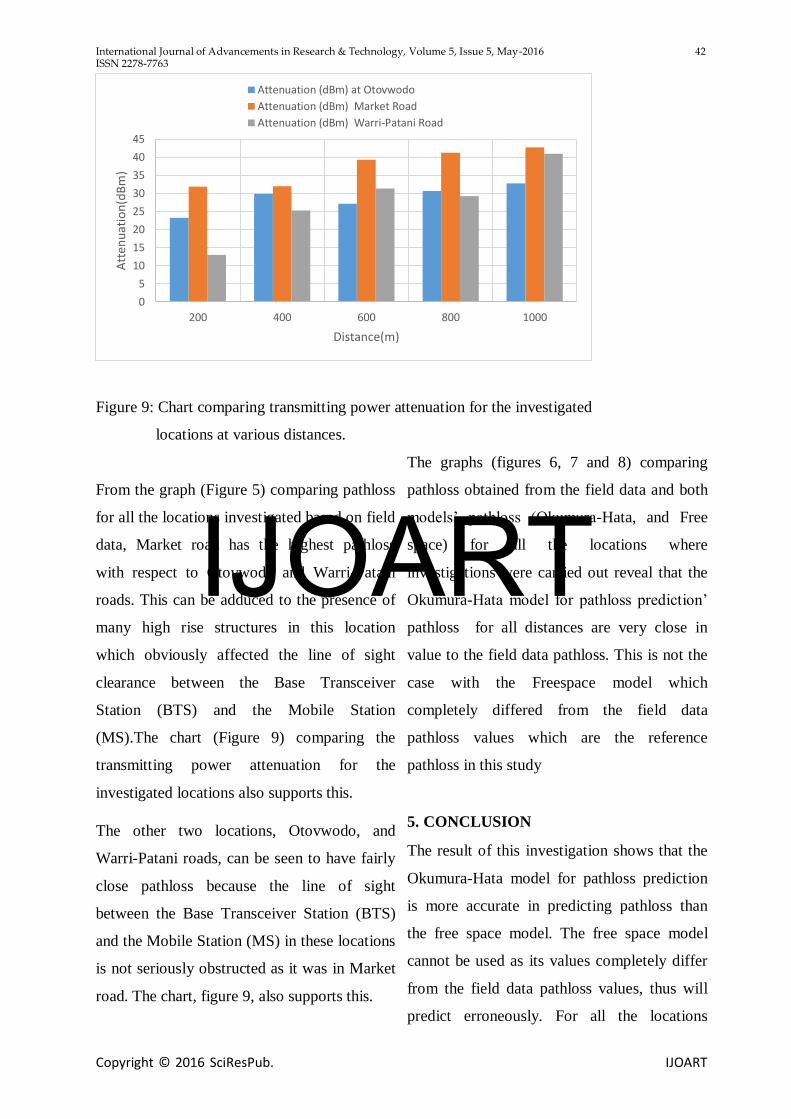
Figure 9: Chart comparing transmitting power attenuation for the investigated
locations at various distances.
From the graph (Figure 5) comparing pathloss
for all the locations investigated based on field
data, Market road has the highest pathloss
with respect to Otovwodo and Warri-Patani
roads. This can be adduced to the presence of
many high rise structures in this location
which obviously affected the line of sight
clearance between the Base Transceiver
Station (BTS) and the Mobile Station
(MS).The chart (Figure 9) comparing the
transmitting power attenuation for the
investigated locations also supports this.
The other two locations, Otovwodo, and
Warri-Patani roads, can be seen to have fairly
close pathloss because the line of sight
between the Base Transceiver Station (BTS)
and the Mobile Station (MS) in these locations
is not seriously obstructed as it was in Market
road. The chart, figure 9, also supports this.
The graphs (figures 6, 7 and 8) comparing
pathloss obtained from the field data and both
models’ pathloss (Okumura-Hata, and Free
space) for all the locations where
investigations were carried out reveal that the
Okumura-Hata model for pathloss prediction’
pathloss for all distances are very close in
value to the field data pathloss. This is not the
case with the Freespace model which
completely differed from the field data
pathloss values which are the reference
pathloss in this study
5. CONCLUSION
The result of this investigation shows that the
Okumura-Hata model for pathloss prediction
is more accurate in predicting pathloss than
the free space model. The free space model
cannot be used as its values completely differ
from the field data pathloss values, thus will
predict erroneously. For all the locations
0
5
10
15
20
25
30
35
40
45
200 400 600 800 1000
Att
enu
atio
n(d
Bm
)
Distance(m)
Attenuation (dBm) at Otovwodo
Attenuation (dBm) Market Road
Attenuation (dBm) Warri-Patani Road
IJOART

International Journal of Advancements in Research & Technology, Volume 5, Issue 5, May-2016 43 ISSN 2278-7763
Copyright © 2016 SciResPub. IJOART
where this study was conducted, the difference
in pathloss between field data pathloss and
both models’ are: 0.77dBm for Okumura-
Hata, and 32.11dBm for Free Space at
Otovwodo road, 7.05dBm for Okumura-Hata,
and 41.04dBm for Free Space at Market road,
and 2.59dBm for Okumura-Hata,and
31.57dBm for Free Space at Warri-Patani
road. This clearly shows that pathloss
prediction using the Free Space model will be
inaccurate.
REFERENCES
[1] N.T Surajudeen Bakinde, N. Faruk,
A.A Ayeni, and M.Y Muhammad, M.I
Gummel (2012): Comparison of
propagation models for GSM 1800 and
WCDMA systems in selected Urban Areas
of Nigeria. International Journal of
Applied information System, Foundation
of computer Science FCS, New York,
USA, Volume 2-No 17, May2012.
[2] Zia Nadir, Muhammad Idress Ahmad
Pathloss determination Using Okumura-
Hata Model and Cubic Regression for
Missing Data for Oman.
[3] M. Ekpeyong, J. Isabona, E.Ekong.
(2010): Propagation Pathloss Models for
3-G Based Wireless Networks: A
Comparative Analysis. Gorgian Electronic
Scientific Journal: Computer Science and
Telecommunications, No.2 Vol 25.
[4] O. Shoewu, and O.F Edeko (2011):
Analysis of Radio Wave Propagation in
Lagos Environs. American Journal of
Scientific and Industrial Research, 2(3),
2011, 2011, 438-455.
[5] N.Rakesh and Dr S.K Srivatsa (2011): A
Comprehensive investigation on SIP
Protocol. CiiT international Journal of
Networking and communication
Engineering, Vol3, No.9, July2011,
pp593-597.
[6] N. Rakesh and Dr S.K Srivastava (2012):
An Investigation on Propagation Pathloss
in Urban Environments for various
Models at Transmitter Antenna Height of
50m and receiver Antenna Height of 10m,
15m and 20m respectively. International
Journal of Research and Reviews in
Computer Science.Vol.3, No.4, pp 1761-
1767, August 2012.
[7] S.R Saunders, M.Hata (1980): Empirical
formula for Propagation loss in Land
mobile Radio Services. IEEE Transactions
on Vehicular Technology. Vol.VT 29
August 1980, pp317-325.
[8] Z. Nadir, N. Elfadhil, and F. Touati
(2000) :Pathloss determination using
Okumura-Hata model and Spline
interpolation for missing data for Oman
.World congress on engineering,
IAENG-WCE 2008,imperial College,
London, United kingdom, 2-4
July,2008pp 422-425.
[9] S.Y Seidel and T.S Rappaport (1994): Site
Specific propagation prediction for
wireless in-building personal
communication system design. IEEE
Trans, Veh Tchnol,vol 43,pp 879-894,Nov
1994
[10] V.H, MacDonald (1979): The cellular
concept. The Bell Systems Technical
Journal, vol.58, no.,pp 15-
43,January,1979.
[11] A. Medeisis and A.Kajackas (2000): The
Use of the Universal Okumura-Hata
propagation Prediction Model in Rural
Areas. Vehicular Technology Conference
Proceedings, VTC Tokyo, Vol 3, pp 1815-
1818, May 2000.
[12] COST 231,Urban Transmission Loss
Models for Mobile Radio in Mobile Radio
in 900MHZ and 1800MHZ bands, COST
231TD (90) 119 Rev 2. The Hague
Netherland, 1991
IJOART

International Journal of Advancements in Research & Technology, Volume 5, Issue 5, May-2016 44 ISSN 2278-7763
Copyright © 2016 SciResPub. IJOART
[13] http//www.breezecom.com
IJOART


![Leader Lsg-359 Swemar Sweeper Marker-generator 1-1500mhz [ET]](https://img.pdfslide.net/doc/110x75/54f6721b4a7959123e8b4725/leader-lsg-359-swemar-sweeper-marker-generator-1-1500mhz-et.jpg)