Embed Size (px)
Citation preview
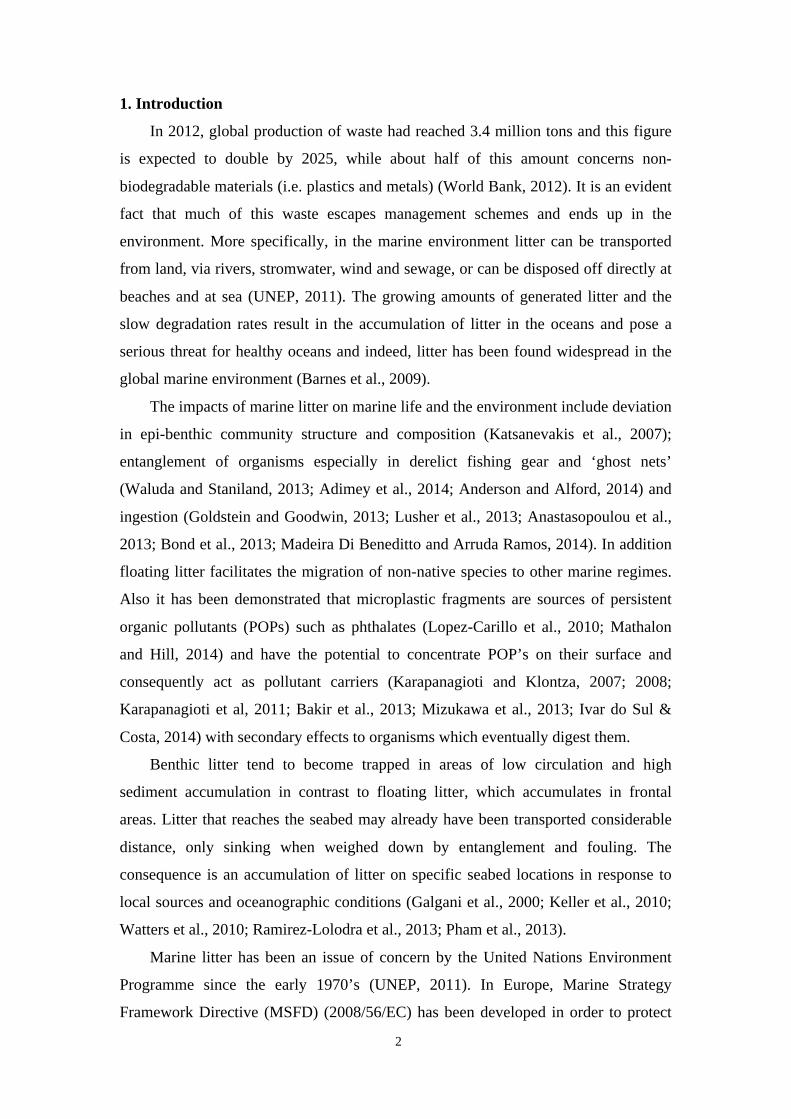
1
Please note that this is an author-produced PDF of an article accepted for publication following peer review. The definitive publisher-authenticated version is available on the publisher Web site.
Marine Pollution Bulletin December 2014, Volume 89 Issue 1-2 Pages 296-304 http://dx.doi.org/10.1016/j.marpolbul.2014.09.044 http://archimer.ifremer.fr/doc/00251/36179/ © 2014 Elsevier Ltd. All rights reserved.
Achimer http://archimer.ifremer.fr
A comparative study of marine litter on the seafloor of coastal areas in the Eastern Mediterranean and Black Seas
Ioakeimidis C. 1, 2, * , Zeri C. 1, Kaberi H. 1, Galatchi M. 3, Antoniadis K. 4, Streftaris N. 1, Galgani Francois 5, Papathanassiou E. 1, Papatheodorou G. 2
1 Hellen Ctr Marine Res, Inst Oceanog, Anavyssos 19013, Greece. 2 Univ Patras, Dept Geol, Lab Marine Geol & Phys Oceanog, Patras 26500, Greece. 3 Natl Inst Marine Res & Dev Grigore Antipa Constan, RO-900581 Constanta, Romania. 4 Dept Fisheries & Marine Res, Marine Environm Div, CY-1416 Nicosia, Cyprus. 5 Inst Francais Rech Exploitat Mer, LER PAC Corse, F-20600 Bastia, France.
Corresponding author : C. Ioakeimidis, Tel.: +30 22910 76370 ; email address : [email protected]
Abstract : In the present work, abundance, spatial distribution and qualitative composition, of benthic marine litter, were investigated in five study areas from the Eastern Mediterranean and Black Seas (Saronikos, Patras and Echinades Gulfs; Limassol Gulf; Constanta Bay). Surveys were performed using the monitoring protocol proposed by the Technical Group for Marine Litter. Densities ranged from 24 items/km(2) to 1211 items/km(2), with the Saronikos Gulf being the most affected area. Plastics were predominant in all study areas ranging from 45.2% to 95%. Metals and Glass/Ceramics reached maximum values of 21.9% and of 22.4%. The size distribution of litter items showed that >= 50% fall into medium size categories (10 x 10 cm, 20 x 20 cm) along with an elevated percentage of small-sized (<5 x 5 cm) plastic litter items. The comparative analysis of the data highlighted the dependence of the marine litter problem on many local factors (human sources and oceanographic conditions) and the urgent need for specific actions.
Highlights
► Benthic marine litter was investigated in the Mediterranean and Black Seas. ► More polluted area was Saronikos Gulf (Greece): 1211 items/km2. ► Less polluted area was Limassol Gulf (Cyprus): 24 items/km2. ► Plastics were the most abundant marine litter type in all study areas; up to 95%. ► More than half of marine litter items were of medium size: 10 × 10 cm, <20 × 20 cm.
Keywords : Litter, Benthic, Pollution, Eastern Mediterranean, Black Sea
2
1. Introduction
In 2012, global production of waste had reached 3.4 million tons and this figure
is expected to double by 2025, while about half of this amount concerns non-
biodegradable materials (i.e. plastics and metals) (World Bank, 2012). It is an evident
fact that much of this waste escapes management schemes and ends up in the
environment. More specifically, in the marine environment litter can be transported
from land, via rivers, stromwater, wind and sewage, or can be disposed off directly at
beaches and at sea (UNEP, 2011). The growing amounts of generated litter and the
slow degradation rates result in the accumulation of litter in the oceans and pose a
serious threat for healthy oceans and indeed, litter has been found widespread in the
global marine environment (Barnes et al., 2009).
The impacts of marine litter on marine life and the environment include deviation
in epi-benthic community structure and composition (Katsanevakis et al., 2007);
entanglement of organisms especially in derelict fishing gear and ‘ghost nets’
(Waluda and Staniland, 2013; Adimey et al., 2014; Anderson and Alford, 2014) and
ingestion (Goldstein and Goodwin, 2013; Lusher et al., 2013; Anastasopoulou et al.,
2013; Bond et al., 2013; Madeira Di Beneditto and Arruda Ramos, 2014). In addition
floating litter facilitates the migration of non-native species to other marine regimes.
Also it has been demonstrated that microplastic fragments are sources of persistent
organic pollutants (POPs) such as phthalates (Lopez-Carillo et al., 2010; Mathalon
and Hill, 2014) and have the potential to concentrate POP’s on their surface and
consequently act as pollutant carriers (Karapanagioti and Klontza, 2007; 2008;
Karapanagioti et al, 2011; Bakir et al., 2013; Mizukawa et al., 2013; Ivar do Sul &
Costa, 2014) with secondary effects to organisms which eventually digest them.
Benthic litter tend to become trapped in areas of low circulation and high
sediment accumulation in contrast to floating litter, which accumulates in frontal
areas. Litter that reaches the seabed may already have been transported considerable
distance, only sinking when weighed down by entanglement and fouling. The
consequence is an accumulation of litter on specific seabed locations in response to
local sources and oceanographic conditions (Galgani et al., 2000; Keller et al., 2010;
Watters et al., 2010; Ramirez-Lolodra et al., 2013; Pham et al., 2013).
Marine litter has been an issue of concern by the United Nations Environment
Programme since the early 1970’s (UNEP, 2011). In Europe, Marine Strategy
Framework Directive (MSFD) (2008/56/EC) has been developed in order to protect
3
the marine environment as well as to ensure its sustainable use. The ultimate goal of
MSFD is the achievement of Good Environmental Status (GES) for the marine
environment and the Clean Seas by 2020, by the Member States. MSFD is based on
eleven Descriptors and sets targets for each Descriptor that should be met in order to
achieve the GES. Marine litter is addressed as Descriptor 10: “Properties and
quantities of marine litter do not cause harm to the coastal and marine environment”.
A first step to understanding and alleviating the problem of marine litter is to
quantify the existing amounts. Especially for the implementation of the MSFD, this
information is urgently needed for setting the targets of Descriptor 10 – Marine Litter.
Information on marine litter quantities and distribution in the Mediterranean Sea is
still fragmented and its impacts on the marine ecosystem have not been properly
addressed. To date, systematic studies dealing with benthic litter have focused on the
western Mediterranean Sea (Galgani et al., 1995; 1996; 2000; Ramirez-Llodra et al.,
2013; Pham et al., 2013) while for the eastern Mediterranean Sea relevant information
covers only few geographical areas (Galil et al., 1995; Koutsodendritis et al., 2008;
Stefatos et al., 1999; Katsanevakis and Katsarou, 2004; Sanchez et al., 2013). In the
Black Sea, only one reported work deals with the occurrence and distribution of
benthic litter on the western continental shelf in the vicinity of Bosphorus Straits
(Topçu and Oztürk, 2010). Therefore, more efforts are needed in order to resolve
many scientific questions and to provide the stakeholders on the regional and national
levels, with the appropriate information and knowledge.
The objective of this study is to determine the abundance, spatial distribution and
qualitative composition of benthic marine litter as well as to investigate the factors
affecting benthic litter accumulation and distribution (external sources vs internal
transport mechanisms) in five selected study areas in the Eastern Mediterranean
(Saronikos, Echinades, Patras Gulfs in Greece, Limassol Gulf in Cyprus) and Black
Seas (Constanta Bay in Romania). The monitoring protocol proposed by the
Technical Group on Marine Litter was applied throughout our surveys (Galgani et al.,
2013(b)). Up to our knowledge, this is the first comparative study on benthic marine
litter including several coastal areas in the interconnected Eastern Mediterranean and
Black Seas. In particular for three of our study areas (Saronikos Gulf, Limassol Gulf,
Constanta Bay), the present work provides the first recorded data on benthic marine
litter.
4
2. Study Areas
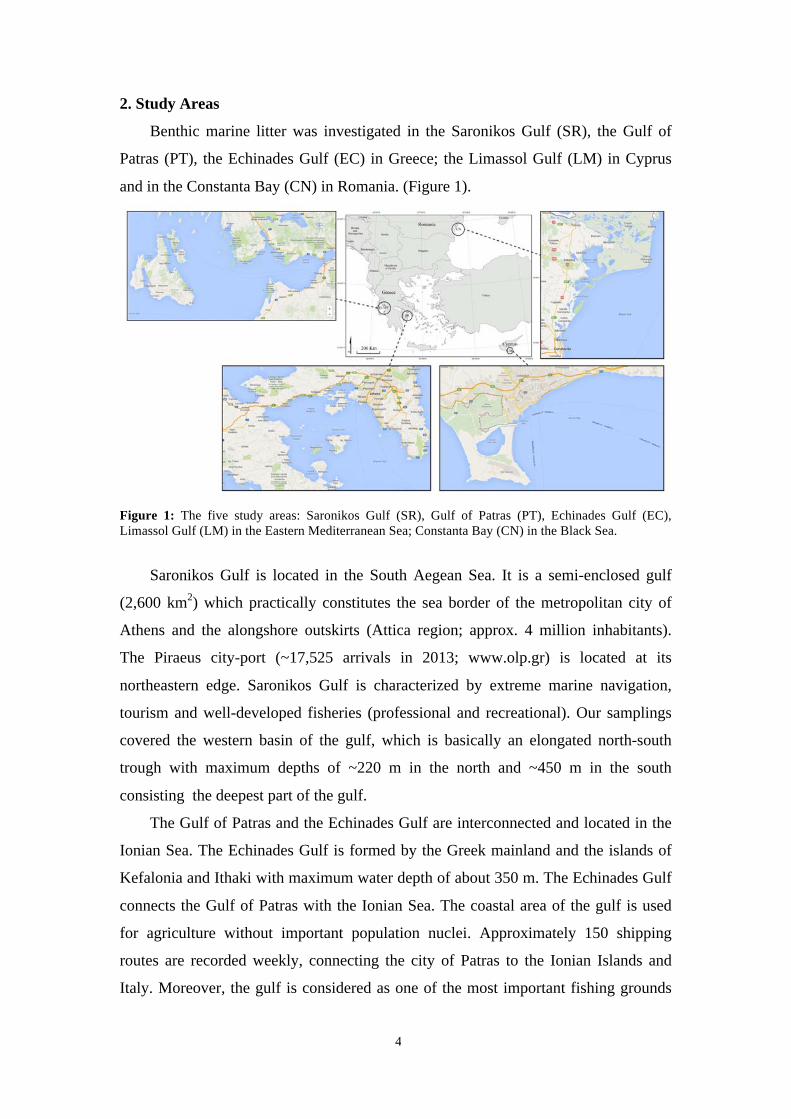
Benthic marine litter was investigated in the Saronikos Gulf (SR), the Gulf of
Patras (PT), the Echinades Gulf (EC) in Greece; the Limassol Gulf (LM) in Cyprus
and in the Constanta Bay (CN) in Romania. (Figure 1).
Figure 1: The five study areas: Saronikos Gulf (SR), Gulf of Patras (PT), Echinades Gulf (EC), Limassol Gulf (LM) in the Eastern Mediterranean Sea; Constanta Bay (CN) in the Black Sea.
Saronikos Gulf is located in the South Aegean Sea. It is a semi-enclosed gulf
(2,600 km2) which practically constitutes the sea border of the metropolitan city of
Athens and the alongshore outskirts (Attica region; approx. 4 million inhabitants).
The Piraeus city-port (~17,525 arrivals in 2013; www.olp.gr) is located at its
northeastern edge. Saronikos Gulf is characterized by extreme marine navigation,
tourism and well-developed fisheries (professional and recreational). Our samplings
covered the western basin of the gulf, which is basically an elongated north-south
trough with maximum depths of ~220 m in the north and ~450 m in the south
consisting the deepest part of the gulf.
The Gulf of Patras and the Echinades Gulf are interconnected and located in the
Ionian Sea. The Echinades Gulf is formed by the Greek mainland and the islands of
Kefalonia and Ithaki with maximum water depth of about 350 m. The Echinades Gulf
connects the Gulf of Patras with the Ionian Sea. The coastal area of the gulf is used
for agriculture without important population nuclei. Approximately 150 shipping
routes are recorded weekly, connecting the city of Patras to the Ionian Islands and
Italy. Moreover, the gulf is considered as one of the most important fishing grounds
5
and aquaculture of the Ionian Sea. A major river, Acheloos River, flows to the
Echinades Gulf with an average annual flow of about 7,800x106 m3 of water. The
Gulf of Patras constitutes a relatively shallow (max 150m depth), semi-enclosed gulf
(400 km2), to the east of the Echinades Gulf. The coasts around the Gulf of Patras are
urbanized (the city of Patras hosts ~250,000 inhabitants); marine navigation (Patras
port ~1,923 arrivals in 2013; www.patrasport.gr), tourism and well-developed
professional and recreational fisheries are the major anthropogenic activities in the
gulf. River runoffs (Evinos River, Pyros and Glaucus torrents) have a small
contribution in total water transfer into the Gulf of Patras, but may have an important
contribution in solid waste transfer especially during heavy rain events.
Limassol Gulf in Cyprus is open to the Levantine Sea (Eastern Mediterranean
Sea). The greater Limassol area counts approx. 192,000 inhabitants (2011,
www.mof.gov.cy/cystat). Marine navigation is considered intense (Limassol port
3,430 vessel arrivals in 2013; www.cpa.gov.cy) while professional fisheries are
moderate. Limassol Gulf receives the effects of various kinds of pressures
(urbanization, tourism, commercial, industry, crafts, warehouses and aquaculture).
Constanta Bay is located in the NW Black Sea. It receives the impact of
Constanta city, the second biggest city in Romania (425,916 inhabitants – INSSE
2011) and also the most important urban center for the whole Romanian coastal zone.
The large protected deltaic zone, including the Danube Delta is located in the northern
Romanian coastal zone. Marine navigation is considered extreme due to the presence
of the port of Constanta (14,066 arrivals in 2013; www.portofconstantza.com), the
biggest port in the Black Sea. Professional and recreational fisheries are considered as
intense.
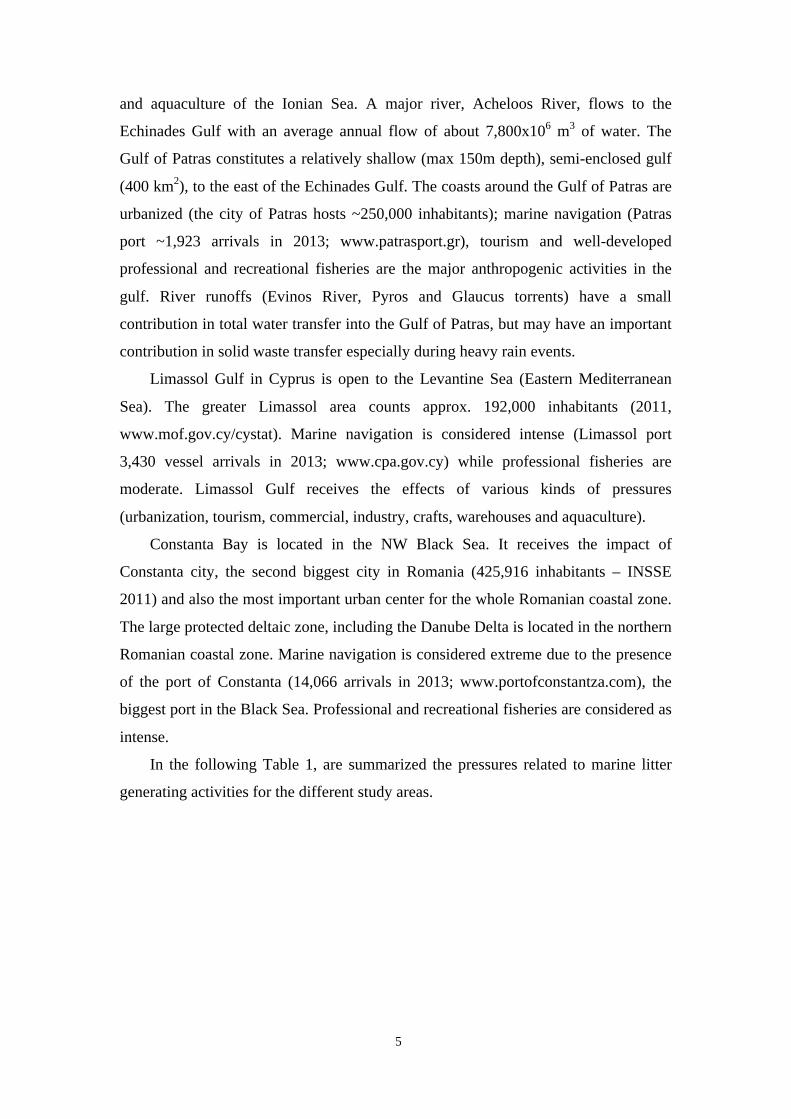
In the following Table 1, are summarized the pressures related to marine litter
generating activities for the different study areas.
6
Table 1: Summary of the various marine litter generation activities for the five study areas (SR, PT, EC, LM, CN).
Stud
y A
rea
Popu
latio
n (in
habi
tant
s)
Port
s / H
arbo
rs
Mar
ine
Tra
ffic
(a
rriv
als /
yr)
Mar
inas
, Sm
all p
orts
, Fi
shin
g Sh
elte
rs
Num
ber
of
Prof
essi
onal
Fis
hing
V
esse
ls
Riv
er R
unof
f (m
3 / y
r)
Gul
f Geo
mor
phol
ogy
SR 4,000,000 1 17,525 39 1,111 N/A* Semi-enclosed PT 250,000 1 1,923 7 400 1,000x106 Semi-enclosed EC 50,000 0 1,923 21 400 7,800x106 Open LM 101,000 1 3,430 4 365 11x106 Open CN 425,916 1 14,066 3 439 199,000x106 Open * Not available published data.
3. Methodology
3.1. Survey Design
Benthic marine litter items were collected in the selected areas (SR, PT, EC, LM,
CN) during the period January to March 2013. In the Mediterranean Sea (SR, PT, EC,
LM) marine litter items were collected by professional trawlers. For each study-area,
marine litter was collected by the same trawler in order to ensure data homogeneity
and quality control. In the Black Sea (CN) marine litter items were collected by the
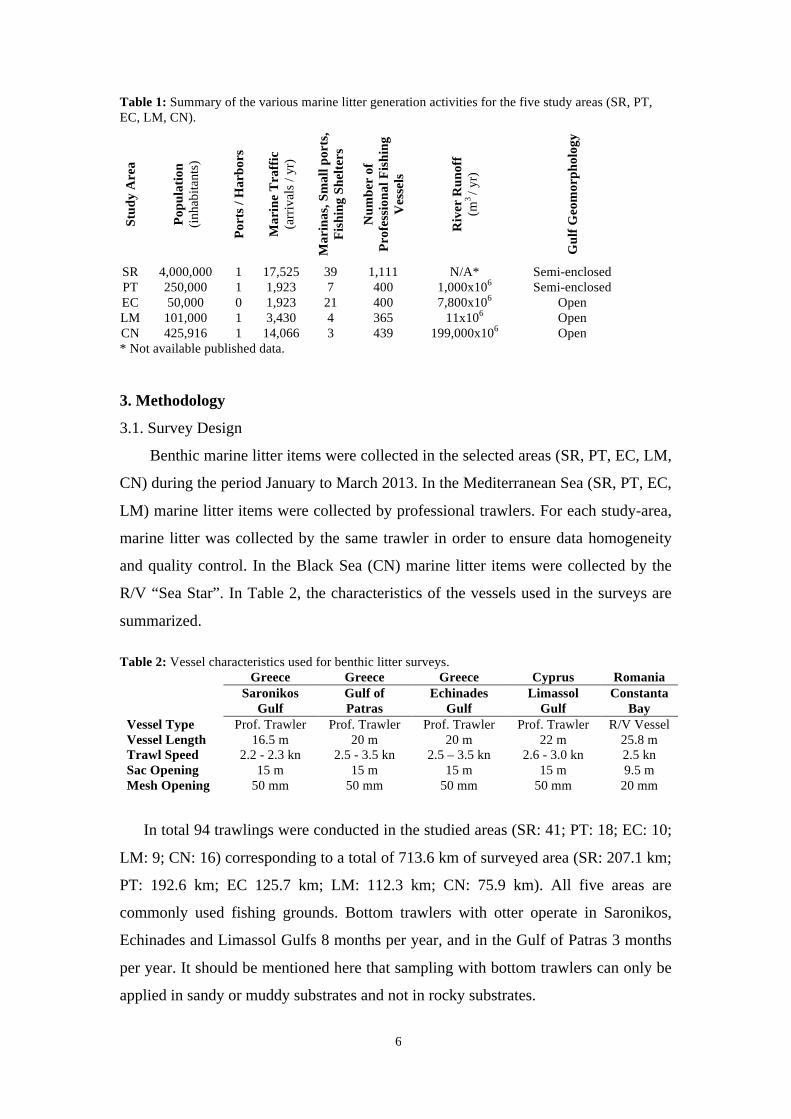
R/V “Sea Star”. In Table 2, the characteristics of the vessels used in the surveys are
summarized. Table 2: Vessel characteristics used for benthic litter surveys.
Greece Greece Greece Cyprus Romania Saronikos
Gulf Gulf of Patras
Echinades Gulf
Limassol Gulf
Constanta Bay
Vessel Type Prof. Trawler Prof. Trawler Prof. Trawler Prof. Trawler R/V Vessel Vessel Length 16.5 m 20 m 20 m 22 m 25.8 m Trawl Speed 2.2 - 2.3 kn 2.5 - 3.5 kn 2.5 – 3.5 kn 2.6 - 3.0 kn 2.5 kn Sac Opening 15 m 15 m 15 m 15 m 9.5 m Mesh Opening 50 mm 50 mm 50 mm 50 mm 20 mm
In total 94 trawlings were conducted in the studied areas (SR: 41; PT: 18; EC: 10;
LM: 9; CN: 16) corresponding to a total of 713.6 km of surveyed area (SR: 207.1 km;
PT: 192.6 km; EC 125.7 km; LM: 112.3 km; CN: 75.9 km). All five areas are
commonly used fishing grounds. Bottom trawlers with otter operate in Saronikos,
Echinades and Limassol Gulfs 8 months per year, and in the Gulf of Patras 3 months
per year. It should be mentioned here that sampling with bottom trawlers can only be
applied in sandy or muddy substrates and not in rocky substrates.
7
3.2. Data Collection
Marine litter items collected from each trawl were separately stored in bags and
all the corresponding trawling characteristics were recorded (GPS positioning data,
cruise speed, sac opening, date, place). Each bag was weighted and then marine litter
items were sorted and classified according to the Master List of categories of the
guidance document (TGML/JRC) (Galgani et al., 2013(b)). The basic material types
are as follows: i) plastic, ii) metal, iii) rubber, iv) glass/ceramics, v) natural products
and vi) miscellaneous with a total of thirty-nine (39) subcategories. Classification was
also conducted according to six successive size categories: i) <5x5 cm, ii) <10x10 cm,
iii) <20x20 cm, iv)<50x50 cm, v) <100x100 cm, vi) >100x100 cm. Each category
refers to the surface area of each item, estimated visually. The small items (<5x5 cm),
whose size was equal to the mesh size, were found entangled with other larger items.
These small sized items were counted as part of the sample but it is very likely that
are underestimated as more of them might be present on the sea floor and pass
through the net. Naturally occurring items such as seaweed and driftwood particles
were excluded from the recordings and differentiated from the natural products
category, which actually refers to processed materials.
Density values (items/km2) were calculated using the total distance covered
during the trawling (detailed GPS spotting) multiplied by the opening of the mouth of
the trawling sac.
4. Results
4.1. Marine litter abundance and spatial distribution
In total 5,398 marine litter items (Table 3) were collected from all the study areas
(SR: 3,269; PT: 1,293; EC: 580; LM: 46; CN: 210). In the Saronikos Gulf were
recorded on average 80 items/ trawl (22 - 176 items/trawl), in the Gulf of Patras 72
items/trawl (6 - 202 items/trawl) and in the Echinades Gulf 58 items/trawl (6 - 101
items/trawl). On average, 5 items/trawl were recorded in Limassol Gulf, two trawls
were litter free and the rest of the recordings ranged from 1 to 18 items/trawl. Lastly,
in Constanta Bay 13 items/trawl (1 - 48 items/trawl) were recorded. On average, 352
kg of marine litter were collected in Saronikos Gulf; 369 kg in the Gulf of Patras; 75
kg in the Echinades Gulf; 15 kg in the Limassol Gulf and 87 kg in Constanta Bay.
These amounts correspond to: 2.5-26.8 kg/trawl in Saronikos Gulf, 2.1-56.5 kg/trawl
in the Gulf of Patras, 1.6-24.5 kg/trawl in Echinades Gulf, 0.2-8.6 kg/trawl in
8
Limassol Gulf with two trawls being litter-free and 0.8-23.5 kg/trawl in Constanta
Bay.
Mean marine litter density was calculated for each study area. The highest
density was found in the Saronikos Gulf (1,211±594 items/km2), almost half the
density was found in the Gulf of Patras (641±579 items/km2), followed by the
Echinades Gulf (416±379 items/km2), the Constanta Bay (291±237 items/km2) and
the Limassol Gulf (24±28 items/km2). In Figure 2, trawling transects are plotted
according to marine litter density (items/km2); so that the thickness of the transect
lines is proportional to marine litter density (items/km2). In this way marine litter
accumulation can be visualized with detail relatively to its spatial distribution and the
corresponding trawling length. Although the trawling samplings were concentrated on
the fishing grounds on the gulfs and thus not distributed randomly, some general
spatial trends can be inferred. In the Saronikos Gulf high marine litter average
densities were equally distributed at all sampled isobaths (50m: 1145 items/km2;
200m: 1096 items/km2; 250m: 1423 items/km2; 300m: 979 items/km2; 350m: 1182
items/km2) without any particular distribution pattern. The variation observed in the
thickness of the lines (Figure 2a) in the Saronikos Gulf is related to the fact that in
many cases trawlings were conducted at the same area within one-day time lag. The
majority of litter was collected during the first samplings while the short time lag did
not permit the accumulation of ‘new’ litter.
9
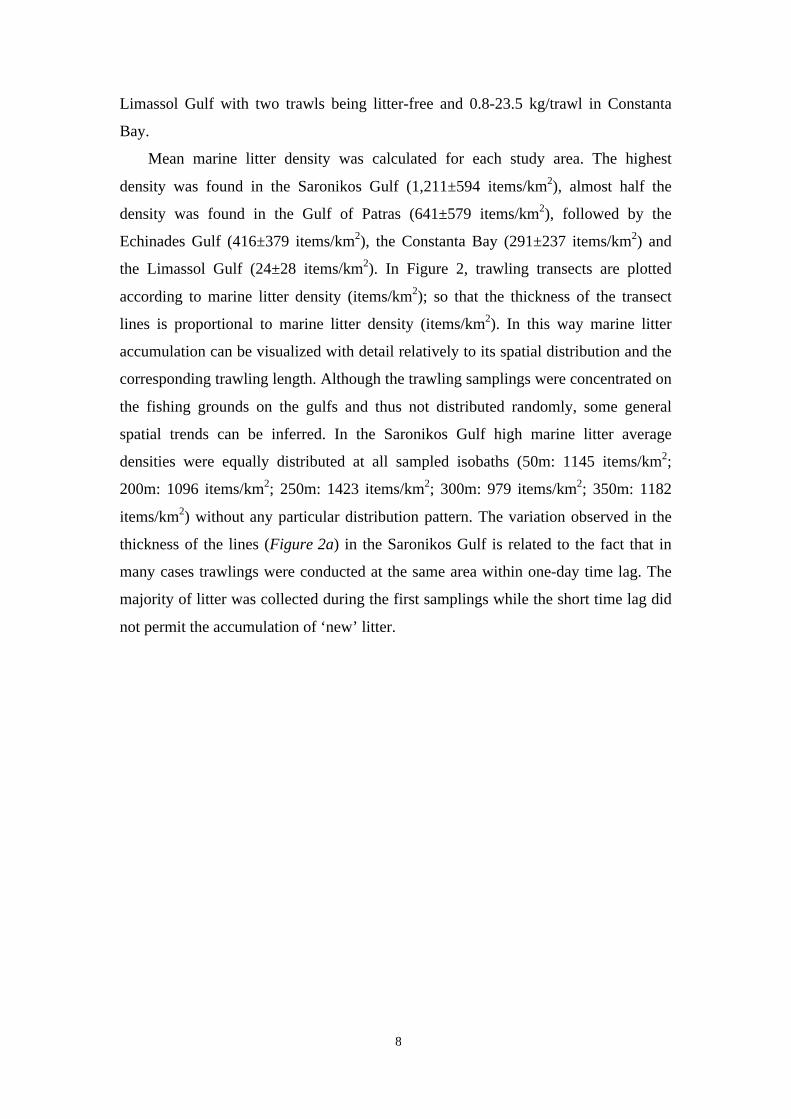
Figure 2: Marine Litter density (items/km2) in Saronikos Gulf (A), Echinades Gulf (B), Gulf of Patras (C), Limassol Gulf (D), Constanta Bay (E). Line positioning correspond to the trawling transect; line thickness to marine litter density.
In the Echinades Gulf the highest densities (880 items/km2 on average) were
recorded close to the coast and the Acheloos River mouth at depths of about 50m,
falling to approximately 300 items/km2 at the 100 m, 150 m and 200 m isobaths. In
the Gulf of Patras a reverse pattern can be observed with relatively lower densities
(average 440 items/km2) close to the city of Patras at the 50 m isobath and almost
twice higher (average 893 items/km2) in the deeper parts of the gulf (100 m depth).
Also in the Limassol Gulf, the highest litter densities, reaching 84 items/km2, were
found in the deeper parts. Finally, in Constanta Bay we recorded the highest density
(1068 items/km2) in front of the Danube mouth, whereas no consistent distribution
pattern in relation to depth was observed since all the samplings were conducted on
the shelf (at depths <60m).
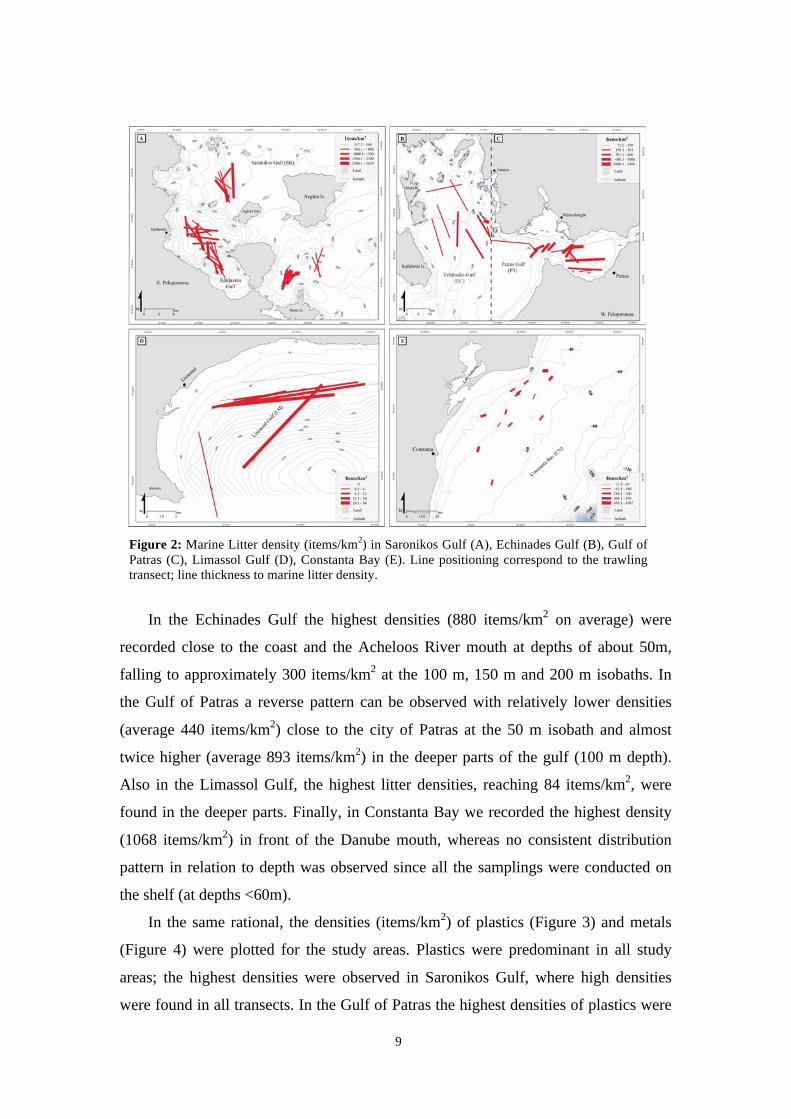
In the same rational, the densities (items/km2) of plastics (Figure 3) and metals
(Figure 4) were plotted for the study areas. Plastics were predominant in all study
areas; the highest densities were observed in Saronikos Gulf, where high densities
were found in all transects. In the Gulf of Patras the highest densities of plastics were
10
observed in transects that were adjacent to the city of Patras. In Limassol Gulf the
high plastic densities were observed in the deepest transects while in Constanta Bay
the highest densities were observed at two transects closer to the Danube Delta.
Figure 3: Densities (items/km2) of plastic marine litter in Saronikos Gulf (A), Echinades
Gulf (B), Gulf of Patras (C), Limassol Gulf (D) and Constanta Bay (E). Line positioning
corresponds to the trawling transect and the color scale to the density range.
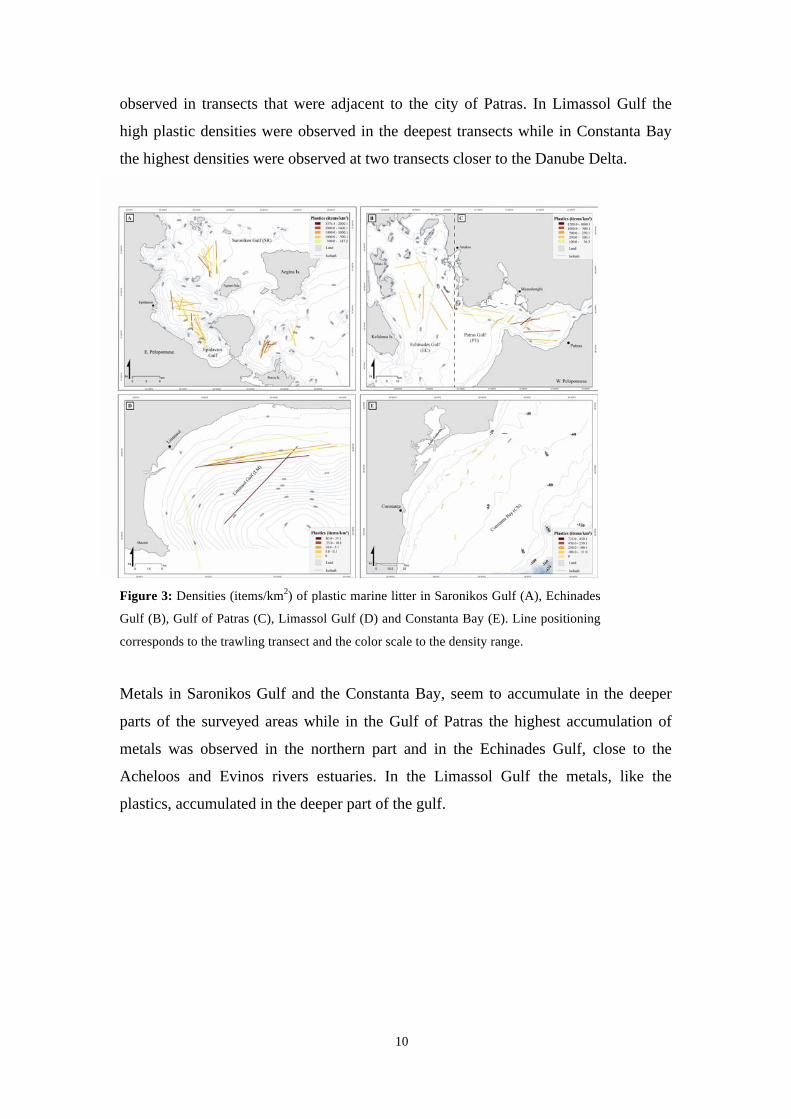
Metals in Saronikos Gulf and the Constanta Bay, seem to accumulate in the deeper
parts of the surveyed areas while in the Gulf of Patras the highest accumulation of
metals was observed in the northern part and in the Echinades Gulf, close to the
Acheloos and Evinos rivers estuaries. In the Limassol Gulf the metals, like the
plastics, accumulated in the deeper part of the gulf.
11
Figure 4: Densities (items/km2) of metal marine litter items in Saronikos Gulf (A),
Echinades Gulf (B), Gulf of Patras (C), Limassol Gulf (D) and Constanta Bay (E). Line
positioning correspond to the trawling transect; and the color scale to the density range.
4.2. Marine litter composition
In Table 3 the percentage contribution of each marine litter category of the
Master List (TGML/JRC) is presented for the five studied areas.
Table 3: Composition (%) of marine litter in the five study areas.
% Saronikos Gulf (SR)
Gulf of Patras (PT)
Echinades Gulf (EC)
Limassol Gulf (LM)
Constanta Bay (CN)
A. Plastics 95.0±11.9 59.9±9.2 67.4±7.7 67.4±14.4 45.2±4.8 A1. Bottles 10.1 8.9 16.5 6.5 14.3 A2. Sheets 31.1 5.3 3.3 2.2 5.2 A3. Bags 36.5 34.0 27.1 54.3 12.9 A4. Caps/Lids 0.2 0.0 0.9 0.0 2.4 A5. Fishing Line (Monofilament)
0.3 0.9 0.7 0.0 5.2
A6. Fishing Line (Entangled)
5.0 4.9 5.9 0.0 0.0
A7. Synthetic Rope 5.4 0.5 0.2 0.0 1.9 A8. Fishing Net 3.9 1.2 0.5 0.0 2.4 A9. Cable Ties 0.1 0.0 0.0 0.0 0.0 A10. Strapping Bands 0.0 0.0 0.0 0.0 0.0 A11. Crates / Containers 0.0 3.8 11.0 0.0 0.5 A12. Diapers 0.0 0.0 0.0 0.0 0.0 A13. Sanitary towel /Tampon
0.0 0.0 0.0 0.0 0.5
A14. Other... 2.4 0.5 1.4 4.3 0.0
12
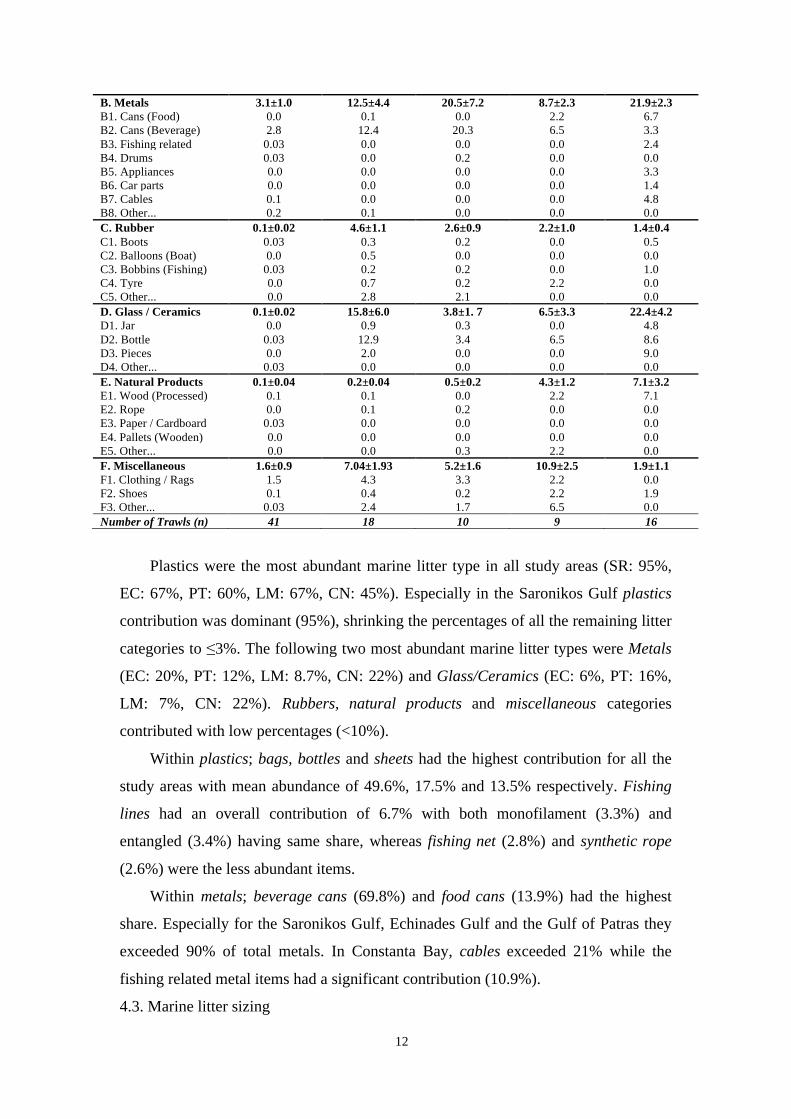
B. Metals 3.1±1.0 12.5±4.4 20.5±7.2 8.7±2.3 21.9±2.3 B1. Cans (Food) 0.0 0.1 0.0 2.2 6.7 B2. Cans (Beverage) 2.8 12.4 20.3 6.5 3.3 B3. Fishing related 0.03 0.0 0.0 0.0 2.4 B4. Drums 0.03 0.0 0.2 0.0 0.0 B5. Appliances 0.0 0.0 0.0 0.0 3.3 B6. Car parts 0.0 0.0 0.0 0.0 1.4 B7. Cables 0.1 0.0 0.0 0.0 4.8 B8. Other... 0.2 0.1 0.0 0.0 0.0 C. Rubber 0.1±0.02 4.6±1.1 2.6±0.9 2.2±1.0 1.4±0.4 C1. Boots 0.03 0.3 0.2 0.0 0.5 C2. Balloons (Boat) 0.0 0.5 0.0 0.0 0.0 C3. Bobbins (Fishing) 0.03 0.2 0.2 0.0 1.0 C4. Tyre 0.0 0.7 0.2 2.2 0.0 C5. Other... 0.0 2.8 2.1 0.0 0.0 D. Glass / Ceramics 0.1±0.02 15.8±6.0 3.8±1. 7 6.5±3.3 22.4±4.2 D1. Jar 0.0 0.9 0.3 0.0 4.8 D2. Bottle 0.03 12.9 3.4 6.5 8.6 D3. Pieces 0.0 2.0 0.0 0.0 9.0 D4. Other... 0.03 0.0 0.0 0.0 0.0 E. Natural Products 0.1±0.04 0.2±0.04 0.5±0.2 4.3±1.2 7.1±3.2 E1. Wood (Processed) 0.1 0.1 0.0 2.2 7.1 E2. Rope 0.0 0.1 0.2 0.0 0.0 E3. Paper / Cardboard 0.03 0.0 0.0 0.0 0.0 E4. Pallets (Wooden) 0.0 0.0 0.0 0.0 0.0 E5. Other... 0.0 0.0 0.3 2.2 0.0 F. Miscellaneous 1.6±0.9 7.04±1.93 5.2±1.6 10.9±2.5 1.9±1.1 F1. Clothing / Rags 1.5 4.3 3.3 2.2 0.0 F2. Shoes 0.1 0.4 0.2 2.2 1.9 F3. Other... 0.03 2.4 1.7 6.5 0.0 Number of Trawls (n) 41 18 10 9 16
Plastics were the most abundant marine litter type in all study areas (SR: 95%,
EC: 67%, PT: 60%, LM: 67%, CN: 45%). Especially in the Saronikos Gulf plastics
contribution was dominant (95%), shrinking the percentages of all the remaining litter
categories to ≤3%. The following two most abundant marine litter types were Metals
(EC: 20%, PT: 12%, LM: 8.7%, CN: 22%) and Glass/Ceramics (EC: 6%, PT: 16%,
LM: 7%, CN: 22%). Rubbers, natural products and miscellaneous categories
contributed with low percentages (<10%).
Within plastics; bags, bottles and sheets had the highest contribution for all the
study areas with mean abundance of 49.6%, 17.5% and 13.5% respectively. Fishing
lines had an overall contribution of 6.7% with both monofilament (3.3%) and
entangled (3.4%) having same share, whereas fishing net (2.8%) and synthetic rope
(2.6%) were the less abundant items.
Within metals; beverage cans (69.8%) and food cans (13.9%) had the highest
share. Especially for the Saronikos Gulf, Echinades Gulf and the Gulf of Patras they
exceeded 90% of total metals. In Constanta Bay, cables exceeded 21% while the
fishing related metal items had a significant contribution (10.9%).
4.3. Marine litter sizing
13
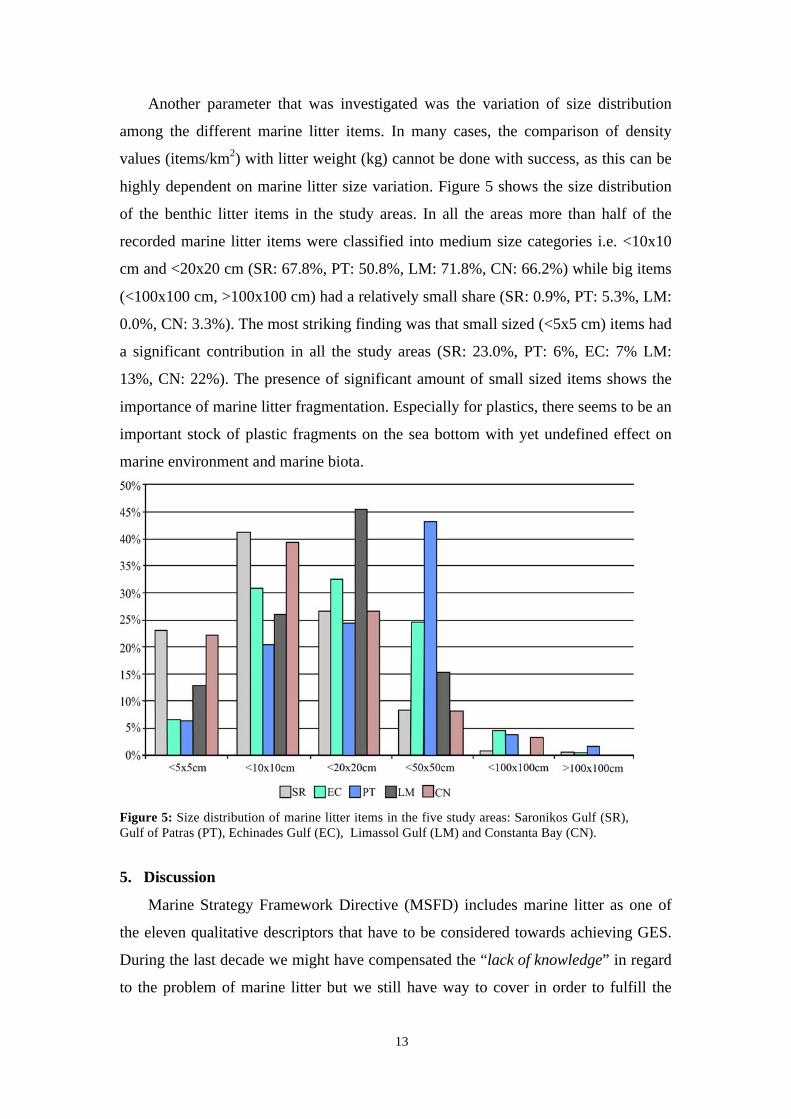
Another parameter that was investigated was the variation of size distribution
among the different marine litter items. In many cases, the comparison of density
values (items/km2) with litter weight (kg) cannot be done with success, as this can be
highly dependent on marine litter size variation. Figure 5 shows the size distribution
of the benthic litter items in the study areas. In all the areas more than half of the
recorded marine litter items were classified into medium size categories i.e. <10x10
cm and <20x20 cm (SR: 67.8%, PT: 50.8%, LM: 71.8%, CN: 66.2%) while big items
(<100x100 cm, >100x100 cm) had a relatively small share (SR: 0.9%, PT: 5.3%, LM:
0.0%, CN: 3.3%). The most striking finding was that small sized (<5x5 cm) items had
a significant contribution in all the study areas (SR: 23.0%, PT: 6%, EC: 7% LM:
13%, CN: 22%). The presence of significant amount of small sized items shows the
importance of marine litter fragmentation. Especially for plastics, there seems to be an
important stock of plastic fragments on the sea bottom with yet undefined effect on
marine environment and marine biota.
Figure 5: Size distribution of marine litter items in the five study areas: Saronikos Gulf (SR), Gulf of Patras (PT), Echinades Gulf (EC), Limassol Gulf (LM) and Constanta Bay (CN).
5. Discussion
Marine Strategy Framework Directive (MSFD) includes marine litter as one of
the eleven qualitative descriptors that have to be considered towards achieving GES.
During the last decade we might have compensated the “lack of knowledge” in regard
to the problem of marine litter but we still have way to cover in order to fulfill the
14
“lack of data”. The increased variability found in litter abundance and distribution
within each study area as well as among all five areas suggests that several factors
affect marine litter accumulation in the benthic environments. Furthermore this
observation underlines the importance of systematic monitoring programs in order to
acquire ‘sound’ information for setting the targets to GES.
The marine litter load for each survey area is expected to be affected by a series
of factors including; i) the proximity of big cities to our study areas, ii) the intensity of
marine traffic, iii) the riverine inputs into the sea and (v) the geomorphology of the
area (semi-enclosed vs open - shelf environment). Surprisingly, we did not find a
direct relationship of marine litter density with population density (Leite et al., 2014).
Although these two parameters showed the highest values in the Saronikos Gulf, in
Constanta Bay which is the second most populated area, marine litter density was
found lower than in the Gulf of Patras or the Echinades Gulf. Similarly, the increased
marine traffic reported for the Saronikos Gulf, Constanta Bay and Limassol Gulf is
not linearly reflected in the corresponding marine litter densities. Again the Gulf of
Patras and Echinades Gulf where the lowest ship arrivals per year are recorded
showed marine litter densities higher than those found in Constanta Bay or Limassol
Gulf. Concerning the importance of riverine outflows on marine litter input, it is
understood that Constanta Bay has by far the greatest influence as it is situated in the
vicinity of the Danube River delta. Nevertheless, our data from the five study areas
did not reflect the importance of Danube River as source of marine litter; in particular
the litter density close to the Danube river estuary was found comparable to those in
Echinades Gulf which is influenced by the Achelloos river outflow or Saronikos Gulf
and the Gulf of Patras. The fact that we recorded the maximum litter density, for this
area, in front of the Danube river mouth as well as some large metallic items such as
cables, car parts and appliances give us a hint that substantial amounts of marine litter
from land-based sources, transderred through the Danube River are not accumulated
on the shelf area. From the above it becomes clear that the external sources of litter
are not directly reflected on the benthic litter densities found in the five studied areas,
and transport processes taking place within the marine environment seem to be
equally important for marine litter redistribution on the sea bottom. For places such as
the Gulf of Lions, the Bay of Biscay and Monterey Bay (Galgani et al., 2000; Watters
et al., 2010; Schlining et al., 2013) it has been found that marine litter is transported
farthest from the shelf areas and accumulated in the deep canyons. It is possible that a
15
similar situation occurs in the Limassol Gulf where the deeper parts show somewhat
higher litter densities. Unfortunately, in Constanta Bay the maximum sampling depths
did not exceed 60m so we cannot test this hypothesis. As already mentioned the Gulf
of Patras and Echinades Gulf show marine litter densities higher than expected based
on the population density, marine traffic and riverine outflows. We believe that in this
case the enclosed character of the gulfs and the relatively steep bottom topography
favor the accumulation of litter there. This could be also the case for the Saronikos
Gulf, where only the deepest western basin of the gulf was sampled. According to
Kontoyiannis (2008) an anti-cyclonic surface water circulation is dominant most of
the year, so it is possible that surface litter is transferred towards the western basin
where it is trapped and eventually loses its buoyancy through entanglement and
fouling and settles. So, the maximum litter densities recorded in the western basin of
the Saronikos Gulf could be due to the combined effect of important sources (such as
population, tourism and marine traffic) and transport processes.
A way to discern the importance of direct litter sources vs transport mechanisms
is to look for the specific types of litter settled in a certain location. Clear linking is
not always possible and in many cases it is very subjective. Nevertheless, there are
certain marine litter types that linking to sources can be objective, i.e. fisheries related
items (monofilament and entangled fishing lines, synthetic ropes, fishing nets, fishing
gear, boots, bobbins and tyres re-used as fishing boat fenders). Among our study
areas, the Saronikos Gulf had the highest link to fisheries marine litter sources
(14.8%) followed by Constanta Bay (13.3%), the Gulf of Patras (8.7%), Echinades
Gulf (7.8%) and Limassol Gulf (2.2%) (Figure 6). These findings are in accordance
with the number of professional fishing boats recorded for the studied areas (Table 1).
Fisheries related items were relatively low in the present study compared to the high
average of 40% or the extreme of 65% in the Celtic Shelf (Galgani et al., 2000). Some
researchers (Horsman, 1982; Moore and Allen, 2000; Stefatos et al., 1999;
Koutsodendris et al., 2008) have suggested that metal beverage cans and glass bottles
indicate vessel-based sources because these types of litter are not expected to travel
long distances so they are probably deposited close to the area of sampling. Derraik
(2002) and Koutsodendris et al. (2008) have suggested that garbage bags, shopping
bags, plastic sheets and crates/containers originate mainly from land-based sources
including domestic, agricultural and industrial activities. During our surveys, metallic
litter corresponded mainly to aluminum beverage cans and glass litter to bottles and
16
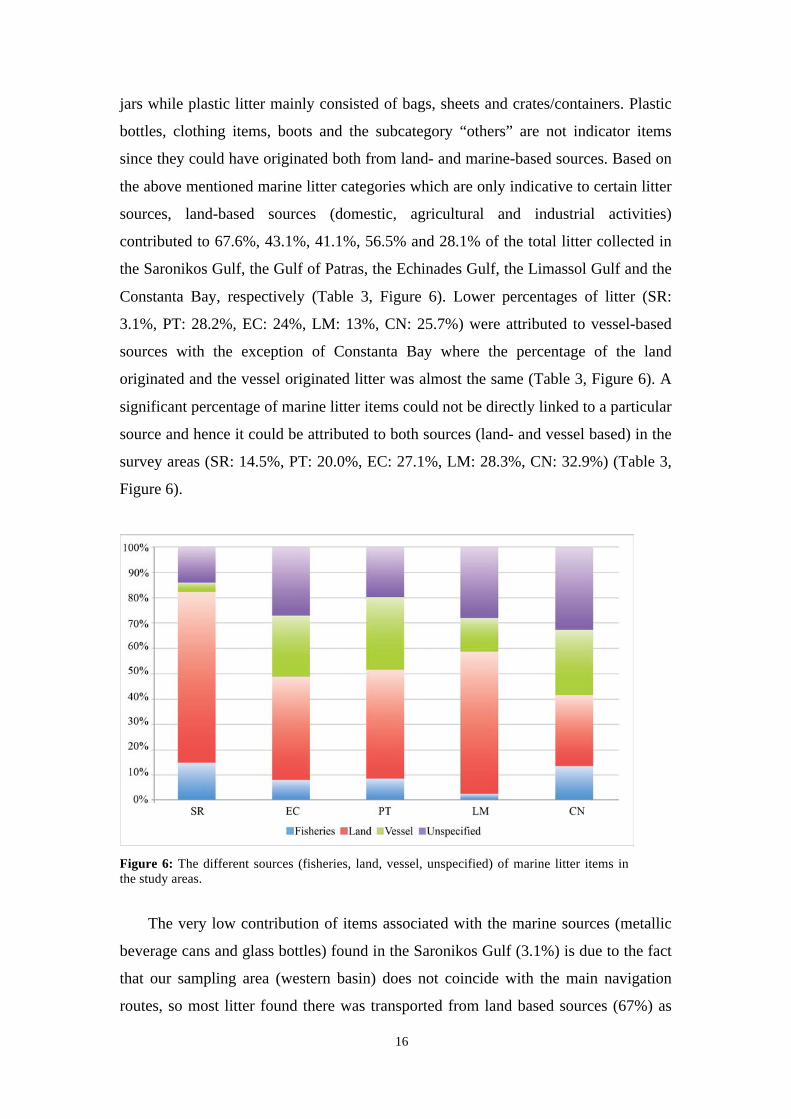
jars while plastic litter mainly consisted of bags, sheets and crates/containers. Plastic
bottles, clothing items, boots and the subcategory “others” are not indicator items
since they could have originated both from land- and marine-based sources. Based on
the above mentioned marine litter categories which are only indicative to certain litter
sources, land-based sources (domestic, agricultural and industrial activities)
contributed to 67.6%, 43.1%, 41.1%, 56.5% and 28.1% of the total litter collected in
the Saronikos Gulf, the Gulf of Patras, the Echinades Gulf, the Limassol Gulf and the
Constanta Bay, respectively (Table 3, Figure 6). Lower percentages of litter (SR:
3.1%, PT: 28.2%, EC: 24%, LM: 13%, CN: 25.7%) were attributed to vessel-based
sources with the exception of Constanta Bay where the percentage of the land
originated and the vessel originated litter was almost the same (Table 3, Figure 6). A
significant percentage of marine litter items could not be directly linked to a particular
source and hence it could be attributed to both sources (land- and vessel based) in the
survey areas (SR: 14.5%, PT: 20.0%, EC: 27.1%, LM: 28.3%, CN: 32.9%) (Table 3,
Figure 6).
Figure 6: The different sources (fisheries, land, vessel, unspecified) of marine litter items in the study areas.
The very low contribution of items associated with the marine sources (metallic
beverage cans and glass bottles) found in the Saronikos Gulf (3.1%) is due to the fact
that our sampling area (western basin) does not coincide with the main navigation
routes, so most litter found there was transported from land based sources (67%) as
17
already explained previously. A more complete picture of litter abundance in the
Saronikos Gulf will be obtained during future surveys covering more locations. For
all the other areas the types of litter items found reflect substantial contribution from
both land and marine-based human activities.
Plastics were, by far, the most abundant marine litter type in all studied sites
while in Saronikos Gulf (95%) they exceeded the global average of 75% (Galgani et
al., 2013(a)). Four litter items (plastic bags, plastic bottles, glass bottles and metal
beverage cans) accounted for over 40% of total items for the survey areas. This is in
accordance with the findings of an EU-wide survey in which plastic bags and bottles
accounted up to 70% of total debris in the Baltic Sea, the North Sea, the Celtic Sea,
the Bay of Biscay and different areas in the north-western basin of the Mediterranean
Sea and the Adriatic Sea (Galgani et al., 2000). Over 8 billion plastic carrier bags
were littered in the EU in 2010, representing one of the most important threats for the
marine environment. The findings of the present survey further support the EU
decision for discouraging the use of plastic carrier bags. Furthermore legislation to
reduce the use of plastic carrier bags in countries of the Eastern Mediterranean and
the Black Sea is strongly suggested.
Size variation for marine litter items was also investigated in order to get some
information on the extent of litter fragmentation. Small sized items (<5x5 cm), which
were entangled into bigger marine litter items, had significant proportion in all survey
areas (SR: 23%, PT: 6%, EC: 7%, LM: 13%, CN: 22%). Visual inspection of small-
sized litter showed that the majority of them are plastic fragments that have been
formed by the physical, chemical and biological fragmentation of larger items and not
from the direct release of small sized plastic items. The significant amount of small-
sized plastic litter in the five study areas coincides well with the increase of meso- and
microplastic litter in global ocean. The UK Marine Conservation Society (MCS,
2007) reports a 30% increase in the abundance of larger fragments (1–50 cm in size)
followed by a 20% increase in the abundance of smaller fragments (<1 cm) between
1998 and 2006. Thomson et al. (2004) found that there is a significant increase of
microplastic abundance over the last 40 years. The elevated percentage of small
plastic fragments in the Eastern Mediterranean Sea and the Black Sea is of particular
concern because they are difficult to be removed from the marine environment, they
have the potential to be easily ingested by organisms and they transfer harmful
chemicals to living organisms (Barnes et al., 2009).
18
Benthic marine litter surveys concerning the trends in litter accumulation and the
temporal variation of litter abundance are very rare and the available data have shown
high variability (Barnes et al, 2009). Two of the few areas worldwide where temporal
data is available on benthic marine litter over a period of 15 years are Patras and
Echinades Gulfs (Stefatos et al., 1999; Koutsodendris et al., 2008). Back in 1997-
1998, marine litter density in Patras Gulf was found 240 items/km2 based only on two
trawlings and in Echinades Gulf was 89 items/km2 (Stefatos et al., 1999), while for
the period 2000-2003 30 trawlings gave an average marine litter density of 313
items/km2 (Koutsodendris et al., 2008). The present study, clearly demonstrates a
significant increase in benthic marine litter abundance in Patras Gulf (641 items/km2).
Albeit the increase of marine litter abundance, typology seems to follow more or less
similar patterns especially from 2000 onwards. This temporal increase of litter
abundance in the two Gulfs is in contradiction to temporal trends that have been
observed in other areas. On the sea-bed of Tokyo Bay, litter densities decreased from
1996 to 2003 (Kanehiro et al., 1995; Kuriyama et al., 2003) while in the Gulf of Lions
litter abundance slightly decreased during 1994 – 2009 (Galgani et al., 2013 (a)).
The interpretation of the spatial and temporal variations of marine litter is a very
challenging issue since the litter distribution is influenced by a variety of factors i.e.
human activities, seasonal changes in rivers flow rate, hydrodynamic conditions and
seafloor morphology as well as socioeconomic measures implemented in the different
regions. Our results demonstrate the complexity of the problem and highlight the need
for concentrated efforts in order to collect sufficient data to fill in the existing gaps in
knowledge. In that aspect, the present work provides support to decision makers for
the implementation of the MSFD, which will lead to the reduction of marine litter
accumulation in the susceptible benthic marine environment.
Acknowledgements
The authors would like to thank: i) all participants in cruises for their assistance in
data collection, ii) Dr. Stavros-Nikiforos Spyrellis (UMR Géographie-cités, Equipe
P.A.R.I.S), Mrs Paraskevi Drakopoulou (HCMR) and Mrs Hara Kyriakidou (HCMR)
for their valuable contribution in mapping, iii) Mr. Stavros Stylianou of the Cyprus
Oceanography Center for providing bathymetry data.
The present study was conducted within the framework of the European IP Project
FP7 - PERSEUS EC Grant Agreement No 287600. C.I. has received a Ph.D. grant.
19
References
Adimey, N. M., Hudak, C. A., Powell, J. R., Bassos-Hull, K., Foley, A., Farmer, N.
A., White, L., Minch, K. (2014). Fishery gear interactions from stranded bottlenose
dolphins, Florida manatees and sea turtles in Florida, U.S.A.. Marine Pollution
Bulletin, Vol. 81 (1), pp. 103-115.
Anastasopoulou, A., Mytilineou, C., Smith, C. J., Papadopoulou, K. N. (2013). Plastic
debris ingested by deep-water fish of the Ionian Sea (Eastern Mediterranean). Deep-
Sea Research I, Vol. 74, pp. 11–13.
Anderson, J. A., Alford, A. B. (2014). Ghost fishing activity in derelict blue crab traps
in Louisiana. Marine Pollution Bulletin, Vol. 79 (1-2), pp. 261-267.
Bakir, A., Rowland, S. J., Thompson, R. C. (2014). Transport of persistent organic
pollutants by microplastics in estuarine conditions. Estuarine, Coastal and Shelf
Science, Vol. 140, pp. 14-21.
Barnes, D. K. A., Galgani, F., Thompson, R. C., Barlaz, M. (2009). Accumulation and
fragmentation of plastic debris in global environments. Philisophical Transactions of
the Royal Society B Biological Sciences, Vol. 364 (1526), pp. 1985-1998.
Bond, A. L., Provencher, J. F., Elliot, R. D., Ryan, P. C., Rowe, S., Jones, I. L.,
Robertson, G. J., Wilhelm, S. I. (2013). Ingestion of plastic marine debris by
Common and Thick-billed Murres in the northwestern Atlantic from 1985 to 2012.
Marine Pollution Bulletin, Vol. 77, pp. 192-195.
Derraik, J. C. B. (2002). The pollution of the marine environment by plastic debris: a
review. Marine Pollution Bulletin, Vol. 44, pp. 842–852.
Galil, B.S., Golik, A., Turkay, M. (1995). Litter at the Bottom of the Sea: A Sea Bed
Survey in the Eastern Mediterranean. Marine Pollution Bulletin, Vol. 30, No. 1, pp.
22-24.
Galgani, F., Jaunet, S., Campillo, A., Guenegen, X., His, E. (1995). Distribution and
Abundance of Debris on the Continental Shelf of the North-Western Mediterranean
Sea. Marine Pollution Bulletin, 30: 713–717.
Galgani, F., Souplet, A., Cadiou, Y. (1996). Accumulation of debris on the deep sea
floor off the French Mediterranean coast. Marine Ecology Progress Series,
142:225–234.
Galgani, F., Leaute, J.P., Moguedet, P., Souplet, A., Verin, Y., Carpentier, A.,
Goraguer, H., Latrouite, D., Andral, B., Cadiou, Y., Mahe, C., Poulard, J.C.,
20
Nerisson, P. (2000). Litter on the Sea Floor Along European Coasts. Marine
Pollution Bulletin, Vol. 40, No. 6, pp. 516-527.
Galgani, F., Hanke, G., Werner, S., De Vrees, L. (2013a). Marine litter within the
European Marine Strategy Framework Directive. – ICES Journal of Marine Science,
70: 1055–1064.
Galgani, F., Hanke, G., Werner, S., Oosterbaan, L., Nilsson, P., Fleet, D., Kinsey, S.,
Thompson R.C., Van Franeker, J., Vlachogianni, T., Scoullos, M., Mira Veiga, J.,
Palatinus, A., Matiddi, M., Maes, T., Korpinen, S., Budziak, A., Leslie, H., Gago, J.,
Liebezeit, G. (2013b). Guidance on Monitoring of Marine Litter in European Seas.
MSFD Technical Subgroup on Marine Litter (TSG-ML).
Goldstein M. C. and Goodwin D. S. (2013), Gooseneck barnacles (Lepas spp.) ingest
microplastic debris in the North Pacific Subtropical Gyre. PeerJ 1:e184; DOI
10.7717/peerj.184.
Horsman, P.V. (1982). The amount of garbage pollution from merchant ships. Marine
Pollution Bulletin, Vol. 13, pp. 167-169.
Ivar do Sul, J. A., Costa, M. F. (2014). The present and future of microplastic
pollution in the marine environment. Environmental Pollution, Vol. 185, pp. 352-
364.
Kanehiro H., Tokai T., Matuda K. (1995). Marine litter composition and distribution
on the sea-bed of Tokyo Bay. Fish. Eng., Vol. 31, pp. 195–199.
Karapanagioti, H. K., Klontza, I. (2007). Investigating the properties of plastic resin
pellets found in the coastal areas of Lesvos island. Global NEST Journal, Vol. 9, No
1, pp. 71-76.
Karapanagioti, H. K., Klontza, I. (2008). Testing phenanthrene distribution properties
of virgin plastic pellets and plastic eroded pellets found on Lesvos island beaches
(Greece). Marine Environmental Research, Vol. 65, pp. 283–290.
Karapanagioti, H. K., Endo, S., Ogata, Y., Takada, H. (2011). Diffuse pollution by
persistent organic pollutants as measured in plastic pellets sampled from various
beaches in Greece. Marine Pollution Bulletin, Vol. 62, pp. 312–317.
Katsanevakis, S., Katsarou, A. (2004). Influences on the Distribution of Marine
Debris on the Seafloor of Shallow Coastal Areas in Greece (Eastern Mediterranean).
Water, Air, and Soil Pollution, Vol. 158, pp. 325–337.
Katsanevakis, S., Verriopoulos, G., Nicolaidou, A., Thessalou-Legaki, M. (2007).
Effect of marine litter on the benthic megafauna of coastal soft bottoms: A
21
manipulative field experiment. Marine Pollution Bulletin, Vol. 54, pp. 771–778.
Keller, A.A., Fruh, E.L., Johnson, M.M., Simon, V., McGourty, C. (2010).
Distribution and abundance of anthropogenic marine debris along the shelf and
slope of the US West Coast. Marine Pollution Bulletin, Vol. 60, pp. 692–700.
Kontoyiannis, H. (2010). Observations on the circulation of the Saronikos Gulf: A
Mediterranean embayment sea border of Athens, Greece. J. Geophys. Res., Vol.
115, C06029, doi:10.1029/2008JC005026.
Koutsodendris, A., Papatheodorou, A., Kougiourouki, O., and Georgiadis, M. (2008).
Benthic marine litter in four Gulfs in Greece, Eastern Mediterranean; abundance,
composition and source identification. Estuarine Coastal and Shelf Science, 77:501–
512.
Kuriyama Y., Tokai T., Tabata K., Kanehiro H. (2003). Distribution and composition
of litter on seabed of Tokyo Gulf and its age analysis. Nippon Suisan Gakkaishi,
Vol. 69, pp. 770–781.
Leite, A.S., Santos, L.L., Costa, Y., Hatje, V. (2014). Influence of proximity to an
urban center in the pattern of contamination by marine debris. Marine Pollution
Bulletin, Vol. 81 (1), pp. 242-247.
Lopez-Carillo, L., Hernandez-Ramirez, R.U., Calafat, A.M., Torres-Sanchez, L.,
Galvan-Portillo, M., Needham, L.L., Ruiz-Ramos, R., Cebrian, M.E., 2010.
Exposure to phthalates and breast cancer risk in Northern Mexico. Environ. Health
Perspect, Vol. 114 (4), pp. 539–544.
Lusher, A.L., McHugh, M., Thompson, R.C. (2013). Occurrence of microplastics in
the gastrointestinal tract of pelagic and demersal fish from the English Channel.
Marine Pollution Bulletin, Vol. 67, pp. 94–99.
Madeira Di Beneditto, A. P., Arruda Ramos R. M. (2014). Marine debris ingestion by
coastal dolphins: What drives differences between sympatric species? Marine
Pollution Bulletin, Vol. 83, pp. 298–301.
Mathalon, A., Hill, P. (2014). Microplastic fibers in the intertidal ecosystem
surrounding Halifax Harbor, Nova Scotia. Marine Pollution Bulletin, Vol. 81, pp.
69-79.
MCS (2007). Beachwatch 2006—the 14th annual Beach litter survey report. Marine
Conservation Society, Ross on Wye.
Mizukawa, K., Takada, H., Ito, M., Geok, Y., B., Hosoda, J., Yamashita, R., Saha,
M., Suzuki, S., Miguez, C., Frias, J., Cepeda Antunes, J., Sobral, P., Santos, I.,
22
Micaelo, C., Ferreira, A. M. (2013). Monitoring of a wide range of organic
micropollutants on the Portuguese coast using plastic resin pellets. Marine Pollution
Bulletin, Vol. 70, pp. 296-302.
Moore, S.L., Allen, M.J. (2000). Distribution of anthropogenic and natural debris on
the Mainland Shelf of the Southern California Bight. Marine Pollution Bulletin, Vol.
40 (1), pp. 83–88.
Pham, C.K., Gomes-Pereira, J.N., Isidro, E.J., Santos, R.S., Morato, T. (2013).
Abundance of litter on Condor seamount (Azores, Portugal, Northeast Atlantic).
Deep Sea Research Part II: Topical Studies in Oceanography, pp. 204 - 208.
Ramirez-Llodra, E., De Mol, B., Company, J. B., Coll, M., Sardà, F. (2013). Effects
of natural and anthropogenic processes in the distribution of marine litter in the deep
Mediterranean Sea. Progress in Oceanography, Vol. 118, pp. 273–287.
Sanchez, P., Mercedes, M., Saez, R., Juan, S., Muntadas, A., Demestre, M. (2013).
Baseline study of the distribution of marine debris on soft-bottom habitats associated
with trawling grounds in the northern Mediterranean. Scientia Marine, Vol. 77, Issue
2, pp. 247-255.
Schlining, K., Von Thun, S., Kuhnz, L., Schlining, B., Lundsten, L., Jacobsen Stout,
N., Chaney, L., Connor, J. (2013). Debris in the deep: Using a 22-year video
annotation database to survey marine litter in Monterey Canyon, central California,
USA. Deep-Sea Research, Vol. 179, pp. 96-105.
Stefatos, A., Charalampakis, M., Papatheodorou, G., and Ferentinos, G. (1999).
Marine Debris on the Seafloor of the Mediterranean Sea: Examples from Two
Enclosed Gulfs in Western Greece. Marine Pollution Bulletin, 36:389–393.
Thompson, R.C., Olsen, Y., Mitchell, R.P., Davis, A., Rowland, S.J., John, A.W.G.,
McGonigle, D., Russell, A.E. (2004). Lost at sea: where is all the plastic? Science,
Vol. 304, pp. 838.
Topçu, E. N., and Oztürk, B. (2010). Abundance and composition of solid waste
materials on the western part of the Turkish Black Sea seabed. Aquatic Ecosystem
Health & Management, Vol 13 (3), pp. 301-306.
UNEP (2011). Assessment of the status of marine litter, in the Mediterranean. United
Nations Environmental Program, Athens, 2011.
Waluda, C. M., Staniland, I. J. (2013). Entanglement of Antarctic fur seals at Bird
Island, South Georgia. Marine Pollution Bulletin, Vol. 74, pp. 244–252.
23
Watters, D.L., Yoklavich, M.M., Love, M.S., Schroeder, D.M. (2010). Assessing
marine debris in deep seafloor habitats off California. Marine Pollution Bulletin,
Vol. 60, pp. 131–138.
WorldBank, 2012. What a waste. A global review of solid waste management. Urban
Developers Series Knowledge Paper (No 68135).