Embed Size (px)
Citation preview
Current Urban Studies, 2018, 6, 209-222 http://www.scirp.org/journal/cus
ISSN Online: 2328-4919 ISSN Print: 2328-4900
DOI: 10.4236/cus.2018.62012 Jun. 26, 2018 209 Current Urban Studies
A Comparative Study on Precipitation and Groundwater Level Interaction in the Highly Urbanized Area and Its Periphery
Mst Ilme Faridatul
Department of Urban and Regional Planning, Rajshahi University of Engineering & Technology, Rajshahi, Bangladesh
Abstract Precipitation is the primary source of freshwater. The availability of water in an area is largely dependent on precipitation that is further distributed into various components such as aquifer recharge, evapotranspiration and sur-face runoff etc. Aquifer recharge is one of the significant sources of groundwater that is affected because of increasing the urban sealed areas. Urbanization brings numerous artificial changes by altering natural earth surfaces into impervious areas that result in reducing infiltration. The changes in the urban land covers modify the natural drainage system and affect the groundwater recharge systems. As precipitation is the major source of groundwater, it is important to evaluate its influence on the aqui-fer recharge. Thus, this study is conducted to explore the interaction be-tween precipitation and groundwater level. A comparative analysis is per-formed between urban and suburban environments. The results show that both urban and suburban areas experience groundwater depletion but the rate of depletion is high in urban areas compared to its suburban. The re-sults also demonstrate that during monsoon, the groundwater level changes in the urban periphery but the water level remains static in the urban areas. The urban areas include more sealed areas that prohibit direct recharge, therefore, in urban areas, no significant relationship is observed between precipitation and groundwater level. In contrary, the influence of precipita-tion on groundwater level is observed in the suburban area therefore, rela-tively a high correlation is observed.
Keywords Precipitation, Groundwater, Urbanization, Suburban, Aquifer Recharge, Relationship
How to cite this paper: Faridatul, M. I. (2018). A Comparative Study on Precipita-tion and Groundwater Level Interaction in the Highly Urbanized Area and Its Peri-phery. Current Urban Studies, 6, 209-222. https://doi.org/10.4236/cus.2018.62012 Received: May 15, 2018 Accepted: June 23, 2018 Published: June 26, 2018 Copyright © 2018 by author and Scientific Research Publishing Inc. This work is licensed under the Creative Commons Attribution International License (CC BY 4.0). http://creativecommons.org/licenses/by/4.0/
Open Access

M. I. Faridatul
DOI: 10.4236/cus.2018.62012 210 Current Urban Studies
1. Introduction
Precipitation is a critical component of the global water and energy cycle, and only the primary source of freshwater (Hou et al., 2013) which is essential for all plants and living organisms (Barrett & Beaumont, 2009). It is primarily con-nected to water cycle that is released from the cloud in the form of rain or snow and supplies atmospheric water to the Earth (USGS, 2017). The availability of water in an area is largely dependent on precipitation that is further distributed into various components such as surface runoff, aquifer recharge, evapotranspi-ration, interflow, etc. (Kundu et al., 2017). Groundwater is one of the significant life-sustaining resources that is supplied to billions of people (Tom et al., 2012). However, rapid urbanization has resulted in tremendous pressure on this fresh- water source. The over-extraction has resulted to drop the groundwater level at an increasing rate (Hoque et al., 2007; Islam et al., 2017).
The groundwater depletion is a grave concern in many parts of the world (Chaudhuri & Ale, 2014) and is a big challenge for the developing countries to mitigate water crisis. Urbanization has a profound impact on the water re-sources, and both the quantity and quality are affected by urban landuse/land- cover changes (Khazaei et al., 2004; Arfanuzzaman & Atiq Rahman, 2017; Ud-dameri et al., 2014). The urban expansion brings numerous artificial changes by altering natural earth surfaces into impervious areas consequently several eco-logical and environmental problems arise from such changes (Grimm et al., 2008; Song et al., 2014). The natural drainage system is modified due to increase in the impervious area. It may also affect the groundwater level, base flow and water quality of the aquifers (Khazaei et al., 2004). Several factors including ur-ban landuse/landcover and climate change affect water resources by changing the frequency and severity of drought. In these consequences, 3.5 billion urban populations may experience seasonal water crisis by 2050 (McDonald et al., 2011; Srinivasan et al., 2013). Climate change and human activities such as groundwater abstraction and reservoir construction also affect groundwater re-sulting in the depletion of water level, land subsidence and saltwater intrusion (Xue et al., 2014). The hydrological, physical and ecological environment is af-fected by urbanization in several ways (Chu et al., 2010) and changes the water balance (Alkhoury et al., 2011; Eshtawi et al., 2016).
The literature review suggests that urbanization induced human activities and climate change affect water resources. In previous, several studies (Castellazzi et al., 2016; Chaudhuri & Ale, 2014; Hayashi et al., 2009; Liu et al., 2001; Nolan et al., 2007; Sanjoy & Kamal, 2014; Uddameri et al., 2014; Xue et al., 2014; Locatelli et al., 2017; Hoque et al., 2007; Guo & Jiao, 2007; Gunawardhana & Kazama, 2012; Eshtawi et al., 2016; Akther et al., 2009; Ali et al., 2012; Arfanuzzaman & Atiq Rahman, 2017) have been conducted related to groundwater storage, re-charge, and its depletion. For example, the spatiotemporal pattern of groundwa-ter declination and aquifer dewatering of Dhaka, Bangladesh was assessed by Hoque et al. (2007). The study concluded that urbanization influences to deplete

M. I. Faridatul
DOI: 10.4236/cus.2018.62012 211 Current Urban Studies
groundwater level. The factors of groundwater recharge in the eastern United States were assessed by Nolan et al. (2007). The impacts of sea-level rise and urbanization on groundwater availability in semi-arid South Texas were stu-died by Uddameri et al. (2014). In the study of Khazaei et al. (2004), the effects of urbanization on groundwater quantity and quality were assessed. The im-pact of urban area expansion on groundwater recharge and surface runoff was also quantified (Eshtawi et al., 2016). Although several studies have been con-ducted on the groundwater environment, none assessed the interaction be-tween precipitation and groundwater level. Monitoring urban expansion and evaluating their impact on water resources is vital for sustainable water re-source management (Hu et al., 2015). Thus, the study aims to explore the effect of urbanization on groundwater level. For evaluation, a comparative analysis is performed between urban and suburban areas. The results of this study will help to identify the hot spots of groundwater depletion that can help the policy makers to take necessary actions to enhance aquifer recharge by the primary water, precipitation.
2. Data and Methods
This study uses time series precipitation and groundwater monitoring data. The in-situ groundwater monitoring data for eight observation wells are collected from Bangladesh Water Development Board. Figure 1 shows the location of the monitoring wells within the study site. For evaluation and comparative analysis, the four wells are selected from the urban core area and others from the urban periphery. In addition, Landsat images of 1989, 1996, 2006 and 2010 are used to present the spatiotemporal land cover changes around the groundwater moni-toring wells.
Dhaka the capital city of Bangladesh is selected as a study area. The city is surrounded by three major rivers the Buriganga, Turag, and Balu, which flow to the south, west, and east, respectively. It is located at 23˚43'0'' North latitude and 90˚24'0'' East longitude. Dhaka is a major economic hub, that experiences the enormous pressure of urbanization and, it is expected to be the third largest city in the world by 2020 (Dewan & Yamaguchi, 2009). Due to rapid urbanization, the natural earth surfaces are being converted to impervious surfaces moreover, it seems that the study area is facing numerous ecological and environmental problems (Islam et al., 2017). The City is highly dependent on the sub-surface water resources where 87% of the supplied water come from the groundwater. Excessive abstraction of groundwater and least groundwater recharge are trig-gering to drop the subsurface water very rapidly. Presently, the groundwater water level of this city is dropped to more than 52 meters below mean sea level from 26.6 meters in 1996 (Arfanuzzaman & Atiq Rahman, 2017). The ground-water level of Dhaka city is continuously dropping at an average rate of 2 meter yearly (Akther et al., 2009).

M. I. Faridatul
DOI: 10.4236/cus.2018.62012 212 Current Urban Studies
Figure 1. Study site and location of the groundwater monitoring wells.
This study aims to assess the factors of high groundwater depletion in a highly urbanized area; therefore, a comparative analysis is performed between the ur-ban core and its periphery. First, the monthly average temporal precipitation and groundwater level are presented and evaluated based on the graphical analy-sis. Second, long-term hydrographs are produced for urban and suburban envi-ronments. Third, the coefficient of correlations is determined between observed monthly groundwater level and precipitation. Finally, a 2500-meter buffer zone is created around the monitoring wells and land cover classes are quantified through the visual interpretation of the Landsat false-color images. The land cover classes are used for evaluating the factors of variation in the groundwater level in urban and suburban areas.

M. I. Faridatul
DOI: 10.4236/cus.2018.62012 213 Current Urban Studies
3. Results and Discussion
Figure 2 presents the monthly precipitation during 1989-2010. The study area experiences the lowest precipitation during November to March. The amount of precipitation starts to increase in April and continue up to October. In an aver-age, the highest precipitation (around 300 mm) occurs during June to October. The overall trend demonstrates the seasonal variation in the precipitation level.
In contrary, the temporal groundwater level as shown in Figure 3 demon-strates that both urban and suburban area experience groundwater depletion. However, the urban area experiences high depletion compared to the suburban area. In 1989, the observed lowest groundwater level was 10.8 meters in the ur-ban area but a high depletion rate resulted ina maximum water level 65.8 meters in 2010 in the Mirpur observation site. In contrary, the suburban area shows that in 1989 the lowest water level was 1.5 meters in Narayanganj. In 2010, the high-est water level (16.2 meter) was observed in the Savar_2 observation site. The temporal pattern of groundwater depletion exhibit a downward trend but the urban area is more vulnerable compared to its periphery.
Figure 2. Monthly average precipitation in the study site.
Figure 3. Average groundwater level (21 years perspective).
0
100
200
300
400
500
600
700
Jan Feb Mar Apr May Jun Jul Aug Sep Oct Nov Dec
Mon
thly
pre
cipi
tatio
n (m
m)
1989 1996 2006 2010 Mean
-70-60-50-40-30-20-10
0
Sutr
apur
Moh
amm
adpu
r
Mirp
ur
Lalb
agh
Kera
niga
nj
Sava
r_2
Sava
r
Nar
ayan
ganj
Urban Suburban
Grou
nd W
ater
Lev
el (m
eter
)
1989 1996 2006 2010

M. I. Faridatul
DOI: 10.4236/cus.2018.62012 214 Current Urban Studies
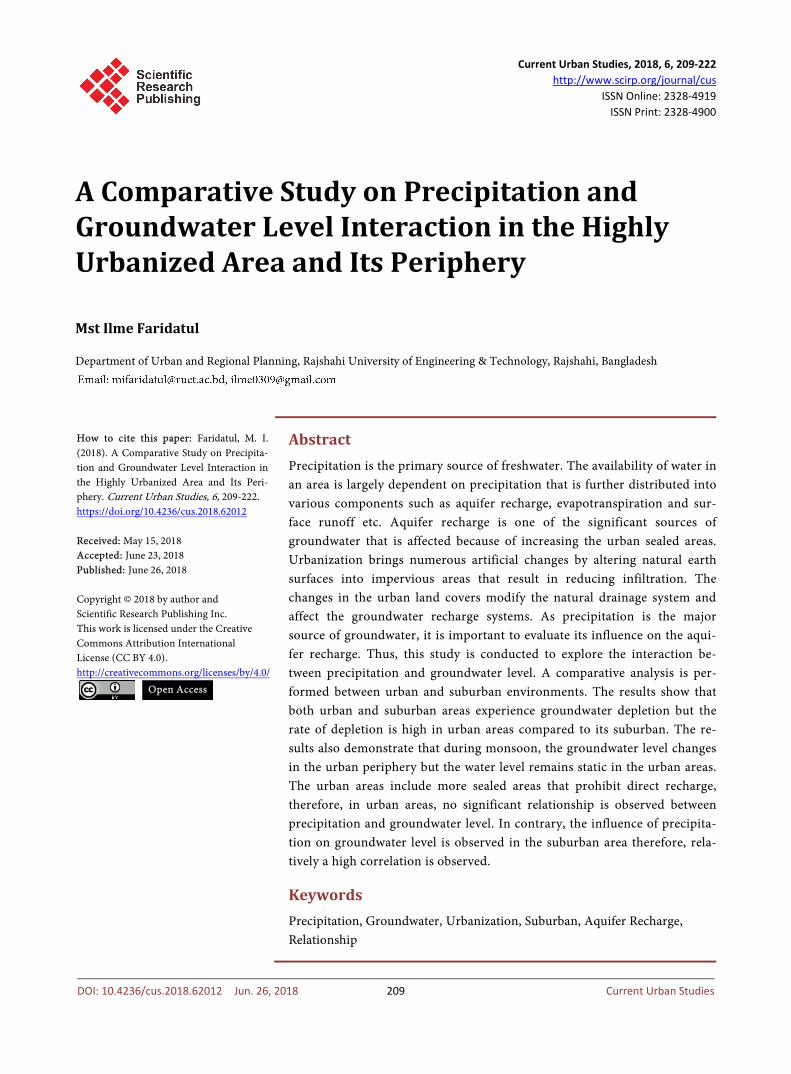
Figure 4 shows the long-term hydrographs in the urban core area. The graphical analysis shows no significant monthly variation in the groundwater level. However, a continuous drop in the groundwater level is observed in all of the observation sites. In contrary, as shown in Figure 5 the monthly variation is observed in the suburban monitoring wells. The observation site, Narayanganj, Figure 5(a) shows more obvious monthly variation compared to other locations. Figure 5(c) also shows monthly variation with the lowest groundwater level in 1989 and 1996. However, in 2006 and 2010, it showed no significant monthly variation moreover, showed a high level of depletion in the groundwater level.
Figure 6 presents the temporal overview of the interaction between precipita-tion and groundwater level in the urban area. Although, in monsoon, high pre-cipitation occurs it shows no significant variation in the groundwater level. In contrary, Figure 7 demonstrates that with an increase in the precipitation the groundwater level changes in the suburban environment. However, the rate of changes is variable to different observation sites.
Table 1 shows the coefficient of correlations between monthly precipitation and groundwater level. As illustrated earlier although, the amount of precipita-tion varies monthly, the urban area shows no monthly variation in the ground-water level, therefore, the coefficient of correlations are nearly zero. In contrary, Table 2 shows the relatively high coefficient of correlation for suburban area compared to urban. Because monthly variation in the precipitation and groundwater level is observed in the suburban area. In conclusion, it is evident that precipitation influences the groundwater level but it is variable to the urban and suburban environment. Although, precipitation is the primary source of aquifer recharge its interaction to groundwater level in the urban area is very negligible. Moreover, the urban area shows static water level in all the months.
4. Conclusion
This study is conducted to investigate the interaction between precipitation and groundwater level in the highly urbanized area and its periphery. The in-situ groundwater monitoring data, precipitation and spatiotemporal Landsat images are used for evaluating the proposed approach. The hydrograph analysis sug-gests that the urban area experience a high drop in the groundwater level com-pared to the suburban area. Moreover, an increase in the precipitation reduces groundwater level in the suburban area but no significant influence is observed in the urban core area. The results are further evaluated by satellite images. The spatiotemporal land covers are identified based on the visual interpretation. The false-color images primarily distinguish the land cover classes as shown in Fig-ure 8. The evaluation results show an increase in the impervious areas in the ur-ban core during 1989-2010. In contrary, suburban areas occupy more vegetative surfaces. As the urban area occupies an extensive impervious area that prohibits direct aquifer recharge, therefore, precipitation does not influence monthly vari-ation in the groundwater level. In contrary, the suburban area contains

M. I. Faridatul
DOI: 10.4236/cus.2018.62012 215 Current Urban Studies
(a)
(b)
(c)
(d)
Figure 4. Long-term hydrographs in the urban area. (a) Sutrapur; (b) Mohammadpur; (c) Mirpur; (d) Lalbagh.
-25
-20
-15
-10
-5
0
Jan Feb Mar Aprl May Jun July Aug Sep Oct Nov Dec
GW le
vel (
m)
1989 1996 2006 2010
-40
-30
-20
-10
0
Jan Feb Mar Aprl May Jun July Aug Sep Oct Nov DecGW
leve
l (m
)
1989 1996 2006 2010
-80
-60
-40
-20
0
Jan Feb Mar Aprl May Jun July Aug Sep Oct Nov Dec
GW le
vel (
m)
1989 1996 2006 2010
-60
-40
-20
0
Jan Feb Mar Aprl May Jun July Aug Sep Oct Nov Dec
GW le
vel (
m)
1989 1996 2006 2010
M. I. Faridatul
DOI: 10.4236/cus.2018.62012 216 Current Urban Studies
(a)
(b)
(c)
(d)
Figure 5. Long-term hydrographs in the periphery of the urban area. (a) Narayanganj; (b) Savar; (c) Savar_2; (d) Keraniganj.
-6
-4
-2
0
Jan Feb Mar Aprl May Jun July Aug Sep Oct Nov Dec
GW le
vel (
m)
1989 1996 2006 2010
-10
-8
-6
-4
-2
0
Jan Feb Mar Aprl May Jun July Aug Sep Oct Nov DecGW
leve
l (m
)
1989 1996 2006 2010
-20
-15
-10
-5
0
Jan Feb Mar Aprl May Jun July Aug Sep Oct Nov Dec
GW le
vel (
m)
1989 1996 2006 2010
-10
-8
-6
-4
-2
0
Jan Feb Mar Aprl May Jun July Aug Sep Oct Nov Dec
GW le
vel (
m)
1989 1996 2006 2010

M. I. Faridatul
DOI: 10.4236/cus.2018.62012 217 Current Urban Studies
(a)
(b)
(c)
(d)
Figure 6. Temporal monthly average precipitation and groundwater level in the urban core: (a) 1989; (b) 1996; (c) 2006; (d) 2010. Note: S, Sutrapur; Mhd, Mohammadpur; M, Mirpur; L, Lalbagh and PP, Precipitation.
0
100
200
300
400
-20
-15
-10
-5
0
Feb Mar Apr May Jun Jul Aug Sep Oct Nov Dec
Prec
ipita
tion
(mm
)
Grou
ndw
ater
Lev
el (m
)
S Mhd M L PP
0
100
200
300
400
-30
-20
-10
0
Jan Feb Mar Apr May Jun Jul Aug Sep Oct Nov Dec
Prec
ipita
tion
(mm
)
Grou
ndw
ater
Lev
el (m
)
S Mhd M L PP
0
200
400
600
800
-80
-60
-40
-20
0
Jan Feb Mar Apr May Jun Jul Aug Sep Oct Nov Dec
Prec
ipita
tion
(mm
)
Grou
ndw
ater
Lev
el (m
)
S Mhd M L PP
0
100
200
300
400
-80
-60
-40
-20
0
Jan Feb Mar Apr May Jun Jul Aug Sep Oct Nov Dec
Prec
ipita
tion
(mm
)
Grou
ndw
ater
Lev
el (m
)
S Mhd M L PP

M. I. Faridatul
DOI: 10.4236/cus.2018.62012 218 Current Urban Studies
(a)
(b)
(c)
(d)
Figure 7. Temporal monthly average precipitation and groundwater level in the urban periphery: (a) 1989; (b) 1996; (c) 2006; (d) 2010. Note: K, Keraniganj; S2, Savar_2; S, Savar; N, Narayanganj and PP, Precipitation.
0
100
200
300
400
-10
-8
-6
-4
-2
0
Jan Feb Mar Apr May Jun Jul Aug Sep Oct Nov Dec
Prec
ipita
tion
(mm
)
Grou
ndw
ater
Lev
el (m
)
K S2 S N PP
0
100
200
300
400
-15
-10
-5
0
Jan Feb Mar Apr May Jun Jul Aug Sep Oct Nov Dec
Prec
ipita
tion
(mm
)
Grou
ndw
ater
Lev
el (m
)
K S2 S N PP
0
200
400
600
800
-15
-10
-5
0
Jan Feb Mar Apr May Jun Jul Aug Sep Oct Nov Dec
Prec
ipita
tion
(mm
)
Grou
ndw
ater
Lev
el (m
)
K S2 S N PP
0
100
200
300
400
-20
-15
-10
-5
0
Jan Feb Mar Apr May Jun Jul Aug Sep Oct Nov Dec
Prec
ipita
tion
(mm
)
Grou
ndw
ater
Lev
el (m
)
K S2 S N PP

M. I. Faridatul
DOI: 10.4236/cus.2018.62012 219 Current Urban Studies
Figure 8. Spatiotemporal land cover classes: red, vegetation; dark blue and black, water; yellowish, bare land; sky blue, impervious areas. (a) In 1989; (b) In 1996; (c) In 2006; (d) In 2010. Table 1. Coefficient of correlations between monthly precipitation and groundwater level in urban areas.
Urban Wells
Year
1989 1996 2006 2010
Mirpur 0.01 0.00 0.00 0.01
Sutrapur 0.00 0.00 0.00 0.00
Lalbagh 0.00 0.01 0.01 0.00
Mohammadpur 0.05 0.02 0.00 0.01

M. I. Faridatul
DOI: 10.4236/cus.2018.62012 220 Current Urban Studies
Table 2. Coefficient of correlations between monthly precipitation and groundwater level in suburban areas.
Suburban Wells
Year
1989 1996 2006 2010
Keraniganj 0.32 0.41 0.40 0.07
Narayanganj 0.41 0.46 0.31 0.36
Savar 0.28 0.19 0.30 0.15
Savar_2 0.45 0.31 0.11 0.02
more recharge areas as vegetation and bare lands that help to infiltrate the preci-pitation. Therefore, the suburban area shows variation in the groundwater level with an increase in the precipitation. In conclusion, the study suggests that pre-cipitation have an impact on the groundwater level but the surface coverings in-fluence the infiltration rate. Therefore, the variations in the groundwater level are nonstationary in the urban and suburban environment.
Acknowledgements
I owe my sincere gratitude to Bangladesh Water Development and Bangladesh Meteorological Department for providing historical groundwater monitoring data and precipitation information.
References Akther, H., Ahmed, M. S., & Rasheed, K. B. S. (2009). Spatial and Temporal Analysis of
Groundwater Level Fluctuation in Dhaka City, Bangladesh. Asian Journal of Earth Sciences, 2, 49-57. https://doi.org/10.3923/ajes.2009.49.57
Ali, R., Mcfarlane, D., Varma, S., Dawes, W., Emelyanova, I., Hodgson, G., & Charles, S. (2012). Potential Climate Change Impacts on Groundwater Resources of South-Western Australia. Journal of Hydrology, 475, 456-472. https://doi.org/10.1016/j.jhydrol.2012.04.043
Alkhoury, W., Saadah, M. A., Sauter, M., & Salameh, E. (2011). Modelling the Effects of Land Use Dynamics on the Water Resources in Arid and Semiarid Regions Using a Physically Based Spacially Distributed Model. International Conference on Integrated Water Resources Management, Germany. https://www.researchgate.net/publication/275828065
Arfanuzzaman, M., & Atiq Rahman, A. (2017). Sustainable Water Demand Management in the Face of Rapid Urbanization and Ground Water Depletion for Social-Ecological Resilience Building. Global Ecology and Conservation, 10, 9-22. https://doi.org/10.1016/j.gecco.2017.01.005
Barrett, E. C., & Beaumont, M. J. (2009). Satellite Rainfall Monitoring: An Overview. Re-mote Sensing Reviews, 11, 1-4, 23-48. https://doi.org/10.1080/02757259409532254
Castellazzi, P., Martel, R., Galloway, D. L., Longuevergne, L., & Rivera, A. (2016). Assess-ing Groundwater Depletion and Dynamics Using GRACE and InSAR: Potential and Limitations. Groundwater. https://doi.org/10.1111/gwat.12453
Chaudhuri, S., & Ale, S. (2014). Long-Term (1930-2010) Trends in Groundwater Levels

M. I. Faridatul
DOI: 10.4236/cus.2018.62012 221 Current Urban Studies
in Texas: Influences of Soils, Landcover and Water Use. Science of the Total Environ-ment, 490, 379-390. https://doi.org/10.1016/j.scitotenv.2014.05.013
Chu, H. J., Lin, Y. P., Huang, C. W., Hsu, C. Y., & Chen, H. Y. (2010). Modelling the Hy-drologic Effects of Dynamic Land-Use Change Using a Distributed Hydrologic Model and a Spatial Land-Use Allocation Model. Hydrological Processes, 24, 2538-2554. https://doi.org/10.1002/hyp.7667
Dewan, A. M., & Yamaguchi, Y. (2009). Land Use and Land Cover Change in Greater Dhaka, Bangladesh: Using Remote Sensing to Promote Sustainable Urbanization. Ap-plied Geography, 29, 390-401. https://doi.org/10.1016/j.apgeog.2008.12.005
Eshtawi, T., Evers, M., & Tischbein, B. (2016). Quantifying the Impact of Urban Area Expansion on Groundwater Recharge and Surface Runoff. Hydrological Sciences Jour-nal, 61, 826-843.
Grimm, N., Faeth, S., Golubiewski, N., Redman, C., Wu, J., Bai, X., & Briggs, J. (2008). Global Change and the Ecology of Cities. Science, 319, 756-760. https://doi.org/10.1126/science.1150195
Gunawardhana, L., & Kazama, S. (2012). Statistical and Numerical Analyses of the Influ-ence of Climate Variability on Aquifer Water Levels and Groundwater Temperatures: The Impacts of Climate Change on Aquifer Thermal Regimes. Global and Planetory Change, 86-87, 66-78.
Guo, H., & Jiao, J. (2007). Impact of Coastal Land Reclamation on Ground Water Level and the Sea Water Interface. Ground Water, 45, 362-367. https://doi.org/10.1111/j.1745-6584.2006.00290.x
Hayashi, T., Tokunaga, T., Aichi, M., Shimada, J., & Taniguchi, M. (2009). Effects of Human Activities and Urbanization on Groundwater Environments: An Example from the Aquifer System of Tokyo and the Surrounding Area. Science of the Total Environ-ment, 407, 3165-3172. https://doi.org/10.1016/j.scitotenv.2008.07.012
Hoque, M., Hoque, M., & Ahmed, K. (2007). Declining Groundwater Level and Aquifer Dewatering in Dhaka Metropolitan Area, Bangladesh: Causes and Quantification. Offi-cial Journal of the International Association of Hydrogeologists, 15, 1523-1534.
Hou, A. Y., Kakar, R. K., Neeck, S., Azarbarzin, A. A., Kummerow, C. D., Kojima, M., Oki, R., Nakamura, K., & Iguchi, T. (2013). The Global Precipitation Measurement Mission. Bulletin of the American Meteorological Society, 95, 701-722. https://doi.org/10.1175/BAMS-D-13-00164.1
Hu, X., Lu, L., Li, X., Wang, J., & Guo, M. (2015). Land Use/Cover Change in the Middle Reaches of the Heihe River Basin over 2000-2011 and Its Implications for Sustainable Water Resource Management. PLoS ONE, 10, e0128960. https://doi.org/10.1371/journal.pone.0128960
Islam, M., Firoz, A., Foglia, L., Marandi, A., Khan, A., Schüth, C., & Ribbe, L. (2017). A Regional Groundwater-Flow Model for Sustainable Groundwater-Resource Manage-ment in the South Asian Megacity of Dhaka, Bangladesh. Hydrogeology Journal, 25, 617-637. https://doi.org/10.1007/s10040-016-1526-4
Khazaei, E., Mackay, R., & Warner, J. W. (2004). The Effects of Urbanization of Ground-water Quantity and Quality in the Zahedan Aquifer, Southeast Iran. Water Interna-tional, 29, 178-188. https://doi.org/10.1080/02508060408691767
Kundu, S., Khare, D., & Mondal, A. (2017). Past, Present and Future Land Use Changes and Their Impact on Water Balance. Journal of Environmental Management, 197, 582-596. https://doi.org/10.1016/j.jenvman.2017.04.018
Liu, C., Yu, J., & Kendy, E. (2001). Groundwater Exploitation and Its Impact on the En-
M. I. Faridatul
DOI: 10.4236/cus.2018.62012 222 Current Urban Studies
vironment in the North China Plain. Water International, 26, 265-272. https://doi.org/10.1080/02508060108686913
Locatelli, L., Mark, O., Mikkelsen, P. S., Arnbjerg-Nielsen, K., Deletic, A., Roldin, M., & Binning, P. J. (2017). Hydrologic Impact of Urbanization with Extensive Stormwater Infiltration. Journal of Hydrology, 544, 524-537. https://doi.org/10.1016/j.jhydrol.2016.11.030
McDonald, R. I., Green, P., Balk, D., Fekete, B. M., Revenga, C., Todd, M., Montgomery, M., & Gleick, P. H. (2011). Urban Growth, Climate Change, and Freshwater Availabil-ity. Proceedings of the National Academy of Sciences of the United States of America, 108, 6312-6317. https://doi.org/10.1073/pnas.1011615108
Nolan, B. T., Healy, R. W., Taber, P. E., Perkins, K., Hitt, K. J., & Wolock, D. M. (2007). Factors Influencing Ground-Water Recharge in the Eastern United States. Journal of Hydrology, 332, 187-205. https://doi.org/10.1016/j.jhydrol.2006.06.029
Sanjoy, D., & Kamal, R. (2014). Ground Water Depletion, and Its Impact on Crop Pro-duction—A Case Study, Block Englishbazar District Malda, West Bengal, India. Golden Research Thoughts, 3, 1-9.
Song, X., Zhang, J., Aghakouchak, A., Roy, S. S., Xuan, Y., Wang, G., He, R., Wang, X., & Liu, C. (2014). Rapid Urbanization and Changes in Spatiotemporal Characteristics of Precipitation in Beijing Metropolitan Area. Journal of Geophysical Research: Atmos-pheres, 119, 11,250-11,271. https://doi.org/10.1002/2014JD022084
Srinivasan, V., Seto, K. C., Emerson, R., & Gorelick, S. M. (2013). The Impact of Urbani-zation on Water Vulnerability: A Coupled Human-Environment System Approach for Chennai, India. Global Environmental Change, 23, 229-239. https://doi.org/10.1016/j.gloenvcha.2012.10.002
Tom, G., Yoshihide, W., Marc, F. P. B., & Ludovicus, P. H. V. B. (2012). Water Balance of Global Aquifers Revealed by Groundwater Footprint. Nature, 488, 197-200. https://doi.org/10.1038/nature11295
Uddameri, V., Singaraju, S., & Hernandez, E. (2014). Impacts of Sea-Level Rise and Ur-banization on Groundwater Availability and Sustainability of Coastal Communities in Semi-Arid South Texas. Environmental Earth Sciences, 71, 2503-2515. https://doi.org/10.1007/s12665-013-2904-z
USGS (2017). Precipitation: The Water Cycle. USGS Water Science School. https://water.usgs.gov/edu/watercycleprecipitation.html
Xue, L., Guomin, L., & Yuan, Z. (2014). Identifying Major Factors Affecting Groundwater Change in the North China Plain with Grey Relational Analysis. Water, 6, 1581-1600. https://doi.org/10.3390/w6061581