Embed Size (px)
Citation preview
Red Rock Capital, LLC 5000 Birch Street, Suite 3000 Newport Beach, CA 92660
www.RedRockCapital.com
A Comparison of CTA Indexes
www.RedRockCapital.com
Thomas N. Rollinger Scott T. Hoffman
Red Rock Capital, LLC 5000 Birch Street, Suite 3000 Newport Beach, CA 92660
www.RedRockCapital.com2
A Comparison of CTA Indexes | By Thomas N. Rollinger & Scott T. Hoffman | Red Rock Capital
Investors and money managers interested in diversifying into Managed Futures are often attracted to the daily transparency and better liquidity that Managed Futures have over the typical hedge-fund structure.
Professional money managers in the Managed Futures space are known by the regulatory designation of Commodity Trading Advisors (CTAs). However, with hundreds of CTA programs from which to choose, it can be daunting to know where to start one’s analysis of this investment space. One place to begin is with CTA indexes, which compile and track the performance of different CTA programs. This paper summarizes and analyzes information on over ten CTA indexes, and while it attempts to encompass the most-oft used indexes, it is not a completely exhaustive list. Finally, since much of this information is not readily available, the purpose of this paper is to serve as an effective and efficient informational resource for the industry going forward.
Upon delving into this material one quickly discovers there are differences between the various CTA indexes in terms of construction methodology, the number of CTA programs tracked, and minimum requirements with regard to track record length, financial auditing, and assets being managed.
Before presenting the information on the indexes themselves, we thought it would be helpful to offer some background on the terms “Managed Futures”, “CTAs”, and “Systematic Trend Following.”
Defining Managed Futures,CTAs, & Systematic Trend Following “Managed Futures” is an extremely broad term that requires a more specific definition. Managed Futures traders are commonly referred to as “Commodity Trading Advisors” or “CTAs,” a designation which refers to a manager’s registration status with the Com-modity Futures Trading Commission and National Futures Association. CTAs may trade financial and foreign exchange futures, so the name Commodity Trading Advisor is somewhat misleading since CTAs are not restricted to trading only commodity futures.1 [Note: many investors generically say “Managed Futures” or “CTAs” when they more precisely mean “systematic CTAs who employ trend following strat-egies (or ‘Systematic Trend Followers’),” likely due to the fact that many of the largest and most successful trading managers employ some variation of a trend following strategy.]
[For a more thorough summary on Systematic Trend Fol-
lowing / Systematic Global Macro, see Appendix I.]
That being said, Managed Futures may be thought of as a collection of liquid, transparent hedge fund strategies which focus on exchange-traded futures, forwards, options, and foreign exchange markets. Trading programs can take both long and short positions in as many as 400 globally diverse markets, spanning physical commodities, fixed income, equity indexes, and currencies. Daily participants in these markets include hedgers, traders, and investors, many of whom make frequent adjustments to their posi-tions, contributing to substantial trading volume and plentiful liquidity. These conditions allow most Man-aged Futures programs to accommodate large capacity and provide the opportunity to diversify across many different markets, sectors, and time horizons.2
Diversification across market sectors, active manage-ment, and the ability to take long and short positions are key features that differentiate Managed Futures strategies not only from passive, long-only commodity
Red Rock Capital, LLC 5000 Birch Street, Suite 3000 Newport Beach, CA 92660
www.RedRockCapital.com
2
A Comparison of CTA Indexes | By Thomas N. Rollinger & Scott T. Hoffman | Red Rock Capital
easier to measure and model.1 In fact in research con-ducted before the Global Financial Crisis, Bhaduri and Art (2008) found that the value of liquidity is often underestimated, and, as a result, hedge funds that trade illiquid instruments have underperformed hedge funds that have better liquidity terms.5
The quantitative nature of many Managed Futures strategies makes it easy for casual observers to mistak-enly categorize them as “black box” trading systems.1 According to Ramsey and Kins (2004), “The irony is that most CTAs will provide uncommonly high levels of transparency relative to other alternative invest-ment strategies.”6 They go on to suggest that CTAs are generally willing to describe their trading models and risk management in substantial detail during the course of due diligence, “short of revealing their actual algorithms.” CTAs are also typically willing to share substantial position transparency with fund investors. Ramsey and Kins conclude that, “It is difficult to call CTAs black box, considering they disclose their meth-odology and provide full position transparency so that investors can verify adherence to that methodology.”
Separately managed accounts, common among Man-aged Futures investors, greatly enhance risk manage-ment by providing the investor with full transpar-ency, and in extreme cases, the ability to intervene by liquidating or neutralizing positions.1 In addition, institutional investors who access CTAs via separately managed accounts substantially reduce operational risks and the possibility of fraud by maintaining custo-dy of assets. Unlike the products traded in other hedge fund strategies, those traded by CTAs allow investors to customize the allocation by targeting a specific level of risk through the use of notional funding. The cash efficiency made possible by the low margin requirements of futures and foreign exchange allows investors to work with the trading manager to lever or de-lever a managed account to target a specific level of annualized volatility or other risk metric. Some CTAs offer funds with share classes with different levels of risk. Unlike traditional forms of leverage, which re-quire the investor to pay interest to gain the additional
indexes, but from traditional investing as well. Al-though most Managed Futures programs trade equity index, fixed income, and foreign exchange futures, their returns have historically been uncorrelated to the returns of these asset classes. The reason for this is that most managers are not simply taking on system-atic beta exposure to an asset class, but are attempting to add alpha through active management and the free-dom to enter short or spread positions, tactics which offer the potential for completely different return profiles than long-only, passive indexes.1
Early stories of futures trading can be traced as far back as the late 1600s in Japan.3 Although the first public futures fund started trading in 1948, the indus-try did not gain traction until the 1970s. According to Barclays (2012), “…a decade or more ago, these managers and their products may have been consid-ered different than hedge funds; they are now usually viewed as a distinct strategy or group of strategies within the broader hedge fund universe. In fact, Man-aged Futures represent an important part of the alter-native investment landscape, commanding approx-imately 14% of all hedge fund assets [which equated to] $284.4 billion at the end of 3Q11.”4 More recent estimates, according to alternative investment data-base BarclayHedge located in Fairfield, Iowa, show that Managed Futures now account for approximate-ly 13% of all hedge fund assets under management ($316.8 billion of the total $2,478.6 billion invested in hedge funds).
Managed Futures should also be thought of as a sub-set of global macro strategies that focuses on global futures and foreign exchange markets and is likely to utilize a systematic approach to trading and risk management. The instruments that are traded tend to be exchange-listed futures or extremely deep, liquid, cash-forward markets. Futures facilitate pricing and valuation and minimize credit risk through daily set-tlement, enabling hedge fund investors to mitigate or eliminate some of the more deleterious risks associat-ed with investing in alternatives. Liquidity and ease of pricing also assist risk management by making risks
3
Red Rock Capital, LLC 5000 Birch Street, Suite 3000 Newport Beach, CA 92660
www.RedRockCapital.com
3
A Comparison of CTA Indexes | By Thomas N. Rollinger & Scott T. Hoffman | Red Rock Capital
Hedge database representing at least 50% of total assets in all CTA programs that are open to new investment. To qualify for inclusion in the index the program must be open to new investment, the manager must be willing to report daily returns, the program must have two years of performance history, and the pro-gram CTA must have at least three years of operating history.
The index calculation methodology is such that the index performance represents the return of a hypo-thetical portfolio comprising an equal dollar allocation to each index constituent at the beginning of each calendar year. During the fourth quarter of each year, all CTA programs in the BarclayHedge database that meet the inclusion requirements (candidate universe) are ranked by third quarter ending program assets. Beginning with the largest program, the constituent list for the following year is compiled by successively adding the next largest program to the constituent list until a minimum of 20 programs have been included and the cumulative program assets of the constituent list equals at least 50% of the total program assets of the candidate universe. The result of this process is the constituent list for the index for the following calen-dar year. At the beginning of the year a hypothetical portfolio is formed with each constituent program given an equal dollar allocation. The index daily return is simply the daily return of this hypothetical portfolio. There is no rebalancing of allocations during the year.
As of December 2014 there were 20 constituent pro-grams in the index representing $93.8 billion.
The proprietor of the Barclay BTOP50 Index is Bar-clayHedge, Ltd., and they also calculate the index. The index is available without cost online at www.bar-clayhedge.com and Sol Waksman, the President and Founder of BarclayHedge, can be reached at [email protected] or (641) 472-3456.
BARCLAY CTA INDEX
The Barclay CTA Index is designed to broadly rep-resent the performance of all CTA programs in the
exposure, assets used for margin in futures accounts can earn interest for the investor. Another advantage of trading futures is that there are no barriers to short selling. Two parties simply enter into a contract; there is no uptick rule, there is no need to borrow shares, pay dividends, or incur other costs associated with entering into equity short sales. Thus, it is easier to implement a long-short strategy via futures than it is using equities.1
[To see a summary of how institutional investors view
Managed Futures and CTAs, see Appendix II.]
Overview of the CTA Indexes
ALTEGRIS 40 INDEX
The Altegris 40 Index is designed to represent the performance of the 40 largest CTA programs based on program assets. All programs in the Altegris CTA database are eligible for inclusion in the index.
Each month all CTA programs in the Altegris database are ranked by program assets. The 40 largest pro-grams are selected as index constituents for the follow-ing month. The index return for the month is the asset weighted average return of the constituent programs for that month.
As of December 2014, the 40 programs in the index represented assets of approximately $91.4 billion.
The proprietor of the Altegris 40 Index is Altegris Clearing Solutions, LLC, and they, in conjunction with Altegris Advisors, LLC, calculate the index. The index is available without cost online at www.man-agedfutures.com and Altegris Clearing Solutions can be reached at [email protected] or (858) 459-7040.
BARCLAY BTOP50 INDEXThe Barclay BTOP50 Index is designed to represent the performance of CTA programs in the Barclay-
4
Red Rock Capital, LLC 5000 Birch Street, Suite 3000 Newport Beach, CA 92660
www.RedRockCapital.com
4
A Comparison of CTA Indexes | By Thomas N. Rollinger & Scott T. Hoffman | Red Rock Capital
rebalancing of allocations during the year.
As of December 2014, the 457 programs in the index represented assets of approximately $220.8 billion.
The proprietor of the Barclay Systematic Traders Index is BarclayHedge, Ltd., and they also calculate the index. The index is available via a $150 yearly subscription which provides a complete monthly historical data set for all of the Barclay CTA Indexes and monthly updates for the next 12 months. Bar-clayHedge’s website is www.barclayhedge.com and Sol Waksman, the President and Founder of Barclay-Hedge, can be reached at [email protected] or (641) 472-3456.
CISDM CTA EQUAL WEIGHTED INDEX
The CISDM CTA Equal Weighted Index is designed to broadly represent the performance of all CTA programs in the Morningstar database that meet the inclusion requirements.
The index calculation methodology is designed to exclude, each month, constituent performance deemed to be an outlier observation. Each month, statistics are generated for CTA programs in the Morningstar database that meet the inclusion requirements and that have reported returns for that month. Programs whose returns are +/- 3 standard deviations from the average return are excluded. The index return for the month is the simple average return of the non-exclud-ed programs.
As of December 2014 there were 262 constituent pro-grams in the index.
The proprietor of the CISDM CTA Equal Weighted Index is the Center of International Securities and De-rivatives Markets (CISDM) and their research analysts calculate the index. CISDM provides Morningstar with the index on a monthly basis and it is available without cost on both Morningstar’s and CISDM’s websites. See CISDM’s website at www.isenberg.umass.edu/CISDM or contact Patricia Bonnett, Execu-tive Director, at [email protected].
BarclayHedge database that meet the inclusion re-quirements. To qualify for inclusion in the index, a program must have at least four years of performance history. Additional programs introduced by qualified advisors (advisors who have at least one program that meets the four year history requirement) must have at least two years of performance history.
The index constituent list each year is comprised of all CTA programs that meet the inclusion require-ments at the end of the prior year. At the beginning of the year a hypothetical portfolio is formed with each constituent program given an equal allocation. The index monthly return is simply the monthly return of this hypothetical portfolio. There is no rebalancing of allocations during the year.
As of December 2014, the 535 programs in the index represented assets of approximately $232 billion.
The proprietor of the Barclay CTA Index is Barclay-Hedge, Ltd., and they also calculate the index. The index is available via a $150 yearly subscription which provides a complete monthly historical data set for all of the Barclay CTA Indexes and monthly updates for the next 12 months. BarclayHedge’s website is www.barclayhedge.com and Sol Waksman, the President and Founder of BarclayHedge, can be reached at [email protected] or (641) 472-3456.
BARCLAY SYSTEMATIC TRADERS INDEXThe Barclay Systematic Traders Index is designed to represent the performance of CTA programs in the BarclayHedge database whose approach is at least 95% systematic. To qualify for inclusion in the index, a program’s approach must be at least 95% systematic and have at least two years of performance history. The index constituent list each year is comprised of all CTA programs that meet the inclusion requirements at the end of the prior year. At the beginning of the year a hypothetical portfolio is formed with each con-stituent program given an equal allocation. The index monthly rates of return are simply the monthly rates of return of this hypothetical portfolio. There is no
5
Red Rock Capital, LLC 5000 Birch Street, Suite 3000 Newport Beach, CA 92660
www.RedRockCapital.com
5
A Comparison of CTA Indexes | By Thomas N. Rollinger & Scott T. Hoffman | Red Rock Capital
At the end of each year all CTA programs that meet the inclusion requirements are ranked by program assets. The 20 largest programs that meet the inclusion requirements are selected as index constituents for the following year. The index return each month is the simple average of the individual volatility adjusted (normalized) return of each constituent. A rolling 36 month standard deviation of each constituent’s returns is used as the measure of volatility.
As of December 2014, the 20 constituents in the index represented approximately $67 billion in assets.
The proprietor of the iSTOXX Efficient Capital Managed Futures 20 Index is STOXX Ltd, and they independently calculate and publish the index value on a daily basis. Efficient Capital Management serves as the research partner. The index is available online at http://www.stoxx.com/indices/index_information.html?symbol=STXECMF and STOXX can be reached at [email protected] or +41.58.399.5900.
NEWEDGE CTA INDEX The Newedge CTA Index is designed to represent the performance of the 20 largest CTA programs. To qualify for inclusion in the index, a program must be open to new investment and report returns on a daily basis.
At the end of each year all CTA programs in the Newedge CTA database that meet the inclusion requirements are ranked by program assets. The 20 largest programs are selected as index constituents for the following year. At the beginning of the year a hypothetical portfolio is formed with each constituent program given an equal allocation. The index daily return is simply the daily return of this hypotheti-cal portfolio. There is no rebalancing of allocations during the year.
As of December 2014, the 20 programs in the index represented assets of approximately $93.5 billion.
The proprietor of the Newedge CTA Index is Société Générale, and they, in conjunction with BarclayHedge,
CREDIT SUISSE MANAGED FUTURES HEDGE FUND INDEXThe Credit Suisse Managed Futures Hedge Fund In-dex is designed to broadly represent the performance of Managed Futures hedge funds (in contrast to CTA programs) in the Credit Suisse database representing at least 85% of total Managed Futures hedge fund assets under management. To qualify for inclusion in the index, a fund must provide audited financials, have a minimum $50 million in assets, have a minimum one year of performance history, and consistently report to the database.
At the end of each quarter, funds that meet the in-clusion requirements are added to the constituent list for the following quarter. Constituent funds remain in the index until they cease operations even though they may not continue to meet the initial inclusion requirements. The index return each month is the asset weighted average return of all constituents for that month.
As of December 2014, the 32 constituent funds in the index represented approximately $58 billion in assets.
Credit Suisse is both the proprietor and responsible for calculating the Credit Suisse Managed Futures Index. The index is available without cost online at www.hedgeindex.com and Credit Suisse can be reached at [email protected].
ISTOXX® EFFICIENT CAPITAL® MANAGED FUTURES 20 INDEXThe iSTOXX® Efficient Capital® Managed Futures 20 Index is designed to represent the aggregate return of 20 of the largest CTA programs and be easily replicat-ed as an investment product. To qualify for inclusion in the index, a program must have a minimum of $100 million in assets, be open to new investment, be available through a managed account, be offered with fees lower than or equal to the corresponding publically traded fund, and have at least three years of performance history.
6
Red Rock Capital, LLC 5000 Birch Street, Suite 3000 Newport Beach, CA 92660
www.RedRockCapital.com
6
A Comparison of CTA Indexes | By Thomas N. Rollinger & Scott T. Hoffman | Red Rock Capital
calculate the index. The index is available without cost online at www.newedge.com and James Skeggs, Global Head of the Advisory Group, can be reached at [email protected].
NEWEDGE CTA TREND INDEX
The Newedge CTA Trend Index is designed to rep-resent the performance of the 10 largest Trend Fol-lowing CTA programs. To qualify for inclusion in the index, a program must be open to new investment, report returns on a daily basis, be an industry recog-nized Trend Follower, and exhibit significant correla-tion to trend following peers and the Newedge Trend Indicator.
At the end of each year all CTA programs in the Newedge CTA database that meet the inclusion requirements are ranked by program assets. The 10 largest programs are selected as index constituents for the following year. At the beginning of the year a hypothetical portfolio is formed with each constituent program given an equal allocation. The index daily return is simply the daily return of this hypotheti-cal portfolio. There is no rebalancing of allocations during the year.
As of December 2014, the 10 programs in the index represented assets of approximately $73.8 billion.
The proprietor of the Newedge CTA Index is Société Générale, and they, in conjunction with Barclay-Hedge, calculate the index. The index is available without cost online at www.newedge.com and James Skeggs, Global Head of the Advisory Group, can be reached at [email protected].
STARK 300 TRADER INDEX
The Stark 300 Trader Index is designed to represent the performance of the 300 largest CTA programs in the Stark database that meet the inclusion require-ments. To qualify for inclusion in the index, a pro-gram’s CTA must be registered with the NFA and be willing to report performance to the Stark database on
a monthly basis.
Each month all CTA programs in the database are ranked by program assets. The 300 largest programs comprise the constituent list for the following month. The index return for the month is the asset weighted average return of the constituent programs for that month.
As of December 2014, the 300 programs in the index represented assets of approximately $72.56 billion.
Daniel B. Stark & Co., Inc. is both the proprietor and is responsible for calculating the Stark 300 Trader Index. The index is available without cost online at www.starkresearch.com and they can be reached at [email protected] or (619) 702-1230.
STARK SYSTEMATIC TRADER INDEX
The Stark Systematic Trader Index is designed to broadly represent the performance of the all CTA programs in the Stark database whose approach is systematic and that meet the inclusion requirements. To qualify for inclusion in the index, a program’s ap-proach must be systematic, the program’s CTA must be registered with the NFA and be willing to report performance to the Stark database on a monthly basis.
The index return for the month is the asset weighted average return of all programs that meet the inclusion requirements for that month.
As of December 2014, there were 601 constituent pro-grams in the index representing approximately $70 billion in assets.
Daniel B. Stark & Co., Inc. is both the proprietor and is responsible for calculating the Stark Systematic Trader Index. The index is available without cost online at www.starkresearch.com and they can be reached at [email protected] or (619) 702-1230.
7
Red Rock Capital, LLC 5000 Birch Street, Suite 3000 Newport Beach, CA 92660
www.RedRockCapital.com
Type of Weighting Method
Number of CTAs
CTAs Disclosed
Start Date
Backfilled To
Rebalance Frequency
Constituents Reformed
Reporting Frequency
Is Index Investable
ALTEGRIS 40 Asset 40 No Jan-90 N/A Monthly Monthly Monthly No
BARCLAY BTOP50 Equal 20* Yes Jan-02 Jan-87 Annually Annually Daily No
BARCLAY CTA Equal 535* No Jan-87 Jan-80 Annually Annually Monthly No
BARCLAY SYSTEMATIC Equal 457* No Jan-88 Jan-87 Annually Annually Monthly No
CISDM Equal 262* Yes^ Jan-94 N/A Monthly Monthly Monthly No
CREDIT SUISSE Asset 32* Yes Nov-99 Jan-94 Monthly Quarterly Monthly No
ISTOXX EFFICIENT Equal† 20 Yes Aug-12 Jan-01 Monthly Annually Daily Yes
NEWEDGE Equal 20 Yes Jan-00 N/A Annually Annually Daily No
NEWEDGE TREND Equal 10 Yes Jan-12 N/A Annually Annually Daily No
STARK 300 Asset 300 Yes Oct-93 Jan-82 Monthly Monthly Monthly No
STARK SYSTEMATIC Asset 601* Yes Oct-93 Jan-82 Monthly Monthly Monthly No
DESCRIPTIVE INFORMATION
* Number of constituents is dynamic ^ Yes—with subscription † Volatility-adjusted / normalized
Analysis
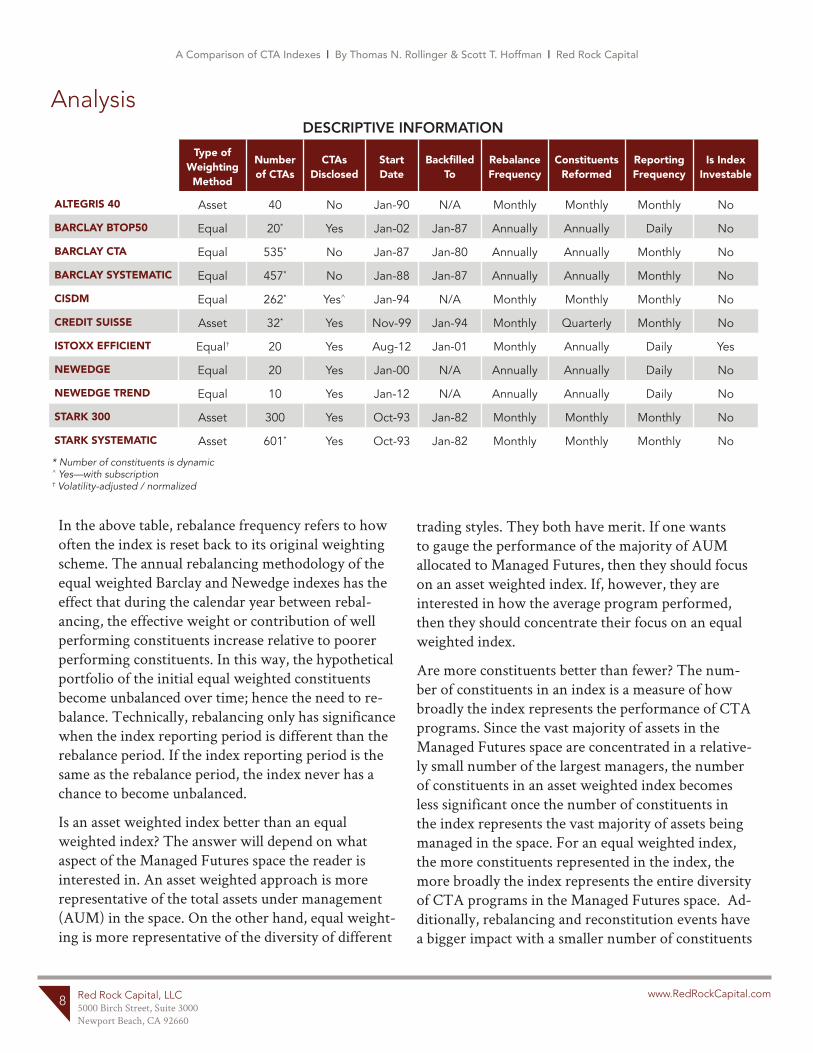
In the above table, rebalance frequency refers to how often the index is reset back to its original weighting scheme. The annual rebalancing methodology of the equal weighted Barclay and Newedge indexes has the effect that during the calendar year between rebal-ancing, the effective weight or contribution of well performing constituents increase relative to poorer performing constituents. In this way, the hypothetical portfolio of the initial equal weighted constituents become unbalanced over time; hence the need to re-balance. Technically, rebalancing only has significance when the index reporting period is different than the rebalance period. If the index reporting period is the same as the rebalance period, the index never has a chance to become unbalanced.
Is an asset weighted index better than an equal weighted index? The answer will depend on what aspect of the Managed Futures space the reader is interested in. An asset weighted approach is more representative of the total assets under management (AUM) in the space. On the other hand, equal weight-ing is more representative of the diversity of different
trading styles. They both have merit. If one wants to gauge the performance of the majority of AUM allocated to Managed Futures, then they should focus on an asset weighted index. If, however, they are interested in how the average program performed, then they should concentrate their focus on an equal weighted index.
Are more constituents better than fewer? The num-ber of constituents in an index is a measure of how broadly the index represents the performance of CTA programs. Since the vast majority of assets in the Managed Futures space are concentrated in a relative-ly small number of the largest managers, the number of constituents in an asset weighted index becomes less significant once the number of constituents in the index represents the vast majority of assets being managed in the space. For an equal weighted index, the more constituents represented in the index, the more broadly the index represents the entire diversity of CTA programs in the Managed Futures space. Ad-ditionally, rebalancing and reconstitution events have a bigger impact with a smaller number of constituents
A Comparison of CTA Indexes | By Thomas N. Rollinger & Scott T. Hoffman | Red Rock Capital
8
Red Rock Capital, LLC 5000 Birch Street, Suite 3000 Newport Beach, CA 92660
www.RedRockCapital.com
A Comparison of CTA Indexes | By Thomas N. Rollinger & Scott T. Hoffman | Red Rock Capital
Annualized Return
Annualized Standard Deviation
Sharpe Ratio (0)
Sortino Ratio (0)
Max Drawdown Skewness Kurtosis
ALTEGRIS 40 5.13% 9.58% 0.54 0.87 -15.74% 0.03 -0.63
BARCLAY BTOP50 4.47% 6.96% 0.64 1.12 -10.92% 0.24 0.30
BARCLAY CTA 3.90% 5.98% 0.65 1.14 -9.96% 0.24 0.30
BARCLAY SYSTEMATIC 3.75% 7.17% 0.52 0.87 -11.81% 0.19 0.33
CISDM 6.71% 8.00% 0.84 1.61 -11.94% 0.44 0.03
CREDIT SUISSE 5.72% 11.19% 0.51 0.82 -17.40% 0.00 -0.81
ISTOXX EFFICIENT 5.05% 7.58% 0.67 1.12 -12.80% 0.02 -0.06
NEWEDGE 5.05% 7.71% 0.65 1.10 -11.97% 0.03 -0.38
NEWEDGE TREND 6.38% 12.34% 0.52 0.82 -17.53% -0.07 -0.48
STARK 300 4.23% 7.16% 0.59 0.99 -10.33% 0.08 -0.58
STARK SYSTEMATIC 4.21% 7.62% 0.55 0.92 -10.71% 0.11 -0.55
U.S. STOCKS 10.90% 14.53% 0.75 1.11 -50.84% -0.86 2.53
AGGREGATE BONDS 4.38% 3.54% 1.24 2.18 -3.93% -0.32 1.87
60% STOCKS / 40% BONDS 8.38% 8.84% 0.95 1.44 -32.48% -1.00 3.61
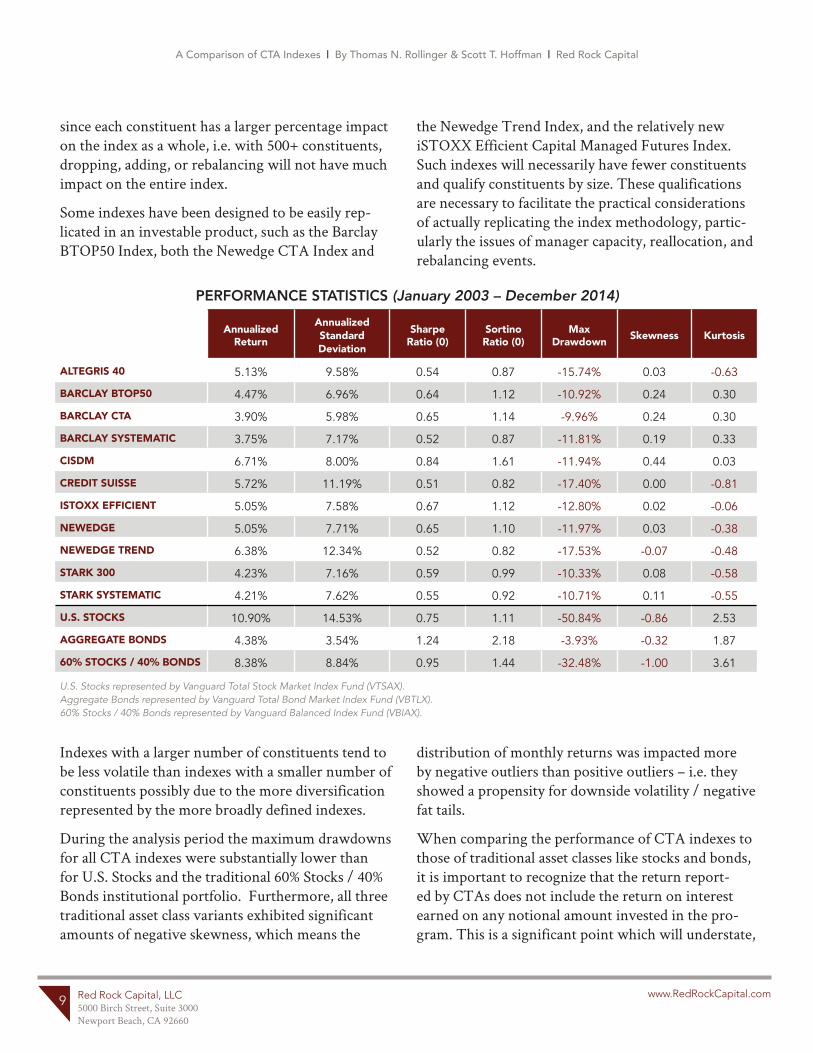
PERFORMANCE STATISTICS (January 2003 – December 2014)
Indexes with a larger number of constituents tend to be less volatile than indexes with a smaller number of constituents possibly due to the more diversification represented by the more broadly defined indexes.
During the analysis period the maximum drawdowns for all CTA indexes were substantially lower than for U.S. Stocks and the traditional 60% Stocks / 40% Bonds institutional portfolio. Furthermore, all three traditional asset class variants exhibited significant amounts of negative skewness, which means the
distribution of monthly returns was impacted more by negative outliers than positive outliers – i.e. they showed a propensity for downside volatility / negative fat tails.
When comparing the performance of CTA indexes to those of traditional asset classes like stocks and bonds, it is important to recognize that the return report-ed by CTAs does not include the return on interest earned on any notional amount invested in the pro-gram. This is a significant point which will understate,
since each constituent has a larger percentage impact on the index as a whole, i.e. with 500+ constituents, dropping, adding, or rebalancing will not have much impact on the entire index.
Some indexes have been designed to be easily rep-licated in an investable product, such as the Barclay BTOP50 Index, both the Newedge CTA Index and
the Newedge Trend Index, and the relatively new iSTOXX Efficient Capital Managed Futures Index. Such indexes will necessarily have fewer constituents and qualify constituents by size. These qualifications are necessary to facilitate the practical considerations of actually replicating the index methodology, partic-ularly the issues of manager capacity, reallocation, and rebalancing events.
U.S. Stocks represented by Vanguard Total Stock Market Index Fund (VTSAX). Aggregate Bonds represented by Vanguard Total Bond Market Index Fund (VBTLX). 60% Stocks / 40% Bonds represented by Vanguard Balanced Index Fund (VBIAX).
9
Red Rock Capital, LLC 5000 Birch Street, Suite 3000 Newport Beach, CA 92660
www.RedRockCapital.com
A Comparison of CTA Indexes | By Thomas N. Rollinger & Scott T. Hoffman | Red Rock Capital
2003 2004 2005 2006 2007 2008 2009 2010 2011 2012 2013 2014ALTEGRIS 40 15.99% 2.57% 4.51% 6.70% 7.18% 15.47% -7.98% 11.33% -3.23% -4.75% -2.45% 15.75%
BARCLAY BTOP50 15.55% 0.86% 2.76% 5.61% 7.57% 13.58% -4.77% 6.38% -4.25% -1.83% 0.76% 12.32%
BARCLAY CTA 8.69% 3.30% 1.71% 3.54% 7.64% 14.09% -0.10% 7.05% -3.09% -1.70% -1.47% 7.21%
BARCLAY SYSTEMATIC 8.71% 0.54% 0.95% 2.10% 8.72% 18.16% -3.38% 7.82% -3.83% -3.20% -1.09% 9.52%
CISDM 11.07% 3.83% 2.44% 5.66% 11.57% 21.76% 0.61% 14.29% -3.14% -1.76% 0.72% 15.12%
CREDIT SUISSE 14.15% 5.96% -0.11% 8.05% 6.00% 18.23% -6.57% 12.20% -4.19% -2.93% -2.56% 18.36%
ISTOXX EFFICIENT 15.82% -0.53% 5.58% 7.70% 9.54% 13.24% -3.57% 8.68% -4.82% -3.79% -0.70% 14.35%
NEWEDGE 15.75% 1.46% 3.20% 5.75% 8.05% 13.07% -4.30% 9.26% -4.45% -2.87% 0.75% 15.41%
NEWEDGE TREND 11.91% 2.68% 0.75% 8.24% 8.58% 20.88% -4.80% 13.13% -7.93% -3.52% 2.67% 19.37%
STARK 300 10.55% 2.93% 0.47% 5.94% 5.85% 11.41% -4.18% 7.92% -4.67% -3.38% 4.33% 11.08%
STARK SYSTEMATIC 10.17% 2.86% -0.32% 5.25% 5.85% 12.48% -5.44% 8.36% -4.69% -3.74% 5.25% 14.28%
U.S. STOCKS 31.95% 12.57% 6.12% 15.59% 5.59% -36.99% 28.82% 17.22% 1.10% 16.38% 33.53% 12.57%
AGGREGATE BONDS 1.93% 4.37% 2.51% 4.35% 7.04% 5.24% 6.02% 6.22% 7.71% 4.20% -2.29% 5.96%
60% STOCKS / 40% BONDS 19.98% 9.36% 4.80% 11.07% 6.35% -22.15% 20.17% 13.26% 4.30% 11.51% 18.07% 10.01%
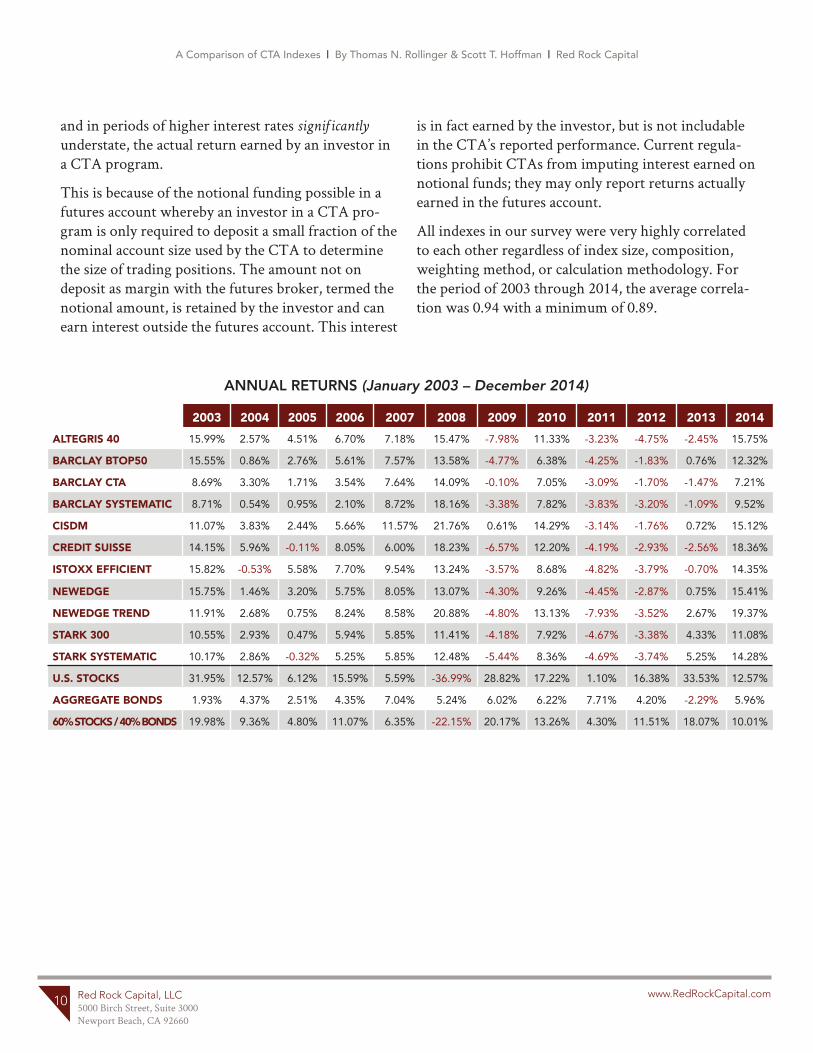
ANNUAL RETURNS (January 2003 – December 2014)
and in periods of higher interest rates significantly understate, the actual return earned by an investor in a CTA program.
This is because of the notional funding possible in a futures account whereby an investor in a CTA pro-gram is only required to deposit a small fraction of the nominal account size used by the CTA to determine the size of trading positions. The amount not on deposit as margin with the futures broker, termed the notional amount, is retained by the investor and can earn interest outside the futures account. This interest
is in fact earned by the investor, but is not includable in the CTA’s reported performance. Current regula-tions prohibit CTAs from imputing interest earned on notional funds; they may only report returns actually earned in the futures account.
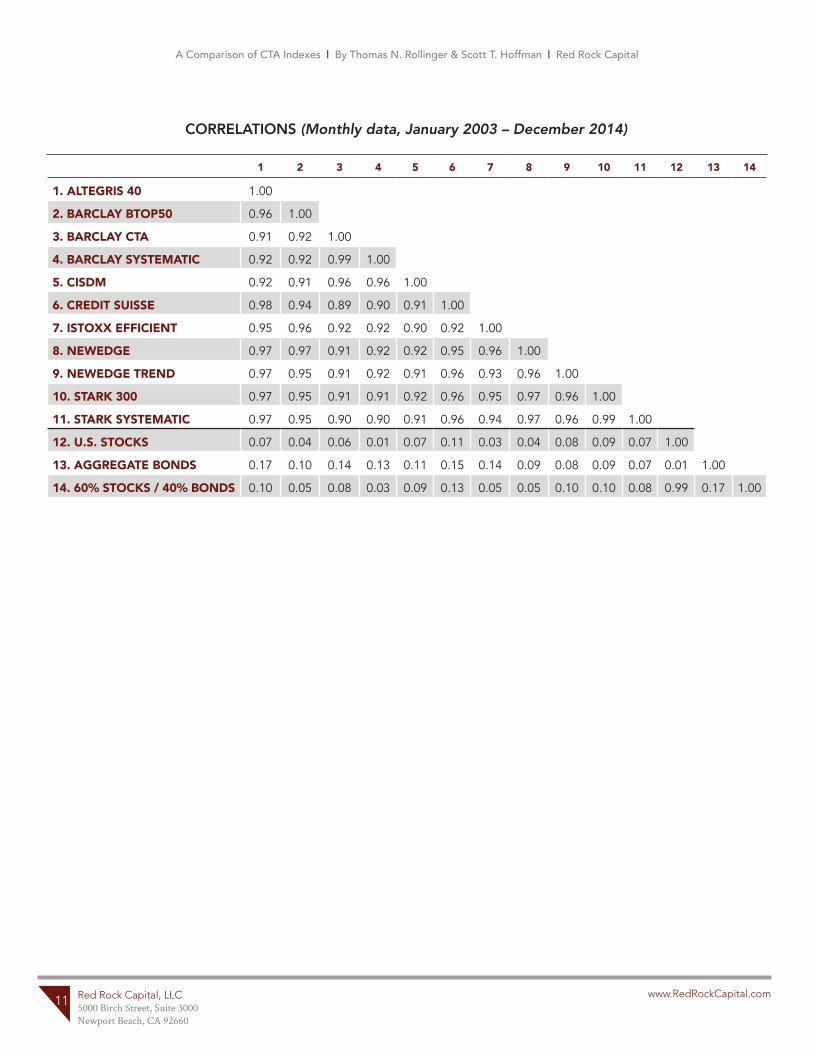
All indexes in our survey were very highly correlated to each other regardless of index size, composition, weighting method, or calculation methodology. For the period of 2003 through 2014, the average correla-tion was 0.94 with a minimum of 0.89.
10
Red Rock Capital, LLC 5000 Birch Street, Suite 3000 Newport Beach, CA 92660
www.RedRockCapital.com
A Comparison of CTA Indexes | By Thomas N. Rollinger & Scott T. Hoffman | Red Rock Capital
1 2 3 4 5 6 7 8 9 10 11 12 13 14
1. ALTEGRIS 40 1.00
2. BARCLAY BTOP50 0.96 1.00
3. BARCLAY CTA 0.91 0.92 1.00
4. BARCLAY SYSTEMATIC 0.92 0.92 0.99 1.00
5. CISDM 0.92 0.91 0.96 0.96 1.00
6. CREDIT SUISSE 0.98 0.94 0.89 0.90 0.91 1.00
7. ISTOXX EFFICIENT 0.95 0.96 0.92 0.92 0.90 0.92 1.00
8. NEWEDGE 0.97 0.97 0.91 0.92 0.92 0.95 0.96 1.00
9. NEWEDGE TREND 0.97 0.95 0.91 0.92 0.91 0.96 0.93 0.96 1.00
10. STARK 300 0.97 0.95 0.91 0.91 0.92 0.96 0.95 0.97 0.96 1.00
11. STARK SYSTEMATIC 0.97 0.95 0.90 0.90 0.91 0.96 0.94 0.97 0.96 0.99 1.00
12. U.S. STOCKS 0.07 0.04 0.06 0.01 0.07 0.11 0.03 0.04 0.08 0.09 0.07 1.00
13. AGGREGATE BONDS 0.17 0.10 0.14 0.13 0.11 0.15 0.14 0.09 0.08 0.09 0.07 0.01 1.00
14. 60% STOCKS / 40% BONDS 0.10 0.05 0.08 0.03 0.09 0.13 0.05 0.05 0.10 0.10 0.08 0.99 0.17 1.00
CORRELATIONS (Monthly data, January 2003 – December 2014)
11
Red Rock Capital, LLC 5000 Birch Street, Suite 3000 Newport Beach, CA 92660
www.RedRockCapital.com
9
A Comparison of CTA Indexes | By Thomas N. Rollinger & Scott T. Hoffman | Red Rock Capital
Appendix I
SYSTEMATIC TREND FOLLOWINGSystematic Trend Following (“Trend Following”) is a mature and well-established trading style, having demonstrated performance persistence for more than thirty years. Approximately 72% of the assets under management in Managed Futures belong to this strat-egy sub-style.2
Trend Following attempts to capture price trends which generally result from sustained capital flows across asset classes. Investable trends often occur as markets move both toward and away from their natu-ral equilibrium.2
Most Trend Following strategies are of the momen-tum or “break-out” style, both of which attempt to capture large directional moves. Trend followers generally place stop orders to limit losses when trends reverse. Most trend followers, however, will either not utilize profit objectives, or will set profit objec-tives much further away from the entry price than the stop-loss orders.1 The basic strategy often results in a payout profile that is similar to being long options; that is, the strategy experiences large profits when a trend emerges, but relatively small losses when trends reverse or fail to materialize.7
Managers who deploy these trading strategies gener-ally make investment decisions systematically, based on mechanical rules devised through statistical and historical analysis.1 Trend Following has evolved from its naïve, primarily rules-based beginnings to become a highly sophisticated group of quantitative strategies whose ability to generate robust returns has been enhanced by more precisely controlling risk and drawdown.2
Managers may attempt to capture price trends across a wide variety of time horizons, from intraday to more than one year. Most intermediate- and long-term trend followers are focused on time frames of a few weeks to a few months. Some managers choose to fo-
cus exclusively on one time frame, while others trade a variety of time frames in an attempt to enhance di-versification. Since trend followers typically diversify across both markets and time frames, it becomes quite likely that at any point in time, trends will be present in several market and/or time-frame combinations.1 Obviously differences in risk budgeting across mar-kets, time horizons, and parameter selection will result in Trend Following programs that produce somewhat different return profiles.2
Appendix II
WHERE INSTITUTIONAL INVESTORS POSITION MANAGED FUTURES AND CTAS
According to a survey in the Barclays Capital February 2012 Hedge Fund Pulse report, institutional investors viewed the top three key benefits of investing in CTAs as:
1) Low correlation to traditional return sources
2) The risk-mitigation/portfolio-diversifying characteristics of the strategy
3) The absolute-return component of the strategy and its attributes as a source of alpha
Also, 50% of the investors had some of their current hedge fund portfolio allocated to CTA strategies, while 50% of investors surveyed plan to increase their allocations to the strategy in the next six months.4
More recent data found in Preqin’s 2015 Global Hedge Fund Report8 shows that:
• 19% of institutional investors felt the performance of CTAs/Managed Futures exceeded expectations in 2014. This is up from only 2% of investors that felt performance exceeded expectations throughout 2013.
• During 2014, 22% felt performance fell short of expectations. This was down from almost half of investors that felt CTAs fell short of expectations in 2013.
12
Red Rock Capital, LLC 5000 Birch Street, Suite 3000 Newport Beach, CA 92660
www.RedRockCapital.com
11
A Comparison of CTA Indexes | By Thomas N. Rollinger & Scott T. Hoffman | Red Rock Capital
References
1. Park, Peter, Tanrikulu, Oguz and Wang, Guodong. “Systematic Global Macro: Performance, Risk and Correlation Characteristics.” February 24, 2009.
2. Abrams, Ryan, Bhaduri, Ranjan and Flores, Elizabeth. “Lintner Revisited — A Quantitative Analysis of Managed Futures for Plan Sponsors, Endowments and Foundations.” CME Group, May 2012.
3. Bakken, Henry H. “Futures Trading — Origin, Development, and Present Economic Status.” University of Wisconsin. Mimir Publishers, Inc., 1966: p. 3.
4. Barclays Capital. “Trending Forward: CTAs/Managed Futures.” Hedge Fund Pulse, February 2012.
5. Bhaduri, Ranjan and Art, Christopher. “Liquidity Buckets, Liquidity Indices, Liquidity Duration, and their Applications to Hedge Funds.” Alternative Investment Quarterly, Second Quarter, 2008.
6. Ramsey, Neil and Kins, Aleks. “Managed Futures: Capturing Liquid, Transparent, Uncorrelated Alpha.” The Capital Guide to Alternative Investment. ISI Publications, 2004: pp. 129–135.
7. Hsieh, David A. and Fung, William. “The Risk in Hedge Fund Strategies: Theory and Evidence from Trend Followers.” The Review of Financial Studies, Vol. 14, No. 2, Summer 2001. Available at SSRN: http://ssrn.com/abstract=250542
8. Preqin. “Overview of CTAs”, 2015 Preqin Global Hedge Fund Report, January 2015.
13
Important Disclosures
This document is for informational purposes only, and it is not a solicitation for investment. Past results are not necessarily indicative of future results. An investment with any Commodity Trading Advisor should only be made after careful study of the advisor’s Disclosure Document, including the description of the objectives, principal risks, charges, and fees associated with such an investment.
• 13% of investors worldwide are seeking CTA investments over the course of this year. This compares to 10% of investors that were seeking CTA investments the year before.
• 20% of private wealth firms specifically are targeting CTA investments this year.
• There are 1,093 institutional investors worldwide that invest in CTAs. This us up from 982 at the end of 2013.
• Fund of hedge funds make up almost a third (32%) of investors with an investment preference for CTAs. This is followed by foundations and public pension funds, which both account for 12% each, and private pension funds which account for 11%.
• 58% of investors with an investment preference for CTAs are based in North America, 29% in Europe, 11% in Asia and 2% across the rest of the world.
Red Rock Capital, LLC 5000 Birch Street, Suite 3000 Newport Beach, CA 92660
www.RedRockCapital.com
Red Rock Capital is an award-winning commodity investment management firm. The firm is helmed by Thomas Rollinger, most notably a devoted pupil and former protégé of quantitative hedge fund pioneer and legend, Edward O. Thorp.
Rollinger, along with his partner Scott Hoffman, developed and actively manage two award-winning quantita-tively based, systematic CTA programs. The Commodity Long-Short strategy just won a coveted peer-decided award for outstanding performance from CTA Intelligence. And throughout its 11+ year track record the System-atic Global Macro program (Systematic Trend Following) has won multiple industry awards for excellence in performance.
Registered with the Commodity Futures Trading Commission (CFTC) as a Commodity Trading Advisor (CTA), and as a member of the National Futures Association (NFA), Red Rock Capital will proudly celebrate its 12th anniversary during 2015.
Given recent developments with the firm, plus favorable market conditions, it is especially well-positioned to grow and thrive in the alternative investment arena.
A Comparison of CTA Indexes | By Thomas N. Rollinger & Scott T. Hoffman | Red Rock Capital
16
14
About Red Rock Capital, LLC