Embed Size (px)
Citation preview

Walden UniversityScholarWorks
Walden Dissertations and Doctoral Studies Walden Dissertations and Doctoral StudiesCollection
2015
A Comparison of Dominant Intellectual Strengthsand Learning Styles in College FreshmenJessica MioduszewskiWalden University
Follow this and additional works at: https://scholarworks.waldenu.edu/dissertationsPart of the Educational Psychology Commons, and the Psychology Commons
This Dissertation is brought to you for free and open access by the Walden Dissertations and Doctoral Studies Collection at ScholarWorks. It has beenaccepted for inclusion in Walden Dissertations and Doctoral Studies by an authorized administrator of ScholarWorks. For more information, pleasecontact [email protected].

Walden University
College of Social and Behavioral Sciences
This is to certify that the doctoral dissertation by
Jessica Mioduszewski
has been found to be complete and satisfactory in all respects, and that any and all revisions required by the review committee have been made.
Review Committee
Dr. Michael Horton, Committee Chairperson, Psychology Faculty Dr. Ann Romosz, Committee Member, Psychology Faculty Dr. Elisha Galaif, University Reviewer, Psychology Faculty
Chief Academic Officer Eric Riedel, Ph.D.
Walden University 2015

A Comparison of Dominant Intellectual Strengths and Learning Styles
in College Freshmen
by
Jessica Marie Mioduszewski
M.S., Niagara University, 2004
B.S., Long Island University: Southampton College 2002
Dissertation Submitted in Fulfillment
of the Requirements for the Degree of
Doctor of Philosophy
General Psychology
Walden University
December 2015

Abstract
Remediation has become a compensatory way for an increasing number of students to
attend college. The problem addressed in this study was whether student intellectual
strengths and learning style preferences were, in part, related to placement or enrollment
in remediation courses. The purpose of this quantitative study was to assess whether a
particular learning style or dominant intellectual strength was characteristic of freshmen
enrolled in remediation courses compared to freshmen not enrolled in remediation
courses. This study filled a gap in the literature as no studies have analyzed the
combination of learning style preferences with dominant intellectual strengths in an
American college population. Its theoretical foundations were Gardner’s multiple
intelligence theory and Kolb’s experiential learning theory. A total of 84 participants
completed a demographics survey, the Multiple Intelligence Profiling Questionnaire III,
and the Learning Styles Inventory. Results from the Spearman Rho correlation indicated
a significant negative correlation between logistic/mathematical intellectual strengths and
enrollment in remediation. For learning style preferences, students enrolled in
remediation courses were significantly more likely to identify as Assimilating learners.
Students in remediation were also significantly more likely to identify as
Accommodating learners in comparison to students not enrolled in remediation courses.
These results suggest that the college curriculum and how it is taught could be altered to
accommodate both students’ strengths and strengthen weaknesses in order to facilitate
higher levels of academic success, ultimately leading to higher graduation rates and better
employment opportunities; these improvements might, in turn, facilitate positive changes
for communities in South Florida.

A Comparison of Dominant Intellectual Strengths and Learning Styles
in College Freshmen
by
Jessica Marie Mioduszewski
M.S., Niagara University, 2004
B.S., Long Island University: Southampton College 2002
Dissertation Submitted in Fulfillment
of the Requirements for the Degree of
Doctor of Philosophy
General Psychology
Walden University
December 2015

Dedication
I would like to dedicate this body of work to both my parents, Mike and Lani, and
my loving husband, David. My parents always pushed to me to pursue learning and
education as a whole and so part of the reason I pursued getting a doctoral degree in the
first place. In addition, my husband was there through thick and thin; whether as a
measure of emotional support, or just someone who could pick up the slack around the
house while I sat at the computer. Without these people, I do not know if I would have or
could have reached this point. Thank you to all three of you.

Acknowledgments
I would like to acknowledge the efforts of Dr. Michael Horton and Dr. Ann
Romosz who served as my dissertation committee. Thank you for the guidance and
academic support.
I would also like to acknowledge my triathlon team, Try a Tri, for helping me
keep my body as fit as my mind and serving as a way to get out of the house to relieve
some stress.

i
i
Table of Contents
Chapter 1: Introduction to the Study ....................................................................................1
Background of the Study ...............................................................................................1
Problem Statement .........................................................................................................4
Purpose of the Study ......................................................................................................5
Research Questions and Hypotheses .............................................................................5
Theoretical Framework ..................................................................................................7
Nature of the Study ........................................................................................................8
Definition of Terms........................................................................................................8
Assumptions ...................................................................................................................9
Limitations .....................................................................................................................9
Scope and Delimitations ..............................................................................................11
Significance of the Study .............................................................................................12
Summary……………………………………………………………………….. ........15
Chapter 2: Literature Review .............................................................................................17
Introduction ..................................................................................................................17
The College Environment ............................................................................................19
Theory of multiple intelligences ..................................................................................22
Experiential learning theory .........................................................................................23
Instrumentation ............................................................................................................27
Multiple Intelligence Inventory ...................................................................................28

ii
ii
Summary ......................................................................................................................29
Chapter 3: Research Method ..............................................................................................31
Introduction……………………………………………………………………. .........31
Research Design and Approach ...................................................................................32
Setting and Sample ......................................................................................................32
Participants .............................................................................................................33
Procedures ..............................................................................................................34
Data Collection and Analysis.......................................................................................35
Instrumentation and Materials .....................................................................................35
Demographics Questionnaire .................................................................................37
Multiple Intelligence Profile Questionnaire III ......................................................37
Learning Style Inventory Version 3.1 ....................................................................39
Protection of Human Participants ................................................................................42
Dissemination of Findings ...........................................................................................43
Summary ......................................................................................................................43
Chapter 4: Data Collection and Results .............................................................................45
Introduction ..................................................................................................................45
Data Collection ............................................................................................................46
The Sample ..................................................................................................................47
Results ..........................................................................................................................49
Summary ......................................................................................................................59

iii
iii
Chapter 5: Discussion, Conclusions, and Recommendations ............................................61
Introduction…………………………………………………………………... ...........61
Interpretation of the Findings.......................................................................................62
Limitations ...................................................................................................................65
Recommendations ........................................................................................................68
Social Change Implications .........................................................................................70
References ..........................................................................................................................72
Appendix ............................................................................................................................81
Permission to use the MIPQ III .........................................................................................81
Permission to Use the LSI 3.1............................................................................................83 Spearman Rho Correlation Matrix for Remediation and Intellectual Strengths………....86 Internal Review Board Documentation .............................................................................87

1
Chapter 1: Introduction to the Study
Background of the Study
Remediation has become a compensatory approach to attending college for many
students and the number of students enrolled in remedial classes keeps rising (National
Center for Educational Statistics [NCES], 2008). In 2000, the College Board reported that
28% of college students had been enrolled in remedial courses. By the 2007-08 school
year, it had risen to 36% (National Center for Educational Statistics [NCES], 2008). In
some areas, this percentage may be even higher. The State Impact Florida Report (2013)
cited that one in two students in Florida failed at least one section of the college
placement exam and had to take a remedial course when they entered college. This
increase in enrollment has created a variety of problems for students, colleges, and the
communities in which they live. Students enrolled in remediation usually take longer to
graduate, complete school with fewer 4-year degrees versus 2-year degrees, and are more
likely to drop out (Berkowitz, 2006; Cutolo & Rutherford, 2007). With a higher dropout
rate, it also becomes a financial burden on the state’s economy because the state does not
get a return on this educational investment (State Impact Florida Report, 2013). It is
estimated that if retention rates dropped, as much as $3.7 billion could be saved
nationwide annually (National Conference of State Legislatures, 2013).
According to Vandal (2011), this increase in enrollment to has been attributed to
many different issues. Students often do not find that they are in need of college
remediation until 12th grade, after they have failed placement exams. Likewise, many
students do not understand the importance of their performance on these exams and how

2
it impacts which courses they will be allowed to take (National Conference of State
Legislatures, 2013).
Researchers have yet to study the role that student learning styles and dominant
intellectual strengths may play among freshmen enrolled in remediation and those not
enrolled in remediation. This study sought to determine whether certain learning styles or
dominant intellectual strengths were overrepresented in remedial versus non-remedial
freshmen students. It also sought to determine whether there is a relationship between
placement in remedial courses and certain learning styles and dominant intellectual
strengths.
Multiple assessments of intelligence may also lead to better predictions of
academic achievement. For example, according to Dickinson and Hiscock (2010), the
typical uniform score of the intelligence quotient (IQ) used to assess measures of
academic success is strewn with controversies. They showed that traditional IQ tests have
to be reassessed frequently as the Flynn effect tends to skew results as subjects tend to
almost always score more highly on older versions of intelligence tests. They further
showed that IQ also seems to change with age. Suzuki and Valencia (1997) showed that
there may even be discrepancies in IQ between different ethnic groups.
In terms of those different measures and ideas about what makes a person
intelligent, Gardner (2004) proposed that intelligence cannot merely be explained using
one score, but that individuals are composed of many different combinations of
intellectual strengths. Kolb (1984) suggested ways of assessing the learning strengths of

3
individuals—classifying individuals into various preferential learning styles—without the
labeling of an IQ score.
Researchers have analyzed the learning styles and/or the dominant intellectual
strengths of individuals (Cutolo & Rochford, 2007; Silver, Strong, & Perini, 1997; Scott,
2008; Strang, 2010; Wu & Alrabah, 2009). However, no researchers focused on both
Kolb’s (1984) learning style profiles and Gardener’s (2004) multiple intelligences
together within an American college population. Thus, this study will fill a gap in the
literature. With the work of both Gardener and Kolb in mind, I examined the different
incident rates of learning styles and dominant intellectual strengths in remediation and
non-remediation students. I also conducted two correlations in this study. First, I
determined if a significant correlation existed between certain dominant intellectual
strengths and being enrolled in remediation. Next, I examined whether there is a
significant correlation between certain learning style preferences and being enrolled in
remediation.
The remainder of this chapter covers the problem under study, the purpose, the
research questions and hypotheses, and the significance of the study. It also covers the
nature of the study, definitions of terms, the limitations, delimitations, assumptions, and
the social change implications.

4
Problem Statement
Students enrolled in remedial courses face more obstacles to graduating compared
to students not enrolled in remediation courses. Wu and Alrabah (2009) analyzed
learning styles and intellectual strengths amongst Kuwaiti and Taiwanese students, but
no studies have been found with similar focus or methodology for any Western
population. Tierney and Garcia (2008) looked at the struggles of at-risk college students,
but were not able to cite that the learning style preference or dominant intellectual
strengths might be another set of factors that could put students at risk. Silver, Strong,
and Perini (1997) suggested methods for integrating both learning style preferences and
multiple intelligences in the classroom, but did not mention how this could impact a
collegiate environment. The problem addressed in this study was whether student
intellectual strengths and learning style preferences were, in part, related to placement or
enrollment in remediation courses.

5
Purpose of the Study
The purpose of this quantitative study was to assess whether a particular learning
style or dominant intellectual strength had a higher incident rate in freshmen enrolled in
remediation courses compared to freshmen not enrolled in remediation courses. I also
determined if a correlation exists between certain learning styles and being enrolled in
remediation courses and if certain dominant intellectual strengths correlate to being
enrolled in remediation courses. With this knowledge, the hope was to help improve the
educational environments of both freshmen in remediation and freshmen not enrolled in
remediation and thus foster higher retention and graduation rates.
Research Questions and Hypotheses
After an analysis of the literature, I based this study on the following variables:
the incident rate of dominant intellectual strengths, the incident rate of learning style
preferences, and being enrolled in remediation. These variables yielded the following
four research questions and their hypotheses:
RQ1: What is the incident rate of dominant intellectual strengths in college
freshmen enrolled in remediation courses compared to those not enrolled in
remediation courses?
H10: There will not be a significant difference between the incident rate of
dominant intellectual strengths in college freshmen enrolled in remediation
courses compared to those not enrolled in remediation courses.

6
H1A: There will be a significant difference between the incident rate of
dominant intellectual strengths in college freshmen enrolled in remediation
compared to those not enrolled in remediation courses.
RQ2: What is the incident rate of learning styles in college freshmen enrolled in
remediation courses compared to those not enrolled in and non-remediation
courses?
H20: There will not be a significant difference in the incident rate of learning
styles in college freshmen enrolled in remediation courses compared to those
not enrolled in and non-remediation courses.
H2A: There will be a significant difference in the incident rate of learning
styles in college freshmen enrolled in remediation courses compared to those
not enrolled in and non-remediation courses.
RQ3: Is there a correlation between certain intellectual strengths and being
enrolled in remediation?
H30: There will not be a significant correlation between certain intellectual
strengths and being enrolled in remediation courses.
H3A: There will be a significant correlation between certain intellectual
strengths and being enrolled in remediation courses.
RQ4: Is there a correlation between certain learning styles and being enrolled in
remediation?
H40: There will not be a significant correlation between certain learning styles
and being enrolled in remediation courses.

7
H4A: There will be a significant correlation between certain learning styles
and being enrolled in remediation courses.
Theoretical Framework
Two theories provided the theoretical background for this study. Gardner’s (2004)
multiple intelligence theory is based on the concept that people have different
combinations of eight different types of intelligences: spatial, musical, linguistic,
bodily/kinesthetic, naturalistic, logical/mathematical, intrapersonal, and interpersonal
(Gardner, 2004). These intellectual strengths form the basis by which individuals learn
best. I will use this theory to identify each participant’s intellectual strengths.
The second theory is Kolb’s (1984) experiential learning theory. Kolb posited that
there is a cyclical nature to the learning process that runs through experience,
observation, abstract conceptualization, and experimentation. From these stages, Kolb
hypothesized that there are four learning styles: assimilators, convergers, accommodators,
and divergers. I will use this theory to determine participants’ learning style preference.
Both theories take advantage of multiple facets of a person’s individual strengths as well
as the environments in which they are best suited to learn. It is important to note that both
theories do not come without criticism though. Klein (1997) suggested that the Gardner’s
theory of multiple intelligences is still too general and thus, not an optimal theory to use
as a basis for designing curriculum. Holman, Pavlica, and Thorpe (1997) postulated that
Kolb’s experiential learning theory is actually too narrow in nature. They explained that
this theory takes all life experience—including all social, historical and cultural aspects

8
of self and mechanically quantifies them thus reducing the whole of existence down to a
few narrow categories.
Nature of the Study
This quantitative, non-experimental survey study sought to investigate whether
certain incident rates of intellectual strengths and preferred learning styles are
characteristic of freshmen enrolled in remediation courses as compared to freshmen not
enrolled in remediation courses. The rationale for choosing a quantitative study was to
understand the learning profiles of an entire population. In order to assess the number of
possible classifications that could result from taking the MIPQ and the LSI 3.1, a survey
design was the most suitable. This design was not experimental because the focus of the
study did not require the use of a control group or manipulation by the researcher. The
independent variable for this study was whether a student was enrolled in remediation.
The first dependent variable was each participant’s highest multiple intelligence score.
The second dependent variable was each participant’s learning style. Data were collected
anonymously from Palm Beach State College freshmen through an online survey
accessed through a research website. The data were transferred to SPSS Statistics 23 and
analyzed through descriptive statistics, correlations, and post hoc testing.
Definition of Terms
Dominant intellectual strength: the top scoring intellectual strength stated for
each person based off of Gardner’s (1983) multiple intelligence theory.
Freshman: a first year student who is currently enrolled at least part time (9 credit
hours) and has accrued fewer than 24 credit hours (Palm Beach State College, 2015).

9
Learning styles: one of four major classifications of preferred ways by which
individuals are thought to learn best based off of Kolb’s (2005) experiential learning
theory
LSI 3.1: an abbreviation for Kolb’s learning styles inventory version 3.1; which
will be used to measure learning style preferences in this study (Kolb, 1984).
MIPQ III: Acronym for the Multiple Intelligence Profiling Questionnaire III
developed by Tirri and Komulainen (2002), which will be used to assess multiple
intelligences for this study.
Remediation courses: courses taught that are designed to improve upon academic
weaknesses such as reading, writing, and math. (Palm Beach State College, 2015)
Assumptions
It was the assumption, as the primary researcher, that students participating in the
study will answer the survey questions honestly. It was also assumed that the instruments
being used, the LSI 3.1 and the MIPQ III, actually measured learning style preferences
and their dominant intellectual strengths since they had been previously normed and
validated by (Kayes, 2005; Ruble & Stout, 1990, 1991; Veres, Sims, & Locklear, 1991;
Tirri and Nokelnenain, 2002; Wiersta & Dejong, 2002).
Limitations
South Florida is an ethnically mixed area so it is possible that the results of this
study may only be applicable to populations either from this area or having similar
demographics due to selection bias. This was difficult to control for since sample
procedures were based upon convenience. It was the hope that the sample size would

10
have been large enough to offset that, but this was not achieved. There are also many
foreign students attending college in this region, so another limitation may have been that
only American citizens were selected for this study as it has been cited as part for the
scope this research.
There has been little published data presented on the validity of the MIPQ III and
so conclusions made from the results of this study may be restricted. The combination of
the MIPQ III and the LSI 3.1 addressed this issue to provide consistent responses in both
students in remediation and students not enrolled in remediation. In addition, there may
be sample and access limitations as I could only access students through the permission
of the professors that choose to let me into their classrooms for recruiting purposes.
Two confounders may have also limited the reliability of the study. I did not be
analyze gender differences or analyze each remedial course separately as it would have
limited my potential sample size. However, current research has not cited that gender
differences or type of course yield significant differences in learning profiles Wu and
Alrabah (2009). Self-report and social desirability biases may have been limitations in
this study as well. Participants may have answered the survey questions in a way as to
make themselves appear more desirable or to meet what they think the researcher wanted
them to answer. Since the survey was online, it helped to address this limitation as I was
not physically present when students filled out the survey to cause any undue influence to
behavior as it might have should I have stayed to watch students fill out the survey.

11
Scope and Delimitations
The scope of this study was to focus on specific portions of two groups’ learning
profiles. This focus was chosen in order to serve as a comparison for two populations in
order to assess potential group differences in order to shed light on remedial student
obstacles to graduation. Psychological and demographical instrumentation were used to
measure the variables. A convenience sample of potential participants from college
freshmen classes at Palm Beach State College was used.
Any freshmen student attending Palm Beach State College at least part time could
participate in this study as long as they did meet all of the inclusion criteria. This criteria
included:
1. They must be at least 18 years of age at the beginning of the study.
2. They must be enrolled (not auditing) at Palm Beach State College at least part
time (6 credit hours per semester).
3. They may not be my former students.
4. The remedial participants must be enrolled in at least one remediation course
at the beginning of the study.
5. They must be citizens of the United States.
Students that did not meet these criteria were asked not to participate.
After reviewing the demographics of the nearby community college, Broward
College, it appears as though the demographics of both Palm Beach State College and
this institution are quite similar (Palm Beach State College, 2011, & Broward College,
2008) thus adding to the possible generalization of this study, at least within South

12
Florida. Furthermore, students have access to their results. They can then take this
information to their guidance counselors or advisors and use the information to better
select classes and even career paths.
Significance of the Study
The growing enrollment of college freshmen who opt for or are required to enroll
in remedial classes does not bode well for the students, colleges, or society. Some of the
negative implications and future problems have been noted by (Bettinger & Long, 2004).
Many states are now passing on the costs of remediation down to secondary education
institutions, which already have budgetary problems of their own (Bettinger & Long,
2004). Price (2004) also reported that students who drop out after not being able to
complete their remedial coursework become financially burdened due to using loans and
then have trouble repaying them due to the lack of better economic opportunities, like
higher paying wages. The problem has not gone without notice. Vandal (2011) showed
how students enrolled in remediation are less likely to graduate and that fewer than 27%
of all students in remediation go on to earning a bachelor’s degree. Tierney and Garcia
(2008) reported that secondary education is becoming involved in better preparing
students for college to reduce the number of students enrolled in remediation. Calcagno et
al. (2007) analyzed how age impacted remedial course completion.
With so many inherent problems for students enrolled in remediation courses, the
results of this study have the potential to advance the knowledge of student learning

13
needs for this population which may also foster positive curriculum and policy changes in
a remediation collegiate environment.
The results of this study also filled a gap in the literature. Previous research has
yielded very little information on the combination of learning styles and dominant
intellectual strengths with an American population of college freshmen. There is
currently little information gathered comparing the learning profiles of college freshmen
enrolled in both remedial and non-remedial coursework as well. Acquiring this
information has the potential to improve the educational environments of both freshmen
in remediation and those not remediation and thus foster higher retention and graduation
rates.
Social Change Implications
Five different factors leading to positive outcomes were addressed: (a) better
informing high schools about ways to improve college preparation efforts, (b) developing
instructional practices that are informed by unique needs of all learners in order to yield
higher academic success, c) design of support systems by colleges to increase retention
rates, and (d) students’ increased knowledge and awareness of their own strengths and
styles and how to adapt them for success, and e) empowering minority and low
socioeconomic status students, which comprise the majority of students in remediation.
By contrast, both (d) and (e) clearly have an effect on people.
One of the many issues relating to college remediation is the lack of several
secondary education institutions adequately exposing high school students to the rigor of
college level work. Vandal (2011) reported that many students are unaware of the skills

14
they lack until they take college placement exams as seniors in high school or right after
admission to college. Knowledge of student dominant intellectual strengths and learning
profiles, especially by those most likely to need remediation, may help to guide
administration and teachers in secondary institutions in better addressing these
deficiencies before college admission.
In dealing with the development of more informed instructional practices, many
educators are simply not prepared to deal with the issues associated with unprepared
students or students in remediation (McFarlane, 2010). Mather and Champagne (2008)
have also pointed out that there is no formal post-secondary teacher training for
professors and that the teaching styles in these professors may widely vary. Having a
profile of the learning needs of students in remediation could help post-secondary
instructors create more optimal learning environments for success (Nilsen, 2009).
Support systems on campuses are also a key component of success on many
campuses. Gilardi and Guglielmetti (2011) showed that when students do not engage in
the or take advantage of support systems like university resources and do not engage in
social integration on campus, they are much less likely to understand the meaningfulness
of their learning experiences and more likely to drop out. Knowledge of student learning
needs, like those in this study, could help administrators design better campus support
systems and help students in remediation see that fulfillment of college courses is a
meaningful learning experience and thus help avoid students dropping out.
Knowledge of learning preferences and dominant intellectual strengths has the
ability to help students better understand their own learning needs. Students can use this

15
information to choose successful degree paths and can help students develop more
effective study strategies. Developing effective study strategies is of paramount
importance according to Nilsen (2009) because it is one of the three major factors that
determine why many students drop out.
Lastly, students enrolled in remediation are a vulnerable group that is composed,
in part, of both minorities and students of lower socioeconomic status (Tierney & Garcia,
2008). The data gathered from this study could help this group become more successful,
thus not only ameliorating higher retention rates, but fostering higher graduation rates.
Summary and Transition
Remediation has become a compensatory way for an increasing number of
students to attend college. The problem addressed in this study was whether student
intellectual strengths and learning style preferences were, in part, related to placement or
enrollment in remediation courses. The purpose of this quantitative study was to assess
whether a particular learning style or dominant intellectual strength was characteristic of
freshmen enrolled in remediation courses compared to freshmen not enrolled in
remediation courses. This study filled a gap in the literature as no studies have analyzed
the combination of learning style preferences with dominant intellectual strengths, in an
American college population. Its theoretical foundations were Gardner’s multiple
intelligence theory and Kolb’s experiential learning theory.
The limitations of this study largely dealt with the ethnic demographics and
sampling techniques used in this study along with the lack of established validity of the

16
MIPQ III. However, any freshmen student could participate as long as they met the
specific inclusion criteria.
The results of this study have the potential to advance the knowledge of student learning
needs for this population which may also foster positive curriculum and policy changes in
a remediation collegiate environment. In terms of positive social change, knowledge of
learning preferences and dominant intellectual strengths has the ability to help students
better understand their own learning needs. Students can use this information to choose
successful degree paths and can help students develop more effective study strategies.
The results can also serve as a conduit to better advise both secondary institutions and
colleges regarding college preparation.
Chapter 2 is a review of the literature on the theories of Gardner and Kolb, on
positive changes in different groups of learners, and on the population for this study.
Chapter 3 is an explanation of the methodology that was used to gather the data. Chapter
4 reports the results and Chapter 5 analyzes and interprets the results.

17
Chapter 2: Literature Review
Introduction
The problem addressed in this study was whether student intellectual strengths
and learning style preferences were, in part, related to placement or enrollment in
remediation courses. The purpose of this quantitative study was to assess whether a
particular learning style or dominant intellectual strength was characteristic of freshmen
enrolled in remediation courses compared to freshmen not enrolled in remediation
courses.
The relevance for this study was derived from the fact that students in remediation
face more obstacles to graduating than students not enrolled in remediation (Berkowitz,
2006; Cutolo & Rutherford, 2007). Since Wu and Alrabah (2009) showed different
incident rates of learning style preferences and intellectual strengths amongst different
cultures, the study focused on whether these different incident rates might be prevalent
between students enrolled in remediation and students not enrolled in remediation and
thus also a another potential barrier to graduation.
The theories of Gardner and Kolb highlight how learning can be impacted by
fostering different learning environments. In terms of examining college freshmen, there
was a wealth of literature concerning how this population succeeds or fails academically.
The body of literature presented for this study will focus on this group along with a few
other closely related groups. The literature review will cover the following topics: the
college environment, theory of multiple intelligences, experiential learning theory,

18
instrumentation, the multiple intelligence inventory, methodology, and a summary of the
chapter.
In order to access the literature, I used two main search techniques. I used the
Walden University library. The following databases were accessed through the library:
PsycINFO, PsycARTICLES, PsycEXTRA, PsycTESTS, Health and Psychosocial
Instruments (HaPI), Sage Premier, PsycTESTS & Health and Psychosocial Instruments
Simultaneous Search, SocINDEX with Full Text, ERIC, Academic Search Complete, and
ProQuest Central. I also used Google Scholar. The search terms included: Gardner, Kolb,
multiple intelligences, learning styles, learning style preferences, developmental college
courses, remedial, remedial college courses, freshmen in remediation, freshmen stress,
learning style inventory, multiple intelligences inventory, freshmen in college,
matriculation, at-risk college freshmen, at-risk students learning preferences, at-risk
students multiple intelligences, teaching styles, college environment, experiential
learning theory, and unprepared students. I used the Boolean search option to optimize
my results. Of the 115 articles scanned, 69 articles were chosen based on their relevance
to the study. Data and information were summarized according to the overall findings of
the study, methods used, population surveyed, and the instruments used.
The literature used in this review was published between 1970 (relevant statistical
techniques) and 2013, with more than 80% of the resources having been published
between 2007 and 2011. Most of the articles were peer reviewed; those that were not peer
reviewed merely reported statistics.

19
The College Environment
Students enrolled in remediation courses face several different obstacles to
graduation. Although research has been conducted on this topic, no study was found that
learning style preference or intellectual strengths might be another set of variables that
could put students at risk. This study sought to determine whether certain learning styles
or intellectual strengths were characteristic of first-year college students enrolled in
remediation.
One of the reasons for remediation is that students are unprepared for college-
level work. According to McFarlane (2010), many educators are not prepared to teach
these students and would typically deal with this by weeding them out of college; nor are
they prepared for dealing with how these students might impact both the pace and scope
of a course. McFarlane advised professors to apply the principles of the multiple
intelligence theory by differentiating their instruction and by providing choices to how
students learn concepts to students.
Tierney and Garcia (2008) wrote that universities are trying to find different
methods to deal with unprepared students. Institutions are handling this by (a) raising
standards so unprepared students are not being admitted, (b) offering remedial courses, or
(c) providing college preparatory courses in high school (Tierney & Garcia, 2008). Since
attempting to improve college readiness in high school did not seem to be effective, most
tertiary schools now offer remedial courses in writing, reading, and math.
The structure of remedial coursework seems to have its own effects on higher-risk
students. Attewell et al. (2006) reported that students enrolled in remediation are much

20
more likely to drop out of school. Minorities are over-represented in this population.
Even with these possible negative effects, it does not seem wise to do away with this type
of coursework either. Allensworth, Nomi, Montgomery, and Lee (2009) showed that
when ninth grade remedial classes were not offered, that failing rates decreased but it did
not improve college acceptance rates.
Students, who drop out and are readmitted, have their own set of challenges as
well. Readmitted students usually take longer to graduate (Berkowitz & O’Quin, 2006).
Age seems to be somewhat of a factor as well since younger readmitted students were
more likely to graduate (Berkowitz & O’Quin, 2006). Gilardi and Guglielmetti (2011)
reported that students that work while going to school are also at a higher risk for
dropping out and are more likely not to use university resources. In addition, this group
has a harder time with social integration on campus (Gilardi & Guglielmetti, 2011).
The freshmen college population has its own specific set of stresses to deal with
which may inhibit their ability to get very far in school. Earnest and Dwyer (2010)
reported that many freshmen leave due to overwhelming levels of academic and social
stressors. Much of this stress manifests in the form of improper coping techniques in
dealing with stress as many students simply seek to escape or avoid these stressors
instead of dealing with them (Earnest & Dwyer, 2010).
Nilsen (2009) reported that many freshmen may need to overcome a mismatch
between their expectations and the actual content that is presented during classes. Many
students enter college with ineffective study strategies (Nilsen, 2009). Nilsen stressed that
motivation, self-efficacy, and value expectancy were key factors in preventing students

21
from dropping out of school. In light of these factors, Nilsen advised educational
institutions to allow students to experience success, to encourage tasks that involve
learning by doing, and to increase the motivation of lecturers. One additional positive
solution that could help college students, including the at-risk population, is completion
of a course. Attewell et al. (2006) explained that finishing at least one course tended to
help in the retention of students.
Minority college students and especially freshmen minority students also seem to
be a group that has trouble with social integration and academic success in a collegiate
environment. Hurtado et al. (2007) reported that underrepresented minority science
students were particularly concerned with being able to finance college. This group can
also have trouble finding a sense of belonging on campus and many interactions with
white students presented with mixed results. Hurtado et al. found that when minority
students interacted socially with groups of mostly white students, their sense of belonging
went down. When these same minority students studied with white students; their sense
of belonging increased (Hurtado et al., 2007).
In linking this population with the theories of interest in for this study, Drysdale,
Ross, and Schulz (2001) provided some relevant information. Drysdale et al. wrote
that the college students that were surveyed had different levels of academic achievement
based on their learning preferences. Their use of the Gregorc style delineator showed that
sequential learners performed best in science and math classes (Drysdale et al., 2001). In
art, this same learning style preference yielded a lower GPA typically than those learners
that were considered to be more intuitive. These more random or intuitive learners

22
achieved better grades in fine arts courses. Random or intuitive learners also tend to have
lower overall GPAs than their more sequential counterparts (Drysdale et al. 2001).
Theory of Multiple Intelligences
The theory of multiple intelligences is based upon a diversified approach to
learning as this theory does not advocate that students learn by any one set of strategies or
techniques. This theory also posits that intelligence is just as diversified. However, the
history of diversified learning and intelligence was analyzed before Gardner. Darwin
(2003) started to show a divergence in the way researchers look at intelligence and
determined that life experiences can have an impact on learning and also that some
individuals show lesser or greater intellectual abilities to thrive in our environments.
Cattell (as cited in Bracken, Howell, & Crain, 1993) suggested that intelligence was not
merely inherited. Bracken et al. explained fluid and crystallized intelligence. Fluid
intelligence was defined as the genetic, inherited form of intelligence while crystallized
intelligence was defined as intellect that is affected by education and culture.
Other researchers helped to set the stage for a more diversified approach to
looking at intelligence and learning. Gardner (2004) brought a specific light and focus to
these studies. The premise behind the theory of multiple intelligences stated that an
individual will possess different levels of eight possible intellectual strengths and will
also learn best in environments that promote that person’s individual intellectual
strengths (Gardner, 2004). Gardner listed those intelligences as: spatial,
bodily/kinesthetic, linguistic, logical-mathematical, musical, interpersonal, intrapersonal.

23
Gardner added the naturalistic intelligence. Gardener also suggested both a spiritual and
an existential intelligence as well (Tirri, Kirsi, Nokelainen, & Petri, 2008).
Gardner (2004) explained what each intellectual competency looks like within
the context of the learner. Spatial intelligence involves being able to arrange objects,
scenes, or relate to things in accordance with their relative positions (Gardner, 2004).
Bodily/kinesthetic intelligence involves the physical manipulation of one’s own body and
the manipulation of tools directly connected that person (Gardner, 2004). Linguistic
intelligence deals with the advanced expression of the written word or an eloquence
shown in spoken word (Gardner, 2004). Logical-mathematical intelligence focuses on an
individual’s ability to solve problems quickly (Gardner, 2004). It is a strength often
observed with scientists since their profession demands this skill. Musical intelligence
involves strength in the production of vocal or instrumental music (Gardner, 2004).
Interpersonal and intrapersonal intelligences deal with how individuals interact with
themselves and other people within our environment. Gardner explained that those with a
high level of interpersonal intelligence will have an advanced sensitivity towards others
while intrapersonal intelligence focuses on one’s own grasp of their internal physical and
mental states.
There are three other proposed intelligences that were posited by Gardner (2004);
but, they may or may not be identified by certain instruments. For example, the MIPQ III
covers all of the original seven intelligences along with naturalistic and spiritual
intelligences, but does not measure existential intelligence (Tirri & Nokelainen, 2007). In
terms of what these intellectual strengths are, the naturalistic intelligence deals with how

24
well a person can identify patterns in nature (Gardner, 2004). Tirri and Nokelainen
discussed a similar environmental intelligence which deals with not only nature, but an
understanding of conservation. Spiritual and the existential intelligence deal with an
awareness of cosmic relationships among different portions of the universe (Gardner,
1999). The bodies of work pertaining to the various applications of the theory of multiple
intelligences are numerous and so to narrow the scope down to the main focus of this
study, only the applications that are directly relevant are reviewed.
Experiential Learning Theory
Kolb’s (1984) experiential learning theory is similar in many ways to the theory
of multiple intelligences. Kolb organized learners into categories and classified which
environments would be most useful for that learner type. There are six main statements
that summarize the idea behind the experiential learning theory. Kolb and Kolb (2005)
explained that learning is best looked at as a process. Kolb and Kolb stated that all
learning is relearning. Learning is also based on resolving some sort of conflict with the
world. Learning is based on one adapting to their world (Kolb & Kolb, 2005). Learning
results in synergetic transactions with the world. Kolb and Kolb stated that learning is the
process of creating knowledge. Kolb and Kolb posited that environmental factors can
have an impact on one’s learning styles as well.
Kolb and Kolb (2005) subdivided learning into modes where the learner either
grasps an experience or reflects upon that experience. Placing an individual into an
environment with the correct combination of these learning modes then yields the most
preferred learning style. There are four major learning modes described in this work. The

25
first mode is concrete experience, which is learning by doing activities, labs, and/or field
work. The second mode is reflective observation, which involves actively thinking about
experiences. The third mode is abstract conceptualization, which involves coming up
with a theory based upon perceived experiences. The fourth learning mode is called
active experimentation, which involves actually making a plan to construct theories
(Kolb, 1984).
Based upon the combination of the different learning modes, Kolb (1984)
classified learners into four main categories or styles. According to Kolb and Kolb
(2005), Learners are typically either divergers or convergers and they are either
assimilating or accommodating. Divergers are typically creative and emotional and are a
combination of the concrete experience and the reflective observation learning modes.
Convergers are practical and are a combination of the abstract conceptualization and
active experimentation modes. Assimilators are concise and logical and are a
combination of the abstract conceptualization and reflective observation modes.
Accommodators are more hands-on in their learning style and are a combination of the
concrete experience and active experimentation modes.
Mather and Champagne (2008) investigated Kolb’s (1984) theory using a sample
of third year Canadian college students and their learning style preferences along with
their professors’ teaching techniques. Mather and Champagne noted that often professors
have no educational training and so teaching styles may not be very effective. It was also
noted that student learning styles tend to be varied. Mather and Champagne found that

26
Humanities students had the widest range of learning preferences while those in Health
Science tended to use the Active Experimentation learning mode most.
Mather and Champagne (2008) found that men are almost always convergers,
which is almost always representative of those in the sciences. Mather and Champagne
found that professors typically de-emphasize the Diverger Strategy within their course
outlines. Mather and Champagne stressed that differentiating instruction is key to student
success.
The varied nature of students’ learning style preferences was also evident in a
study done on college freshmen at a large private urban university. Cutolo and Rochford
(2007) used the Dunn and Dunn Learning Style Model to show that learning style
preferences may change due to academic achievement, gender, culture, and age. The
results of this study also showed that the majority of the students surveyed were
analytical learners and that the students were single task persistent. Overall, there was a
strong preference for learning through visual and kinesthetic methods. Cutolo and
Rochford also reported that high and medium achievers prefer not only visual learning
methods, but also prefer structured and reflective activities.
Wu and Alrabah (2009) tied both the experiential learning theory and the theory
of multiple intelligences together. Wu and Alrabah looked at the profiles of both
Taiwanese and Kuwaiti Freshmen college students’ dominant intellectual strengths as
well as their learning style preferences. Wu and Alrabah posited that if teachers know
more about the way their students learn, then they can make better informed decisions on
what to teach and how to teach. The results of this study showed that Taiwanese students

27
are mostly visual learners while Kuwaiti students are more global (a little bit of
everything) and interpersonal in their preferred learning style. Wu and Alrabah concluded
that learning styles and learning preferences may be different based on the culture of the
individuals surveyed. The idea behind different learning styles being influenced by
culture was supported by Borredon, Deffayet, Baker, and Kolb (2011). Borredon et al.
performed a qualitative study in a French management school and found that learning and
the perception of learning is different in other countries.
Instrumentation
Multiple Intelligence instruments can be used to assess more than just the
dominant intellectual strengths of the students; they can be used to assess the teaching
styles of instructors as well. Ball and Perry (2009) assessed the teaching styles of 336
beginning teachers using Myers-Briggs Type Indicator, which yields four major teaching
types based on Gardner’s (2004) list of intelligences. Results of this study showed that
teachers adopt different teaching styles just as students have different intellectual
strengths.
Besides just showing the variation of learning styles and preferences, it is
important to note that applying the theory of multiple intelligences in the classroom tends
to have a positive impact on student motivation. Temız and Kıraz (2007) performed a
qualitative study on first graders and their teachers in order to determine if the multiple
intelligence approach to teaching had an effect on student motivation towards learning to
read. The results showed that students typically responded positively to differentiated
instruction and exhibited high levels of motivation towards this learning process. Temız

28
and Kıraz further implied that developing positive relationships with learning in first
grade may help in lifelong learning. Overall, the theory of multiple intelligences is a
valuable and positive asset to both students and teachers.
Multiple Intelligence Inventory
Griggs, Barney, Brown-Sederberg, Collins, Keith, and Iannacci (2009) applied the
theory of multiple intelligences to a group of 167 students in order to assess whether the
learning needs of the population were being mitigated by their professors. The
instrumentation that Griggs et al. used was the Multiple Intelligence Inventory, which
also tells the participants their results but highlights study strategies for them. Griggs et
al. showed the most of the students are strongest in the realms of their intrapersonal and
interpersonal intelligences. Griggs et al. also showed that students that know their
intellectual strengths would possibly be motivated to change their approach to studying.
Griggs et al. reported that higher education still typically relies heavily on the modalities
of the linguistic or verbal dimensions of intelligence. Within the scope of this study, there
may be disconnect between the needs of students the learning opportunities that college
professors are providing.
Scott (2008) implemented a study using instrumentation and focused partially on
the theory of multiple intelligences. Scott analyzed many of the learning styles and
characteristics of adult learners in Singapore. Some of the most pressing findings of this
study showed that the adult learners were mostly kinesthetic and musically inclined in
terms of their strongest intelligences. This result being so different from the Griggs et al.

29
(2009) study showed that perhaps culture and age may have an impact on which levels of
intelligence are the most dominant.
Methodology
This study utilized an online quantitative survey design. There are many benefits
to using an online research design. Lee and Ang (2003) stated that online survey designs
typically have higher response rates, more quality responses, a lower interviewer bias,
and are more cost effective while also be less time-consuming. Assessing incident rates
on populations is also useful. Incidence rates pertain to the frequency of a behavior or
trait, or characteristic in a population. Correlations allow researchers to ascertain the
relationship between two variables. Specifically, the Spearman correlation allows
researchers to analyze ordinal scale data, although it can be used with other data scales,
especially when the variables of interest may not exhibit a linear relationship (Gravetter
& Wallnau, 2009).
Summary
The purpose of this study was to assess whether a particular learning style or
dominant intellectual strengths are characteristic of freshmen enrolled remediation and in
freshmen not enrolled in remediation. The results of this study filled a gap in the
literature.
Students enrolled in remediation courses face several different obstacles to
graduation. Although research has been conducted on this topic, no study was found that
learning style preference or intellectual strengths might be another set of variables that
could put students at risk.

30
In addition, the freshmen college population has its own specific set of stresses to
deal with which may inhibit their ability to get very far in school. Earnest and Dwyer
(2010) reported that many freshmen leave due to overwhelming levels of academic and
social stressors. Nilsen (2009) reported that many freshmen may need to overcome a
mismatch between their expectations and the actual content that is presented during
classes.
Gardner's (2004) theory of multiple intelligences and Kolb's (2005) experiential
learning theory are both based on multiple strengths of preferences which yield more
optimal learning options for students. These theories became the theoretical framework of
the study.
In linking this population with the theories in for this study, Drysdale, Ross, and
Schulz (2001) provided some relevant information. Drysdale et al. wrote that the college
students that were surveyed had different levels of academic achievement based on their
learning preferences. Wu and Alrabah (2009) tied both the experiential learning theory
and the theory of multiple intelligences together. This study was conducted amongst a
Taiwanese and Kuwaiti student population. The results of this study showed that
Taiwanese students are mostly visual learners while Kuwaiti students are more global (a
little bit of everything) and interpersonal in their preferred learning style.
Chapter 3 is an explanation of the methodology that will be used to collect the
data for this study.

31
Chapter 3: Research Method
Introduction
This non-experimental study used an online survey with a self-selected
convenience sample to fill a gap in the literature concerning the incident rate of dominant
intellectual strengths and learning styles in college freshmen enrolled in remediation
courses compared to those not enrolled in remediation courses.
The problem addressed in this study was whether student intellectual strengths
and learning style preferences were, in part, related to placement or enrollment in
remediation courses. The purpose of this quantitative study was to assess whether a
particular learning style or dominant intellectual strength was characteristic of freshmen
enrolled in remediation courses compared to freshmen not enrolled in remediation
courses.
The relevance for this study was derived from the fact that students in remediation
face more obstacles to graduating than students not enrolled in remediation (Berkowitz,
2006; Cutolo & Rutherford, 2007). Since Wu and Alrabah (2009) showed different
incident rates of learning style preferences and intellectual strengths amongst different
cultures, the study focused on whether these different incident rates might be prevalent
between students enrolled in remediation and students not enrolled in remediation and
thus also a another potential barrier to graduation.
This chapter covers the following topics: a detailed description of the research
design and the population being studied, along with how the sample was selected. This

32
chapter also includes a description of the data analysis and the ethical protections
established for the participants.
Research Design and Approach
A quantitative research design was chosen since a larger sample needed to be
studied, that is, a population of freshman college students. A qualitative study would not
have been appropriate: The goal was to classify the population rather than to gain an in-
depth picture of this population. In order to assess the number of possible classifications
that could result from taking the MIPQ and the LSI 3.1, a survey design was the most
suitable. This design was not experimental because the focus of the study did not require
the use of a control group or manipulation by the researcher. The design was also based
on a self-selected convenience sample. A correlational design was chosen in order to see
if there is a relationship to certain learning profiles and being enrolled in remediation
(Gravetter & Wallnau, 2009). Access to which was granted by individual instructors at
Palm Beach State College.
Setting and Sample
Palm Beach State College, in Palm Beach County in southern Florida, granted
access to the student population of interest. IRB approval was obtained through Walden
University (Approval No. # 05-29-14-0077499) to comply with its ethical protections,
sufficed for approval by the college. Recruitment, which was open only to students
currently enrolled at this college, took place at the college, but the research was carried
out online.

33
Participants
The sample was 51 freshmen students enrolled in at least one remediation college
course along with approximately 31 freshmen who were not enrolled in any remediation
courses at Palm Beach State College with 2 participants counted but missing some data
values. Neither group was matched. However, this number does reflect the minimum
sample size and I tried to recruit more than this minimum. A total sample size of 116
students was originally chosen in order to have enough power to have a notable
correlation through (G*Power Analysis, 2013). However, after numerous emails out to
other professors for recruitment, I eventually stopped getting replies to attend classes.
This may have in part been because of the final exam schedule and the lack of courses
offered by professors during the summer. The projected age range should have been 18-
29 with 57.4% of the population being female and 41.6 % male and an ethnicity
breakdown of: 43.6% White, 26% Black, 3.7% Asian/Pacific Islander, and 23.7%
Hispanic, as per the Palm Beach State College Division of Institutional Research (2012).
Access to this population was granted through this division of Student Affairs at Palm
Beach State College. Once access was granted, I went to freshmen classes to talk about
my study and pass out business cards with the research website address posted on them
along with an offer to text them the research link and remind them to complete via mass
text through Google Voice.
Participants were eligible for this study if they met the following criteria:
1. They must be at least 18 years of age at the beginning of the study.

34
2. They must be enrolled (not auditing) at Palm Beach State College at least part
time (6 credit hours per semester).
3. They may not be my former students.
4. The remedial participants must be enrolled in at least one remediation course
at the beginning of the study.
5. They must be citizens of the United States.
Procedures
After analysis of the sample size of Wu and Alrabah (2009), and an analysis of
the requirements to perform a correlation, it was determined that a sample of 116 would
be the most appropriate for assessing a group of college freshmen. Fifty-eight freshmen
enrolled in remediation courses and 58 students not enrolled in remediation courses
would be an adequate minimum number in order to assess frequency and conduct a
Spearman correlation, although if more individuals are interested than the minimum their
scores will also be used. However, as shown above, this sample concluded with a sample
51 freshmen enrolled in remediation and 31 freshmen not enrolled in remediation. I used
a Spearman correlation since I collected ordinal data.
Recruitment of participants consisted of a brief speech detailing why I am
performing the research and some of the benefits of participating. Students attending the
class will be given a card with my contact information and a link to the research website.
I will only be speaking in freshmen classes. I will be attending a variety of classes, but
cannot ensure exactly which types of classes I will be able to visit since I will be at the
discretion of the course instructors deciding to let me into their classrooms. I will also

35
offer to send students the research website link via text through Google Voice. This gave
me access to participant phone numbers and also let me have the ability to remind
students of the survey deadline.
The research website contained the following items that participants must
complete in order to be considered for data entry:
1. An online description of the scope of the study.
2. An informed consent form that will be signed electronically.
3. A demographics questionnaire
4. The MIPQ III
5. The LSI 3.1
A small incentive was originally proposed to ensure a high enough completion
rate for the study. Every participant that finished the items listed above would have been
entered into a drawing to get a $50 gift card at the end of the study. However, the Walden
IRB did not ultimately allow this incentive. In addition to the first incentive, any student
that wanted their results accessed them by contacting me, the primary researcher, and this
information could have been used with their guidance counselor or advisor to help them
sign up for classes that best fit their learning styles and intellectual strengths.
Data Collection and Analysis
Participants were supposed to electronically sign an informed consent form and
participant responses were kept confidential. However, the Walden University IRB
changed this methodology and directed that the study be anonymous, so this step was
altered. Specific descriptions of security measures and confidentiality will be addressed

36
further in this chapter. Demographic data such as age, ethnicity, gender, whether they are
freshman/ 1st year student, and major were collected for this survey.
Participants were administered an electronic version of the MIPQ III and an
electronic version of the Kolb (2000) LSI 3.1 Data was uploaded into Statistical Package
for the Social Sciences (SPSS Ver. 17) and was analyzed for the frequency of learning
styles and dominant intellectual strengths that appear in each group of subjects. A
Spearman Rho correlation was used to analyze whether significant relationships exist
between the different types of learning styles and dominant intellectual strengths in
freshman students taking remediation courses as compared to those who do not take
remediation courses.
Debriefing took place electronically although participants could have also
requested a formal personal debriefing. All data from the participants were collected and
kept on a computer that was password protected to ensure the security of the data. Data
were also backed up on a flash drive, which was kept in a home safe with a combination
lock. Student names were not be placed on any data.
Instrumentation and Materials
This study was conducted using an informed consent form, a demographics
questionnaire, the MIPQ III, and the LSI 3.1 transcribed onto a website through Google
Docs and the Hay Group. The authors of both instruments were contacted to make sure
that it is permissible to transcribe them into an online format. The MIPQ III was
transcribed into an online format. Permission to use this instrument is located in the
appendix. For the LSI 3.1, permission was given by the publishers at Hay Group and I set

37
up an online account with them for the purposes of this study. Permission was given and
the evidence of this permission is located in the appendix. The validity and reliability of
the instruments are important factors in this design of this study.
Demographics Questionnaire
A five- question survey that asked age, gender, ethnicity, whether they are
freshman/1st year students, and what their major is currently. This was presented at the
beginning of the study after the informed consent form had been electronically signed.
Multiple Intelligence Profile Questionnaire III
The MIPQ III was an instrument designed to assess the dominant intellectual
strengths posited in Gardner’s (2004) theory of multiple intelligences. This instrument
operationalized the different multiple intelligences with a variety of questions and has 35
items each linked to a 5- point Likert scale with 1 (totally disagree) to 5 (totally agree)
(Tirri & Nokelainen, 2007). The most recent version of this assessment included
Gardner’s seven original proposed intelligences along with a spiritual and environmental
dimension that Gardner proposed. The instrument is appropriate for both children and
adults as Tirri and Nokelainen showed when they tested their original sample consisting
of both preadolescents and their teachers.
The MIPQ III was calculated by averaging the number of numerically rated
responses to the questions posed on the assessment as the questions have been
operationalized to represent the nine types of intelligence posited by Gardner (2004).
The meanings behind scores from the MIPQ III illustrate the relative intellectual
strengths of the individual. The results are not showing an inability to learn in a setting

38
where an individual has not scored highly; the instrument is meant to highlight strengths
and not weaknesses (Tirri & Nokelainen, 2002).
Tirri and Nokelainen (2008) assessed the reliability of the MIPQ III through
Cronbach’s alpha (1970) and with a series of Spearman rho correlations. The results of
the analyses showed that the musical and interpersonal scales had the highest reliabilities
with alpha levels ranging between .88-.89. The linguistic and spatial scales had the
lowest reliabilities with alpha levels ranging between .53- .62. Tirri and Nokelainen
(2008) concluded that the reliability of the scale was hard to evaluate since many parts of
the MIT are based on abstract thinking; which is difficult to quantitatively analyze.
Further correlational analyses between these scales also showed that some of the
scales are positively correlated to each other. Tirri and Nokelainen (2008) reported that
the logical-mathematical and the spatial intelligence facets are statistically related.
Likewise, linguistic intelligence is more closely related to intrapersonal intelligence in
comparison to interpersonal intelligence (Tirri & Nokelainen, 2008).
Tirri and Komulainen (2002) reported the validity statistics on the original
version of the MIPQ; which was based on a 7-point Likert scale, as compared to the
MIPQ III; which is based on a 5-point Likert scale. The reason for reporting earlier
evidence is that Tirri and Nokelainen’s (2008) study on the MIPQ III was reported to
have parallel psychometric properties to its predecessors. The validity statistics of the
MIPQ showed a wide distribution of scores with the normative sample of Finnish
preadolescents. The means between all of the groups sampled varied greatly between
2.77 and 5.86. A mixed effect ANOVA also showed that the variation of theses scores

39
was also relatively high at 11%. Between people variation was also quite high at 15%
with a minimum of 2.25 to a maximum of 5.50. Tirri and Komulainen (2002) reported
that the items with the lowest means and the lowest St. dev. Scores tended to either be
too specific or not representative of the population. Tirri and Komulainen (2002)
analyzed the correlations to the items and the original seven domains of the MIT. The
results showed that while the intra class correlations of alpha levels were .90, many
items had to be removed because they did not strongly correlate to any one of the
domains.
Learning Style Inventory 3.1
The LSI 3.1 was designed to measure the learning style preferences using four
major modes- Active Experimentation (AE), Concrete Experience (CE), Reflective
Observation (RO), and Abstract Conceptualization (AC). The formatting of the LSI 3.1 is
a forced choice, quantitative instrument. It is short questionnaire containing 12 items that
contains sets of four sentence completion blocks per item. It takes approximately 30
minutes to complete. Each block of sentence completions is based on the four learning
modes described in the ELT. The instrument is written on a seventh grade reading level
and should ideally be used for teens and adults. It is currently owned by Hay Group.
The LSI version 3.1 measures six variables that include the four learning modes
posited by ELT and two scores that are combination scores. These combination scores
indicate whether an individual prefers abstractness over concreteness and action over
reflection (Kolb & Kolb, 2005).

40
The LSI version 3.1 is scored in order to achieve the four learning modes
proposed by the ELT:
The four basic learning style types—Accommodating, Diverging, Assimilating,
and Converging-are created by dividing the AC-CE and AE-RO scores at the
fiftieth percentile of the total norm group and plotting them on the Learning Style
Type Grid (Kolb 1999a: 6). The cut point for the AC-CE scale is +7, and the cut
point for the AE-RO scale is +6. The Accommodating type would be defined by
an AC-CE raw score <=7 and an AE-RO score >=7, the Diverging type by AC-
CE <=7 and AE-RO <=6, the Converging type by AC-CE >=8 and AE-RO >=7,
and the Assimilating type by AC-CE >=8 and AE-RO <=6. (Kolb & Kolb, 2005,
p. 212)
For the LSI version 3.1, a large and highly varied population was used as the
normative population (N = 6977). Among the participants, 288 were college freshmen
and most of the group (N = 5023) answered the instrument online. The validity and
reliability of this instrument are important to the scope and focus of this any study. The
internal consistency of the LSI has been investigated in four studies (Kayes, 2005; Ruble
& Stout, 1990, 1991; Veres, Sims, & Locklear, 1991; Wiersta & Dejong, 2002). These
researchers suggested that the scales of the LSI version 3.1 show good internal
consistency amongst a variety of populations. The internal consistency alphas for the
reflective observation learning mode are: .81 (Kolb & Kolb, 2005), .78 (Kayes, 2005),
.78 (Wierstra & DeJong, 2002), .67 (Veres et al., 1991), and .72 (Ruble & Stout, 1990). It
is important to note that the more recent studies show higher levels of reliability.

41
The test-retest reliability for this instrument appears is strong. Veres et al. (1991)
ran multiple administrations of the LSI which results in test-retest correlations of over .9.
Ruble and Stout (1991) also looked at test-retest reliability of the LSI which results in
lower correlations of .54. Kolb (1981a) posited that the difference in these results may be
due to the likelihood that situational demands changed during the second study that may
have altered learning style preference.
The validity of this instrument has also been studied. Strong validity would
indicate that the LSI is a true measure of the ELT. The internal validity of this instrument
seems to be harder to study due to the nature of the scales measured. Kolb and Kolb
(2005) showed that amongst distance/online participants in the population, the RO mode
was located at one end and the CE and AE modes are located on the other end of the
spectrum. However, in art students from this study, the spectrum of learning modes is
quite different. Due to these findings, it may add some limitations due to the study.
The external validity of the LSI seems to have more evidence to support it though.
Kolb and Kolb (2005) explained that learning style changes as one ages and the LSI 3.1
also shows different learning mode preferences as age progresses as well. Likewise, the
ELT posits that as one gains education, this increased knowledge should cause an
increase in a preference for abstractedness. Kolb and Kolb showed that the LSI 3.1 also
showed a relationship between the level of education with abstractness. The most recent
version of the Learning Style Inventory 3.1 is an appropriate instrument to be used to
measure the learning style preferences for the population.

42
Protection of Human Participants
As reported by the American Psychological Association's (APA) Ethical
Principles of Psychologists and Code of Conduct (2010), it is vital that psychologists
make necessary provisions in their research to: (a) do no harm to participants, (b) uphold
their professional conduct, (c) perform their work honestly and accurately, (d) make
objective decisions while trying to curtail their biases, and (e) to respect the rights of their
participants and all other people that may benefit from their services. This study was
designed to benefit college level students with relatively little to no risk to the
participants. In order to gain access to participants, IRB approval was obtained through
Walden University (Approval No. # 05-29-14-0077499) to comply with its ethical
protections and documentation for the IRB approval can be found in appendix D.
Recruitment of participants was completely voluntary. After presenting my
recruitment speech, I simply gave potential participants a business card with the research
website link so they could choose to participate outside of the classroom without any
influence from myself or their classroom professor. Student answers and the raw data
were stored on a flash drive and only accessed by the primary researcher to ensure
confidentiality. The data will be stored for 10 years and then destroyed. The research
design itself included a consent form and an electronic debriefing with the option of
contacting the researcher for a copy of their results and further debriefing. To protect the
identities of my participants, the data were all anonymous. In order to offset my own
personal biases and possible biases from potential participants, only participants who

43
have not had me as a teacher participated in this study. Taking these measures within the
study ensured that all of the principles of ethical behavior were met.
Dissemination of Findings
The results of this study were accessible to the participants after the study has
been completed. They may receive their results through email or they may get a verbal
answer via a phone call. Any interested participants could also submit their emails to me
and I will send them the link to the body of work once it has been published.
Summary
The sample for the study was chosen in order to fill a gap in the literature so as to
enhance the overall knowledge about learning to the benefit of the population surveyed
so as to hopefully enact positive social change in this group. A non-experimental survey
design was chosen due the scope of the study and access to the population. The variables
of interest, the incident rate of dominant intellectual strengths, learning styles, and the
relationship between multiple intelligences and learning styles, were measured using the
MIPQ III and the LSI 3.1 and analyzed using SPSS. Both the MIPQ III and the LSI 3.1
have been analyzed in terms of both validity and reliability. However, while both
instruments are generally reliable, there has been little investigation regarding the validity
of the MIPQ III. The participants should have included 102 college freshmen in total with
58 enrolled in remediation and 58 enrolled in non-remediation. Their responses were
anonymous and they had contact information for the researcher so as to ensure proper
dissemination of their results and to protect them from negative emotional effects from
the study.

44
Chapter 4 will include the results and findings of the data collection process that
took place in this study.

45
Chapter 4: Data Collection and Results
Introduction
The problem addressed in this study was whether student intellectual strengths
and learning style preferences were, in part, related to placement or enrollment in
remediation courses. The purpose of this quantitative study was to assess whether a
particular learning style or dominant intellectual strength was characteristic of freshmen
enrolled in remediation courses compared to freshmen not enrolled in remediation
courses.
The relevance for this study was derived from the fact that students in remediation
face more obstacles to graduating than students not enrolled in remediation (Berkowitz,
2006; Cutolo & Rutherford, 2007). Since Wu and Alrabah (2009) showed different
incident rates of learning style preferences and intellectual strengths amongst different
cultures, the study focused on whether these different incident rates might be prevalent
between students enrolled in remediation and students not enrolled in remediation and
thus also a another potential barrier to graduation. The goal was to improve the
educational environments of freshmen, whether in remediation or not in remediation in
order to foster higher retention and graduation rates.
After an analysis of the literature, I determined that the focus of this study should
be based on the following variables: the incident rate of dominant intellectual strengths,
the incident rate of learning styles, and being enrolled in remediation. Two correlational
relationships were also examined. I determined if there was a correlation between certain

46
intellectual strengths and being enrolled in remediation. Second, I determined whether
there was a correlation between certain learning styles and being enrolled in remediation.
Chapter 4 will reiterate the research questions, hypotheses, and the data collection
procedure that took place during the study. Next, there will be a presentation of the
sample characteristics obtained along with the results yielded from the data collection.
Data Collection
The time frame for data collection was between September through November
2014 and between January through April 2015. The break in data collection was due to
finals and the winter break at the college.
The recruitment process for participants occurred in many stages. After the initial
research approval was confirmed by the head of institutional research, I also had to get
approval from each campus provost. The provosts on the Lake Worth campus and the
Palm Beach Gardens campus were the only provosts who responded and approved this
study. The next step was a series of emails sent to each professor that predominantly
taught freshmen courses. For each professor that responded, times and dates were set up
to visit each class for participant recruitment. During my visit to each class, I presented a
summary of the research purpose and the possible time commitment involved in
participation along with the factors that would exclude their participation. Next, I
presented each student with a business card containing all of my contact information, the
research website link, and a QR code that also linked students to the research link directly
to their smart phones.

47
There were only two delineations from the data collection methods in chapter 3 as
the QR code presented on each business card was not initially discussed. However, a QR
code is simply a faster way to access links and only helps in the accessibility to the
research site. The second delineation was in the offering of an incentive to win a $50
Visa gift card. The IRB of Walden University did not approve this measure and so it had
to be eliminated from the data collection process. The overall response rate for the
surveys was 22% according to the total number of freshmen eligible in each class to
participate. This will be addressed in chapter 5.
The Sample
The sample was comprised of 82 freshmen students who were currently attending
Palm Beach State College at least part time. The sample included White (21.4%),
Hispanic (35.7%), Black (23.8%), Asian/Pacific Islander (7.1%), Native American
(1.2%), and other ethnicities (10.7%). The age range of the sample was 18-24 (63.1%),
25-29 (13.1%), 30-34 (11.9%), and 35+ (11.9%).
The number of students enrolled in at least one remediation course was much
higher (n = 51, 60%) of the population while the number of students not enrolled in
remediation was much smaller (n = 31, 36.9%), and a small percentage of missing values
(n = 2, 2.4%) for this part of the summary.
Despite the small sample size, the demographics were at least somewhat
representative of the overall demographics of the college. The Palm Beach State College
Division of Institutional Research (2013) reported the highest frequency of students in the
18-29 age range. This was also true of my sample as well as 76.2% of the sample had an

48
age range between 18-29 years old. The ethnicity breakdown was: Caucasian (40.8%),
Hispanic (25.7%), African American/Black (25.4%), Asian/Pacific Islander (3.7%),
Native American (.3%), and 4.1% not reported or other ethnicity. The discrepancy in
Caucasian classifications is most likely due to self-reported personal designations of race
and the fact the Palm Beach State College does not have a “other” classification for race.
This discrepancy will be discussed further in Chapter 5. Palm Beach State College (2013)
did not report the percentage of freshmen enrolled in remediation courses and so this data
point could not be compared. Table 1 and Figure 1 show a side-by-side comparison of
these demographics.
Table 1 Demographics Percent Comparisons of Sample Versus Population of Palm Beach State
College
Ethnicity Sample Population
Caucasian 21.4 40.8
Hispanic 35.7 25.7
African American/Black 23.8 25.4
Asian/ Pacific Islander 7.1 3.7
Native American 1.2 0.3
Other 10.7 0
Not Reported 0 4.1
Note. N = 84

49
Figure 1. Sample versus population demographics.
Results
The results of the Multiple Intelligence Profiling Questionnaire III yielded rather
consistent results between students enrolled in remediation courses and those that are not
enrolled in remediation courses. The top three intellectual strengths of the sample as a
whole were: spiritual/ existential (M = 4.087, SD = .719), intrapersonal (M = 4.074, SD =
.727), and the naturalistic intelligence (M = 4.008, SD = .931). Table 2 and Figure 2 show
the results of all of the intelligence mean scores.

50
Table 2
Mean Incident Rates of Intellectual Strengths in the Sample Population
Musical Visual Spiritual/
Existential Inter-
personal Math Verbal Kinesthetic Nature
Intra-personal
Mean 3.438 3.397 4.087 3.724 3.512 3.583 3.693 4.008 4.074
Std. Deviation
1.074 0.838 0.719 0.843 0.961 0.755 0.877 0.931 0.727
Note. N = 82

51
Figure 2. Mean incident rates of intellectual strengths for the sample (N = 82). .
For students enrolled in at least one remediation course, the top intellectual
strengths were identified as: intrapersonal (M = 4.049, SD = .802), spiritual/existential (M
= 4.046, SD = .7332), and the naturalistic (M = 4.020, SD = .892). For students not
enrolled in at least one remediation course, the top intellectual strengths were identified
as: spiritual/existential (M = 4.140, SD = .703), intrapersonal (M = 4.089, SD = .601), and
naturalistic (M = 3.957, SD = 1.017).
3
3.2
3.4
3.6
3.8
4
4.2
Me
an
Sco
res
Multiple Intelligences

52
Figure 3 shows the overall results of both students enrolled in remediation and
students not enrolled in remediation.
Figure 3. Mean Intellectual Strength Score Comparison
This similar trend in data continued for the results of the Learning Style Inventory
3.1. Both students enrolled in remediation and not enrolled in remediation identified most
often as the Reflective Observation (RO) learning phase. However, it is important to note
that students not enrolled in remediation courses were much more likely to identify with
the Abstract Conceptualization (AC) phase 25.8% of the time while this only occurred
7.8% of the time for students enrolled in remediation. Table 3 and Figure 4 show a
summary of these results and the overall results for the sample.
Table 3
A Comparison of Learning Phase Cycle Preferences in Students Enrolled in Remediation
and Not Enrolled in Remediation

53
Learning Cycle
Phase
Remedial Percentage
Not Remedial Percentage
Missing Data
5.9 3.2
CE 13.7 9.7
AE 35.3 25.8
RO 37.3 35.5
AC 7.8 25.8 Note: CE=Concrete experience, AE=Active experimentation, RO=Reflective observation, AC= Abstract
conceptualization
N = 82
Figure 4. Learning Phase Cycle Preferences in Students Enrolled in Remediation and Not Enrolled in Remediation
Due to the differences among these frequencies, it was decided that a t-test should
be conducted to examine whether there was a significant difference between learning
phase means for each group. A t-test was chosen here since there was no data to confirm
a population mean (Gravetter & Wallnau, 2013). For students enrolled in remediation
courses, there was a significant difference, t (50) = 16.218, p < .001. This test also

54
yielded significant results for students not enrolled in remediation, t (30) = 14.092, p <
.001. So, even though the initial statistical frequencies suggested continuity between
these groups, the results of the two tailed t test show that there are significant group
differences. Table 4 shows a summary of the results.
Table 4
Learning Phase t-Test Mean Comparison
Sample t df Sig. (2-tailed) Mean Difference
Remedial 16.218 50 .000 2.27451
Not Remedial 14.092 30 .000 2.70968
Note. df= degrees of freedom
For learning style preferences, students enrolled in remediation courses are much
more likely to identify as Assimilating learners (27.5%). While this is also true of
students not enrolled in remediation courses, the frequency is much higher (45.2%).
Students in remediation were also much more likely to identify as Accommodating
learners (25.5%) in comparison to student not enrolled in remediation courses (9.7%).
Table 5 and Figure 4 show a summary of the overall results.
Table 5
A Comparison of Learning Style Preferences in Students Enrolled in Remediation and
Not Enrolled in Remediation

55
Learning Style Remedial Percentage Not Remedial Percentage
Missing Data 5.9 3.2
Converging 17.6 16.1
Diverging 23.5 25.8
Accommodating 25.5 9.7
Assimilating 27.5 45.2 Note. N = 84

56
Figure 5. Learning Style Preferences in Student Enrolled in Remediation and Not
Enrolled in Remediation
Again, the t-test was used here as well to determine whether there were sample
mean differences. Students enrolled in remediation showed a significant difference, t (52)
= 14.580, p < .001. This test also yielded significant results for students not enrolled in
remediation, t (30) = 12.035, p < .001. Table 6 shows a summary of these results.
Table 6
Learning Style Preference t- Test Mean Differences
Sample t df Sig. (2-tailed) Mean Difference
Remedial 14.580 52 .000 2.47170
Not Remedial 12.035 30 .000 2.77419
Note. N = 82

57
Due to the categorical nature of the data, a Chi square analysis was also run in
order to ascertain whether there were sample differences. For learning phase
classifications, students enrolled in at least one remediation course showed a much more
significant sample difference, χ2 (4, n = 84) = 23.412 , p < .01, in comparison to students
not enrolled in remediation, χ2 (4, n = 84) = 10.774 , p < .05. For learning style
preferences, students enrolled in at least one remediation course did not show a
significant sample difference,χ2 (4, n = 84) = 7.660 , p > .05, while students not enrolled
in remediation did show a significant sample difference, χ2 (4, n = 84) = 16.581 , p < .05.
Table 7 summarizes these findings.
Table 7 Chi Square Analysis of Learning Phase and Preference on Students Enrolled in
Remediation and Not Enrolled in Remediation
Learning Phase Remedial
Learning Phase Not Remedial
Learning Style Remedial
Learning Style Not Remedial
Chi-Square
23.412 10.774 7.660 16.581
Asymp.Sig.
0.000 0.029 0.105 0.002
Note. df= 4 for all variables
N = 82

58
A Spearman’s rho correlation was run on all of the variables in order to see if
there were any significant (minimum of α =.05) correlations between certain intellectual
strengths, learning style preferences, and enrollment in remediation. Remediation was
coded in SPSS as 1 for being enrolled in at least one remediation course and 0 for not
being enrolled in at least one remediation course. The Spearman’s rho correlation was
chosen due to the categorical nature of the data as the Pearson correlation can only be
used on interval/ratio data sets (Gravetter & Wallnau, 2013). The results demonstrated
that students enrolled in remediation were less likely to exhibit a logical/mathematical
strength, r =.382, n =51, p <.05. Table 8 shows a summary of the overall results.
Table 8
Spearman’s rho Correlation Results on Students Enrolled in Remediation versus
Intellectual Strengths
Music Visual Interpersonal Math Verbal Kinesthetic Nature Intrapersonal
Remedial Correlation Coefficient
.085 .020 -.011 .382** .030 .029 -.128 -.070
Sig. (2-tailed)
.555 .888 .941 .006 .837 .837 .371 .626
Note. N = 82
**= p<.01
A Spearman’s rho correlation was also run on students not in remediation. The
results yielded two significant results. There was a negative correlation for students not
enrolled in remediation exhibiting a visual intellectual strength, r=-.544, n = 31, p <.05,

59
and a kinesthetic strength, r=-.360, n = 31, p <.05. A Bonferroni post hoc test was also
run on this data but yielded no significant results (α =.05). Table 9 shows the results of
this correlation.
Table 9 Spearman’s rho Correlation Results on Students not in Remediation versus Intellectual
Strengths
Music Visual Interpersonal Math Verbal Kinesthetic Nature Intrapersonal
Not Remedial Correlation Coefficient
-.076 -.544** -.102 -.156 .098 -.360* -.117 .058
Sig. (2-tailed) .684 .002 .585 .402 .599 .047 .532 .756
Note. N= 82
*= p<.05, ** p<.01
It is also important to note that there were significant correlations between most
of the intellectual strengths (minimum of α =.05). This shows a consistent level of
internal validity for this instrument. The full correlation matrix is located in the
Appendix.
A Spearman’s rho correlation was also run on whether there was a correlation
between remediation enrollment and learning style preferences. The results of these
statistical tests showed that neither the learning phase, r = .16, n = 84, p >.05, nor the
learning style preference yielded significant results, r = .058, n = 84, p >.05.
Summary
The original research questions sought to address whether students enrolled in
remediation courses had significantly different incident rates of dominant intellectual
strengths or learning style preferences. Statistical analysis of these incident rates showed

60
that overall students enrolled in remediation courses and students not enrolled in
remediation courses have very similar learning profiles for both their dominant
intellectual strengths and learning style preferences. However, it is important to note that
students not enrolled in remediation were much more likely to be classified in the Active
Experimentation phase and were also much more likely to be classified as the
Accommodating learning style preference. Students enrolled in remediation were much
more likely to be classified as the Assimilating learning style preference.
Chapter 5 will summarize the major findings, discuss the interpretations of those
findings, review the limitations of the study, and will finally discuss the
recommendations for future areas of research and social applications.

61
Chapter 5: Discussion, Conclusions, and Recommendations
Introduction
The problem addressed in this study was whether student intellectual strengths
and learning style preferences were, in part, related to placement or enrollment in
remediation courses. The purpose of this quantitative study was to assess whether a
particular learning style or dominant intellectual strength was characteristic of freshmen
enrolled in remediation courses compared to freshmen not enrolled in remediation
courses.
The relevance for this study was derived from the fact that students in remediation
face more obstacles to graduating than students not enrolled in remediation (Berkowitz,
2006; Cutolo & Rutherford, 2007). Since Wu and Alrabah (2009) showed different
incident rates of learning style preferences and intellectual strengths amongst different
cultures, the study focused on whether these different incident rates might be prevalent
between students enrolled in remediation and students not enrolled in remediation and
thus also a another potential barrier to graduation. The goal was to improve the
educational environments of both freshmen enrolled in remediation courses and those not
enrolled in remediation courses and thus foster higher retention and graduation rates. This
chapter covers (a) interpretation of the findings, (b) limitations to the study, and (c) the
recommendations for the future, and the implications for social change.

62
Interpretation of the Findings
For students enrolled in remediation courses, the top intellectual strengths were
identified as follows: intrapersonal, spiritual/existential, and the naturalistic intellectual
strength. For students not enrolled in at least one remediation course, the top intellectual
strengths were identified as spiritual/existential, intrapersonal, and the naturalistic
intellectual strength.
The high mean scores for intrapersonal (self) intelligence could be a result of
increased levels of self-reflection or introspection brought about by social media use. It
could also be the result of reflection journals used in a course that is required by all
students at Palm Beach State College: Introduction to the College Experience.
Students in remediation had a higher overall mean intrapersonal score in
comparison to students not enrolled in remediation. This could be the result of an uneven
distribution of participants in each group. A review of the literature did not point out why
this group difference would have occurred so it may be an area of interest for further
investigation.
The high scores in spiritual/existential intelligence for both groups of students
may show not just a strong social link to religion but also to contemplation and
metacognition. If so, this finding would be surprising because Holliday and Li (2004)
reported that students often have an underdeveloped ability for self-reflection and exhibit
lower levels of metacognition. This same study also found a relationship between high
metacognition skills and the success of at-risk students (Holliday & Li, 2004). Since the
mean scores for this intellectual strength were high in both groups of students, perhaps

63
the students surveyed were experiencing some form of academic or even societal support
that fostered this strength. This may be an area to investigate further as perhaps it may be
another area that could potentially impact student academic success.
The third highest set of scores in each group, naturalistic intelligence, may reflect
the fact that students are more ecologically conscious, but it may also be linked to the
study’s physical environment. According to Mayer and McPherson (2004), a connection
to nature predicts ecological behavior. Ecological behavior may lead to more students
associating with this particular intellectual strength. Southern Florida’s climate may also
play a role in a person’s relationship to nature.
The Spearman’s rho correlation results were not surprising. It makes sense that
students enrolled in remediation courses would exhibit lower mean scores in the
logistic/mathematical intellectual strength category as remediation/developmental courses
are typically offered in math, reading, and writing. Palm Beach State College offers many
developmental courses, including 3 developmental math courses (Palm Beach State
College, 2015).
It is also important to note that there were significant correlations present amongst
almost all the intellectual strengths listed for the MIPQ III. This information can be found
in the appendix. These correlations help to give an additional level of internal validity to
this instrument.
The results of the learning phase incident rates yielded some interesting
considerations. Students enrolled in remediation courses identified as being in either the
Reflective Observation phase or the Active Experimentation phase 72.6% of the time.

64
According to Kolb & Kolb (2005), these phases represent the portion of the learning
cycle involved in transforming experiences. In contrast, students not enrolled in
remediation courses identified in these same phases 61.3% of the time. When the highest
scores on LSI are RO and AE there is a significant horizontal stretch between the phases
that typically means students dominant learning process may be characterized by moving
back and forth between being reserved or tentative and active or assertive without
processing the learning through logic or critical thinking (Kolb & Kolb, 2005). Hence,
instruction at universities may need to be shaped in a way that helps students process that
knowledge through critical thinking. This may mean longer or more frequent class times
or there may be more of a focus on critical thinking skills in remediation courses. This, of
course, has huge implications for the structure of many courses with fixed time amounts
spent via a pre-arranged and pre-organized syllabus with a set number of class meetup
times.
These results were further validated by the chi square results as students not
enrolled in remediation courses showed a higher degree of sample differences, thus
showing that this part of the sample touches more portions of the learning phase cycles
(Kolb & Kolb, 2005).
In terms of the learning style preferences, it is important to note that while the
overall profile between both groups was typically the same, some interesting differences
in the incident rates of certain learning style preferences did emerge. Students enrolled in
at least one remediation course were much more likely to be classified as accommodating
learners. Accommodating learners are active in the learning process but they are more

65
likely to value intuition and “gut” instincts over logical theories or processes (Kolb &
Kolb, 2005). Conversely, students not enrolled in remediation courses were much more
likely to be classified as assimilating learners. Assimilating learners are more logical in
nature and focus less on people and more on process and theory (Kolb & Kolb, 2005).
The following results show that students enrolled in remediation courses may be
more successful in environments where knowledge is applied in a practical real world
application with a heavier emphasis on social dynamics and group learning practices.
This is not to say the students not enrolled in remediation should not be exposed to this
instruction style, but that is perhaps less important to this group of individuals in terms of
academic success. This can inform instruction and curriculum as a way to re-organize key
concepts in a manner that first seeks to show the application of a concept, perhaps even
before showing the logistics or the theory behind it. Tying this back to Kolb’s ELT, the
concrete experience phase may also need to add in elements of the active experimentation
phase. Not to say that the learning phase cycles aren’t a valid interpretation of learning,
but perhaps teachers of students enrolled in remediation courses need to make sure they
are adding in more active experimentation even when introducing new concepts.
Limitations
There are unfortunately many limitations to this study. As previously discussed in
chapter 1, this study took place in South Florida which has a high degree of ethnic
diversity and so is probably not suitable to generalize to populations with lower levels of
diversity.

66
Second, the data collection for this study did not go exactly as planned. The target
sample size was supposed to be 116 according to (G*Power Analysis, 2013) in order to
have enough power to generalize the findings. The response rate on the surveys was low,
with a response rate of 22%. This is most likely due to the multi-tiered steps to gain
access to the population. First, professors were recruited via email. Next, they agreed to
let me into their classrooms, and then they had to agree to give up instructional time to let
me give my speech. Last, students then had to decide to participate. After a while, new
emails for recruitment stopped receiving replies. In addition, since I had to gain
permission from both provosts and professors before I could start the participant
recruitment process, my pool of available candidates was quite small. This yielded a
smaller sample size of 84 instead and the number of students enrolled in remediation was
quite a bit higher (N = 51) than students not enrolled in remediation (N = 31) with two
cases missing some data. This uneven distribution may have occurred for a couple of
reasons; the first of which is that many of the professors teaching students in remediation
may have felt that they had a greater stake in allowing me into their classrooms since
their students were more at risk of not graduating. Similarly, students enrolled in
remediation courses may have felt that participation may shed some light on their own
learning preferences and might help them better succeed academically since they could
download their survey results.
The low response rate is a threat to both validity and the reliability of the statistics
rendered from this study and so any conclusions drawn here should only be generalized
with restraint. Specifically, the correlations were determined via a G*Power Analysis

67
(2013) and it was determined that a sample of 116 was needed. Since the overall sample
fell short of this by quite a bit, the correlations should especially be interpreted with a
degree of caution. This may also limit the implications of the study and threatens levels
of generalizability.
Another limitation to this study lies in the possible shortcomings of the theories
themselves. Klein (1997) suggested that the Gardner’s theory of multiple intelligences is
still too general and Holman, Pavlica, and Thorpe (1997) postulated that Kolb’s
experiential learning theory is actually too narrow in nature. Due to the limitation of these
theories, this did lead to very cautious conclusions made later in this chapter.
While the instruments were typically considered to be both valid and reliable as a
whole, there have been criticisms of these instruments. For example, Tirri and
Nokelainen (2008) concluded that the reliability of the MIPQ III was hard to evaluate
since many parts of the MIPQ III are based on abstract thinking; which is difficult to
quantitatively analyze.
There are some limitations to the LSI 3.1 as well. The internal validity of this
instrument seems to be harder to study due to the nature of the scales measured. Kolb and
Kolb (2005) showed that amongst distance/online participants in the population, the RO
mode was located at one end and the CE and AE modes are located on the other end of
the spectrum. However, in art students from this study, the spectrum of learning modes is
quite different. Due to these findings, it may add some further reliability concerns to the
currently study.

68
Two confounders also limited the reliability of the study. I did not analyze gender
differences or each remedial course separately as it may have limited my sample potential
size further. In addition, current research has not cited that gender differences or type of
course show significant differences in learning profiles (Wu & Alrabah, 2009). Self-
report and social desirability biases may have been limitations in this study as well.
Participants may have answered the survey questions in a way as to make themselves
appear more desirable or to meet what they thought the researcher wanted them to
answer.
Recommendations
Based upon the findings of this study, there are several recommendations that can
be made for the future. First of all, due to the time constraints and limitations of the small
sample size, it would be prudent to repeat this study with a larger more representative
sample over an extended period of time so as to ascertain the reliability and validity of
the results of this study. It would also be interesting to use this study’s procedure in
another part of the United States with less diversity to establish whether subcultures have
a significant bearing on intellectual strengths and learning style preferences.
Second, since both instruments yielded similar overall results amongst two
different groups of students, it may be beneficial to look into combining both instruments
together for future studies since Klein (1997) suggested that the Gardner’s theory of
multiple intelligences is still too general and Holman, Pavlica, and Thorpe (1997)
postulated that Kolb’s experiential learning theory is actually too narrow in nature. This

69
combination of instruments may yield an optimally balanced instrument that can better
assess student learning profiles better than either instrument can accomplish on its own.
This finding also gives credence to what seems to be currently happening in educational
policy. Jonas-Dwyer and Pospisil (2004) suggested that the millennial generation is a
multi-tasking, multi-processing generation that cannot be taught by one type of teaching
methodology, so perhaps with these changes in the student population, it is also important
to not test or assess students using one instrument as well. In this way, we are aligning
the instruments better to the population and this would hopefully add higher levels of
validity to not only this study’s instruments, but to other instruments requiring further
validity issues in future studies.
Third, more than 70% of the sample downloaded their LSI 3.1 results. Students
were given the option by Hay Group, which owns the LSI 3.1, to electronically download
their test results. These also included descriptions of each learning style so participants
could interpret them on their own. Many of these students also identified as being
enrolled in remediation and it might be interesting to see what level of follow-up was
completed by the students. For example, did students that downloaded their results start
to alter their study habits? Did they take the results to their academic advisors for further
analysis or to help them better pick a major? This is an important point of discussion
because it also shows that the ability to download and interpret test results from a survey
may have an additional social change impact as students would potentially have another
point of guidance in selecting a major or career path.

70
Overall, this study has been able to assess some interesting and previously
unknown aspects of the learning profiles of college freshmen enrolled in remediation and
not enrolled in remediation. It is the hope that these results can be used to foster positive
social change and may potentially have an impact retention and graduation rates.
Social Change Implications
In terms of addressing the social implications of improving college freshmen
retention and eventual graduation rates, it would be interesting to infuse remediation
courses with more social context and real world applications to see if this has an impact
on retention rates since students enrolled in remediation courses tend to more heavily
favor this type of learning environment. On the other hand, perhaps professors need to
also work on more logic based learning skills with this group to address an area that may
be seen as a weakness in terms of student comprehension. Jonas-Dwyer and Pospisil
(2004) already advocated for more experiential learning in the classroom for millennial
generation anyway. They also advocated for a series of different learning techniques as
the millennial generation does not seem to respond well to just one learning modality
type. This could, of course, lead to a series of instructional interventions on college
campuses and a more tailor fit approach to tertiary education. It also raises the question of
whether secondary and even primary institutions should be changing instruction to
accommodate more real world application style learning in those students that struggle
with academics.
In terms of the other possible social change implications, intervention strategies
discussed above that may alter or augment the structure of curriculum could have the
71
largest impact. Implementation of real world practices and strengthening logical
reasoning skills could directly address student comprehension and foster higher academic
achievement. As previously discussed, fostering classroom settings, that also improve
student achievement, may have the largest social change impact as retention rates and
ultimately graduation rates could potentially improve. Of course, students who attain a
higher degree of education have a greater chance at advanced or more lucrative
employment, which can also potentially foster higher social mobility (Haveman &
Smeeding, 2006).
As students enrolled in remediation are a vulnerable group that is in part
composed of both minorities and students with a lower socioeconomic status (Tierney &
Garcia, 2008), enhanced or improved instructional practices may have the ability to
empower this group to achieve greater levels of academic and later financial success.
Enhancing this level of academic success also has implications for promoting the
worth and dignity of students in remediation. If students in remediation knew that the
curriculum and instruction were specifically designed to help them adhere to their
strengths or improve upon their weaknesses, they may feel a higher level of confidence
while pursuing their education. Indeed, Tinto (2005) suggested that changing the
character of educational practices may be the missing factor in student retention. This
may have larger transformative changes to the communities these students belong to as
students would have more financial opportunities after becoming more successful
academically.

72
References
Allensworth, E., Nomi, T., Montgomery, N., & Lee, V. E. (2009). College preparatory
curriculum for all: Academic consequences of requiring algebra and English I for
Ninth graders in Chicago. Educational Evaluation and Policy Analysis, 31(4), 367-
391. doi:10.3102/0162373709343471
American Psychological Association. (2010). American Psychological Association
ethical principles of psychologists and code of conduct. Retrieved from
http://www.apa.org/ethics/code2002.html
Attewell, P. A., Lavin, D. E., Domina, T., & Levey, T. (2006). New evidence on college
remediation. Journal of Higher Education, 77(5), 886-924. Retrieved from
EBSCOhost.
Bahr, P. (2010). Preparing the underprepared: An analysis of racial disparities in
postsecondary mathematics remediation. Journal of Higher Education, 81(2),
209-237.Bettinger, E., & Long, B.T. (2004). Shape up or ship out: The effects of
remediation on students at four-year colleges. NBER Working Paper No. 10369,
JEL No. I2, H4, C2.
Borredon, L., Deffayet, S., Baker, A. C., & Kolb, D. (2011). Enhancing deep learning:
Lessons from the introduction of learning teams in management education in
France. Journal of Management Education, 35(3), 324-350.
doi:10.1177/1052562910368652
Broward College Division of Institutional Research (2008). Retrieved from
http://www.broward.edu/facts/.

73
Calcagno, J., Crosta, P., Bailey, T., & Jenkins, D. (2007). Stepping stones to a degree:
The impact of enrollment pathways and milestones on community college student
outcomes. Research in Higher Education, 48(7), 775-801. Retrieved from
EBSCOhost.
College Board (2000). Retrieved from
http://completionagenda.collegeboard.org/percentage-students-remedial-classes-
college
Cronbach, L. J. (1970). Essentials of psychological testing. Third edition. New York:
Harper & Row.
Cutolo, A., & Rochford, R. A. (2007). An analysis of freshmen learning styles and their
relationship to academic achievement. College Quarterly, 10(2), 1-17.
Darwin, C. (2003). The origins of species. New York: Signet Classic.
Díaz-Lefebvre, R. (2004). Multiple intelligences, learning for understanding, and creative
assessment: Some pieces to the puzzle of learning. Teachers College Record,
106(1), 49-57. doi:10.1111/j.1467-9620.2004.00317.x
Dickinson, M. D., & Hiscock, M. (2010). Age-related IQ decline is reduced markedly
after adjustment for the Flynn effect. Journal of Clinical and Experimental
Neuropsychology, 32(8), 865-870. doi:10.1080/13803391003596413
Drysdale, J. L. Ross,L., & Schulz, R.A. (2001). Cognitive learning styles and academic
performance in 19 first-year university courses: Successful students versus
students at risk. Journal of Education for Students Placed At Risk, 6(3), 271–289.
doi:10.1207/S15327671ESPR0603_7

74
Dwinell, P. L., & Higbee, J. L. (1991). Affective variables related to mathematics
achievement among high-risk college freshmen. Psychological Reports, 69(2),
399-403. doi:10.2466/PR0.69.6.399-403
Earnest, D. R., & Dwyer, W. O. (2010). In their own words: An online strategy for
increasing stress-coping skills among college freshmen. College Student Journal,
44(4), 888-900. Retrieved from EBSCOhost.
Gardner, H. (1983). Multiple intelligences: The theory in practice. New York:
BasicBooks.
Gardner, H. (1999). Intelligence reframed. New York: Basic Books.
Gardner, H. (2004). Frames of mind (20th anniversary ed.). New York: Basic Books.
Gilardi, S., & Guglielmetti, C. (2011). University life of non-traditional students:
Engagement styles and impact on attrition. Journal of Higher Education, 82(1),
33-53. doi:10.1353/jhe.2011.0005
Greener, S. L. (2010). Plasticity: The online learning environment's potential to support
varied learning styles and approaches. Campus-Wide Information Systems, 27(4),
254-262. doi:10.1108/10650741011073798
Griggs, L., Barney, S., Brown-Sederberg, J., Collins, E., Keith, S., & Iannacci, L. (2009).
Varying pedagogy to address student multiple intelligences. Human Architecture:
Journal Of The Sociology Of Self-Knowledge, 7(1), 55-60.
Gravetter, F. J., & Wallnau, L.B. (2009). Statistics for the behavioral sciences: Eighth
edition. California: Cengage Learning.

75
Haveman, R., & Smeeding, T. (2006). The role of higher education in social
mobility. The Future of Children, 16(2) Retrieved from
http://search.proquest.com/docview/1519298937?accountid=14872
Holliday, W., & Li, Q. (2004). Understanding the millennials: updating our knowledge
about students. Reference services review, 32(4), 356-366.
Holman, D., Pavlica, K., & Thorpe (1997). Rethinking kolb's theory of experiential
learning in management education. The contribution of social constructionism and
activity theory. Management Learning. 28 (2) 135-148.
Howell, J. S. (2011). What influences students' need for remediation in college? Evidence
from california. Journal of Higher Education, 82(3), 292-318.
doi:10.1353/jhe.2011.0014
Jay, G. M., & D'Augelli, A. R. (1991). Social support and adjustment to university life: A
comparison of African-American and White freshmen. Journal of Community
Psychology, 19(2), 95-108. doi:10.1002/1520-6629(199104)19:2<95::AID-
JCOP2290190202>3.0.CO;2-2
Kayes, D. C (2005). Internal validity and reliability of Kolb’s learning style inventory
version 3 (1999). Journal of Business and Psychology., 20 (2), 249-257.
doi:10.1007/s10869-005-8262-4Klein, P.D.(1997). Multiplying the problems of
intelligence by eight: A critique of Gardner’s Theory. Canadian Journal of
Education / Revue canadienne de l'éducation,22,(4), p.377-394.
Kolb, D. A. (1981a). Experiential learning theory and the Learning Style Inventory: A

76
reply to Freedman and Stumpf. The Academy of Management Review, 6, 289-296.
doi:10.2307/257885
Kolb, D. (1984). Experiential Learning: Experience as the Source of Learning and
Development. Englewood Cliffs, NJ: Prentice-Hall, Inc.
Kolb, D. (2000). Learning Style Inventory, Version 3. Retrieved from EBSCOhost.
Kolb, A. & Kolb, D. (2005). The kolb learning style inventory-version 3.1 2005 technical
specifications. Boston, MA: Hay Group.
Laskey, M. L., & Hetzel, C. J. (2011). Investigating factors related to retention of at-risk
college students. Learning Assistance Review, 16(1), 31-43.
Lee, B., & Ang, P. (2003). The Validity of Online Survey: A Case Study from Singapore.
Conference Papers -- International Communication Association, 1-17.
Levin, H.M., & Calcagno, J.C. (2008). Remediation in the community college: An
evaluator’s perspective. Retrieved from http://inpathways.net/remediation-evaluator.pdf
Mather, J. A., & Champagne, A. (2008). Student learning styles/strategies and professors'
expectations: Do they match? College Quarterly, 11(2), 1-8.
McFarlane, D. A. (2010). Teaching unmotivated and under-motivated college students:
Problems, challenges, and considerations. College Quarterly, 13(3), Retrieved
from EBSCOhost.
Mellow, G. O., Woolis, D. D., & Laurillard, D. (2011). In search of a new
developmental-education pedagogy. Change: The Magazine of Higher Learning,
43(3), 50-59. doi:10.1080/00091383.2011.569264

77
National Center for Educational Statistics (2008).Retrieved from
http://nces.ed.gov/programs/digest/d10/tables/dt10_241.asp.
Naeini, M., & Pandian, A. (2010). On the relationship of multiple intelligences with
listening proficiency and attitudes among Iranian TEFL university students. TESL
Canada Journal, 28(1), 97-114. Retrieved from EBSCOhost.
Nilsen, H. (2009). Influence on student academic behavior through motivation, self-
efficacy and value-expectation: An action research project to improve learning.
Issues in Informing Science & Information Technology, 6545-6556.
Palm Beach State College Division of Institutional Research (2011). Retrieved from
http://www.palmbeachstate.edu/panorama/demographics-and-characteristics/race-
and-ethnicity.aspx
Palm Beach State College Course Offerings (2015). Retrieved from
http://www.palmbeachstate.edu/catalog/current/index.pdf
Pérez, E. R., & Cupani, M. (2008). Validation of the multiple intelligences self-efficacy
inventory revised (MISEI-R). Revista Latinoamericana de Psicología, 40(1), 47-
58.
Pizzolato, J. (2004). Coping with conflict: Self-authorship, coping, and adaptation to
college in first-year, high-risk students. Journal of College Student Development,
45(4), 425-442. doi:10.1353/csd.2004.0050Price, D. V. (2004). Educational debt
burden among student borrowers. Research in Higher Education, 45(7).
Psaltou-Joycey, A., & Kantaridou, Z. (2011). Major, minor, and negative learning style
preferences of university students. System: An International Journal of

78
Educational Technology and Applied Linguistics, 39(1), 103-112. Retrieved from
EBSCOhost.
Scott, D. (2008). Effective VoIP learning experiences: The relationship between adult
learners' motivation, multiple intelligences, and learning styles. International
Journal of Learning, 15(3), 63-78.
Sheldon, C. Q., & Durdella, N. R. (2010). Success rates for students taking compressed
and regular length developmental courses in the community college. Community
College Journal of Research and Practice, 34(1-2), 39-54.
doi:10.1080/10668920903385806
Silver, H. Strong, R., & Perini, M. (1997). Integrating learning styles and multiple
intelligences. Educational Leadership, 55(1), 22-27.
Steele, H. (2012). Racial identity development of mixed race college students. Retrieved
from
http://tigerprints.clemson.edu/cgi/viewcontent.cgi?article=2030&context=all_diss
ertations
Sternberg, R.J. (2000). Handbook of intelligence. Cambridge, UK: Cambridge University
Press.
Strang, K. (2010). Global culture, learning style, and outcome: An interdisciplinary
empirical study of international university students. Intercultural Education,
21(6), 519-533. doi:10.1080/14675986.2010.533034

79
Tait, K. (2009). Understanding tertiary student learning: Are they independent thinkers or
simply consumers and reactors?. International Journal of Teaching and Learning
in Higher Education, 21(1), 97-107. Retrieved from EBSCOhost.
Temiz, N. & Kiraz (2007). The implications of multiple intelligences theory on literacy
education at first grade. Eurasian Journal of Educational Research, 27, 111- 126.
Tierney, W. G., & Garcia, L. D. (2008). Preparing underprepared students for college:
Remedial education and early assessment programs. Journal of At-Risk Issues,
14(2), 1-7. Retrieved from EBSCOhost.
Tinto, V. (2005). Taking student success seriously: Rethinking the first year of college.
In Ninth Annual Intersession Academic Affairs Forum, California State
University, Fullerton , 05-01).
Tirri, K., & Komulainen, E. (2002). Modeling a self-rated intelligence-profile for virtual
university. In H. Niemi & P. Ruohotie (Eds.), Theoretical understandings for
learning invirtual university (pp. 139-168). Hämeenlinna, FI: RCVE.
Tirri, K., & Nokelainen, P. (2007). Empirical investigation of the Multiple Intelligences
Profiling Questionnaire's Environmental Sensitivity Scale. Paper presented at the
12th biennal conference of the European Association for Research on Learning
and Instruction, Budapest, Hungary.Vandal, B. (2011) Return of investment:
strategies for improving remedial education [Briefing Paper]. Complete to
Compete, Washington, DC. National Governors Association.
http://www.nav.eric.ed.gov/PDFS

80
Veres, J. G., Sims, R. R., & Locklear, T. S. (1991). Improving the reliability of Kolb’s
revised learning style inventory. Educational and Psychological Measurement,
51, 143-150. doi:10.1177/0013164491511013
Vivian, C. (2005). Advising the at-risk college student. The Educational Forum, 69(4),
336-351. doi:10.1080/00131720508984707
Weirstra, R. F. A., & DeJong, J. A. (2002). A scaling theoretical evaluation of Kolb’s
learning style inventory-2. In Valcke , M., & Gombeir, D., (Eds.). Learning
styles: reliability and validity, 431-440. Proceedings of the seventh annual
European learning styles information network, 26-28 June.
Wu, S., & Alrabah, S. (2009). A cross-cultural study of Taiwanese and Kuwaiti EFL
students' learning styles and multiple intelligences. Innovations in Education &
Teaching International, 46(4), 393-403. doi:10.1080/14703290903301826

81
Appendix A: Permission to Use the Multiple Intelligence Profiling Questionnaire III
> On Mon, 20 Feb 2012, Jessica Snug wrote: > >> Hyvä Dr. Kirsi Tirri ja Dr. Henry Tirri ja Dr. K omulainen, >> >> Olen väittelijä alalla psykologian Walden yliopi stossa. Olen tällä hetkellä katsot oppimista profiilit opiskelijoiden omalla al ueella ja halusi käyttää MIPQ III työhuoneessani. Aion saattaa sen verkkosiv uilla minun osallistujille, jotta he voivat vastata tutkimukset annan heille ta paamatta minua ja myös nopeuttaa tiedonkeruuta. Halusin virallisesti pyytä ä lupaa käyttää välinettä, ja laittaa sen kyselyn apina verkkosivuilla tiedonk eruuta. Haluaisin myös käyttää muita pätevyyttä tietoja saatat olla nimeno maan MIPQ III. En ole onnistunut löytämään psykometrian voimassaoloa täll e versiolle. Olen liittänyt minun viimeisin esite jotta saat käsityksen siitä, mitä olen työskennellyt. Kiitos aikaa. >> *Oma esite on kirjoitettu Englanti. >> >> Jessica M. Snug M.S. On Tue, 21 Feb 2012, Jessica Snug wrote: > Dr. Komulainen, > > Olen amerikkalainen opiskelija, joka ei puhu suom ea niin halusin vain tehdä selväksi, että annat minulle luvan käyttää välinett ä työhuoneessani. Olen käyttäen Google Translate kirjoittaa teille. Kiitos . > > > > Jessica M. Snug M.S. > > --------------------------------------- > Original E-mail > From: Erkki Komulainen < [email protected] > > Date: 02/21/2012 02:48 AM > To: Jessica Snug < [email protected] > > Subject: Re: an käyttää MIPQ III > > > Hi Jessica!

82
> > Sorry to reply first in Finnish. I do my research focusing on > other topics than at the time of writing about MI . I have not > followed the attempts to measure MI of Gardner si nce those > publications where you found my contact informati on, sorry. > > I wish you all the best in your effort. > > Erkki > > -- > Mobile +358 40 5024491 >
Yes, you have my permission for research purposes, of course. Good Luck! Erkki -- Mobile +< http://www.helsinki.fi/~komulain/>

83
Appendix B: Permission to Use the Learning Styles Inventory 3.1
Dear Dr. Kolb, I am a doctoral candidate in the field of Psychology at Walden University. I am currently looking at the learning profiles of college students in my area and wanted to use the LSI ver. 3.1 in my study. I plan on placing it on a website for my participants so they can answer the surveys I give them without meeting with me and also to speed up data collection. I have attached my most recent Jessica M. Snug M.S. --
Alice Kolb Ph.D. Adjunct Professor of Organizational Behavior Case Western Reserve University President Experience Based Learning Systems, Inc. www.learningfromexperience.com
From: Alice Kolb [mailto:[email protected]] Sent: Wednesday, February 15, 2012 12:03 PM
Cc: Polly Flinch
Subject: permission to use the LSI 3.1 Dear Jessica: Thank you for your interest in the Kolb Learning Style Inventory for your research. Due to the copyright issue, we do not allow our researchers to post the LSI on their websites. Instead, we offer LSI research grant for qualified research studies. I am copying this e-mail to Polly Flinch, our publisher, and she will contact to you to make necessary arrangement for you to apply for the research grant. Best,
From : Polly Flinch [[email protected]]
Date : 02/15/2012 11:24 AM
To : Alice Kolb [[email protected]], "[email protected]" [[email protected]]
Subjec
t :
RE: permission to use the LSI 3.1
Hi Jessica,
Attached is a copy of our research application and the conditional use agreement.
Please fill out these two forms and return them to me along with a copy of your CV.
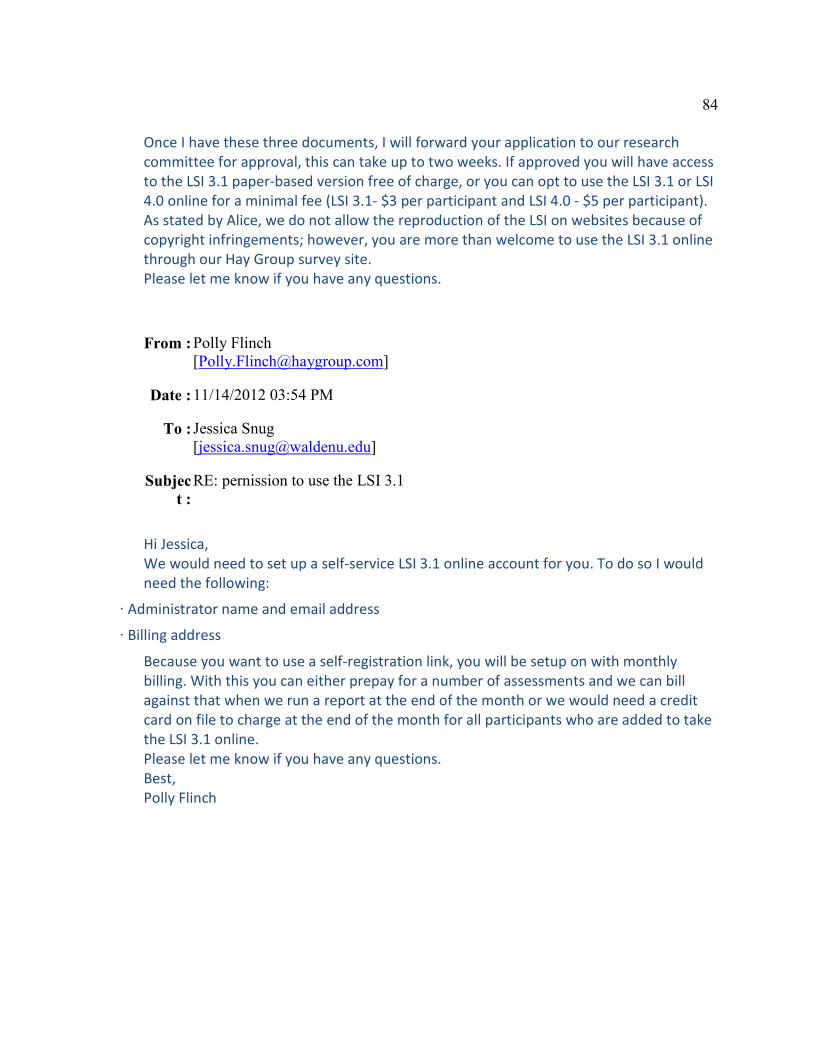
84
Once I have these three documents, I will forward your application to our research
committee for approval, this can take up to two weeks. If approved you will have access
to the LSI 3.1 paper-based version free of charge, or you can opt to use the LSI 3.1 or LSI
4.0 online for a minimal fee (LSI 3.1- $3 per participant and LSI 4.0 - $5 per participant).
As stated by Alice, we do not allow the reproduction of the LSI on websites because of
copyright infringements; however, you are more than welcome to use the LSI 3.1 online
through our Hay Group survey site.
Please let me know if you have any questions.
From : Polly Flinch [[email protected]]
Date : 11/14/2012 03:54 PM
To : Jessica Snug [[email protected]]
Subjec
t :
RE: pernission to use the LSI 3.1
Hi Jessica,
We would need to set up a self-service LSI 3.1 online account for you. To do so I would
need the following:
∙ Administrator name and email address
∙ Billing address
Because you want to use a self-registration link, you will be setup on with monthly
billing. With this you can either prepay for a number of assessments and we can bill
against that when we run a report at the end of the month or we would need a credit
card on file to charge at the end of the month for all participants who are added to take
the LSI 3.1 online.
Please let me know if you have any questions.
Best,
Polly Flinch
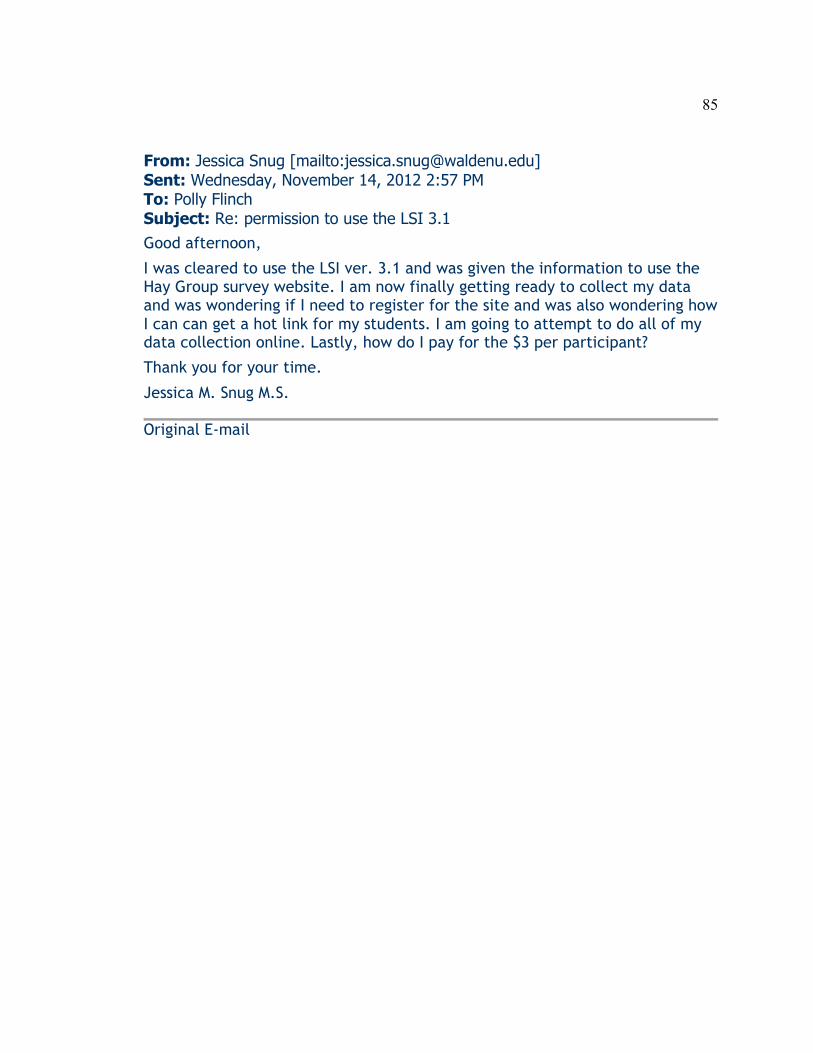
85
From: Jessica Snug [mailto:[email protected]]
Sent: Wednesday, November 14, 2012 2:57 PM To: Polly Flinch
Subject: Re: permission to use the LSI 3.1
Good afternoon,
I was cleared to use the LSI ver. 3.1 and was given the information to use the Hay Group survey website. I am now finally getting ready to collect my data and was wondering if I need to register for the site and was also wondering how I can can get a hot link for my students. I am going to attempt to do all of my data collection online. Lastly, how do I pay for the $3 per participant?
Thank you for your time.
Jessica M. Snug M.S.
Original E-mail

86
Appendix C: Spearman Rho Correlation Matrix for Remediation and Intellectual
Strengths
**. Correlation is significant at the 0.01 level (2-tailed). *. Correlation is significant at the 0.05 level (2-tailed). N = 84

87
Appendix D: Walden University Internal Review Board Documentation
RESEARCH ETHICS REVIEW APPLICATION
TO THE WALDEN UNIVERSITY INSTITUTIONAL REVIEW BOARD
REQUESTING APPROVAL TO CONDUCT RESEARCH
VERSION 2010A
All shaded areas of this IRB application need to be completed by the
researcher. Text in the unshaded areas may not be modified.
Enter researcher’s electronic signature (email address) here after
reading the statement to the right:[email protected]_______
By entering an email address in the box to the left, the submitter of this application is providing a dior he A. will read all of the instructions throughout this application; B. understands that neither participant recruitment nor data collection (including pilot data) may begin until explicit IRB abeen received from [email protected]; C. understands that noncompliance with IRB instructions and policies can result in consequences including but not limited to invalidation of data, revocation of IRB approval, and dismissal from Walden University; andD. is responsible for submitting a current version of this form which can be found
IMPORTANT NOTE FOR STUDENT RESEARCHERS
It is the student’s responsibility to make sure that the faculty-approved IRB application and all supporting materials are submitted to [email protected]. The IRB staff always confirms receipt of IRB materials. Data collection that is begun prior to receiving explicit IRB approval from [email protected] does not qualify for academic credit toward degree requirements.
WHAT IS IRB APPROVAL?
The Institutional Review Board (IRB) consists of staff and faculty members from each of Walden's major research areas and is
responsible for ensuring that all Walden University research complies with the university’s ethical standards as well as U.S.
federal regulations and any applicable international guidelines. IRB approval indicates the institution’s official assessment that
the potential risks of the study are outweighed by the potential benefits.
IRB approval lasts for 1 year and may be renewed. Outside of the explicit dates and terms of IRB approval, researchers are not
entitled to any protections, recognition, funding, or other support provide by Walden University or its affiliates. More detail
about the IRB review process can be found at Walden’s IRB Web site or by sending a specific request to [email protected].
WHO SHOULD USE THIS IRB APPLICATION FORM?
This application should be completed by all students and faculty members who are conducting research projects of any scope involving collection or analysis of data from living persons (whether from surveys, interviews, observation, student work, or records of any type). The only categories of research that do not need to be submitted for IRB approval are literature reviews, hypothetical research designs, and faculty projects that are completely independent of Walden affiliation, resources, participants, and funding. IRB approval for course-based research projects should be obtained by the faculty member who designs the course. Research projects conducted by fulltime employees of Walden or related organizations are also under the purview of the Walden IRB. Instead of completing this form, staff researchers should send an email inquiry to [email protected] to initiate the IRB approval process for staff research. WHEN SHOULD I WORK ON AND SUBMIT MY IRB APPLICATION?
Questions about the IRB application and related materials may be submitted to [email protected] at any time. Non-doctoral IRB applications will be reviewed as soon as the application is complete. For doctoral students, an IRB review cannot occur until the proposal oral conference has been held and the student has received formal proposal approval notification from the Office of Student Research Support.
88
It is expected that doctoral students will review IRB requirements as they are writing the proposal and to that end, this IRB application can be used as a worksheet to help think through the ethical issues of data collection. However, the student would need to complete the IRB application after proposal approval in order to address the details of the final, approved research design.
HOW LONG DOES IRB REVIEW TAKE?
Researchers should allow a minimum of 4-6 weeks for IRB review (4 weeks for minimal risk studies and 6 weeks for studies involving vulnerable populations). This form takes 1-2 hours to complete, depending on the complexity of the study. Once the IRB staff confirms that the IRB application is complete, the IRB application will be scheduled for review at the next available IRB meeting (typically within 10 business days). Feedback from the board will be returned within 5 business days (amounting to a total of 15 business days for the initial review). Note that when a study is “approved with revisions,” the researcher should allow an additional 10-15 business days for those revisions to be reviewed and approved. If the revisions do not adequately address the ethical concerns, then an additional round of revisions and review might be necessary. The IRB members make every effort to make the revision requirements as clear as possible. Students should consult program guidelines and documents such as the dissertation guidebook in order to understand how long the proposal and IRB review steps will take and plan their study’s timeline accordingly. Exceptions to approval procedures cannot be made in order to accommodate personal or external deadlines (e.g., limited access to participants). CAN I CONTACT MY RESEARCH PARTICIPANTS BEFORE IRB APPROVAL?
Note that researchers may NOT begin recruiting participants (i.e., obtaining consent form signatures) prior to IRB approval. The only documents that may be signed before IRB approval are Data Use Agreements or Letters of Cooperation from community partners and Confidentiality Agreements that are signed by transcribers, statisticians, and research assistants who might have access to the raw data. If you have questions about who should sign what, please email [email protected] for help. WHAT IF I NEED TO CHANGE MY RESEARCH PROCEDURES AFTER IRB APPROVAL?
Researchers must resubmit any IRB materials relevant to the change, along with a Request for Change in Procedures form, which can be found on the Walden IRB Web site. As long as the proposed changes do not increase the level of risk, the request will be treated as an expedited review. WHAT ARE THE CRITERIA FOR IRB APPROVAL?
The purpose of this IRB application is to collect enough specific information to document that the study’s benefits outweigh
the costs and that the procedures are in compliance with federal regulations and university policies. To those ends, the board
will evaluate the IRB application based on how well the following ethical principles are upheld:
Beneficence = maximize possible benefits and minimize possible harms Justice = fairly distribute benefits and burdens of research Respect for Persons = acknowledge participants’ autonomy and protect those with diminished autonomy More detail on the criteria for IRB approval is provided in this online module. The IRB application will ask the researcher to do the following:
General Description of the Proposed Research
- Demonstrate the ethical rationale for each component of data collection by describing how each will be analyzed to address the research question(s). - Provide specific descriptions of the tasks the participants will be asked to complete.
Community Research Stakeholders and Partners
- Submit a signed Letter of Cooperation from any community partner who will be involved in identifying potential participants or collecting data. - Submit a signed Data Use Agreement from any organization that will be providing records to the researcher. - Describe the plan for sharing research results with relevant stakeholders.

89
Potential Risks and Benefits
- Describe anticipated risks and benefits of study participation. - Make provisions to minimize risks to research participants and document those procedures.
Data Integrity and Confidentiality
- Describe procedures to maintain data confidentiality and integrity. - If data includes personal identifiers, submit signed certificates of confidentiality for everyone who has access to the data (except faculty members). - If applicable, complete extra sections relevant to protected health information.
Potential Conflicts of Interest
- Disclose and manage potential conflicts of interest.
Data Collection Tools
- Describe all tools (surveys, interview questions, etc.) and authorizations related to data collection including evidence of compliance with copyright holder’s terms of usage, permission to reproduce the instrument in the dissertation, or confirmation that the tool is public domain (as applicable).
Description of the Research Participants
- Describe the study population, particularly inclusion and exclusion criteria, to demonstrate that those who shoulder the burden of the research will actually benefit from it. - Describe how any vulnerable populations will be protected from safety/privacy risks and pressure to participate.
Informed Consent
- Make provisions to obtain and document informed consent from all study participants and the appropriate parents, guardians, or caregivers. -Submit unsigned copies of any relevant consent documents.
Final Checklist and Electronic Signatures
-Students must obtain faculty approval (via electronic signature) before submitting this form to [email protected].
This form must be completed and submitted via email. If you have questions as you are completing the form, please contact [email protected].
PROJECT INFORMATION
1. Enter Researcher’s name in blue space below:
Jessica Snug-Mioduszewski
2. If the researcher is a student, provide student ID number:
39093
3. Every researcher must submit a copy of a Human Research Protections training completion certificate with this application. Walden accepts Human Research Protections training certificates from either NIH, NCI, or CITI. The NIH module is most strongly recommended and takes 1-2 hours. A completion certificate is good for 5 years. Enter an X in the appropriate blue box below to indicate which training module was completed:
X National Institutes of Health (NIH): http://phrp.nihtraining.com
Collaborative Institutional Training Initiative (CITI): http://www.citiprogram.org

90
National Cancer Institute (NCI)
Other research ethics training:
4. Researcher’s email address:
5. Names of research collaborators and roles (if researcher is a student, please provide the name of the faculty member supervising this research, such as the committee chair):
Michael Horton
6. Email address(es) of the supervising faculty member(s) and any other co-researcher collaborators:
7. Provide the researcher’s program affiliation at Walden (e.g., Ed.D.; Ph.D. in Clinical Psychology, etc.)
Ph.D in Psychology
8. Project Title:
A Comparison of Dominant Intellectual Strengths and Learning Styles in College Freshmen
9. Enter an X in the blue box next to the study type that best describes the IRB approval requested:
X Dissertation (may include a pilot if pilot steps are described in item 12’s procedures chart)
Doctoral Study (may include a pilot if pilot steps are described in item 12’s procedures chart)
Doctoral pilot study prior to proposal approval (provide the rationale for why a pilot study is necessary prior to proposal approval here: ( )
Master’s thesis
KAM study
Research for a course (specify course number: and course enddate: )
Faculty Research
Other:
I. GENERAL DESCRIPTION OF THE PROPOSED RESEARCH
10. Enter X’s in the appropriate blue boxes to indicate all the data collection methods that are part of this study.
Interview
Focus group
X Survey or assessment that is initiated by the researcher
X Survey or assessment that is routinely collected by the site
Analysis of student test scores or work products (when this is the only analysis, items 37-51 of this application can be left blank)
Analysis of existing public records or documents (when this is the only analysis, items 37-51 of this application can be left blank)
Analysis of existing privately held records (such as business records) or documents (when this is the only analysis, items 37-51 of this application can be left blank)
Observation of people in public places
Observation of people in school, workplace, or other non-public location

91
Collection of physical specimens (e.g. blood, saliva)
Other (please specify)
11. The IRB is obligated to factor the rigor of the research design into the overall assessment of the potential risks and benefits of this study. Please complete the chart below to ethically jcollection.
Research Question
List each research question (RQ) in a separate row below.
This section must reflect the FINAL research design.
Doctoral researchers should not complete item 11 until
after the oral proposal defense.
Data Collection Tools
List which instrument(s) are used to collect the data that will address each RQ.
Datapoints Yielded
List which specific questions/variables/scales of the instrument will address each RQ.
Data Source
List which persons/artifacts/records will provide the data.
RQ 1:
What is the incident rate of dominant intellectual strengths in college freshmen enrolled in remediation courses compared to those not enrolled in remediation courses?
Multiple Intelligence Profiling
Questionnaire III
All scales and scores will be
used from the MIPQ III, only
highest scale score will be used
for analysis
Freshmen college
students who are at least
18 years of age
RQ 2: What is the incident rate of learning styles in college freshmen enrolled in remediation courses compared to those not enrolled in and non-remediation courses?
Learning Style Inventory Ver.
3.1
All scales and scores will be
used from the LSI ver. 3, only
highest scale score will be used
for analysis
Freshmen college
students who are at least
18 years of age
RQ 3:
Is there a correlation between certain intellectual strengths and being enrolled in remediation?
Multiple Intelligence Profiling
Questionnaire III
All scales and scores will be
used from the MIPQ III, only
highest scale score will be used
for analysis
Freshmen college
students who are at least
18 years of age
RQ 4:
Is there a correlation between certain learning styles and being enrolled in remediation?
Learning Style Inventory Ver.
3.1
All scales and scores will be
used from the LSI ver. 3, only
highest scale score will be used
for analysis
Freshmen college
students who are at least
18 years of age
12. In the chart below, describe the participant recruitment and data collection steps in enough detail such that privacy and safety risks can be ascertained. Deviation from the procedures listed below can result in invalidation of the data and dismissal from the university. Invalid data may not be published or included in a doctoral study. You must describe any of the following data collection steps that apply to your study: -How existing data or contact information of potential participants will be obtained -Initial contact with potential participants -Informed consent procedures -Any pilot activities (if changes need to be made based on the pilot, you will need to submit a Request for Change in Procedures form, which is found on the IRB website-Data collection (surveys, interviews, assessments, observations, etc.) -Any intervention/treatment activities that are critical to the study even if provided by another entity -Follow-up meetings with participants to review interview transcripts and/or perform membercheck (confirming validity of researcher’s interpretations) -Dissemination of study’s results to participants and stakeholders
Participant recruitment and data collection steps
It is a student researcher’s responsibility to ensure that the procedures described here are 100%
aligned with the final proposal that is approved by committee members after the oral defense.
Failure to fully align item 12 with the approved proposal can result in invalidation of data and
rejection of the final study.
Duration Exact Location
Step 1 Submit IRB approval forms to research site. I will also be submitting Palm Beach State College’s
approval forms as well.
Electronic, 30
minutes
Palm Beach State College,
Lake Worth, Fl
Step 2 Email professors at Palm Beach State College from the school directory and ask for permission to Electronic, 30 Online, Remote

92
attend classes regarding student recruitment. minutes
Step 3 Confirm attendance to classes where professors have given permission for me to attend. Variable, 60 minutes Online, Remote
Step 4 Visit classes to recruit students. Each classroom visit should only last about 15-20 minutes
although the number of visits depends upon how many professors allow me to attend. During this
time, I will be speaking in front of the classes about participating in the research.
15-20 minutes each
visit
Palm Beach State College,
Lake Worth, Fl
Step 5 During recruitment sessions, I will be giving out business cards with the research link. 15-20 minutes each
visit
Palm Beach State College,
Lake Worth, Fl
Step 6 Data collected will be extracted from my research website until at least the sample minimum is
obtained.
Variable Online, Remote
Step 7 Each completed set of surveys from each student will be given a random number via a random
number generator.
Variable Online, Remote
Step 8 Data will be uploaded into SPSS ver. 17 120 minutes Online, Remote
Step 9
Step 10 (add more rows as needed)
II. COMMUNITY RESEARCH STAKEHOLDERS AND PARTNERS
Research participants are individuals who provide private data through any type of interaction, whether verbal, observed, typed, recorded, written, or otherwise assessed. Research participants’ understanding of the study and willingness to engage in research must be documented with CONSENT FORMS, after IRB approval. For example, an educator comparing two instructional strategies by interviewing adult students in his classes would need to have each participant student sign a consent form. Community partners include any schools, clinics, businesses, non-profits, government entities, residential facilities, or other organizations who are involved in your research project. Community partners’ understanding of the study and willingness to engage in research must be documented with a LETTER OF COOPERATION. To continue with the same example, the educator comparing two instructional strategies would need a Letter of Cooperation from the school confirming (a) that the school approves the teacher’s implementation of two different instructional strategies and (b) that the school approves the interview activities. In some cases a community partner will only provide a letter of cooperation after Walden has “officially” approved the research proposal. If this is the case, then enter a brief explanation of your planned steps in item 12. If you have questions about whether an individual or an organization should provide permission for some aspect of the research, please email [email protected]. If a community partner’s engagement in the research involves providing any type of non-public records, the terms of sharing those records must be documented in a DATA USE AGREEMENT, before IRB approval. Again using the same example, the educator comparing two instructional strategies will need a Data Use Agreement if he wants to analyze these students’ past academic records or work products as part of the study. Data Use Agreements must be FERPA-compliant and HIPAA-compliant, as applicable to the setting.
A sample letter of cooperation and sample data use agreement can be downloaded from the IRB Web site. This IRB application’s final checklist will direct you to email or fax your community partners’ Letters of Cooperation and any applicable Data Use Agreements at the same time you submit this IRB form. Stakeholders include the informal networks of individuals who would potentially be impacted by the research activities or results (such as parents, community leaders, etc). Walden students are required to disseminate their research results in a responsible, respectful manner and are encouraged to develop this dissemination plan in consultation with the relevant community partners. Sometimes it is appropriate to provide a debriefing session/handout to individual participants immediately after data collection in addition to a general stakeholders’ debriefing after data analysis.
13. Please identify all community stakeholders who should hear about your research results and indicate your specific plan for disseminating your results in an appropriate format.
This study is pertinent to Palm Beach State College and to area state colleges in South Florida. Any state college is a potential stakeholder. My specific plan f
about the research results to Palm Beach State College after publication. After that point, I may seek to attend educational conferences as a guest speaker.
14. Enter an X next to the description that best describes the community research partner’s role in data collection. Mark all that apply.
I am relying solely on public records and/or means to recruit participants and collect data, and thus, I have no community research partner.
My community research partner has already agreed to assist in participant recruitment and/or data collection and I am submitting their letter of cooperation with this IRB approval.
X I am required to provide a copy of Walden’s IRB approval to a funder or community partner before they can provide me with their formal approval. I seek Walden’s conditional (which can be finalized once the Walden IRB receives the community partner’s letter of cooperation).
I would like to use the Walden Participant Pool to identify potential research participants (note that the IRB will seek participant pool approval for this study, on the researcher’s behalf).
Other:
15a. Name the organization(s) at which you intend to recruit participants and/or collect data as well as any funders involved in the study:
Palm Beach State College, Lake Worth, Florida

93
15b. Name the individual who is authorized to approve research within each of the community partner organizations:
Jennifer Campbell Ph.D., Head of Research
15c. Please briefly describe how you chose each of the partners listed above:
This state college is located within a 30 minute drive of where I, the researcher, live and it has a large student body with many students enrolled in remediation courses.
III. POTENTIAL RISKS AND BENEFITS
For each of the categories A-J below, carefully estimate risk level, enter an X to indicate the risk level, and describe the circumstances that could contribute to that type of negative outcome for participants or
stakeholders in the space provided to the far right of each section. Minimal risk is acceptable but must be identified upfront. Minimal risk is defined as follows in U.S. federal regulations: “that the probability and magnitude of harm or discomfort anticipated in the research are not greater in and of themselves than those ordinarily encountered in daily life or during the performance of routine physical or psychological examinations or tests.” Substantial risk is acceptable as long as adequate preventive protections are in place (which you will describe in item 17).
Level of risk:
check one
Description of risk:
List the circumstances that
could cause this outcome
A. Unintended disclosure of confidential information (such as educational or medical records) X Not applicable
Minimal risk
Substantial risk
B. Psychological stress greater than what one would experience in daily life (e.g., materials or topics that could be considered sensitive, offensive, threatening, degrading)
X Not applicable
Minimal risk
Substantial risk
C. Attention to personal information that is irrelevant to the study (i.e., related to sexual practices, family history, substance use, illegal behavior, medical or mental health)
X Not applicable
Minimal risk
Substantial risk
D. Unwanted solicitation, intrusion, or observation in public places X Not applicable
Minimal risk
Substantial risk
E. Unwanted intrusion of privacy of others not involved in study (e.g. participant’s family). X Not applicable
Minimal risk
Substantial risk
F. Social or economic loss (i.e., collecting data that could be damaging to any participants’ or stakeholders’ financial standing, employability or reputation)
X Not applicable
Minimal risk
Substantial risk
G. Perceived coercion to participate due to any existing or expected relationship between the participant and the researcher (or any entity that the researcher might be perceived to represent)
Not applicable I will not be coercing participants, but I cannot stop the
professors from doing so in their own classrooms. I will
let the professors know that I do not wish for coercion to
occur.
X Minimal risk
Substantial risk
H. Misunderstanding as a result of experimental deception (such as placebo treatment or use of confederate research assistants posing as someone else)
X Not applicable
Minimal risk
Substantial risk
I. Minor negative effects on participants’ or stakeholders’ health (no risk of serious injury) X Not applicable
Minimal risk
Substantial risk

94
J. Major negative effects on participants’ or stakeholders’ health (risk of serious injury) X Not applicable
Minimal risk
Substantial risk
17. Explain what steps will be taken to minimize risks and to protect participants’ and stakeholders’ welfare.
Participant answers and the raw data will be stored in secure places to ensure confidentiality and the research design itself includes a consent form and data collection will be kept anonymous through implied consent. In order to offset my own personal biases and possible biases from potential participants, only participants who have not had me as a teacher may participate in this study. Taking these measures withensure that all of the principles of ethical behavior are being met.
18. Describe the anticipated benefits of this research, if any, for individual participants.
Participants choosing to be debriefed and obtain their results can use this data to help them achieve greater academic success since they will have a better understanding of how they learn and what
environments are best suited for their learning profile. They can also take this information to their academic advisors and use it for class and career guidance.
19. Describe the anticipated benefits of this research for society.
There are five major anticipated benefits for society: 1) informing high schools about ways to improve college preparation efforts, 2) development of instructional practices that alearners related to learning styles and dominant intellectual strengths, 3) design of support systems by colleges, and 4) increased knowledge and awareness by students regarding their own strengths and styles and how to adapt them for success, and 5) empowering minority and low socioeconomic status students, which comprise the majority of students in remediation.
One of the many issues relating to college remediation is the lack of preparation in many secondary education institutions to adequately expose high school students to the rigor of colle(2011) reported that many students are unaware of these lacking skills until they take college placement exams as seniors in high school or right after admission to college. Knowledge of student dominant intellectual strengths and learning profiles, especially those most likely to need remediation, may help to guide administration and teachers in secondary institutions as to how to better address these deficiencies before college admission.
In dealing with the development of more informed instructional practices, many educators are simply not prepared to deal with the issues associated with unprepared studen(McFarlane, 2010). Mather & Champagne (2008) have also pointed out that there is no formal post-secondary teacher training for professors and that the teaching styles in these professors may widely vary. Having a profile of the learning needs of students in remediation could help post-secondary instructors create more optimal learning environments for success.
Support systems on campuses are also a key component of success on many campuses. Gilardi & Guglielmetti (2011) showed that when students do not engage in the or take advantage of support systems like university resources and do not engage in social integration on campus; they are much less likely to understand the meaningfulness of their learning experiences , and more lilearning needs, like those proposed in this study, could help administrators design better campus support systems and help students in remediation to see that their fulfillment of college courses is a meaningful learnexperience.
Knowledge of learning preferences and dominant intellectual strengths has the ability to help students better understand their own specific learning needs. Students can use this information to choose successful degree paths and can help students develop more effective study strategies. Developing effective study strategies is of paramount importance according to Nilsendetermining factors as to why many students drop out.
Lastly, students enrolled in remediation are a vulnerable group that is in part composed of both minorities and students with a lower socioeconomic status (Tierney & this study could help this group become more successful, thus not only ameliorating higher retention rates; but foster higher graduation rates.
IV. DATA INTEGRITY AND CONFIDENTIALITY
20a. In what format(s) will you obtain and subsequently store the data? (e.g., paper, electronic media, video, audio)
All data will be stored electronically on a flash drive that will be secured in a safe when not in use.
20b. Where will you store the data?
In a home safe
21. Describe what security provisions will be taken to protect this data during initial data collection, data transfer, and archiving (e.g., privacy envelopes, password protection, locks).
I will be accessing all data through my secured home network that is protected with a firewall and has virus protection.
22. Describe what types of checks are in place to facilitate accuracy of data collection. Please note that the university’s Office of Research Integrity and Compliance can audit theafter IRB approval.
I will be the only researcher collecting the data so I will be manually entering all of the data into SPSS. I do plan on checking entries and order from time to time to ensure accuracy and to be
data fields are blank.
23. Explain exactly when and how the data disposal will occur. (Keeping raw data for five years is the minimum requirement).
I will simply erase that data on the secure flash drive after 10 years.
24. Describe the specific plans for handling adverse events involving research participants that might require immediate referral, stopping data collection, management of a new conflict of interest, rerisks and benefits, or responding to breached confidentiality. These plans must be tailored by the researcher for the specific research context and population.
If I need to stop data collection at any point, I will simply take down the research website and make sure the links to open the surveys are removed. If, for some reason, confidentiality was breached then I
would unfortunately have to halt data collection and start with a new sample.

95
25. Understanding the difference between confidentiality and anonymity: Anonymous data contains absolutely zero identifiers and makes it impossible to determine who participated and who did not. Confidential data contains one or more identifiers, but identifiers are kept private by the researcher. In order to protect participant privacy and assure that study participationcollection is preferred, whenever possible.
Is it possible to collect your data anonymously?
X No, my communications with potential participants and/or consent procedures require one or more of their identifiers (such as name, email address, or phone number) to be shared with me. But I confirm that I will provide complete confidentiality.
Yes, I have designed my anonymous consent and data collection procedures so that identities are completely protected even from me, the researcher.
26. Will you retain a link between study code numbers and direct identifiers after the data collection is complete?
No.
X Yes, but only to identify those participants who indicate that they want their data withdrawn.
Yes, it is otherwise necessary because (provide explanation here)
27. Will you provide an identifier or potentially identifying link to anyone else besides yourself?
X No.
Yes, it is necessary because (provide explanation here).
28. Explain who will approach potential participants to take part in the research study and what will be done to protect individuals’ privacy in this process.
I will be the only person to approach potential participants. In order to protect their privacy, I will be keeping data anonymous. No potential participant may have any kind of a previous relationship with
me.
29. List all individuals who will have access to the data (including research assistants, transcribers, statisticians, etc.). If you are a student, the IRB assumes that your supervising faculty members will have access to the data, so you do not need to list them.
I will be the only person accessing my data.
30. To ensure data confidentiality among your research colleagues, you will either need to obtain a signed Confidentiality Agreement for each person you listed for Question 29 identifying links) before anyone else has access to it. Please visit the IRB Web site to download a sample Confidentiality Agreement. This application’s final checklist will direct you to send the IRB your signeConfidentiality Agreement(s) at the same time you submit this IRB form. Place an X next to each blue box that is applicable:
I will be emailing the signed confidentiality agreement(s) to [email protected].
I will be faxing the signed confidentiality agreement(s) to (626) 605-0472.
X Not applicable because I am the only one who will have access to the raw data.
Not applicable because the accessible data is anonymous or de-identified.

96
31. This IRB application is designed to collect enough information to ensure compliance with USA federal research regulations. However, state and international laws might also be relevant. Pleasarea below that you are aware of any applicable state or international regulations and describe your plan for ensuring compliance. Researchers recruiting participants and collecting data in USA only: Please confirm that you have made yourself aware of any state laws that might be relevant to this study’s data collection actmandated reporting, privacy, protection of minors or other vulnerable populations) and explain what procedures are in place to comply with those state laws. State-level professional organizations and licensing entities for your field are a good source of this information. Researchers recruiting participants or collecting data in countries other than the USA: Each international researcher is responsible for making themselves aware of the relevant human subjects protection laws and entities overseeing research for those other countries. International researchers must confirm that they have consulted the available guidance for the countries relevant to their research activities and provide a plan for complying with the relevant laws and oversight entities there. An international compilation of human subjects policies can be found at this link: http://www.hhs.gov/ohrp/international/intlcompilation/intlcompilation.html
Potential participants must be attending the college in the United States in person and must be U.S. citizens.
ADDITIONAL ISSUES TO ADDRESS WHEN THE RESEARCH INVOLVES
PROTECTED HEALTH INFORMATION
32. As part of this study, the researcher(s) will
Collect protected health information* from participants → Please complete question 33.
Have access to protected health information* in the participants’ records → Please complete question 33.
X None of the above → Please skip to question 34.
*Protected Health Information (PHI) is defined under HIPAA (Health Insurance Portability and Accountability Act of 1996) as health information transmitted or maintained in any form or medium that: A. identifies or could be used to identify an individual; B. is created or received by a healthcare provider, health plan, employer or healthcare clearinghouse; and C. relates to the past, present or future physical or mental health or condition of an individual; the provision of health care to an individual; or the past, present or future payment for the provision of healthcare to an individual.
33. To use PHI in research you must have approval through one of the following methods: A. An authorization signed by the research participant that meets HIPAA requirements; or B. Use of a limited data set under a data use agreement. Place an X next to the corresponding blue box below to indicate which method of approval you will use.
A. Research participants in this study will sign an Authorization to Use or Disclose PHI for Research Purposes form. If the study includes multiple activities (e.g., clinical trial or collection and storage of PHI in a central repository), then two authorization forms must be submitted for review. You may download a sample authorization form at the IRB Web site, fill in the required information, and fax to (626) 605
B. I will access a limited data set by signing a Data Use Agreement with the party that releases the PHI. A limited data set must have all possible identifiers removed from the data. It is the researcher and the party releasing the PHI to have in place and maintain a copy of a Data Use Agreement which meets HIPAA requirements. Use the template Data Use Agreement and fill in the required information. A copy of the signed Data Use Agreement must be submitted for IRB review.
V. POTENTIAL CONFLICTS OF INTEREST

97
34. This item asks you to disclose information relevant to separating your multiple roles as clearly as possible, with the goal of ensuring authentically voluntary participation in your study. Doctoral research directly benefits the student (allowing him or her to obtain a degree), and so the researcher should minimize the potential for either (a) conflict of interest or (b) perceived coercion to participate. Researpositions of authority must take extra precautions to ensure that potential participants are not pressured to take part in their study. Data collection should be as detached as possible from the researcher’s authority
Examples:
-a professor researcher may recruit students AFTER grades have been assigned
-a psychologist researcher may recruit clients from ANOTHER psychologist’s practice -a manager researcher may conduct ANONYMOUS data collection so that subordinates do not perceive their responses or [non]participation as being associated with their job standing At the time of study recruitment, are the potential study participants aware of any of the researchers’ other professional or public roles? (Such as teacher, business owner, communi
No.
X Yes, at the time of recruitment some of the participants are aware of the researcher’s teacher role, and the following measures will be taken to separate the researcher’s dual roles and minimize perceived coercion to participate: Past students of mine may not participate.
35. This item asks you to disclose information related to possible financial conflicts of interest, with the goal of maintaining research integrity. Is it possible that the financial situations or professional positions (to include promotions, contracts, clients, and reviews) of the researchers or their families could be directly impacted by the design, conduct, or results of this research?
X No.
Yes, and the conflict of interest is being managed by the following disclosures/measures: (insert explanation here).
36. Will the researcher give participants or stakeholders any gifts, payments, compensation, reimbursement, free services, or extra credit? It is acceptable to compensate your participants as long as the compensation cannot be interpreted as coercive among the participant population. For example, a $5 gift card to a coffee house is fine as a thank you gift, but an Ipod would not be, especially if the participants are teenagers. It is often better to eliminate compensation all together or make sure that 100% of your sample gets the same compensation (as opposed to only compensating those in your experimental group).
X No.
Yes. More information is provided below. What compensation will be given? At what point during the research will the compensation be given? Under what conditions will the compensation be given? (i.e., how will compensation for withdrawn participants be handled?)
VI. DATA COLLECTION TOOLS
In order to approve your study, the IRB needs to review the full text of each data collection tool (e.g., surveys, interview questions, etc.). This application’s final checklist will direct you to send your data collection tools and evidence of compliance with the copyright holder’s usage terms at the same time you submit this IRB form. If any further changes are made to the data collection tools after they have been IRB-approved, you must submit those changes for IRB approval. READ THIS IF YOU ARE USING A PUBLISHED INSTRUMENT:
Many assessment instruments published in journals can be used in research as long as commercial gain is not sought and proper credit is given to the original source (United States Code, 17USC107). However, publication of an assessment tool’s results in a journal does not necessarily indicate that the tool is in the public domain. The copyright holder of each assessment determines whether permission and payment are necessary for use of that assessment tool. Note that the copyright holder could be either the publisher or the author or another entity (such as the Myers and Briggs Foundation, which holds the copyright to the popular Myers-Briggs personality assessment). The researcher is responsible for identifying and contacting the copyright holder to determine which of the following are required for legal usage of the instrument: purchasing legal copies, purchasing a manual, purchasing scoring tools, obtaining written permission, obtaining explicit permission to reproduce the instrument in my dissertation, or simply confirming that the tool is public domain. Even for public domain instruments, Walden University requires students to provide the professional courtesy of notifying the primary author of your plan to use that tool in your own research. Sometimes this is not possible, but at least three attempts should be made to contact the author at his or her most recently listed institution across a reasonable time period (such as 2 weeks). The author typically provides helpful updates or usage tips and asks to receive a copy of the results.

98
Many psychological assessments are restricted for use only by suitably qualified individuals. Researchers must check with the test’s publisher to make sure that they are qualified to administer and interpret any particular assessments that they wish to use. READ THIS IF YOU ARE CREATING YOUR OWN INSTRUMENT OR MODIFYING AN EXISTING INSTRUMENT:
It is not acceptable to modify assessment tools without explicitly citing the original work and detailing the precise nature of the revisions. Note that even slight modifications to items or instructions threaten the reliability and validity of the tool and make comparisons to other research findings difficult, if not impossible. Therefore, unless a purpose of the study is to compare the validity and reliability of a revised measure with that of one that has already been validated, changes should not be made to existing measures. If the study is being conducted for the purpose of assessing the validity/reliability of a modified version of an existing measure, the original measure must also be administered to participants.
37. Are any of your data collection tools published or based upon a published instrument?
X Yes → Complete #38 a-c.
No → Skip to #39 if you are only using tools you created yourself.
38a. Name the copyright holder for each published instrument.
Multiple Intelligence Profiling Questionnaire III, Erkki Komulainen, Learning Style Inventory Ver. 3.1, Hay Group
38b. Place an X next to each of the following legal usage terms that applies to the instrument. If you are using multiple published instruments, please enter the acronym for each measure (instead of an X) next to the usage terms that apply to that instrument.
I have obtained legal copies of the instrument.
I have obtained a legal copy of the manual or scoring kit.
X I have obtained written permission to use the instrument in my research (submitted with this application).
I have obtained explicit permission to reproduce the instrument in my dissertation (submitted with this application).
I have confirmed that the tool is public domain: (Insert citation here).
X Other: I have created an account with Hay Group where I will be allowed to let students complete the LSI Ver. 3.1 with the express permission of the Hay Group.
38c. If you are making any modifications to the existing tool, please describe the modifications and explain why they are necessary.
N/A
39a. List the titles of all self-designed interview guides, coding protocols, surveys, document review protocols, etc. here:
I have created a basic demographics survey.
This is a six question survey that will ask age, gender, ethnicity , whether they are freshman/1st year students,whether they are in remediation or not in remediation, and what their major is currently. This will be presented at the beginning of the study after the informed consent form has been completed. Participants cannot enter the surveys without filling out this questionnaire.
39b. Did an expert panel outside of the faculty committee review the self-designed tool(s)? Expert panel review is not required but increases validity of a student-designed tool and thus, factors into the ratbenefits to risks.
X No
Yes
39c. Did you pilot any of these tools already in a previous IRB-approved study? Piloting is not required but factors into benefits/risks assessment.
X No
Yes. The Walden IRB approval number was (insert IRB approval number here)
39d. Do you plan to pilot any of these tools or procedures?
X No.
Yes. (Briefly describe exactly what aspect of the study will be piloted and ensure the pilot steps included in item #12.)
VII. DESCRIPTION OF THE RESEARCH PARTICIPANTS
40a. Provide the target number of participants, including numbers per group if your study involves multiple groups or a separate pilot sample:
Target number of at least 116, 58 Freshmen enrolled in remediation, 58 Freshmen not enrolled in remediation
40b. Provide a brief rationale for this sample size:
Sample size was determined as the statistical minimum to run a Spearman Rho correlation as assessed on GPower Analysis, 2013
40c. Describe how potential participants will be found:

99
I will be visiting classrooms in Palm Beach State College to speak about my research and then participants can either take my business card to complete the surveys.
40d. Describe the sampling strategy and provide a brief rationale for why that strategy was selected (e.g., random sampling, maximum variation sampling, snowball sampling, criterion sampling, stratified purposeful sampling, convenience sampling, etc):
This is a convenience sample since my sample will be predicated upon professors letting me visit their classes.
41. Please list all criteria for inclusion and exclusion of participants in this study (such as relevant experiences, age range, etc). Your inclusion criteria should define the sample’s critical characteristics, based on the scope of the research question. Once you’ve defined inclusion criteria, if you have no further limitations on who can participate, just indicate “none” under exclusion cri
Inclusion criteria:
Participants will be eligible for this study if they meet the following criteria:
1. They must be at least 18 years of age at the beginning of the study.
2. They must be enrolled (not auditing) at Palm Beach State College at least part time (6 credit hours per semester).
3. They may not be my former students.
4. The remedial participants must be enrolled in at least one remediation course at the beginning of the study.
5. They must be fluent in English.
Describe how you will identify individuals who meet the inclusion criteria:
During recruitment at the college, I will be describing the inclusion and exclusion criteria to the students. My demographics questionnaire will also make sure that only students that meet the inclusion
criteria will have their data included in the study data.
Exclusion criteria:
None
Describe how you will identify which individuals must be excluded:
Any individual not meeting the inclusion criteria will be excluded from the study.
42. Aside from the inclusion/exclusion criteria listed in #41 above, describe how potential participants’ demographic variables will be relevant to obtaining an appropriate sample. (Quantitative researchers need to explain how a representative sample will be obtained in terms of gender, ethnicity, or any other relevant demographics. Qualitative researchers need to explain what demoparticipants.)
The only demographic criterion that is significant in this study is whether students are in remediation or not in remediation. The researcher will collect data and recruit participants
minimum of 58 students in each group is reached.
43. The checklist of vulnerable groups below will help you check your responses to questions 40-42 for potential ethical problems. The ethical challenge is to achieve the goal of to the research question while excluding vulnerable individuals whom the research procedures cannot adequately protect. At the same time, exclusion of any group reduces potential benefits to that group. So the IRB will separately weigh potential risks and benefits for each vulnerable group in this section. The potentially vulnerable populations listed below may only be specifically recruited when (a) the vulnerability status is directly related to the research question and (b) adequate measures are taken to ensure and voluntary participation. For each of the vulnerable groups below, indicate whether your procedures are designed to recruit any of the following as participants. You need to place an X in one of the four blue boxes for each lettered
category of vulnerable participants and add description of the protections to the right as indicated.
A. Minors (17 and under)
Yes: I will be specifically recruiting minors as participants. Protections are described to the right→
Describe protections from pressure to participate:
Describe protections from safety and privacy risks:
Possible: My participants might be minors but I may not know if they are. Protections are described to the right →
Describe protections from pressure to participate:
Describe protections from safety and privacy risks:
No: I will screen age so I can exclude minors. Exclusion procedures are described to the right →
Explain which screening procedure will enable exclusion of minors:
X No: My recruitment methods automatically exclude minors.
B. Residents of any facility (prison, treatment facility, nursing home, assisted living, group home for minors)

100
Yes: I will be specifically recruiting facility residents as participants. Protections are described to the right→
Describe protections from pressure to participate:
Describe protections from safety and privacy risks:
Possible: My participants might be facility residents but I may not know if they are. Protections are described to the right→
Describe protections from pressure to participate:
Describe protections from safety and privacy risks:
No: I will screen facility resident status so I can exclude them. Exclusion procedures are described to the right →
Explain which screening procedure will enable exclusion:
X No: My recruitment methods automatically exclude facility residents.
C. Mentally disabled individuals
Yes: I will be specifically recruiting mentally disabled persons as participants. Protections are described to the right→
Describe protections from pressure to participate:
Describe protections from safety and privacy risks:
X
Possible: My participants might be mentally disabled but I may not know if they are. Protections are described to the right→
Describe protections from pressure to participate:
Describe protections from safety and privacy risks:
No: I will screen mental disability status so I can exclude them. Exclusion procedures are described to the right →
Explain which screening procedure will enable exclusion:
No: My recruitment methods automatically exclude mentally disabled individuals.
D. Emotionally disabled individuals
Yes: I will be specifically recruiting emotionally disabled persons as participants. Protections are described to the right→
Describe protections from pressure to participate:
Describe protections from safety and privacy risks:
X
Possible: My participants might be emotionally disabled but I may not know if they are. Protections are described to the right→
Describe protections from pressure to participate:
Describe protections from safety and privacy risks:
No: I will screen emotional disability status so I can exclude them. Exclusion procedures are described to the right →
Explain which screening procedure will enable exclusion:
No: My recruitment methods automatically exclude emotionally disabled individuals.
E. Pregnant women
Yes: I will be specifically recruiting pregnant women as participants. Protections are described to the right→
Describe protections from pressure to participate:
Describe protections from safety and privacy risks:
X
Possible: My participants might be pregnant but I may not know if they are. Protections are described to the right→
Describe protections from pressure to participate:
Describe protections from safety and privacy risks:
No: I will screen pregnancy status so I can exclude them from my sample. Exclusion procedures are described to the right →
Explain which screening procedure will enable exclusion:
No: My recruitment methods automatically exclude pregnant women.
F. Subordinates of the researcher
Yes: I will be specifically recruiting my subordinates as participants. Protections are described to the right→
Describe protections from pressure to participate:
Describe protections from safety and privacy risks:

101
Possible: My participants might be my subordinates but I may not know if they are. Protections are described to the right→
Describe protections from pressure to participate:
Describe protections from safety and privacy risks:
No: I will screen subordinate status so I can exclude them. Exclusion procedures are described to the right →
Explain which screening procedure will enable exclusion of subordinates:
X No: My recruitment methods automatically exclude my subordinates.
G. Students of the researcher
Yes: I will be specifically recruiting my students as participants. Protections are described to the right→
Describe protections from pressure to participate:
Describe protections from safety and privacy risks:
Possible: My participants might be my students but I may not know if they are. Protections are described to the right→
Describe protections from pressure to participate:
Describe protections from safety and privacy risks:
No: I will screen student status so I can exclude my students. Exclusion procedures are described to the right →
Explain which screening procedure will enable exclusion of students:
X No: My recruitment methods automatically exclude my students.
H. Clients or potential clients of the researcher
Yes: I will be specifically recruiting my clients as participants. Protections are described to the right→
Describe protections from pressure to participate:
Describe protections from safety and privacy risks:
Possible: My participants might be my clients but I may not know if they are. Protections are described to the right→
Describe protections from pressure to participate:
Describe protections from safety and privacy risks:
No: I will screen client status so I can exclude them. Exclusion procedures are described to the right →
Explain which screening procedure will enable exclusion:
X
No: My recruitment methods automatically exclude my clients.
I. Individuals who might be less than fluent in English
Yes: I will be specifically recruiting non-English speakers as participants. Protections are described to the right→
Describe protections from pressure to participate:
Describe protections from safety and privacy risks:
Possible: My participants might be less than fluent in English but I may not know if they are. Protections are described to the right→
Describe protections from pressure to participate:
Describe protections from safety and privacy risks:
No: I will screen non-English speakers so I can exclude them. Exclusion procedures are described to the right →
Explain which screening procedure will enable exclusion:
X
No: My recruitment methods automatically exclude non-English speakers.
J. Individuals who are in crisis (such as natural disaster victims or persons with an acute illness)
Yes: I will be specifically recruiting individuals in crisis as participants. Protections are described to the right→
Describe protections from pressure to participate:
Describe protections from safety and privacy risks:
X
Possible: My participants might be in crisis but I may not know if they are. Protections are described to the right→
Describe protections from pressure to participate:
Describe protections from safety and privacy risks:
No: I will screen crisis status so I can exclude them. Exclusion procedures are described to the right →
Explain which screening procedure will enable exclusion:

102
No: My recruitment methods automatically exclude individuals in crisis.
K. Economically disadvantaged individuals
Yes: I will be specifically recruiting economically disadvantaged individuals as participants. Protections are described to the right→
Describe protections from pressure to participate:
Describe protections from safety and privacy risks:
X
Possible: My participants might be economically disadvantaged but I may not know if they are. Protections are described to the right→
Describe protections from pressure to participate:
Describe protections from safety and privacy risks:
No: I will screen economic status. Exclusion procedures are described to the right → Explain which screening procedure will enable exclusion:
No: My recruitment methods automatically exclude economically disadvantaged individuals.
L. Elderly individuals (65+)
Yes: I will be specifically recruiting elderly individuals as participants. Protections are described to the right→
Describe protections from pressure to participate:
Describe protections from safety and privacy risks:
X
Possible: My participants might be elderly but I may not know if they are. Protections are described to the right→
Describe protections from pressure to participate:
Describe protections from safety and privacy risks:
No: I will screen age so I can exclude elderly individuals. Exclusion procedures are described to the right →
Explain which screening procedure will enable exclusion:
No: My recruitment methods automatically exclude elderly individuals.
44. Please briefly justify the inclusion of each vulnerable group for whom you answered “Yes” or “Possible” above in item 43. Ensure that this response provides a rationale for why it is impossible or unethical to conduct the research without including the protected population.
Students who may be in crisis, pregnant, or are economically disadvantaged have learning profiles as well as those in other groups. It is unnecessary not to include them in this study as they too make up
the diversity of the freshmen class.
45. If competency to provide consent could possibly be an issue for any participants, describe how competency will be determined and your plan for obtaining consent. If not applicable, please indicate NA.
NA
ADDITIONAL ISSUES TO ADDRESS WHEN PARTICIPANTS INCLUDE CHILDREN (AS PER FEDERAL
REGULATIONS)
46. Will your sample include individuals less than 18 years of age?
Yes → Please complete questions 47-48.
X No → Please skip ahead to question 49.
47. If this study proposes to include minors, this inclusion must meet one of the following criteria for risk/benefit assessment, according to the federal regulations.
Place an X in the appropriate blue box to indicate the level of risk.
Minimal risk
Greater than minimal risk, but holds prospect of direct benefit to participants.
Greater than minimal risk, no prospect of direct benefit to participants, but likely to yield generalizable knowledge about the participant’s disorder or condition.
48. Please explain how the criterion in question 47 is met for this study.

103
ADDITIONAL ISSUES TO ADDRESS WHEN PARTICIPANTS INCLUDE PRISONERS
(AS PER FEDERAL REGULATIONS)
49. Is it possible that your sample will include prisoners? Place an X in the appropriate blue box below.
Yes → Please complete question 50 a-e.
X No → Please skip ahead to question 51.
50. Enrollment of prisoners requires that the IRB is able to document that the seven conditions under federal regulations 45 CFR 46 Subpart C are met. If you plan to recruit individuals who are at high risk of becoming incarcerated in a penal institution during the research (e.g., participants with substance abuse history, repeat offenders, etc.), it is best that the IRB can addrreview. Otherwise, if a participant becomes incarcerated during the course of the research and the IRB has not previously reviewed and approved your research for enrollment of prisoners, all research aimmediately cease for that individual until review and application of Subpart C regulations occurs by the IRB.
a. Will this study examine the possible causes, effects, or processes of incarceration?
Yes
X No
b. Will this study examine the facility as an institutional structure?
Yes
X No
c. Will this study specifically examine the experience of being incarcerated?
Yes
X No
d. Will this study examine a condition(s) particularly affecting these prisoners?
Yes
X No
e. Will this study examine a procedure, innovative or accepted, that will have the intent or reasonable probability of improving the health or well being of the participants?
Yes, and residents will be assigned to groups by (provide explanation as to how groups will be formed here).
X No
VIII. OBTAINING INFORMED CONSENT
This application’s final checklist will direct you to email unsigned drafts of your consent/assent forms to [email protected] at the same time you submit this IRB form. Your application is not considered complete until they are received.

104
51. Federal regulations require that the informed consent procedures disclose each of the elements in the checklist below and that consent be documented (usually by asking the participants to sign the consent form listing all of the disclosures but there are some other arrangements that are acceptable, depending on the privacy issues and logistics of the data collection). Anonymous surveys rely on implicit endorsement rather than obtaining a signed endorsement. In other words, instead of collecting a signature the researcher might instruct the participant to complete the survey if they agree to participate in the study as described on the cover page, which would need to include all the elements of informed consent below. When participants are 6 and under, researchers must obtain parental consent in addition to reading a script that asks the children for their verbal assent to participate. When participants are researchers must obtain parental consent in addition to reviewing an age-appropriate assent form with the child and asking the child to sign if they want to participate. Templates for consent and assent forms can be downloaded from the IRB Web site. Note that the consent and assent forms on the IRB Web site are only templates and study. Pay particular attention to making the reading level appropriate for your targeted participant population.
Please affirm, by placing an X in each of the corresponding blue boxes, that your consent/assent form(s) contain each of the following required elements.
Statement that the study involves research
Statement of why subject was selected
Disclosure of the identity and all relevant roles of researcher (e.g., doctoral.student, part-time faculty member, facility owner)
An understandable explanation of research purpose
An understandable description of procedures
Expected duration of subject's participation
Statement that participation is voluntary
Statement that refusing or discontinuing participation involves no penalty
Description of reasonably foreseeable risks or discomforts
Description of anticipated benefits to subjects or others
Information on compensation for participation
Description of how confidentiality will be maintained
Whom to contact with questions about the research (i.e. researcher’s contact information)
Whom to contact with questions about their rights as participants (Walden University representative)
Statement that subject may keep a copy of the informed consent form
All potential conflicts of interest are disclosed
Consent process and documentation are in language understandable to the participant
There is no language that asks the subject to waive his/her legal rights
If appropriate, indicates that a procedure is experimental (i.e., not a standard Rx)
If appropriate, disclosure of alternative procedures/treatment
If appropriate, additional costs to subject resulting from research participation
FINAL IRB CHECKLIST
52. Please indicate below, by placing an X in the corresponding blue boxes, which method you are using to send each of your supporting documents. We ask that you send these supporting documents to the IRsame time you submit this application. Students must obtain their supervising faculty member’s approval in question #55 before submitting any materials to the IRB.
Emailed to
Faxed to
(626) 605-0472
Human Research Protections training completion certificate X
Data collection tools (e.g., surveys, interviews, assessments, etc.) X
All of the following that apply to any assessments’ copyright holders: written/emailed permission to use the instrument, permission to reproduce the instrument in the dissertation, confirmation that the tool is public domain, proof of the researcher’s qualifications to administer the instrument
X

105
Letters of Cooperation from community partner organizations (e.g., school) or individuals (e.g. cooperating teacher) who are assisting with participant recruitment or data collection
Must have Walden University IRB approval before a letter of
Data Use Agreement from any community partners that will be sharing their non-public records
Invitation to participate in research (e.g., letter, flier, phone script, ad, etc.)
Signed Confidentiality Agreements for transcribers, statisticians, research assistant, etc.
Consent/assent forms X
Federal certificate of confidentiality (to shield data from subpoena)
Please maintain a copy of this completed application for your records. Once the IRB application and all supporting documents have been received, the IRB staff will email the researcher and any relevant faculty supervisors to confirm that the IRB application is complete. At this time, the IRB staff will also notify the researcher of the expected IRB review date for the proposal. The review date will be scheduled no later than 15 business days after your completion of this application. In the case of doctoral students, the review date will be scheduled no later than 15 business days after both A) the application is complete and B) the proposal is fully approved. Notice of outcome of the IRB review will be emailed to the researcher and any supervising faculty members within 5 business days of the review. Please be aware that the IRB committee might require revisions or additions to your application before approval can be granted. Neither pilot nor research data may be collected before notification of IRB approval. Students collecting data without approval risk expulsion and invalidation of data. The IRB will make every effort to help researchers move forward in a timely manner. Please contact [email protected] if you have any questions.
FEEDBACK ON THIS IRB APPLICATION
53. The board is committed to making this IRB application as clear and specific as possible so that even novice researchers can provide all the information necessary for the board to evaluate the ethics ofdata collection. If you would like, please give us feedback on any questions or steps that you found unclear: You will also have an opportunity to provide anonymous feedback at the end of the IRB review process.
RESEARCHER ELECTRONIC SIGNATURE
54. By placing an X next to each of these boxes and providing my email address below as an authentication, I am providing an electronic signature certifying that each of the statements below is true.
X The information provided in this application form is correct, and was completed after reading all relevant instructions.
X I agree to conduct this and all future IRB correspondence via email/fax.
X
I, the researcher, will request IRB approval before making any modification to the research procedures or forms, using the Request for Change in Procedures Form found at the
X
I, the researcher, will report any unexpected or otherwise significant adverse events and general problems within one week using the Adverse Event Reporting Form found at the
X Neither recruitment nor data collection will be initiated until final IRB approval is received from [email protected].
X I understand that this research, once approved, is subject to continuing review and approval by the Committee Chair and the IRB.
X
I, the researcher, will maintain complete and accurate records of all research activities (including consent forms and collected data) and be prepared to submit them upon requ
X I understand that if any of the conditions above are not met, this research could be suspended and/or not recognized by Walden University.
Enter researcher email address (provides authentication for electronic signature and thus must match email address on file with Walden University):

106
IRB Policy on Electronic Signatures
Walden’s IRB operates in a nearly paperless environment, which requires reliance on verifiable electronic signatures. Electronic signatures
are only appropriate when the signer is either (a) the sender of the email, or (b) copied on the email containing the signed document.
Electronic signatures are regulated by the Uniform Electronic Transactions Act. Legally, an "electronic signature" can be the person’s typed
name, their email address, or any other identifying marker. An electronic signature is just as valid as a written signature as long as both
parties have agreed to conduct the transaction electronically. University staff will verify any electronic signatures that do not originate from
a password-protected source (i.e., an email address officially on file with Walden).
SUPERVISING FACULTY MEMBER ELECTRONIC SIGNATURE
55. As the faculty member supervising this research, I assume responsibility for ensuring that the student complies with University and federal regulations regarding the uplacing an X in each of these boxes and providing my email address below as an authentication, I am providing an electronic signature certifying that each of the statements below is true.
I affirm that the researcher has met all academic program requirements for review and approval of this research.
I will ensure that the researcher properly requests any protocol changes using the Request for Change in Procedures Form found at the Walden IRB Web site.
I will ensure that the student promptly reports any unexpected or otherwise significant adverse events and general problems within 1 week using the Adverse Event Reporting Form found at the site.
I will report any noncompliance on the part of the researcher by emailing notification to [email protected].
Faculty member should enter their email address (provides authentication for electronic signature and thus must match email address on file with Walden University):


![THE INTELLECTUAL DNA OF MODERN U.S. COMPETITION LAW FOR DOMINANT FIRM … · 2013-07-30 · No. 1:1] ANTITRUST DOUBLE HELIX 3 Trade Commission Act6 to dominant firm conduct are central](https://img.pdfslide.net/doc/110x75/5ec9196477aaaf6b67455186/the-intellectual-dna-of-modern-us-competition-law-for-dominant-firm-2013-07-30.jpg)