Embed Size (px)
Citation preview
1
A comparison of performance of Islamic and conventional banks 2004 to 2009
Jill Johnes1, Marwan Izzeldin and Vasileios Pappas2
October 2012
Department of Economics Lancaster University Management School
Lancaster University LA1 4YX United Kingdom
Abstract
We compare, using data envelopment analysis (DEA), the performance of Islamic and conventional banks prior to, during and immediately after the recent financial crisis (2004-2009). There is no significant difference in mean efficiency between conventional and Islamic banks when efficiency is measured relative to a common frontier. A meta-frontier analysis, new to the banking context, however, reveals some fundamental differences between the two bank categories. In particular, the efficiency frontier for Islamic banks typically lies inside the frontier for conventional banks, suggesting that the Islamic banking system is less efficient than the conventional one. Managers of Islamic banks, however, make up for this as mean efficiency in Islamic banks is higher than in conventional banks when efficiency is measured relative to their own bank type frontier. A second-stage analysis demonstrates that the differences between the two banking systems remain even after banking environment and bank-level characteristics have been taken into account. Our findings have policy implications. In particular, Islamic banks should explore the benefits of moving to a more standardized system of banking. Conventional banks should investigate why their managers are apparently underperforming relative to those in Islamic banks by examining, for example, the ongoing bonus culture.
Keywords: Banking sector; Islamic banking; Efficiency; Data Envelopment Analysis; Meta-frontier analysis
JEL Classification: C14; G21
1 Corresponding author: email: [email protected]
2 Acknowledgement: The authors are grateful to the Gulf One Lancaster Centre for Economic Research
(GOLCER) for support; and to the discussant and participants at the JEBO Islamic Finance Conference 29th
September to 1
st October 2012 for comments. The usual disclaimer applies.
2
1. Introduction
The recent financial crisis led to difficulties in many conventional3 banks across the globe. Islamic
banks, in contrast, were largely insulated from the crisis (Willison 2009; Yılmaz 2009). It appeared
that their highly regulated operational environment guided by Shariah principles prohibited
investment in the type of instruments which adversely affected conventional banks and which
prompted the crisis (Hasan and Dridi 2010).
The success of Islamic banks relative to conventional banks in the macroeconomic environment is in
contrast to expectations of their performance (by which we mean technical efficiency) in a
microeconomic context. Islamic banks might be expected to have lower technical efficiency than
conventional banks for a number of reasons. First, the strict application of Shariah rules means that
many of the Islamic banking products are unstandardised thereby increasing operational costs.
Second, Islamic banks are typically small compared to conventional banks, and there is evidence that
technical efficiency increases with size in the banking industry (see, for example, Miller and Noulas
1996; Abdul-Majid et al. 2005a; Chen et al. 2005; Drake et al. 2006). Third, Islamic banks are typically
domestically owned and there is evidence to support the contention that foreign-owned banks are
more technically efficient than their domestically-owned counterparts (see, for example, Sturm and
Williams 2004; Matthews and Ismail 2006).
The evidence regarding the performance of Islamic banks relative to conventional banks is limited
and inconclusive. We therefore fill a gap in the literature by investigating two questions to which
previous studies have failed to provide adequate answers. First, which banking system (Islamic or
conventional) is the more (technically) efficient? Second, what are the underlying reasons for any
differences in efficiency between the two banking systems?
The first modern commercial Islamic bank was founded in 1975 (the Dubai Islamic Bank) at which
point only the most fundamental contracts were available (safekeeping accounts, sale and profit-
and-loss sharing contracts). Islamic bonds were launched in 1978 followed by Islamic equity funds
and Islamic insurance during the 1990s. More recently we have seen the introduction of Islamic
3 We use the term conventional to refer to commercial banks not involved in Islamic banking products.
3
indexes such as the Dow Jones Islamic Markets and the Financial Times Stock Exchange Shariah. The
first Islamic products were largely developed to cater for government and corporate requirements.
But the growth in the size and wealth of the Muslim population alongside an increasing desire of
Muslims to have available financial instruments which are Shariah-compliant have created a
challenge to provide consumers with products with a similar or higher rate of return to those on
offer in the conventional sector, yet which still conform to Islamic principles. This has led to banking
innovations at the consumer level including Islamic bank accounts, Islamic credit cards and Islamic
mortgages.
Pressure on Islamic banks to continue to innovate is provided by the increasing appeal of the
traditional values of Islamic finance to Western investors who are disillusioned with the banking
practices of conventional banks in the wake of the global financial crisis (Arthur D Little Report
2009). Appetite for Islamic investment products grows stronger as Islamic banks are found to be less
likely to fail than conventional ones (Čihák and Hesse 2010). As a consequence, Islamic banks are no
longer only a feature of traditional Muslim regions: there are more than 300 Islamic financial
institutions spread across 70 countries. Indeed, there are now 5 Islamic banks in the UK (the only EU
country to date to have Islamic banks), and 19 Islamic financial institutions in the USA. Thus a direct
and in-depth comparison of Islamic and conventional banking will clearly be of widespread interest.
We focus our empirical study on countries with a substantial (at least 60%) Muslim population and
where there are both Islamic and conventional banks in operation. There is strong competition
within each of these sectors (Ariss 2010), and there is likely also to be a growing degree of
competition between them, as Islamic banking products increasingly appeal to consumers other than
Muslims, and large ratings agencies such as Moody’s have begun to get involved in Islamic finance
(Alexakis and Tsikouras 2009). As a consequence, in a first stage analysis, we compute and directly
compare the efficiencies 45 Islamic banks with 207 conventional banks across 18 countries over the
period 2004 to 2009. Furthermore, we adopt a meta-frontier approach which decomposes efficiency
into two components: one due to the modus operandi and one due to managerial competence at
converting inputs into outputs. This allows us to reveal previously unseen aspects of efficiency in
4
Islamic compared to conventional banking. In a second stage we investigate the determinants of the
different components of efficiency (rather than just the overall efficiency) and are thereby able to
uncover and discuss more effective ways in which managers and policy-makers can improve
efficiency.
The paper is in six sections of which this is the first. Section 2 discusses the methodological
approaches to efficiency measurement while a brief literature review is presented in section 3.
Sample data and the empirical model are described in section 4 and results are presented and
interpreted in section 5. Conclusions and policy implications are discussed in section 6.
2. Methodology
Studying banking efficiency can be done in two ways: by use of traditional financial ratio analysis
(FRA); or by the distance function approach whereby a firm’s observed production point is compared
to a production frontier which denotes best practice. This approach leads to frontier estimation
methods such as data envelopment analysis (DEA) and stochastic frontier analysis (SFA).
The pros and cons of FRA as a method of efficiency measurement are well known (Ho and Zhu 2004;
Hasan 2005). In the context of Islamic banking, the most severe drawback is the assumption
underlying financial ratios of cost minimisation or profit maximisation; these are unlikely to be the
most pressing objectives in the context of Islamic banking (Abdul-Majid et al. 2010). For this reason
we eschew FRA (and, indeed, any methodology with an underlying assumption of cost minimization
or profit maximization) as a means of analysis in this paper. Instead we adopt a distance function
approach, which does not assume any specific optimizing objective on the part of the firms, and has
an added bonus that it easily allows for both multiple inputs and multiple outputs.
It is worth reflecting at this point upon our intention to perform a direct comparison of Islamic and
conventional banks4. Given the growth of Islamic banking and its increasing appeal across the
spectrum of consumers, it makes sense to compare the two types of banks directly in order to
identify the best aspects of each. Critics might argue that the objectives of the two banking systems
4 This is not an entirely original approach and there are examples in previous literature (see section 3 for
details).
5
differ to such an extent that such a comparison is invalid: for example, conventional banks can be
seen to be motivated by profit, while Islamic banks may have social objectives such as promoting
Islamic values amongst their staff and clients, and social welfare in the community (Dusuki 2008).
We believe that this criticism can be rejected using one or other of two possible arguments. In the
first case, we question the extent to which Islamic and conventional banks differ: a recent paper
concludes that Islamic banking and finance ‘... simply replaces conventional banking terminology
with terms from Classical Arabic and offers near-identical services to its clients but at a higher cost.’
(Khan 2010 p818). If this is truly the case then directly comparing Islamic and conventional banks is
clearly legitimate.
In the second case, we allow for the eventuality that the objectives of the two types of banks are
indeed different. In this case, we believe that it is still possible to make a direct comparison so long
as the estimation method appropriately allows for differences between (and within) the banking
systems. We have a choice of estimation methods, namely the parametric stochastic frontier
analysis (SFA) or the non-parametric data envelopment analysis (DEA) (Majumdar 1995; Coelli et al.
2005). While the general advantages and disadvantages of each of these are well-known one aspect
must be emphasized: both approaches make the assumption that production units are comparable,
but DEA, by estimating a frontier which envelops the observed production points with piecewise
linear segments, allows each firm (banks in our case) to have its own objectives as it will only be
compared with banks of similar input and output mix. For example, a small Islamic bank, financing its
loans using a balanced mix of equity and deposits, would not in DEA be compared with a large
conventional bank with a different input-output mix financing its loans predominantly using
deposits. In the same way, an Islamic bank mainly involved in sale and mark-up transactions will not
be compared with one which undertakes joint venture finance a they will have different mixes of
outputs. SFA, on the other hand, applies the same parameters5 to all observations in the sample; it
does not allow for differences between units and so allows inappropriate comparisons between very
5 A random parameter variant of SFA would also allow firms to differ in their objectives. But this method
requires large numbers of degrees of freedom and can be difficult to fit in practice.
6
different banks. By choosing DEA rather than SFA as our estimation method, we therefore overcome
any criticism of pooling the different banks as DEA only compares like with like.
It would be particularly useful if our method of assessing efficiency could also answer the question:
do the rules under which Islamic banks must do business affect the efficiency with which they can
operate? Clearly, policies to improve bank efficiency will depend on whether the source of
inefficiency is the banking system or managerial incompetence. Thus we introduce to the financial
literature a meta-frontier methodology (similar to one introduced by Charnes et al. 1981) for
decomposing the efficiency of banks into two components: one which is due to the modus operandi
i.e. the context in (or rules under) which the bank operates (namely conventional or Islamic); and
one which is due to managerial competence at converting inputs into outputs within the context in
which the bank operates.
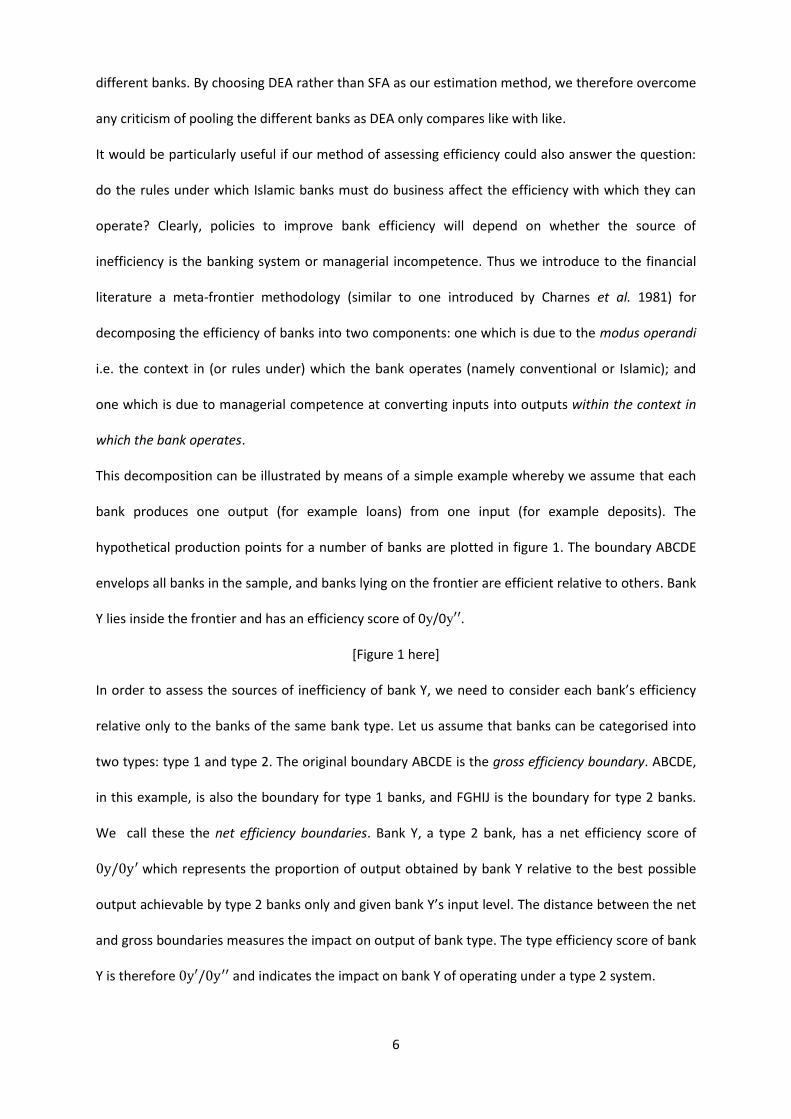
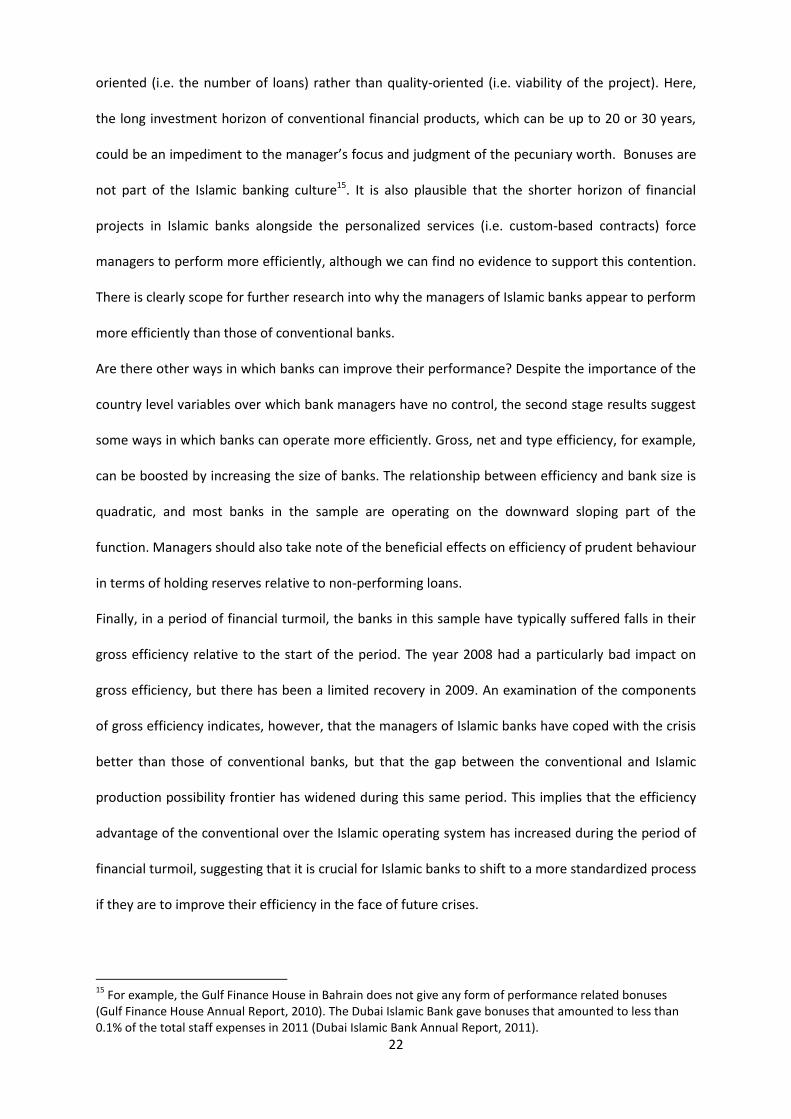
This decomposition can be illustrated by means of a simple example whereby we assume that each
bank produces one output (for example loans) from one input (for example deposits). The
hypothetical production points for a number of banks are plotted in figure 1. The boundary ABCDE
envelops all banks in the sample, and banks lying on the frontier are efficient relative to others. Bank
Y lies inside the frontier and has an efficiency score of 0y/0y .
[Figure 1 here]
In order to assess the sources of inefficiency of bank Y, we need to consider each bank’s efficiency
relative only to the banks of the same bank type. Let us assume that banks can be categorised into
two types: type 1 and type 2. The original boundary ABCDE is the gross efficiency boundary. ABCDE,
in this example, is also the boundary for type 1 banks, and FGHIJ is the boundary for type 2 banks.
We call these the net efficiency boundaries. Bank Y, a type 2 bank, has a net efficiency score of
which represents the proportion of output obtained by bank Y relative to the best possible
output achievable by type 2 banks only and given bank Y’s input level. The distance between the net
and gross boundaries measures the impact on output of bank type. The type efficiency score of bank
Y is therefore and indicates the impact on bank Y of operating under a type 2 system.
7
The computation of the gross, net and type efficiencies is simply a first stage. Any differences
between Islamic and conventional banks in these measures of efficiency might be a consequence of
some other underlying character(s) of each group of banks and not purely operation within the given
system. Thus we intend to perform a second stage analysis which will ascertain the determinants of
each efficiency component (and which will include as one of the explanatory variables an indicator
of bank type). Such an analysis will not only assess the extent of the effect on efficiency of banking
system (having taken into account other characteristics), it will also provide further information to
policy-makers and bank managers about factors which affect the efficiency with which banks
operate.
The performance of a second stage analysis of DEA efficiencies is often undertaken using a Tobit
regression model (examples in the banking context include: Jackson and Fethi 2000; Casu and
Molyneux 2003; Drake et al. 2006; Ariff and Can 2008; Sufian 2009). The choice of a Tobit model is
based on the premise that the dependent variable comprising DEA efficiency scores is a censored
variable. In fact, recent literature argues that efficiency scores are not censored but are fractional
data (McDonald 2009), thus making Tobit analysis inappropriate. Evidence from a comparison of
various possible second stage approaches (Hoff 2007; McDonald 2009) suggests that ordinary least
squares regression analysis (with White heteroscedastic-consistent standard errors) is the most
appropriate second stage approach in terms of producing consistent estimators and valid (large
sample) hypothesis tests which are robust to heteroscedasticity and the distribution of disturbances.
Owing to the panel nature of the data here, we choose to use a (bank) random effects estimation
approach with heteroscedasticity corrected standard errors in our second stage analysis.
3. Literature review
There is an abundant literature on the efficiency of banking institutions: detailed (albeit somewhat
outdated) reviews can be found elsewhere (Berger and Humphrey 1997; Berger and Mester 1997;
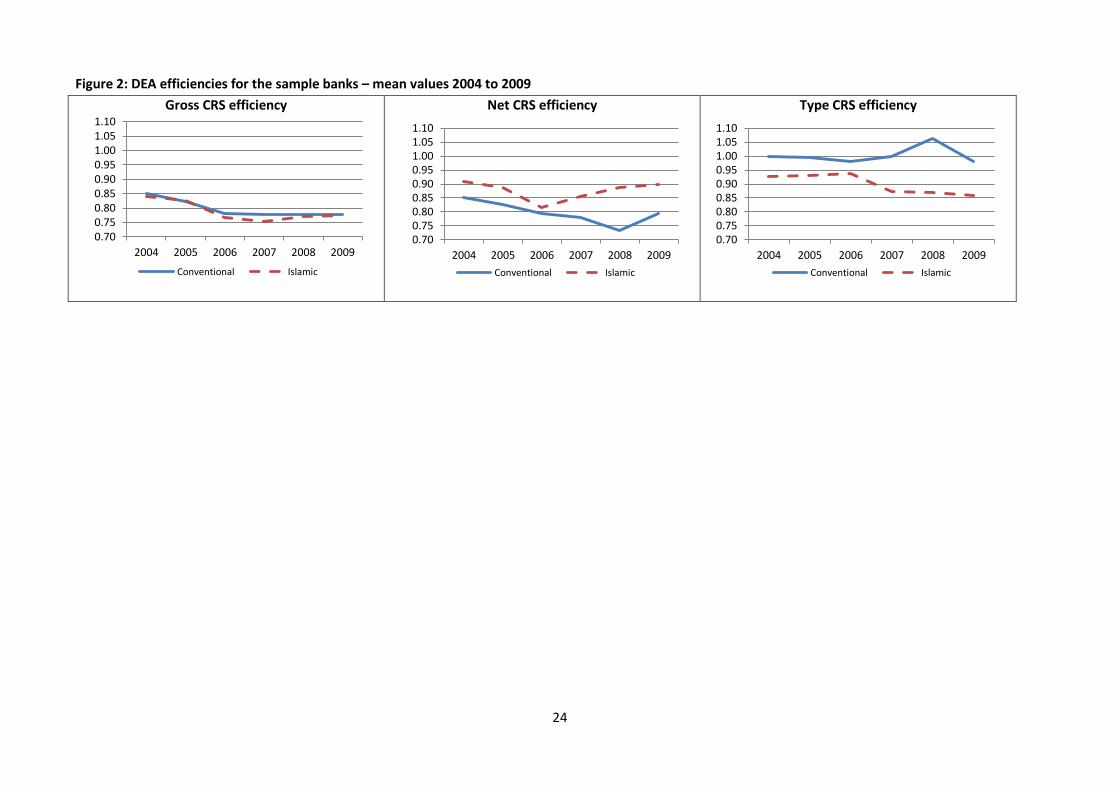
Brown and Skully 2002). A small subset of this literature focuses on Islamic banking either in
isolation or in comparison to conventional banking (see table 1 for details of studies which use
8
frontier estimation methods to derive measures of efficiency). The remainder of this section will
focus predominantly on the comparative literature.
[Table 1 here]
We have previously hypothesized that Islamic banks will typically have lower efficiency than
conventional banks. The evidence from previous empirical studies of Islamic and conventional
banking is mixed: some find no significant difference in efficiency between the two types of banking
(Abdul-Majid et al. 2005b; El-Gamal and Inanoglu 2005; Mokhtar et al. 2006; Bader 2008; Hassan et
al. 2009; Shahid et al. 2010); some studies (in some cases because the sample size is small) do not
test whether observed differences in efficiency are significant (Hussein 2004; Al-Jarrah and
Molyneux 2005; Said 2012); one study claims that Islamic banks are significantly more efficient than
conventional banks, but results of significance tests are not shown and, in any case, the result is
based on a sample which only contains 7 Islamic banks (Al-Muharrami 2008). Only a small number of
studies find, as expected a priori, that Islamic banks are significantly less efficient than conventional
banks, but the possible reasons for the difference are not explored further (Mokhtar et al. 2007;
2008; Srairi 2010).
One group of studies deserves particular mention because they make a distinction between ‘gross’
and ‘net’ efficiency (Abdul-Majid et al. 2008; Johnes et al. 2009; Abdul-Majid et al. 2010; 2011a;
2011b). Gross efficiency incorporates both managerial competence and efficiency arising from
modus operandi; net efficiency isolates the managerial component and therefore provides a
measure of managerial efficiency. In one study based on banks in Malaysia, gross efficiency scores
are derived from a SFA estimation of a cost function which makes no allowance for various
characteristics of each bank (including whether or not it is Islamic), while net efficiency scores are
estimated by taking into account the operating characteristics of banks in the SFA cost function
(Abdul-Majid et al. 2008; 2011a; 2011b). Gross efficiency is found to be highest for conventional
banks and lowest for Islamic banks, and the significance of the Islamic dummy in the cost equation
including the environmental variables suggests that this difference is significant. There are,
however, only slight differences in net efficiency between the different types of banks. The findings
9
from this study are questionable for two reasons. First they are derived from an estimated cost
function for a sample of Islamic and conventional banks, and this implicitly assumes an objective of
cost minimization on the part of all the banks in the data set. Second, the estimation technique (SFA)
applies the same parameter to all observations and hence does not allow for differences in
objectives between banks in the sample.
A later study by the same authors corrects the first problem by estimating an output distance
function; the shortcomings of the estimation technique, however, remain (Abdul-Majid et al. 2010).
This study, based on a sample of banks across 10 different countries, finds that the Islamic dummy is
not a significant determinant of net efficiency; hence any inferior performance of Islamic banks is
mainly due to the constraints under which they operate rather than the shortcomings of their
managers.
Johnes et al (2009) take a different approach by examining gross and net efficiency using an output
distance function estimated using DEA. They define gross efficiency as the efficiency score derived
from pooling both types of banks, while net efficiency is derived by comparing banks only to others
of the same type. They find (like Abdul-Majid et al. 2008; 2011a; 2011b) that the lower performance
of Islamic banks in Gulf Cooperation Council (GCC) is due to modus operandi rather than managerial
incompetence.
These studies are interesting and offer a way forward in terms of isolating the underlying causes of
the differing performance of Islamic and conventional banks. There is a need, however, for a
comparison of efficiency between conventional and Islamic banks based on a large sample of banks
using an approach which makes no underlying assumptions regarding the banks’ objectives, and
which allows for inter-bank differences in outlook. Furthermore, we need to extend the study to
investigate the factors underlying the gross and net efficiency scores. Thus, it is not enough to know
whether it is modus operandi or managerial inadequacies which underpin a bank’s performance;
bank managers need to know how and to what extent their behaviour can affect their efficiency. A
detailed second stage analysis of both gross and net efficiency scores will provide this information.
4. Sample data and models
10
The empirical analysis presented in this study focuses on countries where at least 60% of the
population is Muslim and where there are both Islamic and conventional banks operating. We
include in the sample banks for which a complete set of data for the DEA can be compiled using the
data source Bankscope, for the period 2004 to 20096. This is an interesting time period over which to
undertake this study as it also allows us to gain insights into the effects of the macroeconomic
turmoil and instability experienced later in this period on the efficiency of the banking sector (see
Rokhim and Rokhim 2011 for another study of Islamic and conventional banks over the same
period).
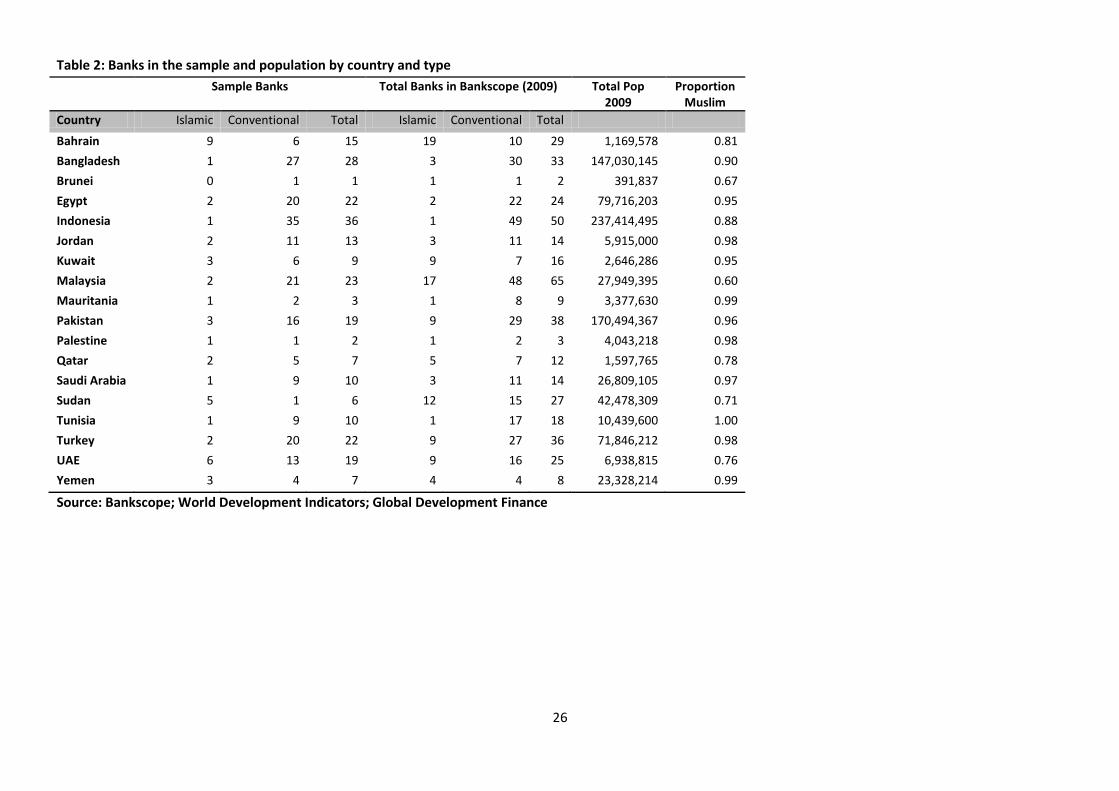
Banks are designated Islamic or conventional on the basis of the Bankscope definition, and
conventional banks which operate Islamic windows are not included in our sample. Figures for 252
banks (207 conventional and 45 Islamic) across 18 countries (see table 2) are extracted from the
consolidated data in US dollars (USD) having been converted from own currencies by end of
accounting year exchange rates. In addition, all variables are deflated to 2005 prices using
appropriate deflators7. Both banking sectors (conventional and Islamic) in the sample countries are
required to follow national and international regulatory requirements under the supervision of the
banking authorities of their host country, and both bank types adhere to the same accounting
standards (Alexakis and Tsikouras 2009). Thus data should be consistent across the two bank types,
but any discrepancy in practice (for example, Islamic banks must also conform to the requirements
of the Shariah supervisory board) is allowed for in the first stage by the use of DEA. The number and
type of banks included in the sample and population is shown in table 2.
[Table 2 here]
4.1 First stage analysis: estimation of efficiencies
The choice of variables qualifying for the DEA model is guided by previous literature and data
availability. We define bank output in accordance with the intermediation approach (Pasiouras
2006). We therefore assume the banks perform an intermediary role between borrowers and
6 Note that Bankscope moved to International Financial Reporting Standards (IFRS) from 2004 onwards, and so
data should be comparable over time. 7These were calculated using data from World Development Indicators (WDI) and Global Development Finance
(GDF).
11
depositors and use deposits and short term funding, fixed assets, general and administration
expenses and equity as inputs to produce total loans and other earning assets.
Islamic banks do not offer loans in the same way as conventional banks, and so the term ‘total loans’
is a generic term used to encompass the equity financing products they use. Conventional banks
earn money from the spread between lending interest and borrowing interest rates. Islamic banks
have a similar spread which is defined in terms of profit share ratios between the entrepreneurs
(borrowers) and the depositors (lenders).
Fixed assets are included to represent capital input, while general and administration expenses are
used as a proxy for labour input. While it may not be a perfect reflection of labour input, it is more
easily available than better measures (e.g. employee numbers or expenditure on wages) and has
been used in previous studies (e.g. Drake and Hall 2003) where it is argued that personnel expenses
make up a large proportion of general and administration expenses.
It has been suggested that an indicator of risk-taking should explicitly be incorporated into any
model of banking efficiency (Charnes et al. 1990), and this aspect is likely to be particularly
important in a context which compares Islamic and conventional banks where one would expect a
difference in risk-taking behaviour (Sufian 2006). The difficulty with incorporating risk-taking activity
is the choice of variable to capture the effect. Some studies use off-balance sheet items (Pasiouras
2008; Lozano-Vivas and Pasiouras 2010) but this variable has the disadvantage that data are not
widely available and the sample is consequently severely reduced by its inclusion. Other studies use
equity which is more widely available; moreover bank attitudes to holding equity have responded
quickly to changes in the financial climate, and this makes it particularly attractive in a study which
encompasses a period of financial crisis. Indeed, equity has been used to reflect risk in previous
studies which have covered times of financial crisis: the East Asian crisis (Abdul-Majid et al. 2008),
and the savings and loans crisis in the USA (Alam 2001). We therefore feel that the variable equity
captures the general attitudes towards risk (enforced or preferred) of the two types of banks over
the period, and use it to reflect risk in our own study.
12
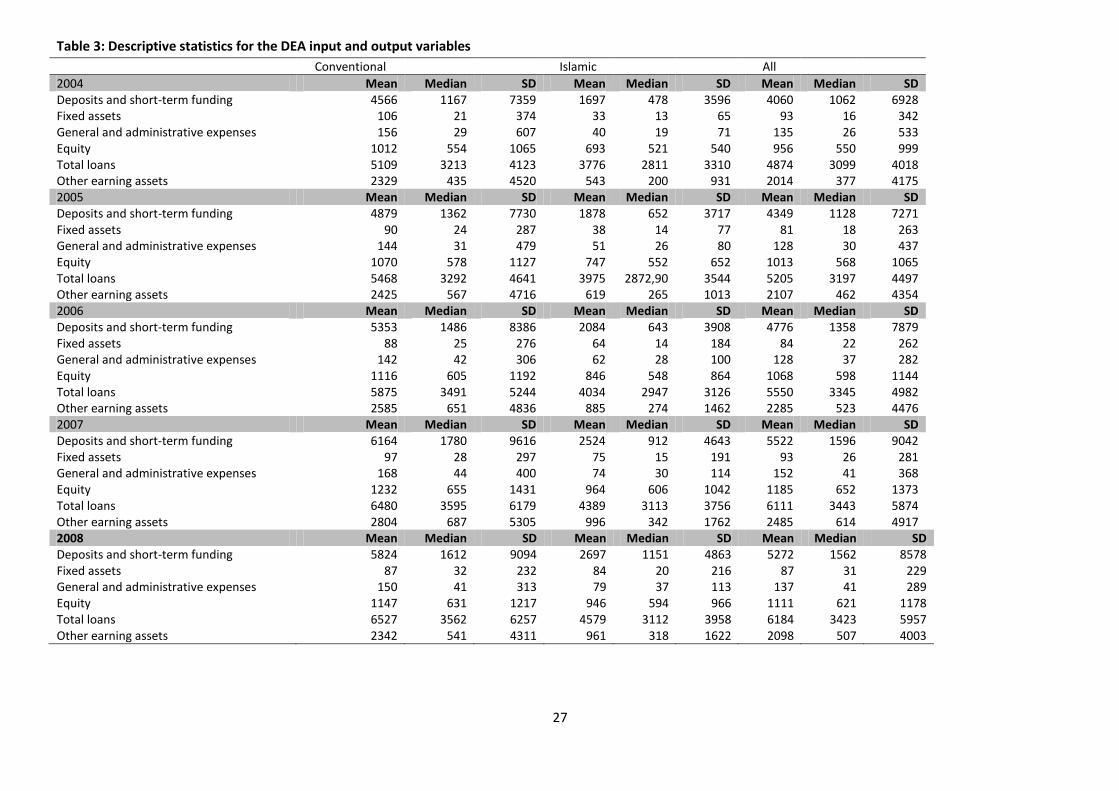
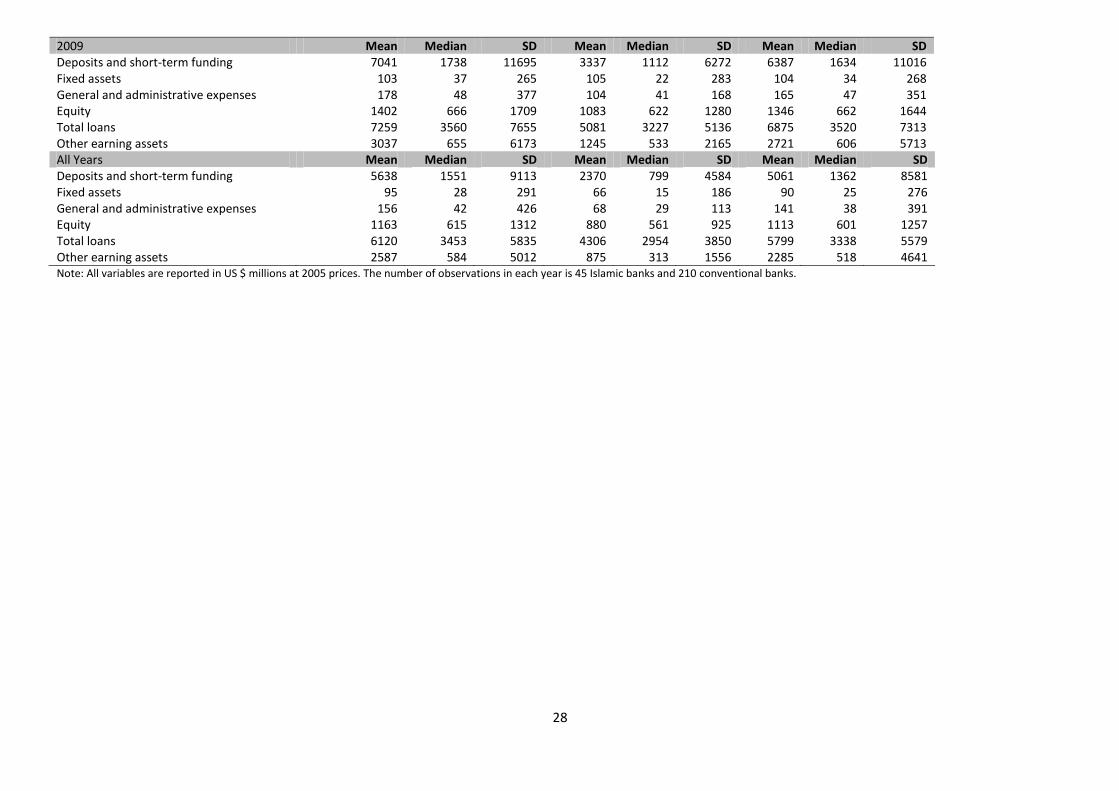
Descriptive statistics of the DEA variables are presented in table 3. Over the whole period of study,
the typical conventional bank has just over US $6000 million in total loans and US $2500 million in
other earning assets. These are 1.5 and 3 times the values for Islamic banks (respectively). There has
been growth in these output variables in both banking sectors over the period but this has slowed
down (understandably given the world economic climate) towards the end of the period. Input
variables are typically up to twice as big in the conventional compared to the Islamic banking sector.
[Table 3 here]
4.2 Second stage analysis: determinants of efficiency
In a second stage, an investigation of the possible determinants of the different types of efficiency
scores (gross, net and type) of the banks is undertaken. We will divide these into two broad
categories: the characteristics of the individual banks, and the banking context, over which
managers have no control, and which is particularly relevant in cross-country studies (Dietsch and
Lozano-Vivas 2000; Lozano-Vivas et al. 2002). Eight variables are included in the second stage
analysis to reflect bank-level characteristics.
A binary variable to reflect whether the bank is classified by Bankscope as fully-fledged
Islamic (ISLAMIC). This variable is included in the second stage to assess whether any
differences in efficiency remain after the economic environment and the bank’s own
characteristics have been taken into account.
A dummy variable to reflect whether the bank is listed on the stock market (LIST) and an
interaction term between ISLAMIC and LIST (ISLIST). Listing on the stock market has been
found to have a positive effect on efficiency in the context of conventional banks in Europe
(Casu and Molyneux 2003) but a negative effect in the context of Islamic banks (Yudistira
2004) – hence the inclusion of both the listing dummy and interaction term.
The value of a bank’s total assets (ASSETS). This variable is included to reflect bank size.
Islamic banks are typically smaller than conventional banks and so it might be size which
causes any observed differences in efficiency. Previous research in the context of Islamic
banking suggests a non-linear relationship between bank stability and size (Abdul-Majid et
13
al. 2005b); we check for a non-linear relationship between efficiency and size by also
including the square of ASSETS (ASSETSSQ).
The ratio of loan loss reserves to loans (LOANLOSS/LOANS). This variable acts as a proxy for
credit risk (the higher the loan loss reserves ratio the lower the credit risk). In managing
increasing credit risk, banks may incur additional expenses to monitor their loans (Barajas et
al. 1999) which might lead to lower efficiency; on the other hand, a lower ratio has been
associated with increased profit margins (Miller and Noulas 1997) and this may lead in turn to
higher efficiency. Islamic and conventional banks may well manage credit risk differently, and
this variable is included to capture any potential effect of that possibility. Previous evidence
finds no significant relationship between the ratio of loan loss reserves to loans and
efficiency (Staikouras et al. 2008).
The ratio of total loans to assets (LOANS/ASSETS) and the ratio of net loans to assets
(NETLOANS/ASSETS). Total loans is the sum of reserves for impaired loans (relative to non-
performing loans) and net loans. By including both variables we obtain the effect on
efficiency of the components of total loans. Thus the sum of the coefficients on these two
variables will reflect the effect on efficiency of net loans (relative to assets), and the
coefficient on LOANS/ASSETS will indicate the effect on efficiency of the value of reserves for
impaired loans (relative to non-performing loans): the greater are these reserves, the higher
is the bank’s liquidity and hence the lower its exposure to defaults; on the other hand, the
lower are the reserves, the higher are potential returns. Thus the potential overall effects of
NETLOANS/ASSETS and LOANS/ASSETS on efficiency are unclear, a priori, although previous
research has suggested a positive relationship between liquidity and efficiency in both
Islamic and European banks (Hasan and Dridi 2010).
Five variables – sourced from World Development Indicators (WDI) and Global Development Finance
(GDF) databases – are included to reflect the overall banking environment.
The normalised Herfindahl index (HHI). This variable reflects the competitive environment of
each country’s banking sector. The index is calculated using all the banks (contained in
14
Bankscope8) for a given country and hence assumes that Islamic and conventional banks
compete against each other9. The ‘quiet life’ theory suggests that increased industry
concentration is related to lower technical efficiency as there is little incentive to be efficient
when competition is low (Berger and Mester 1997). The ‘efficiency hypothesis’, on the other
hand, argues that concentration and efficiency are positively related. There is evidence from
previous studies in the context of conventional banks to support both the ‘quiet life’ theory
(Yudistira 2004; Staikouras et al. 2008) and the ‘efficiency hypothesis’ (Dietsch and Lozano-
Vivas 2000; Koutsomanoli-Filippaki et al. 2009).
The degree of market capitalization i.e. the percentage valuation of listed firms across all
sectors relative to the country’s GDP (MCAP). This is included to reflect the level of stock
market activity in the economy, and its possible effect on bank efficiency is unknown a
priori.
Growth in real GDP (GDPGR) and Inflation (INF). These variables are included to capture the
buoyancy of the economy in which the bank is located. While their precise effects are
unknown a priori, previous evidence has shown a positive relationship between GDP growth
and banking efficiency (Staikouras et al. 2008; Awdeh and El Moussawi 2009).
Per capita GDP (GDPPC). This variable reflects the level of institutional development and the
supply and demand conditions in the market in which the bank is located. While previous
evidence has shown a positive relationship between per capita income and costs (Dietsch
and Lozano-Vivas 2000), the precise effect of this variable on efficiency is ambiguous a priori.
Finally year dummies are included to allow for changes in banking efficiency over time (year
dummies are used in preference to a trend variable in order to allow different effects on
8The normalized Herfindahl index is
where HI is the Herfindahl index, calculated using market
shares (based on total assets) at year end, and N is the number of firms (Bikker and Haaf 2002; Čihák and Hesse 2010). The normalised Herfindahl index ranges from 0 to 1 and gives lower rankings than the original Herfindahl index for industries with small number of firms (Busse et al. 2007). It is therefore more appropriate in the present context. Bankscope is not entirely comprehensive in its coverage, but omitted banks are likely to be small and hence the HHI calculated on this basis should adequately reflect the competitive environment. 9 This is justified on the grounds that Islamic banking products increasingly appeal to non-Muslim customers;
and large ratings agencies are getting involved in Islamic finance (Alexakis and Tsikouras 2009; Arthur D Little Report 2009).
15
performance in different years). These dummies may also pick up the effect on efficiency of any
idiosyncratic (year by year) changes in data recording or bank behaviour. In addition the interactions
between the Islamic dummy and year dummies are included to examine whether Islamic and
conventional banks have experienced different effects on their efficiency over the time period.
Region dummies are included to allow for differences in efficiency between three broad regions10.
We will therefore estimate, using random effects, with heteroscedasticity-corrected standard errors,
the following equation:
where: , represents banks; represents time; represents country;
represents region; and . The dependent variable denotes efficiency and
separate equations are estimated for gross, net and type efficiency respectively; is the intercept
term and denotes the mean of the unobserved heterogeneity; ( ) is the random
heterogeneity specific to the nth bank and is constant over time; ( ) and is
uncorrelated over time; is an Nx8 matrix of bank-level explanatory variables (see section 4.2);
is an Nx5 matrix of country-level explanatory variables (see section 4.2); is an Nx2 matrix of
regional-level dummies (see footnote 10); is an Nx10 matrix of year dummies, and year and
Islamic interaction dummy variables.
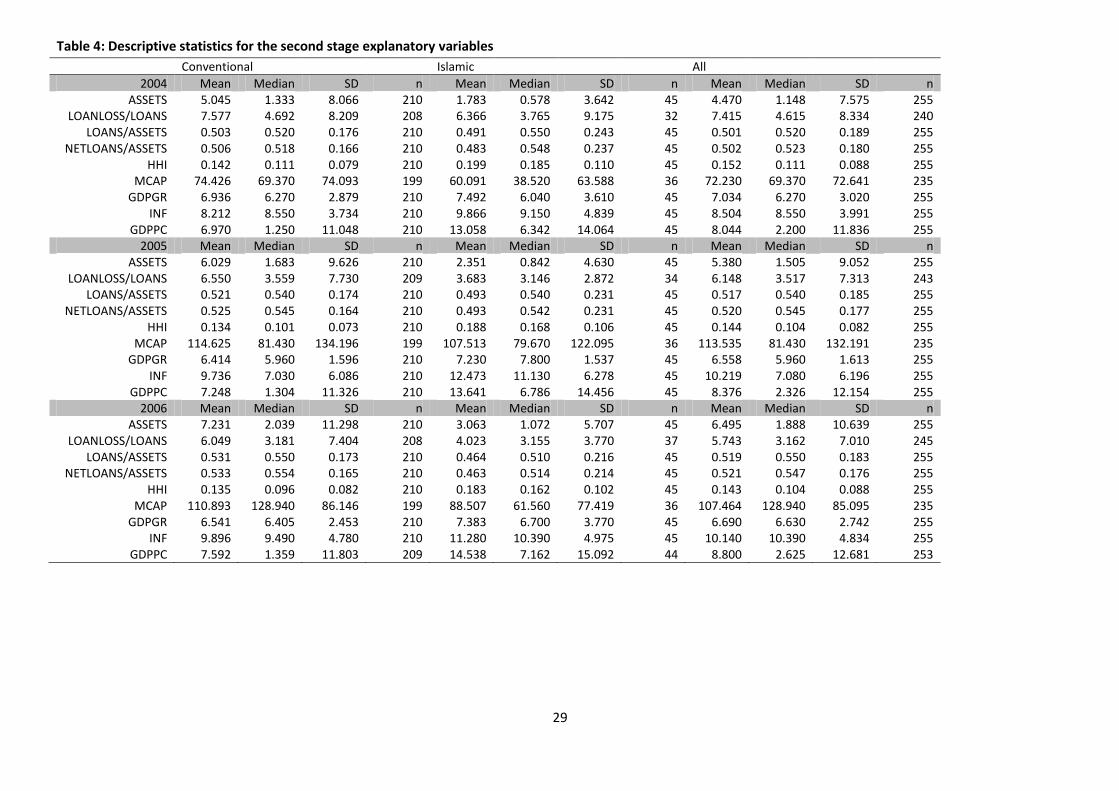
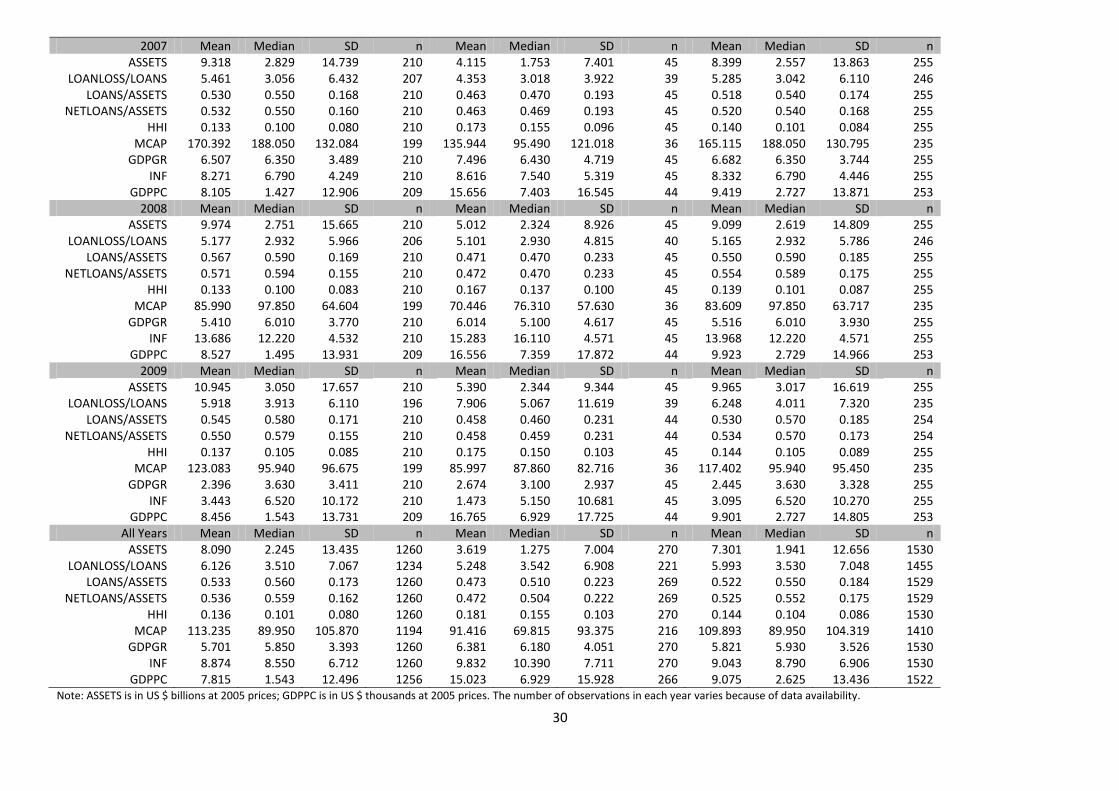
Descriptive statistics of the second stage variables are presented in table 4. There are clear
differences between Islamic and conventional banks in terms of these variables. Most notably
Islamic banks are much smaller (less than half the size) and, through their country location, they face
a much higher (nearly double) per capita GDP than their conventional counterparts. These
differences between the two types of banks in terms of underlying factors of efficiency may
therefore explain the differences in efficiency we have already observed between Islamic and
conventional banks.
[Table 4 here]
10
The regions are: Middle East = Egypt, Jordan, Mauritania, Palestine, Sudan, Tunisia, Turkey, Yemen; Gulf Cooperating Council (GCC) = Bahrain, Kuwait, Qatar, Saudi Arabia, United Arab Emirates; Asia = Bangladesh, Brunei, Indonesia, Malaysia, Pakistan. GCC and ASIA are the dummy variables included in the equation.
16
5. Results
5.1 First stage results
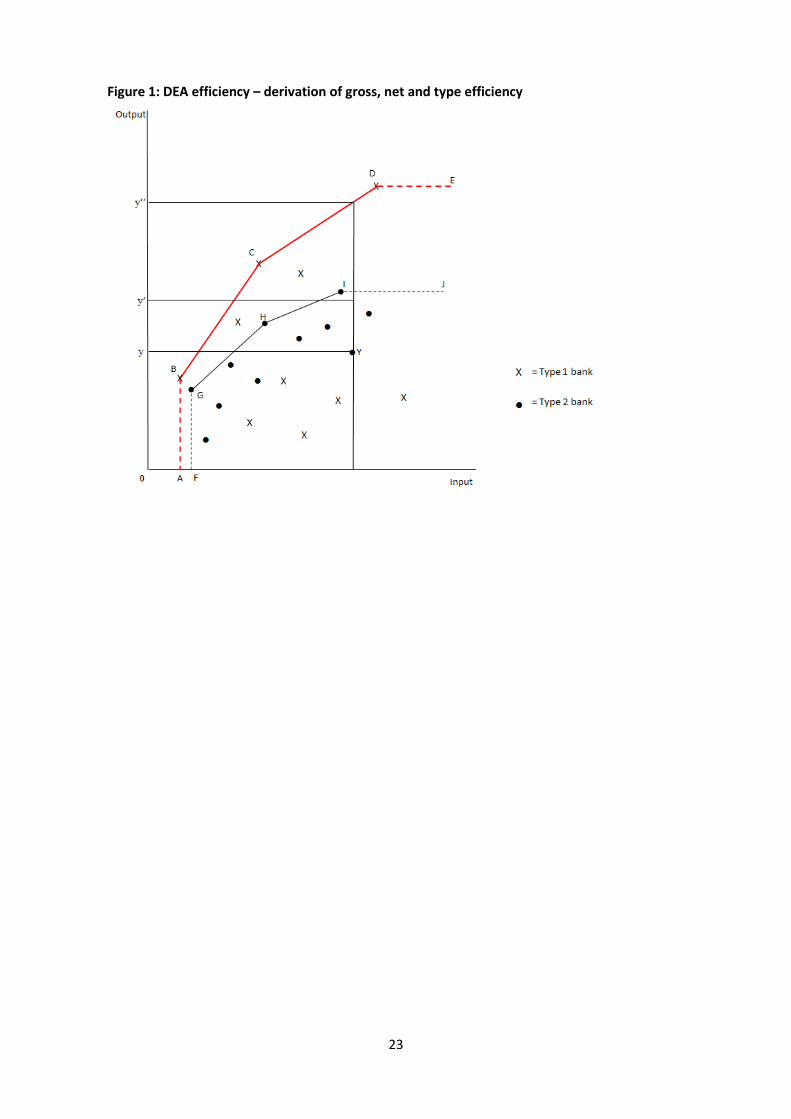
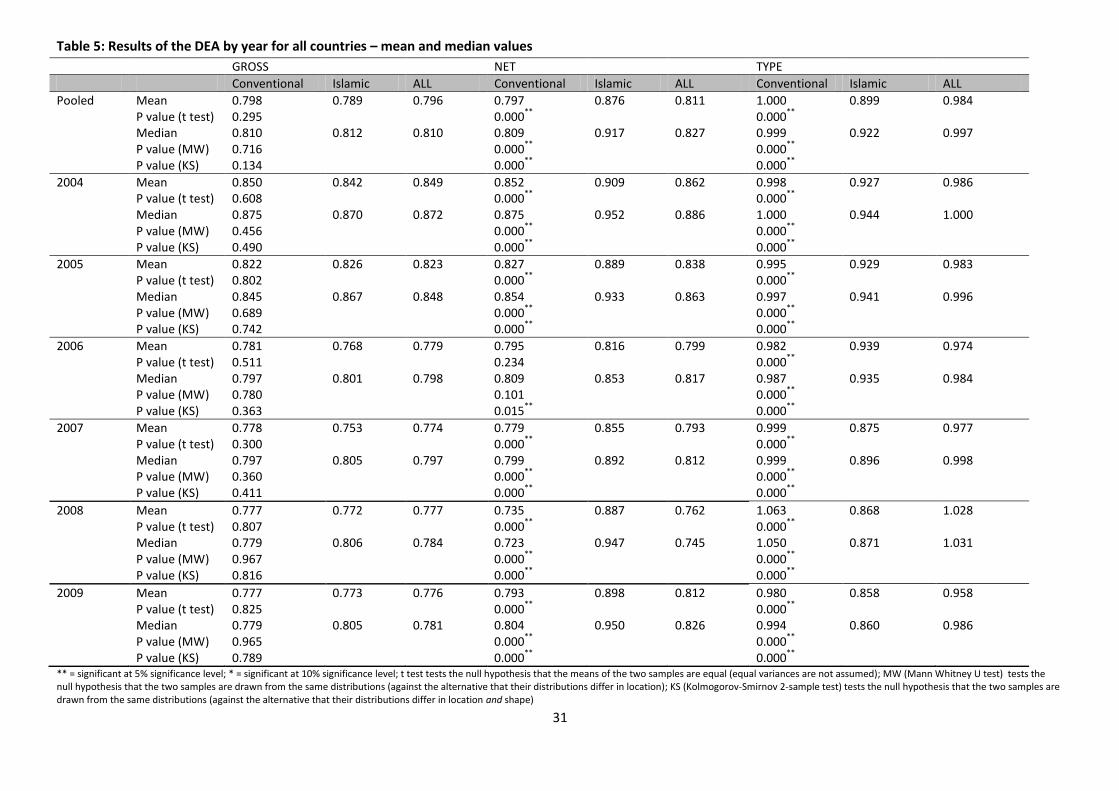
The bias corrected11 DEA efficiencies, calculated using an output-oriented constant returns to scale
(CRS) approach, are reported in table 5 and displayed in figure 2. We also calculate the bias
corrected variable returns to scale (VRS) results. These provide identical findings to the CRS results
and hence are not reported here12. We calculate the efficiencies on the assumption that production
conditions vary over time. This means that the DEA is performed for each year separately13. Given
the expanding populations and markets in many of the sample countries, this is likely to be a valid
assumption.
[Table 5 here]
[Figure 2 here]
In terms of gross efficiency there is no evidence to suggest significant differences in mean efficiency
levels between conventional and Islamic banks. In the context of net efficiency, however, Islamic
banks consistently have higher average levels of efficiency than conventional banks and the
differences are significant in all years apart from 2006. Turning now to type efficiency, we see that
conventional banks have higher efficiency, on average, than the Islamic banks, and this difference is
significant in all years of the study.
The implications of these results are that, when measured against a common frontier, each type of
bank typically has the same level of efficiency; but, when measured against their own frontier,
Islamic banks are more efficient, on average, than conventional banks. We can see how these results
might be represented in a 2-dimensional situation by referring back to figure 1. The conventional
banks are most closely represented by the crosses in figure 1, with a few highly efficient banks which
determine the position of the overall efficiency frontier ABCDE, and plenty of other much less
11
Bias corrected efficiencies are calculated using the homogeneous bootstrapping algorithm of (Simar and Wilson 2008). The bootstrap method provides estimates which are corrected for sampling variability. Results calculated without bootstrapping can be found here http://papers.ssrn.com/sol3/papers.cfm?abstract_id=2071615. 12
The VRS results are available on request. 13
For comparison, the efficiencies were also generated on the assumption that production conditions do not vary over time. In practical terms, this means that the DEA is performed on the pooled data. Broad conclusions are identical to those reported here.
17
efficient banks. The Islamic banks, on the other hand, are most closely represented by the dots with
many of the Islamic banks being located close to their own frontier (FGHIJ) and only a few being
highly inefficient. The average overall efficiency score is therefore similar for the two types of banks,
but the net efficiency score is much higher, on average, amongst Islamic banks compared to
conventional banks.
The results provide clear evidence that the Islamic banking system is less efficient than the
conventional one (in figure 1 frontier FGHIJ lies inside frontier ABCDE). This is in line with earlier
conclusions derived using SFA and DEA (Abdul-Majid et al. 2008; Johnes et al. 2009; Abdul-Majid et
al. 2011a). The fact that the Islamic banking modus operandi is less efficient than its conventional
counterpart comes as no surprise for a number of reasons. First an Islamic bank operates mainly
with customised contracts which are either equity-type (profit and loss sharing) or services-type
(leasing agreements, mark-up pricing sale). These contracts are tailor-made as many of the relevant
parameters (such as maturity, repayments and collateral) are specific for every client. The bank, as
the financer, needs to conduct a feasibility and profitability analysis for equity-type contracts; this is
costly and time-consuming. Second an Islamic bank needs to gain approval for its financial products
from the Shariah board of the bank. This is done for every Islamic bond issue (sukuk) and also for the
majority of equity-based contracts, although the fee-based contracts are more standardised and
hence rarely require the approval of the Shariah board. Thus Islamic banks incur greater
administration costs and higher operational risk than conventional banks.
An additional result found here, which is in contrast to Abdul-Majid et al. (2008; 2011a), is that the
managers of Islamic banks appear to make up for the disadvantages of their banking system by being
more efficient than their counterparts in conventional banks. We will discuss this result further in
the following section.
5.2 Second stage results
The analysis of differences between Islamic and conventional banks in terms of their gross, net and
type efficiencies is somewhat simplistic as it looks only at bank type as a cause of inter-bank
disparities. There is a possibility that some other characteristic(s) apart from operating under Islamic
18
or conventional rules causes the differences between the two groups of banks reported in section
5.1. We therefore use econometric techniques to investigate the causes of inter-bank variations in
efficiency and to assess whether, having taken various environmental and bank-specific
characteristics into account, bank type (Islamic or conventional) is still a significant factor underlying
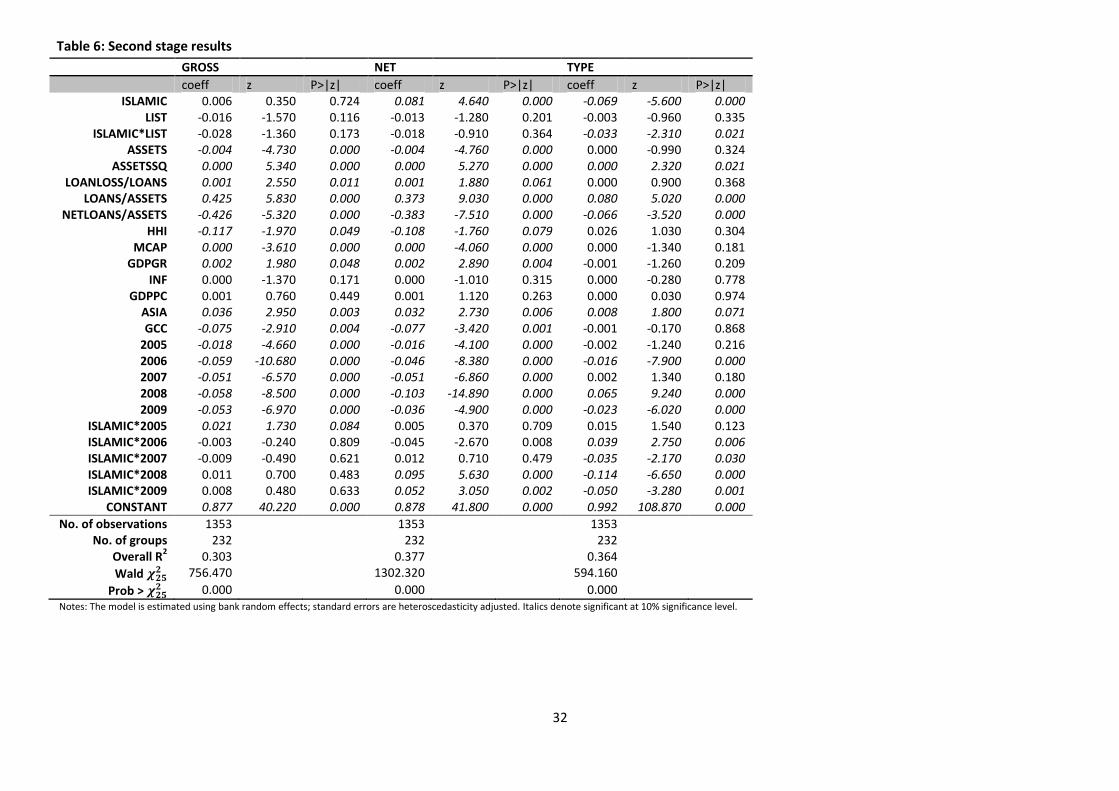
gross, net and type efficiency levels. The results of the panel data analysis are presented in table 6.
[Table 6 here]
The main finding from this second stage analysis is that, having taken into account a range of
macroeconomic and bank-level variables, the distinctions between Islamic and conventional banks
found in section 5.1 still remain. Thus there is no significant difference between Islamic and
conventional banks in terms of gross efficiency; the net efficiency of Islamic banks is significantly
higher (by 0.08) than in conventional banks, while type efficiency is lower (by 0.07) for Islamic banks
than conventional banks. The Islamic method of banking (with its compliance with Shariah law)
therefore results in lower efficiency than conventional banking, but the managers of the Islamic
banks make up for this disadvantage, and this is the case even after taking into account other
contextual and bank-level characteristics. The efforts of the managers of Islamic banks in terms of
recouping efficiency lost due to modus operandi is an interesting finding and is in contrast to reports
from the late 1990s which suggested that the managers of Islamic banks were lacking in training
(Iqbal et al. 1998). It seems therefore that the expansion of demand in Islamic financial products has
coincided with an improvement in managerial efficiency. Why has this happened? Clearly operating
with tailor-made financial products (as in Islamic banks) requires considerable human input, and so
Islamic banks have spent more on human resources than conventional banks in order to emphasise
reputation, trust and interpersonal relationships (Pellegrina 2008). In addition, education and
knowhow in the context of Islamic finance has increased in recent years (and specifically over the
period of the study) and as a consequence is promoted to the general public using, for example,
19
marketing campaigns14. These may therefore have contributed to an increase in managerial
efficiency within Islamic banks.
Some other results in table 6 are worthy of further discussion. A number of variables are significant
in explaining gross and net but not type efficiency. Increasing size initially decreases efficiency but
beyond an asset value of around $40 billion gross and net efficiency increase with size. Given that
mean size is around $7 billion, many banks (and nearly all Islamic banks) experience the negative
relationship between efficiency and size.
The ratio of loans to assets and the ratio of net loans to assets are the two remaining bank-level
variables which significantly affect gross and net efficiency, the former positively and the latter
negatively. These results need to be considered together since total loans are the sum of net loans
and reserves for impaired loans (relative to non-performing loans). Thus the coefficient on the ratio
of loans to assets reflects the effect of holding reserves for impaired loans on efficiency: in this case
the higher the reserves (and hence the higher the protection for the bank from bad loans) the higher
is efficiency. Thus banks which behave prudently in terms of insuring against bad loans reap rewards
in terms of higher efficiency. The sum of the two coefficients suggests that the size of net loans has
little effect on efficiency.
Turning now to the macroeconomic (country-level) variables we can see that three of these are
significant in the net and gross efficiency equations at the 10% significance level. First, the
significantly negative coefficient on HHI provides support for the ‘quiet life’ hypothesis. Second
country-level variable is worthy of mention: a higher level of market capitalization (and hence stock
market activity) leads to lower gross and net efficiency. Third, increasing GDP growth is associated
with higher efficiency (gross and net) as expected.
The two dummies to reflect geographical region are also significant with banks in the Asian region
having higher efficiency (than the omitted region) by 0.04, and banks in the GCC having lower
efficiency by around 0.08. We speculate that the size of population may be responsible for these
differences between regions: Asia has the largest population, followed by the Middle Eastern region, 14
To this end, Bank Syariah Mandiri in Indonesia sponsors documentaries on Islamic finance while Emirates Bank in the UAE waives loan payments during Ramadan as part of marketing campaigns (Bloomberg).
20
and then by the GCC. It is possible that the higher demand for banking products in the most
populated region leads to greater standardization of products and the possibility of reaping
economies of scale. The opposite may be the case for the smallest region. Further research is
necessary to confirm these conjectures.
Finally, the year fixed effects indicate that, compared with the first year of the study (2004) all years
have seen significantly lower gross efficiency, with 2006 and 2008 seeing the worst performance.
This pattern is the same for conventional and Islamic banks. The time pattern of net efficiency, on
the other hand, differs between the two types of banks. Conventional banks have seen increasing
falls in net efficiency (relative to 2004) with the nadir being in 2008; there is an improvement in
2009, but the position is still low relative to 2004. Islamic banks have experienced a similar pattern in
net efficiency between 2005 and 2008 – Islamic banks have seen a slightly bigger (smaller) fall in
2006 (2008) compared to conventional banks – but 2009 reveals a significant difference between
the two types in that Islamic banks have seen a rise in net efficiency relative to 2004. Managers of
Islamic banks seem therefore to have coped with the recent financial crisis better than managers of
conventional banks. However, the crisis seems to have had a more severely adverse effect on type
efficiency in Islamic than conventional banks: thus the gap between the Islamic and conventional
production possibility frontiers (see figure 1) has widened in the most recent years of the study
(2007 to 2009). This is an interesting result and is in contrast to the view of Islamic banks as reliable
performers over the period of crisis.
6. Conclusion
The purpose of this paper has been to provide an in-depth analysis using DEA of a consistent sample
of Islamic and conventional banks located in 18 countries over the period 2004 to 2009. The DEA
results provide evidence that there are no significant differences in gross efficiency (on average)
between conventional and Islamic banks. This result is in line with a number of previous studies (El-
Gamal and Inanoglu 2005; Mokhtar et al. 2006; Bader 2008; Hassan et al. 2009).
By using a meta-frontier analysis new to the banking literature we have been able to decompose
gross efficiency into two components: net efficiency provides a measure of managerial competence,
21
while type efficiency indicates the effect on efficiency of modus operandi, and by doing this we have
discovered that this result of no significant difference in efficiency between banking types conceals
some important distinctions. First, the type efficiency results provide strong evidence that Islamic
banking is less efficient, on average, than conventional banking. Second, net efficiency is significantly
higher, on average, in Islamic compared to conventional banks suggesting that the managers of
Islamic banks are particularly efficient given the rules by which they are constrained. Thus the
Islamic banking system is inefficient, but the managers of Islamic banks make up for this
disadvantage.
Finally, a second stage analysis investigates whether these distinctions (in terms of efficiency)
between Islamic and conventional banks are a consequence of banking environment or bank-level
characteristics. Thus we investigate the determinants of the components of efficiency as well as
gross efficiency in order to provide more information to managers and policy-makers regarding ways
of improving efficiency. The panel data analysis confirms the earlier results: the modus operandi of
Islamic banks leads to lower efficiency in these banks compared to conventional banks, but the
significantly superior efficiency of the managers of the Islamic banks more than makes up for the
disadvantages of banking system, and this is the case even after taking into account other factors.
Thus each type of banking could learn from the other. Islamic banks need to look at the
conventional banking system for ideas on how to make their own system more efficient. An obvious
possibility would be to standardize their portfolio of products as in conventional and the larger
Islamic banks.
Conventional banks need to examine the managerial side of Islamic banking for ideas on how to
improve the efficiency of their own managers. If there is little difference in the inherent ability or the
training of managers in each type of bank, then other aspects, such as the remuneration systems
and project viability might hold the key. Remuneration of managers in conventional banks comprises
a fixed element (salary) and variable components (shares, bonuses and other benefits). Most
recently, bonuses have been criticized for being attached to short-term goals. It is to be expected
that managers focus upon goals to which bonuses are attached, and these are usually quantity-
22
oriented (i.e. the number of loans) rather than quality-oriented (i.e. viability of the project). Here,
the long investment horizon of conventional financial products, which can be up to 20 or 30 years,
could be an impediment to the manager’s focus and judgment of the pecuniary worth. Bonuses are
not part of the Islamic banking culture15. It is also plausible that the shorter horizon of financial
projects in Islamic banks alongside the personalized services (i.e. custom-based contracts) force
managers to perform more efficiently, although we can find no evidence to support this contention.
There is clearly scope for further research into why the managers of Islamic banks appear to perform
more efficiently than those of conventional banks.
Are there other ways in which banks can improve their performance? Despite the importance of the
country level variables over which bank managers have no control, the second stage results suggest
some ways in which banks can operate more efficiently. Gross, net and type efficiency, for example,
can be boosted by increasing the size of banks. The relationship between efficiency and bank size is
quadratic, and most banks in the sample are operating on the downward sloping part of the
function. Managers should also take note of the beneficial effects on efficiency of prudent behaviour
in terms of holding reserves relative to non-performing loans.
Finally, in a period of financial turmoil, the banks in this sample have typically suffered falls in their
gross efficiency relative to the start of the period. The year 2008 had a particularly bad impact on
gross efficiency, but there has been a limited recovery in 2009. An examination of the components
of gross efficiency indicates, however, that the managers of Islamic banks have coped with the crisis
better than those of conventional banks, but that the gap between the conventional and Islamic
production possibility frontier has widened during this same period. This implies that the efficiency
advantage of the conventional over the Islamic operating system has increased during the period of
financial turmoil, suggesting that it is crucial for Islamic banks to shift to a more standardized process
if they are to improve their efficiency in the face of future crises.
15
For example, the Gulf Finance House in Bahrain does not give any form of performance related bonuses (Gulf Finance House Annual Report, 2010). The Dubai Islamic Bank gave bonuses that amounted to less than 0.1% of the total staff expenses in 2011 (Dubai Islamic Bank Annual Report, 2011).
23
Figure 1: DEA efficiency – derivation of gross, net and type efficiency
24
Figure 2: DEA efficiencies for the sample banks – mean values 2004 to 2009
Gross CRS efficiency
Net CRS efficiency
Type CRS efficiency
0.700.750.800.850.900.951.001.051.10
2004 2005 2006 2007 2008 2009
Conventional Islamic
0.700.750.800.850.900.951.001.051.10
2004 2005 2006 2007 2008 2009
Conventional Islamic
0.700.750.800.850.900.951.001.051.10
2004 2005 2006 2007 2008 2009
Conventional Islamic
25
Table 1: Islamic banking efficiency studies (frontier estimation approach)
Context Method Studies
No significant difference in efficiency between Islamic and conventional banks
21 countries: Algeria; Bahrain; Bangladesh; Brunei; Egypt; Gambia; Indonesia; Jordan; Kuwait; Lebanon; Malaysia; Pakistan; Qatar; Saudi Arabia; Senegal; Tunisia; Turkey; Yemen; Sudan; Iran; United Arab Emirates
DEA (Bader 2008)
11 countries: Egypt; Bahrain; Tunisia; Jordan; Kuwait; Lebanon; Qatar; Saudi Arabia; Turkey; United Arab Emirates; Yemen
DEA (Hassan et al. 2009)
5 countries: Bahrain; Kuwait; Qatar; UAE; Singapore DEA (Grigorian and Manole 2005)
Malaysia SFA (Mokhtar et al. 2006)
Turkey SFA (El-Gamal and Inanoglu 2005)
Islamic banks are significantly more efficient than conventional banks
GCC: Bahrain; Kuwait; Oman; Qatar; Saudi Arabia; UAE DEA (Al-Muharrami 2008)
Islamic banks are significantly less efficient than conventional banks
GCC: Bahrain; Kuwait; Oman; Qatar; Saudi Arabia; UAE SFA (Srairi 2010)
Malaysia DEA (Mokhtar et al. 2007; 2008)
Islamic banks have (significantly) lower efficiency than conventional banks and it is predominantly a consequence of modus operandi rather than managerial inadequacies
10 countries: Bahrain; Bangladesh; Indonesia; Iran; Jordan; Lebanon; Malaysia; Sudan; Tunisia; Yemen;
SFA (Abdul-Majid et al. 2010)
GCC: Bahrain; Kuwait; Oman; Qatar; Saudi Arabia; UAE DEA (Johnes et al. 2009)
Malaysia SFA (Abdul-Majid et al. 2008; 2011a; 2011b)
The efficiency of Islamic and conventional banks is compared, but the significance of any difference is not tested
Cross-country: Conventional banks in the USA and randomly drawn Islamic banks
DEA (Said 2012)
4 countries: Jordan; Egypt; Saudi Arabia; Bahrain SFA (Al-Jarrah and Molyneux 2005)
Bahrain SFA (Hussein 2004)
Studies of Islamic banks only
21 countries: Algeria; Bahamas; Bahrain; Bangladesh; Brunei; Egypt; Gambia; Indonesia; Iran; Jordan; Kuwait; Lebanon; Malaysia; Mauritania; Qatar; Saudi Arabia; Sudan; Tunisia; UAE; UK; Yemen
SFA DEA
(Hassan 2005; 2006)
16 countries: Bahrain; Bangladesh; Egypt; Gambia; Indonesia; Iran; Kuwait; Malaysia; Pakistan; Saudi Arabia; Turkey; UAE; Qatar; South Africa; Sudan; Yemen
DEA (Sufian 2009)
12 countries: Algeria; Bahrain; Egypt; Gambia; Indonesia; Jordan; Kuwait; Malaysia; Qatar; Sudan; UAE; Yemen
DEA (Yudistira 2004)
13 countries: Algeria; Bahrain; Bangladesh; Brunei; Egypt; Indonesia; Jordan; Kuwait; Malaysia; Qatar; Sudan; UAE; Yemen
DEA (Viverita et al. 2007)
14 countries: Algeria; Bahamas; Bangladesh; Bahrain; Brunei; Egypt; Jordan; Kuwait; Malaysia; Qatar; Saudi Arabia; Sudan; UAE; Yemen
DEA (Brown 2003)
GCC: Bahrain; Kuwait; Oman; Qatar; Saudi Arabia; UAE DEA (Mostafa 2007; El Moussawi and Obeid 2010; 2011; Mostafa 2011)
Malaysia DEA (Sufian 2006*; 2006/2007*; 2007*; Kamaruddin et al. 2008)
Sudan SFA (Hassan and Hussein 2003; Saaid et al. 2003; Saaid 2005)
*The study includes both fully-fledged Islamic banks and conventional banks with Islamic windows.
26
Table 2: Banks in the sample and population by country and type
Sample Banks Total Banks in Bankscope (2009) Total Pop 2009
Proportion Muslim
Country Islamic Conventional Total Islamic Conventional Total
Bahrain 9 6 15 19 10 29 1,169,578 0.81
Bangladesh 1 27 28 3 30 33 147,030,145 0.90
Brunei 0 1 1 1 1 2 391,837 0.67
Egypt 2 20 22 2 22 24 79,716,203 0.95
Indonesia 1 35 36 1 49 50 237,414,495 0.88
Jordan 2 11 13 3 11 14 5,915,000 0.98
Kuwait 3 6 9 9 7 16 2,646,286 0.95
Malaysia 2 21 23 17 48 65 27,949,395 0.60
Mauritania 1 2 3 1 8 9 3,377,630 0.99
Pakistan 3 16 19 9 29 38 170,494,367 0.96
Palestine 1 1 2 1 2 3 4,043,218 0.98
Qatar 2 5 7 5 7 12 1,597,765 0.78
Saudi Arabia 1 9 10 3 11 14 26,809,105 0.97
Sudan 5 1 6 12 15 27 42,478,309 0.71
Tunisia 1 9 10 1 17 18 10,439,600 1.00
Turkey 2 20 22 9 27 36 71,846,212 0.98
UAE 6 13 19 9 16 25 6,938,815 0.76
Yemen 3 4 7 4 4 8 23,328,214 0.99
Source: Bankscope; World Development Indicators; Global Development Finance
27
Table 3: Descriptive statistics for the DEA input and output variables
Conventional Islamic All
2004 Mean Median SD Mean Median SD Mean Median SD Deposits and short-term funding 4566 1167 7359 1697 478 3596 4060 1062 6928 Fixed assets 106 21 374 33 13 65 93 16 342 General and administrative expenses 156 29 607 40 19 71 135 26 533 Equity 1012 554 1065 693 521 540 956 550 999 Total loans 5109 3213 4123 3776 2811 3310 4874 3099 4018 Other earning assets 2329 435 4520 543 200 931 2014 377 4175 2005 Mean Median SD Mean Median SD Mean Median SD Deposits and short-term funding 4879 1362 7730 1878 652 3717 4349 1128 7271 Fixed assets 90 24 287 38 14 77 81 18 263 General and administrative expenses 144 31 479 51 26 80 128 30 437 Equity 1070 578 1127 747 552 652 1013 568 1065 Total loans 5468 3292 4641 3975 2872,90 3544 5205 3197 4497 Other earning assets 2425 567 4716 619 265 1013 2107 462 4354 2006 Mean Median SD Mean Median SD Mean Median SD Deposits and short-term funding 5353 1486 8386 2084 643 3908 4776 1358 7879 Fixed assets 88 25 276 64 14 184 84 22 262 General and administrative expenses 142 42 306 62 28 100 128 37 282 Equity 1116 605 1192 846 548 864 1068 598 1144 Total loans 5875 3491 5244 4034 2947 3126 5550 3345 4982 Other earning assets 2585 651 4836 885 274 1462 2285 523 4476 2007 Mean Median SD Mean Median SD Mean Median SD Deposits and short-term funding 6164 1780 9616 2524 912 4643 5522 1596 9042 Fixed assets 97 28 297 75 15 191 93 26 281 General and administrative expenses 168 44 400 74 30 114 152 41 368 Equity 1232 655 1431 964 606 1042 1185 652 1373 Total loans 6480 3595 6179 4389 3113 3756 6111 3443 5874 Other earning assets 2804 687 5305 996 342 1762 2485 614 4917 2008 Mean Median SD Mean Median SD Mean Median SD Deposits and short-term funding 5824 1612 9094 2697 1151 4863 5272 1562 8578 Fixed assets 87 32 232 84 20 216 87 31 229 General and administrative expenses 150 41 313 79 37 113 137 41 289 Equity 1147 631 1217 946 594 966 1111 621 1178 Total loans 6527 3562 6257 4579 3112 3958 6184 3423 5957 Other earning assets 2342 541 4311 961 318 1622 2098 507 4003
28
2009 Mean Median SD Mean Median SD Mean Median SD Deposits and short-term funding 7041 1738 11695 3337 1112 6272 6387 1634 11016 Fixed assets 103 37 265 105 22 283 104 34 268 General and administrative expenses 178 48 377 104 41 168 165 47 351 Equity 1402 666 1709 1083 622 1280 1346 662 1644 Total loans 7259 3560 7655 5081 3227 5136 6875 3520 7313 Other earning assets 3037 655 6173 1245 533 2165 2721 606 5713 All Years Mean Median SD Mean Median SD Mean Median SD Deposits and short-term funding 5638 1551 9113 2370 799 4584 5061 1362 8581 Fixed assets 95 28 291 66 15 186 90 25 276 General and administrative expenses 156 42 426 68 29 113 141 38 391 Equity 1163 615 1312 880 561 925 1113 601 1257 Total loans 6120 3453 5835 4306 2954 3850 5799 3338 5579 Other earning assets 2587 584 5012 875 313 1556 2285 518 4641 Note: All variables are reported in US $ millions at 2005 prices. The number of observations in each year is 45 Islamic banks and 210 conventional banks.
29
Table 4: Descriptive statistics for the second stage explanatory variables
Conventional Islamic All
2004 Mean Median SD n Mean Median SD n Mean Median SD n ASSETS 5.045 1.333 8.066 210 1.783 0.578 3.642 45 4.470 1.148 7.575 255
LOANLOSS/LOANS 7.577 4.692 8.209 208 6.366 3.765 9.175 32 7.415 4.615 8.334 240 LOANS/ASSETS 0.503 0.520 0.176 210 0.491 0.550 0.243 45 0.501 0.520 0.189 255
NETLOANS/ASSETS 0.506 0.518 0.166 210 0.483 0.548 0.237 45 0.502 0.523 0.180 255 HHI 0.142 0.111 0.079 210 0.199 0.185 0.110 45 0.152 0.111 0.088 255
MCAP 74.426 69.370 74.093 199 60.091 38.520 63.588 36 72.230 69.370 72.641 235 GDPGR 6.936 6.270 2.879 210 7.492 6.040 3.610 45 7.034 6.270 3.020 255
INF 8.212 8.550 3.734 210 9.866 9.150 4.839 45 8.504 8.550 3.991 255 GDPPC 6.970 1.250 11.048 210 13.058 6.342 14.064 45 8.044 2.200 11.836 255
2005 Mean Median SD n Mean Median SD n Mean Median SD n ASSETS 6.029 1.683 9.626 210 2.351 0.842 4.630 45 5.380 1.505 9.052 255
LOANLOSS/LOANS 6.550 3.559 7.730 209 3.683 3.146 2.872 34 6.148 3.517 7.313 243 LOANS/ASSETS 0.521 0.540 0.174 210 0.493 0.540 0.231 45 0.517 0.540 0.185 255
NETLOANS/ASSETS 0.525 0.545 0.164 210 0.493 0.542 0.231 45 0.520 0.545 0.177 255 HHI 0.134 0.101 0.073 210 0.188 0.168 0.106 45 0.144 0.104 0.082 255
MCAP 114.625 81.430 134.196 199 107.513 79.670 122.095 36 113.535 81.430 132.191 235 GDPGR 6.414 5.960 1.596 210 7.230 7.800 1.537 45 6.558 5.960 1.613 255
INF 9.736 7.030 6.086 210 12.473 11.130 6.278 45 10.219 7.080 6.196 255 GDPPC 7.248 1.304 11.326 210 13.641 6.786 14.456 45 8.376 2.326 12.154 255
2006 Mean Median SD n Mean Median SD n Mean Median SD n ASSETS 7.231 2.039 11.298 210 3.063 1.072 5.707 45 6.495 1.888 10.639 255
LOANLOSS/LOANS 6.049 3.181 7.404 208 4.023 3.155 3.770 37 5.743 3.162 7.010 245 LOANS/ASSETS 0.531 0.550 0.173 210 0.464 0.510 0.216 45 0.519 0.550 0.183 255
NETLOANS/ASSETS 0.533 0.554 0.165 210 0.463 0.514 0.214 45 0.521 0.547 0.176 255 HHI 0.135 0.096 0.082 210 0.183 0.162 0.102 45 0.143 0.104 0.088 255
MCAP 110.893 128.940 86.146 199 88.507 61.560 77.419 36 107.464 128.940 85.095 235 GDPGR 6.541 6.405 2.453 210 7.383 6.700 3.770 45 6.690 6.630 2.742 255
INF 9.896 9.490 4.780 210 11.280 10.390 4.975 45 10.140 10.390 4.834 255 GDPPC 7.592 1.359 11.803 209 14.538 7.162 15.092 44 8.800 2.625 12.681 253
30
2007 Mean Median SD n Mean Median SD n Mean Median SD n ASSETS 9.318 2.829 14.739 210 4.115 1.753 7.401 45 8.399 2.557 13.863 255
LOANLOSS/LOANS 5.461 3.056 6.432 207 4.353 3.018 3.922 39 5.285 3.042 6.110 246 LOANS/ASSETS 0.530 0.550 0.168 210 0.463 0.470 0.193 45 0.518 0.540 0.174 255
NETLOANS/ASSETS 0.532 0.550 0.160 210 0.463 0.469 0.193 45 0.520 0.540 0.168 255 HHI 0.133 0.100 0.080 210 0.173 0.155 0.096 45 0.140 0.101 0.084 255
MCAP 170.392 188.050 132.084 199 135.944 95.490 121.018 36 165.115 188.050 130.795 235 GDPGR 6.507 6.350 3.489 210 7.496 6.430 4.719 45 6.682 6.350 3.744 255
INF 8.271 6.790 4.249 210 8.616 7.540 5.319 45 8.332 6.790 4.446 255 GDPPC 8.105 1.427 12.906 209 15.656 7.403 16.545 44 9.419 2.727 13.871 253
2008 Mean Median SD n Mean Median SD n Mean Median SD n ASSETS 9.974 2.751 15.665 210 5.012 2.324 8.926 45 9.099 2.619 14.809 255
LOANLOSS/LOANS 5.177 2.932 5.966 206 5.101 2.930 4.815 40 5.165 2.932 5.786 246 LOANS/ASSETS 0.567 0.590 0.169 210 0.471 0.470 0.233 45 0.550 0.590 0.185 255
NETLOANS/ASSETS 0.571 0.594 0.155 210 0.472 0.470 0.233 45 0.554 0.589 0.175 255 HHI 0.133 0.100 0.083 210 0.167 0.137 0.100 45 0.139 0.101 0.087 255
MCAP 85.990 97.850 64.604 199 70.446 76.310 57.630 36 83.609 97.850 63.717 235 GDPGR 5.410 6.010 3.770 210 6.014 5.100 4.617 45 5.516 6.010 3.930 255
INF 13.686 12.220 4.532 210 15.283 16.110 4.571 45 13.968 12.220 4.571 255 GDPPC 8.527 1.495 13.931 209 16.556 7.359 17.872 44 9.923 2.729 14.966 253
2009 Mean Median SD n Mean Median SD n Mean Median SD n ASSETS 10.945 3.050 17.657 210 5.390 2.344 9.344 45 9.965 3.017 16.619 255
LOANLOSS/LOANS 5.918 3.913 6.110 196 7.906 5.067 11.619 39 6.248 4.011 7.320 235 LOANS/ASSETS 0.545 0.580 0.171 210 0.458 0.460 0.231 44 0.530 0.570 0.185 254
NETLOANS/ASSETS 0.550 0.579 0.155 210 0.458 0.459 0.231 44 0.534 0.570 0.173 254 HHI 0.137 0.105 0.085 210 0.175 0.150 0.103 45 0.144 0.105 0.089 255
MCAP 123.083 95.940 96.675 199 85.997 87.860 82.716 36 117.402 95.940 95.450 235 GDPGR 2.396 3.630 3.411 210 2.674 3.100 2.937 45 2.445 3.630 3.328 255
INF 3.443 6.520 10.172 210 1.473 5.150 10.681 45 3.095 6.520 10.270 255 GDPPC 8.456 1.543 13.731 209 16.765 6.929 17.725 44 9.901 2.727 14.805 253
All Years Mean Median SD n Mean Median SD n Mean Median SD n ASSETS 8.090 2.245 13.435 1260 3.619 1.275 7.004 270 7.301 1.941 12.656 1530
LOANLOSS/LOANS 6.126 3.510 7.067 1234 5.248 3.542 6.908 221 5.993 3.530 7.048 1455 LOANS/ASSETS 0.533 0.560 0.173 1260 0.473 0.510 0.223 269 0.522 0.550 0.184 1529
NETLOANS/ASSETS 0.536 0.559 0.162 1260 0.472 0.504 0.222 269 0.525 0.552 0.175 1529 HHI 0.136 0.101 0.080 1260 0.181 0.155 0.103 270 0.144 0.104 0.086 1530
MCAP 113.235 89.950 105.870 1194 91.416 69.815 93.375 216 109.893 89.950 104.319 1410 GDPGR 5.701 5.850 3.393 1260 6.381 6.180 4.051 270 5.821 5.930 3.526 1530
INF 8.874 8.550 6.712 1260 9.832 10.390 7.711 270 9.043 8.790 6.906 1530 GDPPC 7.815 1.543 12.496 1256 15.023 6.929 15.928 266 9.075 2.625 13.436 1522
Note: ASSETS is in US $ billions at 2005 prices; GDPPC is in US $ thousands at 2005 prices. The number of observations in each year varies because of data availability.
31
Table 5: Results of the DEA by year for all countries – mean and median values
GROSS NET TYPE
Conventional Islamic ALL Conventional Islamic ALL Conventional Islamic ALL
Pooled Mean 0.798 0.789 0.796 0.797 0.876 0.811 1.000 0.899 0.984 P value (t test) 0.295
0.000
**
0.000
**
Median 0.810 0.812 0.810 0.809 0.917 0.827 0.999 0.922 0.997 P value (MW) 0.716
0.000
**
0.000
**
P value (KS) 0.134
0.000**
0.000**
2004 Mean 0.850 0.842 0.849 0.852 0.909 0.862 0.998 0.927 0.986 P value (t test) 0.608 0.000
** 0.000
**
Median 0.875 0.870 0.872 0.875 0.952 0.886 1.000 0.944 1.000 P value (MW) 0.456 0.000
** 0.000
**
P value (KS) 0.490 0.000**
0.000**
2005 Mean 0.822 0.826 0.823 0.827 0.889 0.838 0.995 0.929 0.983 P value (t test) 0.802 0.000
** 0.000
**
Median 0.845 0.867 0.848 0.854 0.933 0.863 0.997 0.941 0.996 P value (MW) 0.689 0.000
** 0.000
**
P value (KS) 0.742 0.000**
0.000**
2006 Mean 0.781 0.768 0.779 0.795 0.816 0.799 0.982 0.939 0.974 P value (t test) 0.511 0.234 0.000
**
Median 0.797 0.801 0.798 0.809 0.853 0.817 0.987 0.935 0.984 P value (MW) 0.780 0.101 0.000
**
P value (KS) 0.363 0.015**
0.000**
2007 Mean 0.778 0.753 0.774 0.779 0.855 0.793 0.999 0.875 0.977 P value (t test) 0.300
0.000
** 0.000
**
Median 0.797 0.805 0.797 0.799 0.892 0.812 0.999 0.896 0.998 P value (MW) 0.360
0.000
** 0.000
**
P value (KS) 0.411 0.000**
0.000**
2008 Mean 0.777 0.772 0.777 0.735 0.887 0.762 1.063 0.868 1.028 P value (t test) 0.807 0.000
** 0.000
**
Median 0.779 0.806 0.784 0.723 0.947 0.745 1.050 0.871 1.031 P value (MW) 0.967 0.000
** 0.000
**
P value (KS) 0.816 0.000**
0.000**
2009 Mean 0.777 0.773 0.776 0.793 0.898 0.812 0.980 0.858 0.958 P value (t test) 0.825
0.000
** 0.000
**
Median 0.779 0.805 0.781 0.804 0.950 0.826 0.994 0.860 0.986 P value (MW) 0.965
0.000
** 0.000
**
P value (KS) 0.789 0.000**
0.000**
** = significant at 5% significance level; * = significant at 10% significance level; t test tests the null hypothesis that the means of the two samples are equal (equal variances are not assumed); MW (Mann Whitney U test) tests the null hypothesis that the two samples are drawn from the same distributions (against the alternative that their distributions differ in location); KS (Kolmogorov-Smirnov 2-sample test) tests the null hypothesis that the two samples are drawn from the same distributions (against the alternative that their distributions differ in location and shape)
32
Table 6: Second stage results
GROSS NET TYPE
coeff z P>|z| coeff z P>|z| coeff z P>|z| ISLAMIC 0.006 0.350 0.724 0.081 4.640 0.000 -0.069 -5.600 0.000
LIST -0.016 -1.570 0.116 -0.013 -1.280 0.201 -0.003 -0.960 0.335 ISLAMIC*LIST -0.028 -1.360 0.173 -0.018 -0.910 0.364 -0.033 -2.310 0.021
ASSETS -0.004 -4.730 0.000 -0.004 -4.760 0.000 0.000 -0.990 0.324 ASSETSSQ 0.000 5.340 0.000 0.000 5.270 0.000 0.000 2.320 0.021
LOANLOSS/LOANS 0.001 2.550 0.011 0.001 1.880 0.061 0.000 0.900 0.368 LOANS/ASSETS 0.425 5.830 0.000 0.373 9.030 0.000 0.080 5.020 0.000
NETLOANS/ASSETS -0.426 -5.320 0.000 -0.383 -7.510 0.000 -0.066 -3.520 0.000 HHI -0.117 -1.970 0.049 -0.108 -1.760 0.079 0.026 1.030 0.304
MCAP 0.000 -3.610 0.000 0.000 -4.060 0.000 0.000 -1.340 0.181 GDPGR 0.002 1.980 0.048 0.002 2.890 0.004 -0.001 -1.260 0.209
INF 0.000 -1.370 0.171 0.000 -1.010 0.315 0.000 -0.280 0.778 GDPPC 0.001 0.760 0.449 0.001 1.120 0.263 0.000 0.030 0.974
ASIA 0.036 2.950 0.003 0.032 2.730 0.006 0.008 1.800 0.071 GCC -0.075 -2.910 0.004 -0.077 -3.420 0.001 -0.001 -0.170 0.868
2005 -0.018 -4.660 0.000 -0.016 -4.100 0.000 -0.002 -1.240 0.216 2006 -0.059 -10.680 0.000 -0.046 -8.380 0.000 -0.016 -7.900 0.000 2007 -0.051 -6.570 0.000 -0.051 -6.860 0.000 0.002 1.340 0.180 2008 -0.058 -8.500 0.000 -0.103 -14.890 0.000 0.065 9.240 0.000 2009 -0.053 -6.970 0.000 -0.036 -4.900 0.000 -0.023 -6.020 0.000
ISLAMIC*2005 0.021 1.730 0.084 0.005 0.370 0.709 0.015 1.540 0.123 ISLAMIC*2006 -0.003 -0.240 0.809 -0.045 -2.670 0.008 0.039 2.750 0.006 ISLAMIC*2007 -0.009 -0.490 0.621 0.012 0.710 0.479 -0.035 -2.170 0.030 ISLAMIC*2008 0.011 0.700 0.483 0.095 5.630 0.000 -0.114 -6.650 0.000 ISLAMIC*2009 0.008 0.480 0.633 0.052 3.050 0.002 -0.050 -3.280 0.001
CONSTANT 0.877 40.220 0.000 0.878 41.800 0.000 0.992 108.870 0.000
No. of observations 1353 1353 1353 No. of groups 232 232 232
Overall R2
0.303 0.377 0.364
Wald 756.470 1302.320 594.160
Prob > 0.000 0.000 0.000
Notes: The model is estimated using bank random effects; standard errors are heteroscedasticity adjusted. Italics denote significant at 10% significance level.
33
REFERENCES
Abdul-Majid, M., N. G. Mohammed Nor and F. F. Said (2005a). Efficiencies of Islamic banks in Malaysia. International Conference on Islamic Banking and Finance. Bahrain.
Abdul-Majid, M., N. G. Mohammed Nor and F. F. Said (2005b). 'Efficiency of Islamic banks in Malaysia'. Islamic Finance and Economic Development. M. Iqbal and A. Ahmad (ed). New York, Palgrave Macmillan.
Abdul-Majid, M., D. S. Saal and G. Battisti (2008). 'The efficiency and productivity of Malaysian banks: an output distance function approach.' Aston Business School Research Paper RP 0815.
Abdul-Majid, M., D. S. Saal and G. Battisti (2010). 'Efficiency in Islamic and conventional banking: an international comparison.' Journal of Productivity Analysis 34(1): 25-43.
Abdul-Majid, M., D. S. Saal and G. Battisti (2011a). 'Efficiency and total factor productivity change of Malaysian commercial banks.' The Service Industries Journal 31(13): 2117-2143.
Abdul-Majid, M., D. S. Saal and G. Battisti (2011b). 'The impact of Islamic banking on the cost efficiency and productivity change of Malaysian commercial banks.' Applied Economics 43(16): 2033-3054.
Al-Jarrah, I. and P. Molyneux (2005). 'Efficiency in Arabian banking'. Islamic Perspectives on Wealth Creation. M. Iqbal and R. Wilson (ed). Edinburgh, Edinburgh University Press: pp97-117.
Al-Muharrami, S. (2008). 'An examination of technical, pure technical and scale efficiencies in GCC banking.' American Journal of Finance and Accounting 1(2): 152-166.
Alam, I. M. S. (2001). 'A nonparametric approach for assessing productivity dynamics of large US banks.' Journal of Money, Credit, and Banking 33(1): 121-139.
Alexakis, C. and A. Tsikouras (2009). 'Islamic finance: Regulatory framework challenges lying ahead.' International Journal of Islamic and Middle Eastern Finance and Management 2(2): 90-104.
Ariff, M. and L. Can (2008). 'Cost and profit efficiency of Chinese banks: a non-parametric analysis.' China Economic Review 19(2): 260-273.
Ariss, R. T. (2010). 'Competitive conditions in Islamic and conventional banking: A global perspective.' Review of Financial Economics 19: 101-108.
Arthur D Little Report (2009). 'Islamic finance comes of age; joint opportunities for Western and Arabic financial institutions.' Financial Services Viewpoint April.
Awdeh, A. and C. El Moussawi (2009). 'Bank efficiency and foreign ownership in the Lebanese banking sector.' Review of Middle East Economics and Finance 5(2): 1-22.
Bader, M. K. I. (2008). 'Cost, revenue, and profit efficiency of Islamic versus conventional banks: international evidence using data envelopment analysis.' Islamic Economic Studies 15(2): 23-76.
Barajas, A., R. Steiner and N. Salazar (1999). 'Interest spreads in banking in Colombia, 1974–96.' IMF Staff Papers 46: 196-.
Berger, A. N. and D. B. Humphrey (1997). 'Efficiency of financial institutions: international survey and directions for future research.' European Journal of Operational Research 98(2): 175-212.
Berger, A. N. and L. J. Mester (1997). 'Inside the black box: What explains differences in the efficiencies of financial institutions.' Journal of Banking and Finance 21(7): 895-947.
Bikker, J. A. and K. Haaf (2002). 'Competition, concentration and their relationship: An empirical analysis of the banking industry.' Journal of Banking and Finance 26(11): 2191-2214.
Brown, K. (2003). 'Islamic banking comparative analysis.' The Arab Bank Review 5(2): 43-50. Brown, K. and M. T. Skully (2002). 'International Studies in Comparative Banking: A Survey of Recent
Developments.' SSRN eLibrary. Busse, J. A., T. C. Green and K. Baks (2007). 'Fund Managers Who Take Big Bets: Skilled or
Overconfident.' SSRN eLibrary. Casu, B. and P. Molyneux (2003). 'A comparative study of efficiency in European banking.' Applied
Economics 35(17): 1865-1876.
34
Charnes, A., W. W. Cooper and E. Rhodes (1981). 'Evaluating program and managerial efficiency: an application of data envelopment analysis to program follow through.' Management Science 27(6): 668-697.
Charnes, A., Z. M. Huang and D. B. Sun (1990). 'Polyhedral cone-ratio DEA models with an illustrative application to larger commercial banks.' Journal of Econometrics 46(1-2): 73-91.
Chen, X., M. Skully and K. Brown (2005). 'Banking efficiency in China: application of DEA to pre- and post-deregulation eras: 1993-2000.' China Economic Review 16(3): 229-245.
Čihák, M. and H. Hesse (2010). 'Islamic banks and financial stability: An empirical analysis.' Journal of Financial Services Research 38: 95-113.
Coelli, T. J., D. S. P. Rao, C. J. O'Donnell and G. E. Battese (2005). An Introduction to Efficiency and Productivity Analysis. New York, Springer.
Dietsch, M. and A. Lozano-Vivas (2000). 'How the environment determines banking efficiency: A comparison between French and Spanish industries.' Journal of Banking and Finance 24(6): 985-1004.
Drake, L. and M. J. B. Hall (2003). 'Efficiency in Japanese banking: an empirical analysis.' Journal of Banking and Finance 27(5): 891-917.
Drake, L., M. J. B. Hall and R. Simper (2006). 'The impact of macroeconomic and regulatory factors on bank efficiency: a non-parametric analysis of Hong Kong's banking system.' Journal of Banking and Finance 30: 1443-1466.
Dusuki, A. W. (2008). 'Understanding the objectives of Islamic banking: a survey of stakeholders' perspectives.' International Journal of Islamic and Middle Eastern Finance and Management 1(2): 132-148.
El-Gamal, M. A. and H. Inanoglu (2005). 'Inefficiency and heterogeneity in Turkish banking: 1990-2000.' Journal of Applied Econometrics 20: 641-664.
El Moussawi, C. and H. Obeid (2010). 'Evaluating the productive efficiency of Islamic banking in GCC: A non parametric approach.' International Research Journal of Finance and Economics 53: 178-190.
El Moussawi, C. and H. Obeid (2011). 'Evaluating the productive efficiency of Islamic banking in GCC: A non-parametric approach.' International Management Review 7(1): 10-.
Grigorian, D. A. and V. Manole (2005). 'A Cross-Country Nonparametric Analysis of Bahrain’s Banking System.' IMF Working Paper WP/05/117. International Monetary Fund, Washington DC.
Hasan, M. and J. Dridi (2010). 'The effects of the global crisis on Islamic and conventional banks: A comparative study.' IMF Working Paper WP/10/201. Interntional Monetary Fund, Washington DC.
Hasan, Z. (2005). 'Evaluation of Islamic banking performance: on the current use of econometrics models.' Munich Personal RePEc Archive 7272.
Hassan, M. K. (2005). 'The cost, profit and X-efficiency of Islamic banks.' Paper presented at 12th ERF Annual Conference.
Hassan, M. K. (2006). 'The x-efficiency in Islamic banks.' Islamic Economic Studies 12(2): 49-78. Hassan, M. K. and K. A. Hussein (2003). 'Static and dynamic efficiency in the Sudanese banking
system.' Review of Islamic Economics 14: 5-48. Hassan, T., S. Mohamad and M. K. I. Bader (2009). 'Efficiency of conventional versus Islamic banks:
evidence from the Middle East.' International Journal of Islamic and Middle Eastern Finance and Management 2(1): 46-65.
Ho, C.-T. and D.-S. Zhu (2004). 'Performance measurement of Taiwan's commercial banks.' International Journal of Productivity and Performance Management 53(5/6): 425-434.
Hussein, K. A. (2004). 'Banking efficiency in Bahrain: Islamic versus conventional banks.' Islamic Development Bank, Islamic Research and Training Institute Research Paper 68. Islamic Development Bank, Islamic Research and Training Institute, Jeddah.
Iqbal, M., A. Ahmad and T. Khan (1998). 'Challenges facing Islamic banking.' Islamic Research and Training Institute, Islamic Development Bank, Occasional Paper No. 1. Islamic Research and Training Institute, Islamic Development Bank.
35
Jackson, P. M. and M. D. Fethi (2000). 'Evaluating the technical efficiency of Turkish commercial banks: an application of DEA and Tobit analysis.' Efficiency and Productivity Research Unit. University of Leicester.
Johnes, J., M. Izzeldin and V. Pappas (2009). 'The efficiency of Islamic and conventional banks in the Gulf Cooperation Council (GCC) countries: An analysis using financial ratios and data envelopment analysis.' LUMS Working Papers Series 2009/023. Lancaster University Management School.
Kamaruddin, B. H., M. S. Safa and R. Mohd (2008). 'Assessing the production efficiency of Islamic banks and conventional bank Islamic windows in Malaysia.' International Journal of Business and Management Research 1(1): 31-48.
Khan, F. (2010). 'How 'Islamic' is Islamic banking.' Journal of Economic Behavior and Organization 76: 805-820.
Koutsomanoli-Filippaki, A., D. Margaritis and C. Staikouras (2009). 'Efficiency and productivity growth in the banking industry of Central and Eastern Europe.' Journal of Banking and Finance 33(3): 557-567.
Lozano-Vivas, A. and F. Pasiouras (2010). 'The impact of non-traditional activities on the estimation of bank efficiency: International evidence.' Journal of Banking and Finance 34(7): 1436-1449.
Lozano-Vivas, A., J. T. Pastor and J. M. Pastor (2002). 'An efficiency comparison of European banking systems operating under different environmental conditions.' Journal of Productivity Analysis 18: 59-77.
Majumdar, S. K. (1995). 'X-efficiency in emerging competitive markets: The case of US telecommunications.' Journal of Economic Behavior and Organization 26: 129-144.
Matthews, K. and M. Ismail (2006). 'Efficiency and productivity growth of domestic and foreign commercial banks in Malaysia.' Cardiff Economics Working Papers E2006/2: 23pp. Cardiff University, Cardiff.
Miller, S. M. and A. G. Noulas (1996). 'The technical efficiency of large bank production.' Journal of Banking and Finance 20(3): 495-509.
Miller, S. M. and A. G. Noulas (1997). 'Portfolio mix and large-bank probability in the USA.' Applied Economics 29(4): 505-512.
Mokhtar, H. S. A., N. Abdullah and S. M. Al-Habshi (2006). 'Efficiency of Islamic banking in Malaysia: A stochastic frontier approach.' Journal of Economics Cooperation 27(2): 37-70.
Mokhtar, H. S. A., N. Abdullah and S. M. Alhabshi (2007). 'Technical and cost efficiency of Islamic banking in Malaysia.' Review of Islamic Economics 11(1): 5-40.
Mokhtar, H. S. A., N. Abdullah and S. M. Alhabshi (2008). 'Efficiency and competition of Islamic banking in Malaysia.' Humanomics 24(1): 28-48.
Mostafa, M. (2007). 'Modeling the efficiency of GCC banks: a data envelopment analysis approach.' International Journal of Productivity and Performance Management 56(7): 623-643.
Mostafa, M. (2011). 'Modeling Islamic banks' efficiency: A non-parametric frontier approach.' International Journal of Islamic and Middle Eastern Finance and Management 4(1): 7-29.
Pasiouras, F. (2008). 'Estimating the technical and scale efficiency of Greek commercial banks: the impact of credit risk, off-balance sheet activites, and international operations.' Research in International Business and Finance 22(3): 301-318.
Pellegrina, L. D. (2008). 'Capital adequacy ratios, efficiency and governance: a comparison between Islamic and Western banks.' Working Paper. Centro Paolo Baffi, Bocconi University, Milan.
Rokhim, G. and R. Rokhim (2011). 'The stability comparison between Islamic banks and conventional banks: Evidence in Indonesia ' 8th International Conference on Islamic Economics and Finance. Qatar National Convention Center, Doha, Qatar.
Saaid, A.-e. E. (2005). 'Allocative and technical inefficiency in Sudanese Islamic banks: An empirical investigation'. Islamic Perspectives on Wealth Creation. M. Iqbal and R. Wilson (ed). Edinburgh, Edinburgh University Press: pp142-154.
Saaid, A.-E. E., S. A. Rosly, M. H. Ibrahim and N. Abdullah (2003). 'The X-efficiency of the Sudanese Islamic banks.' IIUM Journal of Economics and Management 11(2): 123-141.
36
Said, A. (2012). 'Comparing the change in efficiency of the Western and Islamic banking systems.' Journal of Money, Investment and Banking 23: 149-180.
Shahid, H., R. Ur Rehman, G. S. K. Niazi and A. Raoof (2010). 'Efficiencies comparison of Islamic and conventional banks of Pakistan.' International Research Journal of Finance and Economics 49: 24-42.
Simar, L. and P. W. Wilson (2008). 'Statistical inference in nonparametric frontier models: Recent developments and perspectives'. The Measurement of Productive Efficiency. H. O. Fried, C. A. K. Lovell and S. S. Schmidt (ed). Oxford, Oxford University Press.
Srairi, S. A. (2010). 'Cost and profit efficiency of conventional and Islamic banks in GCC countries.' Journal of Productivity Analysis 34(1): 45-62.
Staikouras, C., E. Mamatzakis and A. Koutsomanoli-Filippaki (2008). 'Cost efficiency of the banking industry in the South Eastern European region.' Journal of International Financial Markets, Institutions and Money 18(5): 483-497.
Sturm, J.-E. and B. Williams (2004). 'Foreign bank entry, deregulation and banks efficiency: Lessons from the Australian experience.' Journal of Banking and Finance 28(7): 1775-1799.
Sufian, F. (2006). 'The efficiency of the Islamic banking industry in Malaysia: Foreign vs domestic banks.' Review of Islamic Economics 10(2): 27-53.
Sufian, F. (2006/2007). 'The efficiency of Islamic banking industry: a non-parametric analysis with non-discretionary input variable.' Islamic Economic Studies 14(1&2): 53-87.
Sufian, F. (2007). 'The efficiency of Islamic banking industry in Malaysia: foreign versus domestic banks.' Humanomics 23(3): 174-192.
Sufian, F. (2009). 'The determinants of Islamic banks' efficiency changes: Empirical evidence from the MENA and Asian banking sectors.' International Journal of Islamic and Middle Eastern Finance and Management 2(2): 120-138.
Viverita, V., K. Brown and M. Skully (2007). 'Efficiency analysis of Islamic banks in Africa, Asia and the Middle East.' Review of Islamic Economics 11(2): 5-16.
Willison, B. (2009). 'Technology trends in Islamic investment banking.' Islamic Finance News 6(19). Yılmaz , D. (2009). Islamic finance - during and after the global financial crisis Islamic finance - during
and after the global financial crisis Istanbul. Yudistira, D. (2004). 'Efficiency in Islamic banking: an empirical analysis of eighteen banks.' Islamic
Economic Studies 12(1): 1-19.