Embed Size (px)
Citation preview
Eastern Illinois UniversityThe Keep
Masters Theses Student Theses & Publications
1991
A Comparison of Personality Traits of FemaleInterscholastic Athletes and Female IntercollegiateAthletes Involved in Basketball and SoftballKatheryn M. MyersEastern Illinois UniversityThis research is a product of the graduate program in Physical Education at Eastern Illinois University. Findout more about the program.
This is brought to you for free and open access by the Student Theses & Publications at The Keep. It has been accepted for inclusion in Masters Thesesby an authorized administrator of The Keep. For more information, please contact [email protected].
Recommended CitationMyers, Katheryn M., "A Comparison of Personality Traits of Female Interscholastic Athletes and Female Intercollegiate AthletesInvolved in Basketball and Softball" (1991). Masters Theses. 2245.https://thekeep.eiu.edu/theses/2245
THESIS REPRODUCTION CERTIFICATE
TO: Graduate Degree Candidates who have written fo.rmal theses.
SUllJECT: Permiseion to reproduce theses.
The University Library is receiving a number of requests from other institutions asking permission to reprodl,lce dissertations for inclusion in their library holdings. .Although no copyright l~ws are involved, we feel that professi(>nal c::ou.rtesy demands that permission be obtained frt;>n:i the author before we allow theses to be ~opied.
Please eign one of the following etatements:
Booth Library of Eastern Illinoh University has my p~rmission to lend my thesis to a reputable college or university for the purpose of copying it for inclusion in that institution's library o.r research holdings.
Date Author
I respectfully request Booth Library of Ea•tern Illinois University not
allow my thesis be reprQduced because -----·---------
Date Author
m
A Comparison of Personality Traits of Female
Interscholastic Athletes and Female Intercollegiate
Athletes Involved in Basketball ·and Softball (llTLE)
BY
Katheryn M. Myers
THESIS
SUBMITTED IN PARTIAL FULFILIMENT OF THE REQUIREMENTS FOR THE DEGREE OF
Master of Science
IN THE GRADUATE SCHOOL, EASTERN ILLINOIS UNIVERSITY CHARLESTON, ILUNOIS
1991 YEAR
I HEREBY RECOMMEND THIS THESIS BE ACCEPTED AS FULFILLING THIS PART OF THE GRADUATE DEGREE CITED ABOVE
<?-!- 11 DATE
£-/-9/ DATE
A Comparison of Personality Traits of Female
Interscholastic Athletes and Female Intercollegiate
Athletes Involved in Basketball and Softball
By
Katheryn M. Myers
ABSTRACT OF THESIS
Submitted in partial fulfillment
of the requirements for the degree of
MASTER OF SCIENCE
in Physical Education at the Graduate School of
Eastern Illinois University
Charleston, Illinois
July, 1991
ABSTRACT
The purpose of this study was to compare
personality traits of female high school athletes to
female collegiate athletes.
Eighty female athletes participated in the study.
Forty-two of them competed at the high school.level and
thirty-eight participated at the college level. The
high school subjects came from either Arcola,
Casey/Westfield, or Charleston High School. The
college athletes came from either Eastern Illinois
University or Illinois State University. All athletes
participated in either softball or basketball.
The Sixteen Personality Factor Questionnaire was
administered to each of the subjects. Following
Cattell's recommendations, raw scores were used for
statistical analysis. Form A answer sheets were hand
scored by the investigator using the respective scoring
keys provided with the test. Results were then totaled
and values for each of the sixteen traits were assigned
to each subject.
The SPSS (release 4) statistical package was used
to calculate the mean scores, standard deviations,
multivariate analysis of variance, and discriminant
analysis. A .05 level of sifnificance was selected to
determine whether the groups differed significantly.
The multivariate analysis of variance showed that
there was a significant difference on two of the
factors, intelligence and emotional control. The
discriminant analysis showed that five personality
factors best discriminate between the two groups.
These factors are:
(a) intelligence,
(b) conscientiousness,
(c) suspiciousness,
(d) experimentalism, and
(e) emotional control.
Therefore, the study concluded that there is a
personality difference that exists among athletes who
participate at the high school level and athletes who
participate at the college level.
DEDICATION
This study is dedicated to the two most important
people in my life, my parents, George and Mary Myers.
Without all of their support throughout my college
career, I might not be where I am today. They gave me
guidance when it was needed and supported my final
decisions. For those reasons, I dedicate this paper to
them and thank them for all of their love and support.
ACKNOWLEDGMENTS
The writer wishes to express sincere appreciation
to Dr. Deborah Wolf for her guidance and direction in
the completion of the study.
Appreciation is also extended to Dr. Phyllis
Croisant for her help in the statistical analysis
portion, to Dr. Russel Fischer for his help in the
preparation of the study, and to Dr. Robert Saltmarsh
for his help with the psychological aspect of the
study.
The writer also wishes to thank the selected
students at all the participating high schools and
universities for allowing themselves to be subjects in
the study, as well as, the coaches for allowing me to
test their athletes.
LIST OF TABLES
LIST OF FIGURES
Chapter
TABLE OF CONTENTS
i
ii
1. INTRODUCTION ................................ 1
Purpose of the Study ........................ 2
Importance of the Study ..................... 3
Hypotheses .................................. 5
Limitation .................................. 6
Delimitations ............................... 6
Assumptions ................................. 7
Definitions ................................. 7
2. REVIEW OF RELATED LITERATURE ............... 10
Related to High School Athletes ............ 11
Related to High School Team ................ 12 Sport Athletes
Related to Both High School Athletes ....... 14 and Team Sport Athletes
Related to College Athletes ................ 15
Related to College Team Sport Athletes ..... 18
Related to Both College Athletes and ....... 19 Team Sport Athletes
Related to High School and College ....... ~.23
Summary .................................... 23
3 . METHOD ..................................... 25
Subjects ................................... 25
The Personality Test ....................... 29
Testing Procedure .......................... 35
Statistical Procedure ...................... 36
Statistical Tools .......................... 37
4. ANALYSIS OF DATA ........................... 39
Presentation of Finding .................... 39
Analysis of Mean Sten Scores for the ....... 40 High School Softball and Basketball Groups
Analysis of Mean Sten Scores for the ....... 46 College Softball and Basketball Groups
Analysis of Mean Sten Scores for the ....... 51 High School and College Athletic Groups
Multivariate Analysis of Variance Between .. 57 the High School and College Level Athletes
Discriminant Analysis Between the High ..... 59 School and College Level Athletes
Discussion of Data ......................... 59
5. SUMMARY, CONCLUSIONS, AND RECOMMENDATION ... 65
Conclusions ................................ 66
Recommendations ............................ 67
REFERENCES ........................................ 69
APPENDICES ........................................ 7 4
A. Detailed Description of the ................ 75 Sixteen Factors
B. Answers to Personal Information ............ 83
C. Consent Forms .............................. 87
D. Raw Score .................................. 90
E. Insructions Sent ........................... 98
LIST OF TABLE
Table Page
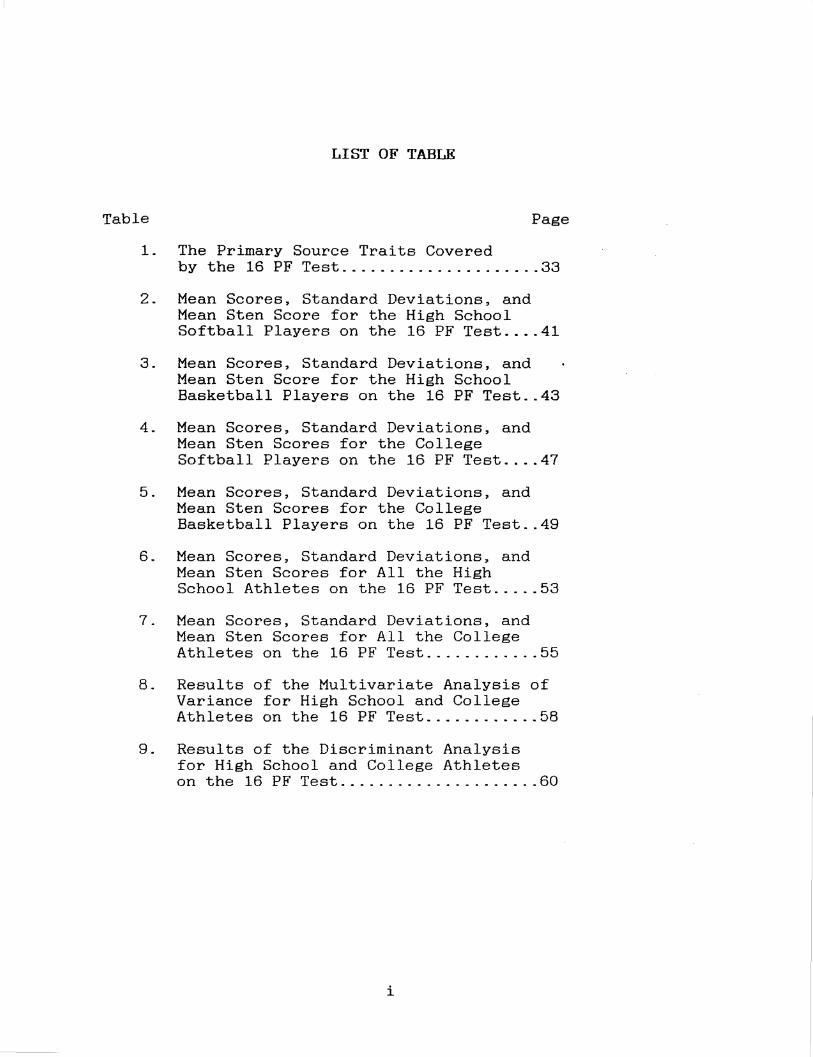
1. The Primary Source Traits Covered by the 16 PF Test ______________ ----_ .. 33
2. Mean Scores, Standard Deviations, and Mean Sten Score for the High School Softball Players on the 16 PF Test .... 41
3. Mean Scores, Standard Deviations, and Mean Sten Score for the High School Basketball Players on the 16 PF Test .. 43
4. Mean Scores, Standard Deviations, and Mean Sten Scores for the College Softball Players on the 16 PF Test .... 47
5. Mean Scores, Standard Deviations, and Mean Sten Scores for the College Basketball Players on the 16 PF Test .. 49
6. Mean Scores, Standard Deviations, and Mean Sten Scores for All the High School Athletes on the 16 PF Test ..... 53
7. Mean Scores, Standard Deviations, and Mean Sten Scores for All the College Athletes on the 16 PF Test .. ___ ----_ .. 55
8. Results of the Multivariate Analysis of Variance for High School and College Athletes on the 16 PF Test ............ 58
9. Results of the Discriminant Analysis for High School and College Athletes on the 16 PF Test ..................... 60
i
LIST OF FIGURES
Figure Page
1. Profile of Mean Sten Scores for the High School Softball Players on the 16 PF Test ................ 42
2. Profile of Mean Sten Scores for the High School Basketball Players on the 16 PF Test ................ 44
3. Profile of Mean Sten Scores for the College Softball Players on the 16 PF Test ................ 48
4. Profile of Mean Sten Scores for the College Basketball Players on the 16 PF Test ................ 50
5. Profile of Mean Sten Scores for All of the High School Athletes on the 16 PF Test ................ 54
6. Profile of Mean Sten Scores for All of the College Athletes on the 16 PF Test ................ 56
ii
CHAPTER 1
Introduction
Prior to the passage of Title IX in 1972, not many
researchers investigated characteristics of female
athletes. Title IX was a victory for girls and women
who were interested in athletics. They now had
increased available opportunities to participate in
athletics. "Although only four percent of the total
text of the final regulations of Title IX dealt with
athletics or sport, the provisions on sport created the
greatest controversy and litigation -- resulting in a
transformation that so altered the social order of
girls' and women's sport that the impact is still with
us today" (Greendorfer, 1989, p. 32). Participation of
girls and women in athletics has increased dramatically
(Radar, 1983). Research concerning the personality
characteristics exhibited by women who participate in
various types of competition is scarce. O'Connor and
Webb (1976) wrote that research projects concerning the
personalities of female athletes have been neglected,
in comparison to the number of studies performed using
male competitors as subjects. Now that women are
involved in athletics, it is important to include
female athletes in present research. Fuoss and
Troppmann (1981, pp. 176-177) stated that, "if a coach
is able to recognize the different personality traits
of the members of the team, he or she will be able to
effectively use the varied approaches available to him
or her."
Personality research is typically meant to answer
one of two questions: What influence does personality
have on sport behavior or how does sport behavior
effect the personality (Gill, 1986)? Answering these
questions will help coaches, as well as the interested
population, to better understand that there are
individual differences that exist among female athletes
that may tend to alter the athlete's level of
performance. The present research is focused on female
athletes involved in basketball and softball at both
the high school and collegiate levels.
Purpose of the Study
The purpose of this research was to identify and
compare the personality traits in female
2
interscholastic athletes and female intercollegiate
athletes who participate in basketball and softball.
Importance of the Study
In the past many coaches have focused on the
physiological aspects of conditioning in training the
athlete. However, researchers in the area of sport
psychology have found that personality plays a
significant role in athletic performance and
achievement. The significance of this study lies in
the fact that it will be one of the few studies
completed in recent years which pertains to the
personality traits of female athletes. This
investigation is intended to help coaches to better
understand what motivates his or her players so that
the coach can use this knowledge to obtain optimal
performance from the athletes.
Coaches today may find it beneficial to complete
personality profiles on their players to better
understand their true persona. Basketball and softball
are the women's sports that are represented in this
study. In the words of Reuban Frost (1971, p. 169):
3
The study of personality traits and
their relationship to sports can assist
the coach and teacher in the selection
of players, in the guidance of those who
seek help in choosing a sport, in teaching
effectively, and in understanding the behavior
of those who come under their leadership (p. 159).
There are some coaches who would simply want to become
well acquainted with their athletes' personality traits
and characteristics in order to maintain a stable
relationship with them and promote cohesion among the
team. "To be truly a suc/ess, the coach needs to
consider the feelings of ~er players, to show a sincere
interest in the welfare of her players, and to
recognize the worth of her athletes as individuals"
(Neal and Tutko, 1975, p. 160). Once the coach has
distinguished the differences that appear among the
players on the team, each athlete can be handled in a
way that the coach feels is in the best interests of
the team and the individual. This will develop a
cohesiveness within the team, and produce a
coach/athlete relationship which will promote a winning
attitude and help make for a successful season.
4
An aspiring coach who wishes to start at the high
school level and establish him or herself before moving
to the college level, may find it useful to understand
age differences, personality characteristics, and
differences that may effect performances as the athlete
matures from high school to college. Does a step up to
a new and more competitive class of competition alter
one's personality? Are athletes with certain
characteristics more likely to succeed at the college
level? Since no literature was found that made a
comparison between high school and college female
athletes, the results of this study may produce answers
to these questions.
Hvpotheses
Null: There are no differences in the personality
traits of female interscholastic athletes and female
intercollegiate athletes participating in the sports of
basketball and softball as measured by the Sixteen
Personality Factor Questionnaire.
Alternate: There is a difference in the
personality traits of female interscholastic athletes
and female intercollegiate athletes involved in the
5
sports of basketball and softball as measured by the
Sixteen Personality Factor Questionnaire.
Limitation
Different administrators were used for the
Illinois State University subjects. The Eastern
Illinois University Softball players had to read the
instructions themselves. This difference in
administration may have influenced the responses given
on the test.
Delimitations
1. The forty two girls selected for the high school
level data were from Illinois High Schools.
2. The high school subjects selected for the study
ranged from grades nine through twelve. Eleven of them
were 15 years of age.
3. The forty six women selected for the college level
data were from Illinois Universities.
4. The players involved were limited to basketball and
softball.
5. All eighty-eight participants in this study were
contacted to be used as part of this research; they do
6
not represent a random sample.
6. Outside factors such as socio-economic status,
cultural background, participation in activities other
than the sports mentioned, and academic achievement
were not considered in this study.
Assumptions
1. The Sixteen Personality Factor Questionnaire, the
instrument used in this study, is a valid and reliable
source.
2. All of the subjects answered in an honest and
forthright manner to protect their integrity.
Definitions
The following terms have been defined as they were
used in this study (Best, 1980):
Athlete:
Any person who participates in an interscholastic
or intercollegiate athletic program.
Personality:
Personality is the combined distinctive individual
qualities a person possesses which will permit a
prediction of how he or she will respond in a given
7
situation.
Trait:
A trait is considered as a basic unit in
describing personality. It is a relatively permanent
feature of behavior that distinguishes one individual
from another.
From the Cattell's Sixteen Personality Factor
Questionnaire, Raymond Cattell (IPAT Staff, 1986)
designed the following sixteen personality factors:
Factor A: outgoing vs. reserved (affectothymia -
sizothymia)
Factor B: more intelligent vs. less intelligent
(scholastic ability)
Factor C: emotionally stable vs. affected by feelings
(ego strength)
Factor E: assertive vs. humble (dominance -
submissiveness)
Factor F: happy-go-lucky vs. sober (surgency -
desurgency)
Factor G: conscientious vs. expedient (superego
strength)
Factor H: venturesome vs. shy (parmia - threctia)
Factor I: tender minded vs. tough minded (premsia -
8
harria)
Factor L: suspicious vs. trusting (pretension -
alaxia)
Factor M: imaginative vs. practical (autia -
praxernia)
Factor N: shrewd vs. forthright (shrewdness ,
alertness)
Factor 0: apprehensive vs. self-assured (guilt
proneness - untroubled adequacy)
Factor Ql: experimenting vs. conservative (radicalism
- conservatism)
Factor Q2: self-sufficient vs. group oriented (self
sufficiency - group adherence)
Factor Q3: controlled vs. undisciplined self conflict
(high self concept contol- low integration)
Factor Q4: tense vs. relaxed (high ergic tension -low
ergic tension)
A further explanation of these factors is provided
in appendix A.
9
CHAPTER 2
REVIEW OF RELATED LITERATURE
Research involving the personality traits of
female athletes is very scarce, but worse yet, such
research involving female athletes in high school is
almost nonexistent. Therefore, much of the related
literature mentioned within this chapter is suspect due
to the lack of recent studies in the area of personali
ty research. References frequently mention individual
versus team competitors. In these cases, it is impor
tant that one focus upon the emphasis on team sport.
Other studies were conducted using the athlete versus
non-athlete approach. Once again, one must focus on
the aspect of the research concerning the athlete.
It is also important that one understands the
change that occured in womens athletics with the pas
sage of Title IX. The programs that exist today are
quite different than the programs that existed prior to
1972. Since then programs have developed an extremely
different emphasis. These programs stress not only
enjoyment, but winning. At the college level, the
introduction of scholarships for female athletes has
made sport more competitive. This change in emphasis,
necessitates current research in the area of personali
ty of athletes.
The review of related literature in this chapter
has been organized to present findings which pertain to
the following seven categories: 1) high school ath
letes, 2) high school team sport athletes, 3)·both high
school athletes and team sport athletes, 4) college
athletes, 5) college team sport athletes, 6) both
college athletes and team sport athletes, and
7) high school and college athletes.
High School Athletes vs. Non-Athletes
The first segment of literature that is discussed
in this chapter is focused on high school athletes. In
the studies mentioned below, the research concentrated
on comparing the personality traits of athletes and
non-athletes at the high school level.
One of the earliest projects recorded using high
school athletes was done by Bell (1955). She tried to
determine differences between girls who participated in
interscholastic league basketball compared to the women
who did not participate. There were significant dif
ferences among the personality traits of these groups.
She found that the girl athletes were less feminine,
11
more impulsive, experienced a higher degree of social
pressure, and developed a greater self-acceptance.
Cooper (1969) performed research on high school
level athletes. He portayed athletes as more outgoing,
socially confident and aggressive than non-athletes.
He also found that they were more highly developed
socially, higher in prestige and self-confidence,
stronger competitors, less anxious, more emotionally
stable, less compulsive, and exhibiting a greater
tolerance for pain.
Whiting, Hardman, Hendry, and Jones (1973) re
viewed research to describe the personality traits
associated with sport participation. The studies
reviewed utilized the Sixteen Personality Factor Ques
tionnaire. They found consistently high scores for
athletes on traits of intelligence, dominance, enthusi
asm, tension, jealousy, instability, shyness and low
super-ego strength.
High School Team Sport and Individual Sport Athletes
Some studies focus on comparing the traits of
athletes involved in team sport to those athletes
involved in individual sport competition. These stud-
12
ies are also suspect because little personality re
search has been done in recent years.
In a study designed to compare the personalities
of sports groups, Moore (1970) selected high school
individual and team sport participants. Individual
sport participants scored higher on ego strength,
superego coasthenia, and guilt proneness than team and
combined sport performers. The team sport group had
the least amount of emotional stability, liked group
actions, showed insecurity, and was the least self
sufficient. This group also displayed some degree of
shyness and timidity as compared to the individual
sport group.
Vanek and Cratty (1970) have summarized their
findings by defining certain types of sport activity
and the traits that are chacteristic of each activity.
Average or above average intelligence, self-discipline,
and strategical thinking denote a team sport partici
pant.
Ballinghoff (1973) studied female high school
varsity athletes in three categories: team sports,
individual sports, and team and individual sports. Her
results indicated that more similarities than differ-
13
ences existed between the three groups. However, the
individual sport group was shown to be more anxious and
demanding than the other two groups.
Combining Both High School Athletes
and Team Sport Athletes
Niblock (1960) investigated the personality dif
ferences between female athletes and non-athletes at
the high school level. She tested 46 female subjects
from McNally High School and divided them into four
subgrouops: individual, team, individual - team, and
non-athletes. She found that the athletes were more
energetic, enthusiastic, and efficient in their ac
tions, as well as exhibiting stronger leadership ten
dencies. They were also more extroverted and optimis
tic. When comparing sport groups, the individual and
team - individual groups scored significantly higher on
ascendancy or domination than the team or nonpartici
pant groups.
In another study, Shafor (1971) conducted research
to determine personality trait differences in female
high school subjects. His conclusions indicated a
higher level of intelligence in team sport participants
14
that in non-athletes. He also noted that non-athletes
were more sophisticated and self sufficient than both
team and individual sport participants. Team sport
participants were found to be more trusting, practical,
and group dependent than the individual sport groups.
The female athletes, as a group, differed significantly
from the non-athletes in that they were more intelli
gent, trusting, naive, and group dependent.
College Athletes vs. Non-Athletes
Some studies examine collegiate athlets versus
non-athletes.
In a similar study, Ogilivie (1967) compared 20
highly successful female college swimmers. He found
that the athletes showed high needs for affiliation,
for planning ahead, were more concerned with details,
highly impulsive, acted without regard to the conse
quences, had a need for a physical outlet, punished
themselves, had quilt feelings, and desired to be on
top.
Mushier (1970) studied females in competitive
lacrosse. Subjects for his studies either played at
the college level, for an association, or at the na-
15
tional level. He found that the total group was char
acterized as significantly more reserved, intelligent,
assertive, happy-go-lucky, tough-minded, and experi
menting than the norms established for the 16 PF Test.
Chadwick (1972) administered the Sixteen Personal
ity Factor Questionnaire to female athletes aRd non
athletes at the college level. He discovered that non
athletes possessed more intelligence than athletes. He
also found that athletes were significantly more tough
minded, practical, extroverted, group dependent, and
subdued than non-athletes.
In another study, Marks (1972) selected 40 women
from the 102 women who participated on one of the ten
varsity athletic teams at Ithaca College. These ath
letes significantly differed from the national norm on
four of the 16 primary personality factors. The inves
tigator found that the athletes tended to be more
assertive, aggressive, stubborn, and competitive (Fac
tor E); more suspicious, self opinionated, and hard to
fool (Factor L); more experimenting, liberal, analyti
cal, and free thinking (Factor Ql); and more controll
ed, socially precise, and following self image (Factor
Q3) than the national norm.
16
In a very simple study, Rusch (1972) examined the
personality characteristics of female athletes and non
athletes at the college level. His research revealed
that non-athletes were more happy-go-lucky and more
tender-minded than athletes.
Best (1980) compared personality traits of ath
letes and non-athletes at John Brown University. This
is a private Chistian school with a student population
of around 800. They are an NAIA school. Best tested a
total of 35 women, using Cattell's Sixteen Personality
Factor Questionnaire: seven from volleyball, seven
from tennis, seven from basketball, seven from soft
ball, and seven who made up the non-athletic group.
She found that they differed on only two of the sixteen
factors on which they were tested. The non-athletic
group scored higher on the intelligence factor and the
athletes scored higher on the apprehensiveness factor.
Charlisle (1985) selected 49 intercollegiate
female basketball players who were members of the Big
State Conference during the 1984-1985 season as sub
jects for this investigation. The Big State Conference
is an NAIA division school. The schools within this
conference are: (a) East Texas Babtist College, (b)
17
St. Edward's University, (c) Texas Lutheran College,
(d) Huston Tillotson College, (e) St. Mary's Universi
ty, and (f) the University of Mary Hardin Baylor. The
women basketball players in this study tended to be
more intelligent, more tough-minded, and more practical
than the national norm.
College Team Sport and Individ.ual Sport Athletes
Some studies have made comparisons between athlet
ic subgroups at the college level. Most concern team
sport.
Peterson, Weber, and Trousdale (1967) studied 97
athletes from either the Amateur Athletic Union or the
1964 U.S. Olympic Team. They were comparing team
versus individual sport participants. Thirty-eight
women were selected as subjects for the individual
sports group and 59 comprised the team sport group.
The team sports women were significantly more realis
tic, steady, sophisticated, practical, dependable, and
interested in immediate issues than the individual
sport competitors.
A similar study conducted by Rennecker (1970) also
compared women who comprised a team sport group with
18
women who made up an individual sport group. He con
cluded that team sport participants were more aloof,
serious, and free thinking than individual sport par
ticipants. Individual sport performers were character
ized as warm, happy-go-lucky, and conservative.
O'Connor and Webb (1976) also investigated the
personality traits of college female athletes. Four
groups were examined. The groups consisted of partici
pants on basketball, gymnastics, tennis, and swimming
teams. Significant differences were found to exist on
factors of intelligence, radicalism, self-sufficiency,
and control. Swimmers and tennis players were more apt
to experiment than basketball players and gymnasts.
Basketball players and swimmers were more self-suff i
cient and careless than tennis players and gymnasts.
Combining Both College Athletes and
College Team Sport Athletes
Some research has focused on comparing athletes to
non-athletes with additional data concerning athletic
subgroups. Some of the data may help distinguish
whether differences actually exist between the various
groups.
19
Malumphy (1966) conducted her first research
project on personality for a doctoral dissertation.
She surveyed women from several different colleges and
grouped them into four groups: team, team-individual,
individual, and non-participants. She found that more
similarities than differences existed among the groups.
The individual participants were less anxious, more
venturesome, more extroverted, and had more leadership
abilities than the team-individual participants. The
team participants were more anxious, less venturesome,
and less conscientious than the individual groups. The
team-individual participants were more reserved, more
introverted, more anxious, less venturesome, and less
conscientious than the individual groups.
Malumphy (1968) conducted a second study in which
she tested 119 athletes and non-participants. Fifteen
were members of an individual sport teams, 16 were
members of a subjectively judged sport(ie. gymnastics),
28 were members of a team sport, 18 were members of
individual-team sports, and 42 were non-participants.
Results indicated that individual sport athletes were
less anxious, more venturesome, and demonstrated more
leadership than team sport athletes. The non-partici-
20
pants were significantly different from the sport
groups as follows: less conscientious than the subjec
tively judged group; less tough-minded, less poised,
and demonstrated less leadership than the individual
and subjectively judged groups; more outgoing than the
team sports; and more imaginative, more extroverted,
and more venturesome than the individual-team sports
groups.
Foster (1971) had 103 subjects involved in his
study. Each of them were required to have participated
in a state, regional, or national tournament to be
chosen for the research. He found that the basketball
participants seemed to be more happy-go-lucky than the
softball players. The college athletes seemed to be
less happy-go-lucky and imaginative than the non-ath
letes.
Brasher (1974) tested 208 subjects for her study,
123 athletes and 85 for a control group. The athletes
participated in 11 different sports ranging from ar
chery to volleyball. The following are the conclusions
that were reached:
1. The athletic group was significantly more
tough-minded and group dependent. Also the
21
individuals in this group were better joiners
and followers when compared to the individual
in the control group_
2. Athletes were more reserved, emotionally
stable, venturesome, self-controlled, and
happy-go-lucky than college women according to
the established Cattell 16 PF Norms.
3. Team sport participants were more reserved,
practical, forthright, conservative, more
intelligent, happy-go-lucky, apprehensive, and
controlled than non-athletic college women
according to their established national norms.
4. Team sport participants were more tough-minded
and group dependent than the control group.
Pestonjee (1981) tested a group of 92 that con
sisted of men and women enrolled in a graduate course
in physical education and participants of university
level sports. There were 17 women involved in the
study. Pestonjee found that the sports group and the
non-sports group differentiated significantly. He
found that those participating in sports and physical
activities were reserved, cool, practical, regulated by
external realities, placid, self-assured, confident,
22
serene, group adherent, self-opinionated, controlled,
socially precise, and have high self control. The
sport group of girls were more intelligent, assertive,
independent, aggressive, impulsive, and self-opinionat
ed. They also tend to follow their own urges in com
parison to the non-sports group of girls.
Related to High School and College Athletes
The only research project found that was concerned
with the comparison of high school athletes to college
athletes was completed in 1965.
In this study, Schendel (1965) examined male
athletes and non-athletes at the high school and col
lege levels. He found that high school athletes dis
played more positive personal and social characteris
tics than non-athletes. At the college level, he found
that the non-athletes displayed more positive personal
and social characteristics than the athletes.
Summary
The review of related literature has confirmed
that there are differences that exist among different
types of athletes. Although only one reference was
23
found pertaining to a comparison between high school
and college athletes (Schendel, 1965), it is apparent
that there are differences between participants in
individual and team sports, as well as, athletes and
non-athletes. This study will examine any differences
existing between players involved at the high.school
level and competitors at the collegiate level. Howev
er, further research will have to be conducted in order
to confirm consistency.
24
CHAPTER 3
METHOD
This study is designed to identify and compare the
personality traits of female interscholastic athletes
and female intercollegiate athletes based on the
results of the Sixteen Personality Factor
Questionnaire. Information presented in this chapter
is organized to provide descriptions of subjects, the
personality questionnaire, testing procedures, and the
statistical tools used in this study.
Sub.jects
Eighty female subjects who participate in either
interscholastic or intercollegiate athletics were
chosen for this study. Each subject completed a
personal information questionnaire. The high school
questionnaire included questions regarding the sport
being played, age, year in school, and aspirations to
play at the college level. The college questionnaire
requested information concerning the sport being
played, age, year in school, and academic major. The
25
results of these questionnaires are presented in
Appendix B. Each subject also completed a consent
form, with the high school athletes required to provide
a parental or guardian signature. A copy of the
consent forms used at each level can be found in
Appendix C.
Forty-two of the subjects constituted the female
interscholastic athlete group and these subjects
participated at the varsity level in either basketball
or softball. Three different high schools were used
for the research.
Twelve of the athletes represented Arcola High
School, six for basketball and six for softball.
Arcola is a small community which contains some Amish.
The high school contains about 150 students and is
considered a Class A school.
Twelve athletes represented the Casey/Westfield
program. Six played basketball and six played
softball. Casey is a small community that once was a
big factory town. The factories have now closed. The
high school contains around 300 students and some have
been bussed since their consolidation with Westfield.
Casey is also considered a Class A division school.
26
The final eighteen interscholastic athletes came
from Charleston High School, and nine were involved in
basketball and nine in softball. Charleston is a
larger city than the other two towns and is the home of
Eastern Illinois University. The high school contains
approximately 800 students and is categorized.as a
class AA school.
The remaining thirty-eight subjects were female
1intercollegiate athletes and participated at the
varsity level in either basketball or softball.
Athletes at two different universities participated in
this study. Fourteen of the athletes represented
Eastern Illinois University, seven of them were
basketball players and seven of them were softball
players. Eastern Illinois University, a Division I
school, lies in the middle of Charleston and
approximately 10,000 students travel there every year
to attend school. Eastern offers a variety of programs
to their female athletes, including volleyball, cross
country, basketball, swimming, tennis, track and field,
and softball.
The remaining twenty-four intercollegiate athletes
came from Illinois State University, also a Division I
27
school, six playing basketball and eighteen playing
softball. Illinois State University, the 5th largest
school in the state, is located in Normal and its
student population is approximately 20,000. The
women's athletic program consists of volleyball, cross
country, swimming and diving, gymnastics, basketball,
golf, tennis, softball, and track and field.
The ages of the high school interscholastic
athletes ranged from 15 - 18, with the mean age
calculated to be 16.3. Eight were freshmen, thirteen
were sophmores, eleven were juniors, and ten were
seniors. Twenty-seven of these athletes had
aspirations to compete at the college level, four
thought that they might be interested, and eleven of
them had no interest in competing at the collegiate
level.
The ages of the university intercollegiate
athletes ranged from 18 - 22. The mean age of the
college athletes was found to be 19.8. Twelve were
freshmen, thirteen were sophmores, six were juniors,
and seven were seniors. Their academic majors ranged
from Accounting to Zoology. These can all be found in
appendix B.
28
The Personality Test
The Sixteen Personality Factor Questionnaire (16
PF test) was chosen as the data gathering instrument
for this research project. "It is an objectively
scorable test devised by basic research in psychology
to give the most complete coverage of personality
possible in a brief time" (!PAT Staff, 1986, p. 5).
The 16 PF test was developed by Raymond B Cattell at
the University of Illinois. Champaign.
A brief description of Cattell's theory of personality
may be helpful. Cattell gives the following origins
for various facets of personality:
1. Certain basic drives are inherited and
provide the original basis for behavior ....
2. Classes of attitudes and beliefs are
socially instilled through learning ....
3. Attitude learning occurs through classical
and instrumental conditioning ....
4. A substantial proportion of motivation is
unconscious ....
5. Learning induces a conscience or self
sentiment which integrates behaviors into
socially acceptable classes of behavior ....
29
6. Conflicts occur between different dynamic
structures which cause moral decisions ....
7. Most clinical maladaptive behaviors arise
from imbalances arising from conflicts ....
(Cattell, 1965)
The 16 Pf Test is an inventory in writte~ form.
Form A of the 16 PF Test was used in this study. The
test consisted of 187 questions and provided ten to
thirteen discriminatory items for each of the sixteen
personality factors. (IPAT Staff, 1986)
The 16 PF Test measures sixteen traits which are
relatively permanent features of personality and can be
thought of as general behavior tendencies. Most
researchers who are familiar with this test have
favorable comments concerning its purposes, uses and
structure. (Foster, 1971)
Fuoss and Troppmann (1981) give reasons why the
Sixteen Personality Factor Questionnaire should be
used:
The 16 primary factors identified by Cattell
are described as being functionally
independent and psychologically meaningful of
one's personality. This inventory has been
30
used broadly in the investigation of physical
educators, coaches, and athletes. Cross
cultural comparisons plus data on age group
competitors greatly increase the reliability
of the statements that can be made about the
personality of athletes (p.180).
Warburton and Kane (1968) state:
Various questionnaires have been proposed for
the measurement of single personality traits.
These have been found in general to have high
reliability but in many cases validity has not
always been satisfactorily demonstrated.
Often too, these questionnaires have been
set up for assumed unitary functions, the
discrete existence of which has been seriously
contended .... the Cattell and Eysenck scales
appear to be among the soundest techniques
presently available (p.83).
Rushall (1969), who has used Cattell's test
conclusively, supports use of the test as follows:
The 16 PF Test seems to be one of the best
suited tests for administration to a group of
athletes. It appears to be one of the most
31
scientifically developed tests available. It
is aimed at normal individuals and not biased
toward clinical personalities (p_ 38).
In general, the 16 PF Test has been found to be
highly suited to the testing of personality in
athletes. Its reliability and validity are sound
enough to be certain of the findings resulting from its
use (Foster, 1971). The test uses a factor analytic
approach in testing personality. It is statistically
sound in its constructions and purports to measure a
comprehensive set of personality factors. Each factor
in the test was developed from a factor analysis of a
larger variety of "traits." The internally derived
validity for all factors range from .84 to .96. The
reliability of the factors range from .70 to 1.00
(Cattell and Eber, 1957).
There is further justification for the use of the
16 PF Test in this research (a) the administration of
the test can be done with ease, (b) the questions can
be understood easily by the subjects, and (c) one need
not have had any extensive clinical background to
interpret the results obtained from this test.
Table 1 gives an indication of what each one of
32
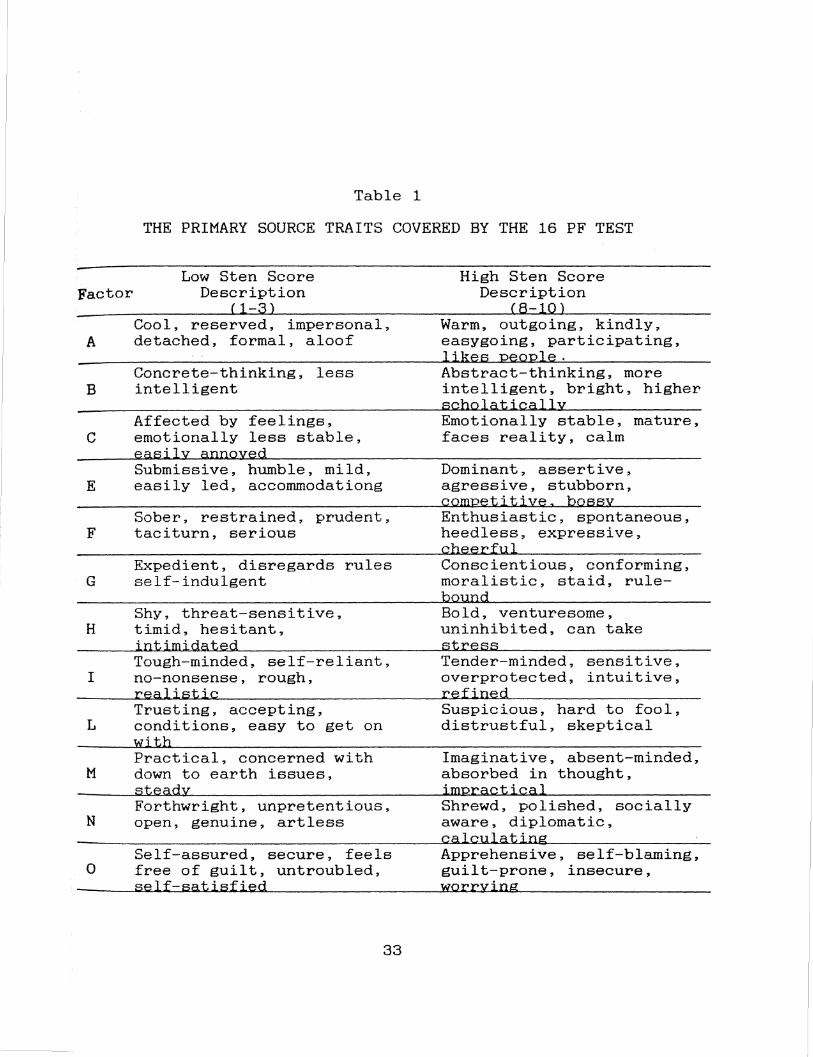
Table 1
THE PRIMARY SOURCE TRAITS COVERED BY THE 16 PF TEST
Low Sten Score Factor Description
{1-3) Cool, reserved, impersonal,
A detached, formal, aloof
Concrete-thinking, less B intelligent
Affected by feelings, C emotionally less stable,
easily annoyed Submissive, humble, mild,
E easily led, accommodationg
Sober, restrained, prudent, F taciturn, serious
Expedient, disregards rules G self-indulgent
Shy, threat-sensitive, H timid, hesitant,
intimidated Tough-minded, self-reliant,
I no-nonsense, rough, realistic Trusting, accepting,
L conditions, easy to get on
Practical, concerned with M down to earth issues,
steady Forthwright, unpretentious,
N open, genuine, artless
Self-assured, secure, feels 0 free of guilt, untroubled,
self-satisfied
33
High Sten Score Description
(8-10) Warm, outgoing, kindly, easygoing, participating, likes people. Abstract-thinking, more intelligent, bright, higher scholatically Emotionally stable, mature, faces reality, calm
Dominant, assertive, agressive, stubborn, competitive. bossy Enthusiastic, spontaneous, heedless, expressive,
Conscientious, conforming, moralistic, staid, rule-
Bold, venturesome, uninhibited, can take stress Tender-minded, sensitive, overprotected, intuitive, refined Suspicious, hard to fool, distrustful, skeptical
Imaginative, absent-minded, absorbed in thought, impractical Shrewd, polished, socially aware, diplomatic, calculating Apprehensive, self-blaming, guilt-prone, insecure, worrying
Ql
Q2
Q3
Q4
Conservative, respecting traitional ideas
Group-oriented, a "joiner" and sound follower, listens to others Undisciplined self-conflict, lax, careless of social rules Relaxed, tranquil, composed, has low drive, frustrated
Experimenting, liberal, critical, open to,
Self-sufficient, resourceful, prefers own decisions
Following self-image, socially precise, compulsive Tense, frustrated, overwrought, has high
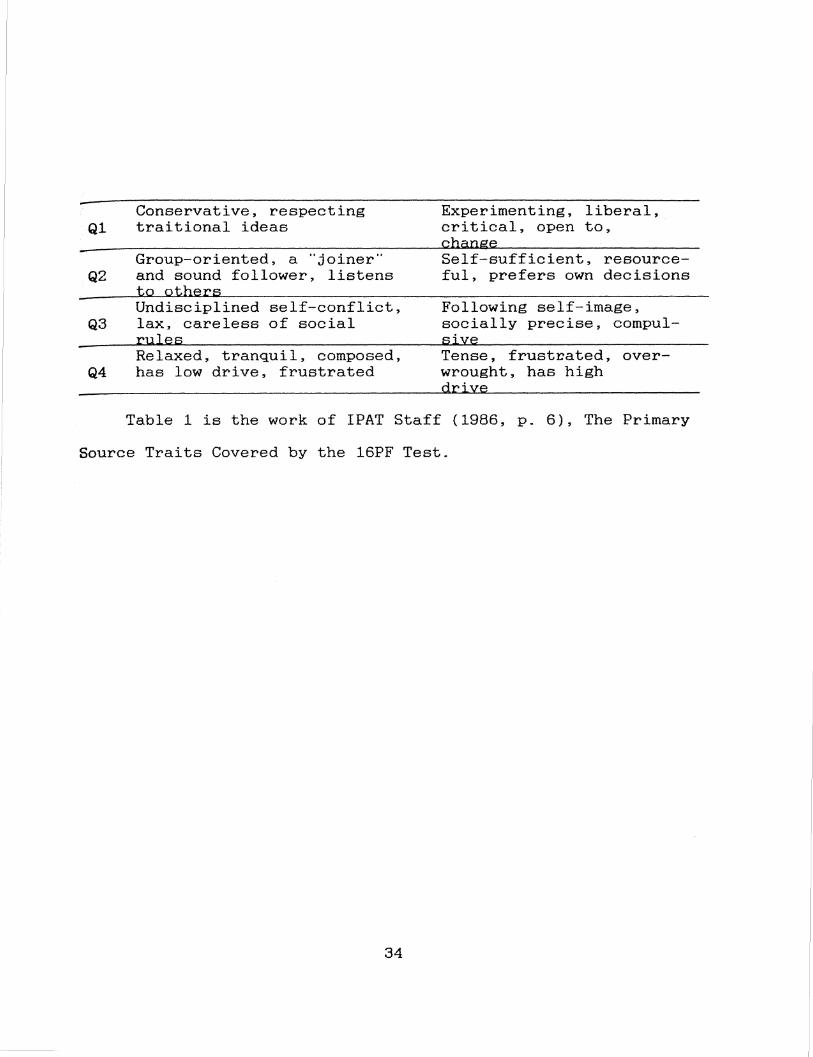
Table 1 is the work of IPAT Staff (1986, p. 6), The Primary
Source Traits Covered by the 16PF Test.
34
the factors will be testing for (IPAT Staff, 1986).
Testing Procedures
The Sixteen Personality Factor Questionnaire was
administered to the softball players during their
season of competition and to the basketball players in
the spring following their season. The test was
administered to all of the high school athletes in a
classroom. The coaches from Illinois State University
administered the test to their athletes in a classroom
also.
All of the subjects were instructed to remain
quiet thoughout the entire testing process. The
instructions from the front cover were then read aloud
and they were asked to begin. Several statements were
then made in regard to taking the test in a serious
manner, complete the test with no assistance, be as
honest as possible, concentrate on the instinctive
response instead of spending too much time on one
question, and use answer B as little as possilble. The
coaches from Illinois State University generously
agreed to administer the test for the investigator
since we could not agree on a time frame that was
35
compatable for all. They were sent detailed
instructions on how the test was to be administered
The questionnaires were mailed to the members of
the Eastern Illinois University softball team. Each
letter included a consent form, a personal information
questionnaire, explicate instructions, an answer sheet,
and (f) a copy of the test.
All subjects, except the Eastern Illinois
University softball players, were to respond by marking
the corresponding letter of the correct answer on the
answer sheet provided. The test required from 45 to 60
minutes to complete. When the subjects completed the
test, they were instructed to bring all materials to
the tester and then were free to leave. The Eastern
Illinois University Softball players were provided with
self addressed, stamped envelopes in which they were to
mail the consent form, personal information
questionnaire, and answer sheet back to the
investigator.
Statistical Procedure
Form A of Cattell's Sixteen Personality Factor
Questionnaire was used for this project. The answer
36
sheets were hand scored by the investigator using the
respective scoring keys provided. Each individual was
then assigned the numerical value that was totaled on
each factor. Following Cattell's recommendation, these
raw scores were used for statistical analysis.
The mean scores were then converted to sten scores
using the norm tables provided. "Sten scores (the term
comes from 'standard ten') are distributed over ten
equal-interval standard score points (assuming normal
distribution) from one through ten (!PAT Staff, 1986,
p. 19)." These sten scores were then placed on a
profile graph where comparisons could be visually made
with ease.
Statistical Tools
The SPSS (Release 4) statistical package for the
IBM computer was used for this investigation. This
provided mean scores, standard deviations, a
discriminant analysis, and a multivariate analysis of
variance.
The discriminant function analysis is a
multivariate technique which shows group
discrimination by using the entire person-
37
ality profile rather than single profile
components. This program computes a set
of linear functions which classify parti
cipants into a specified group (Foster,
1971, p. 43) .
When a procedure is multivariate, it studies
many measurements on the same person, instead
of only one variable or process at a time.
It also studies behavior with less artificial
control or interference. It actually
measures all the variables and may then set
an electronic computer to abstract the
regularities which exist, instead of
depending on human powers of memory and
generalization. (Cattell, 1965, pp. 21-22)
The .05 level of significance was selected to
determine whether the groups differed significantly.
38
CHAPTER4
ANALYSIS OF THE DATA
The investigation was designed to compare of the
traits of female athletes at both the high school and
college levels, as measured by the Sixteen Personality
Factor Questionnaire {16 PF Test). Forty-two.high
school athletes and thirty-eight college athletes were
chosen as subjects for the study. Form A of the 16 PF
Test was administered to the subjects. A presentation
of the findings and a discussion of the data are
included in this chapter.
Presentation of the Findings
The presentation of the findings has been divided
into two sections. In the first section, the mean
scores for the subgroups were converted to mean sten
scores to compare the results of the 16 PF Test to a
standard population. The subgroups are divided into
four groups for this presentation {a) high school
softball and basketball players, (b) college softball
and basketball players, (c) all high school athletes
combined, and (d) all college athletes combined. The
norm tables for each respective group were used for
conversion. Sten scores were numbered from one through
ten, with the population average fixed at sten 5.5.
39
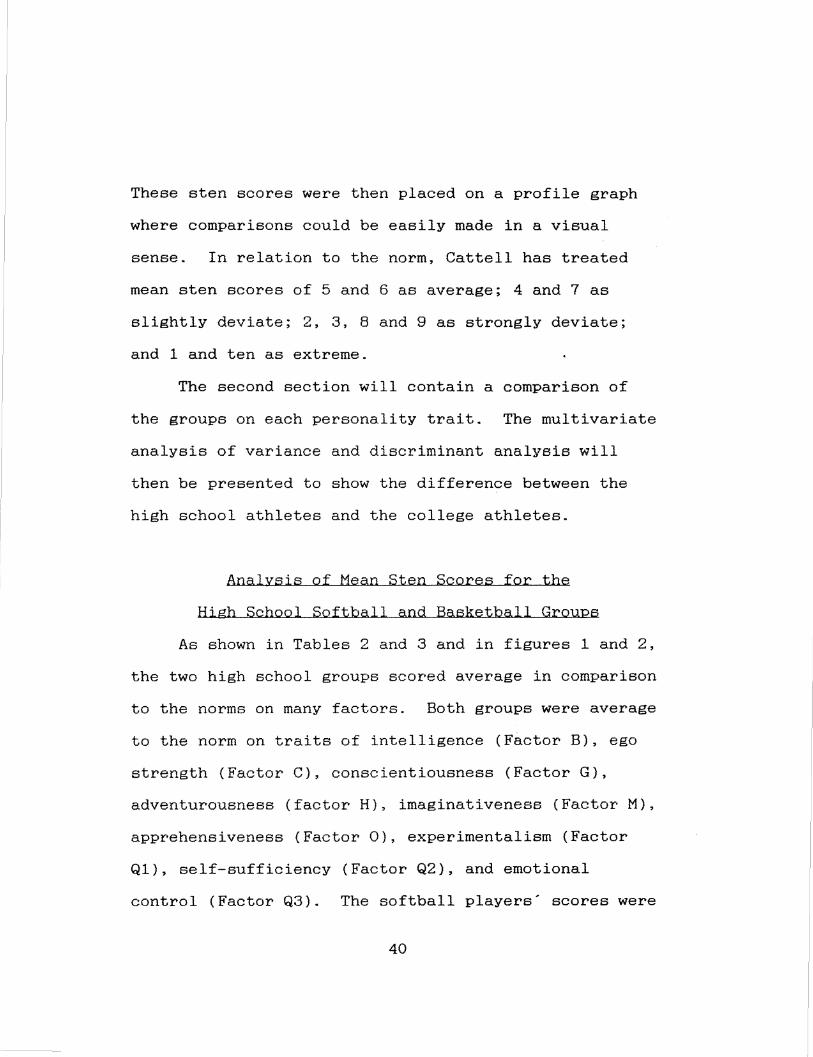
These sten scores were then placed on a profile graph
where comparisons could be easily made in a visual
sense. In relation to the norm, Cattell has treated
mean sten scores of 5 and 6 as average; 4 and 7 as
slightly deviate; 2, 3, 8 and 9 as strongly deviate;
and 1 and ten as extreme.
The second section will contain a comparison of
the groups on each personality trait. The multivariate
analysis of variance and discriminant analysis will
then be presented to show the difference between the
high school athletes and the college athletes.
Analysis of Mean Sten Scores for the
High School Softball and Basketball Groups
As shown in Tables 2 and 3 and in figures 1 and 2,
the two high school groups scored average in comparison
to the norms on many factors. Both groups were average
to the norm on traits of intelligence (Factor B), ego
strength (Factor C), conscientiousness (Factor G),
adventurousness (factor H), imaginativeness (Factor M),
apprehensiveness (Factor 0), experimentalism {Factor
Ql), self-sufficiency (Factor Q2), and emotional
control (Factor Q3). The softball players' scores were
40
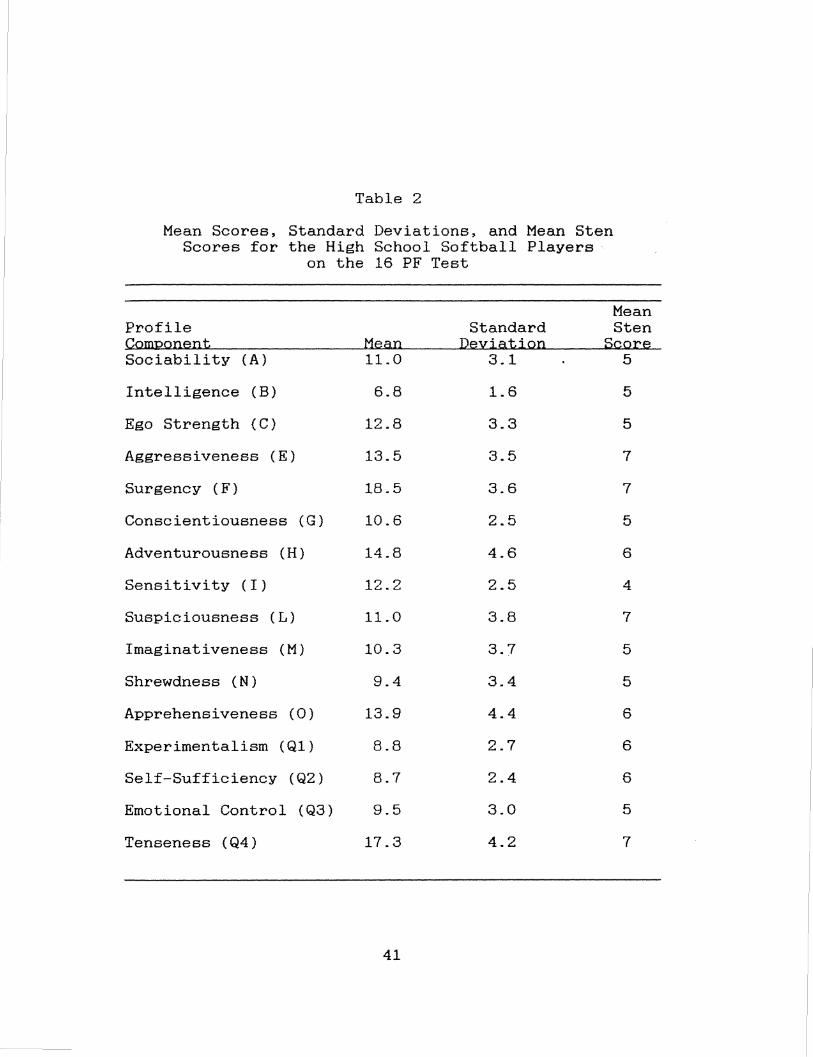
Table 2
Mean Scores, Standard Deviations, and Mean Sten Scores for the High School Softball Players ·
on the 16 PF Test
Mean Profile Standard Sten GQIDJ2Qnfmt Mean l2eY:iatiQn SQQre Sociability (A) 11.0 3.1 5
Intelligence (B) 6.8 1.6 5
Ego Strength {C) 12.8 3.3 5
Aggressiveness (E) 13.5 3.5 7
Surgency (F) 18.5 3.6 7
Conscientiousness (G) 10.6 2.5 5
Adventurousness (H) 14.8 4.6 6
Sensitivity ( I ) 12.2 2.5 4
Suspiciousness ( L) 11.0 3.8 7
Imaginativeness (M) 10.3 3.7 5
Shrewdness (N) 9.4 3.4 5
Apprehensiveness (0) 13.9 4.4 6
Experimentalism (Ql) 8.8 2.7 6
Self-Sufficiency (Q2) 8.7 2.4 6
Emotional Control (Q3) 9.5 3.0 5
Tenseness {Q4) 17.3 4.2 7
41
Traits _1~~2~~3~~4~~~5~~6~~7.__~8--~~9'--~l"'""""O Reserved vs. Outgoing (A)
Less Intelligent vs. More Intelligent (B)
Low Ego Strength vs. High Ego Strength (C
Humble vs. Assertive (E)
Sober vs. Happy-GoLucky (F)
Expedient vs. Conscientious (G)
Shy vs. Venturesome (H)
Tough-Minded vs. Tender-Minded (I)
Trusting vs. Suspicious (L)
Practical vs. Imaginative (M)
Forthright vs. Shrewd (N)
Self-Assured vs. Apprehensive (0)
Conservative vs. Experimenting (Ql)
Group Dependent vs. Self-Sufficient (Q2)
Undisciplined Self-Conflict vs. Controlled (Q3)
Relaxed vs. Tense {Q4) 1 2 3 4 5
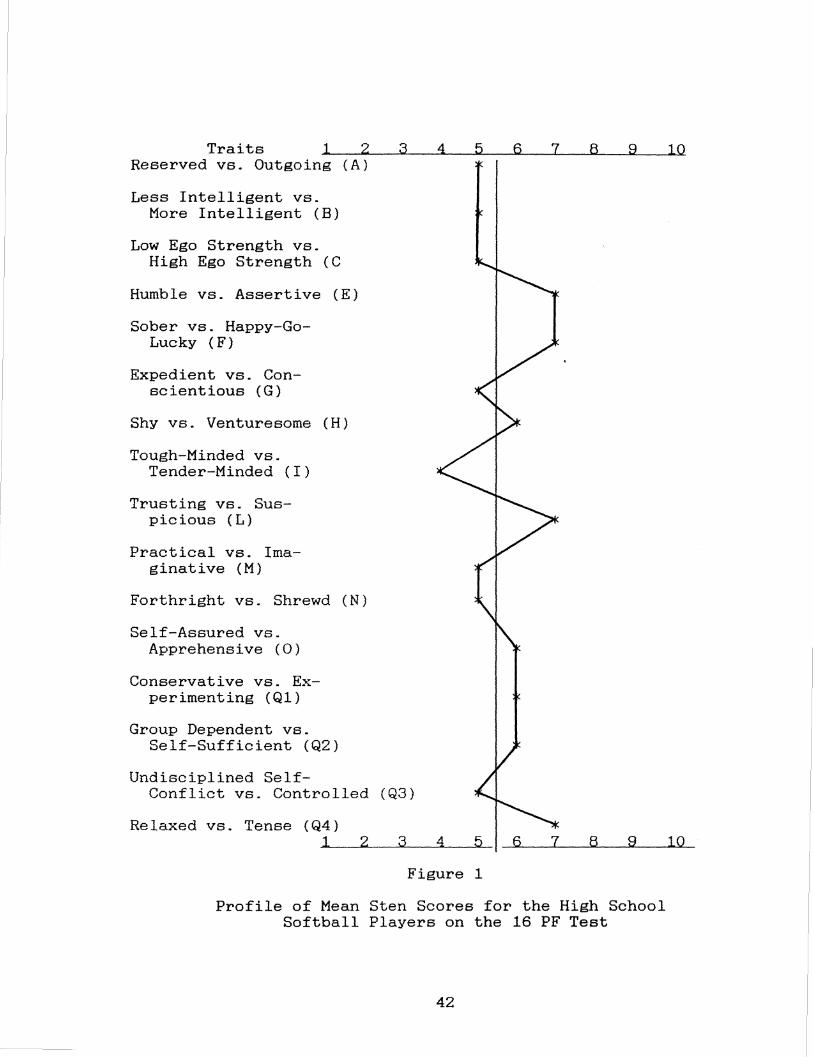
Figure 1
6 7 8 9
Profile of Mean Sten Scores for the High School Softball Players on the 16 PF Test
42
10
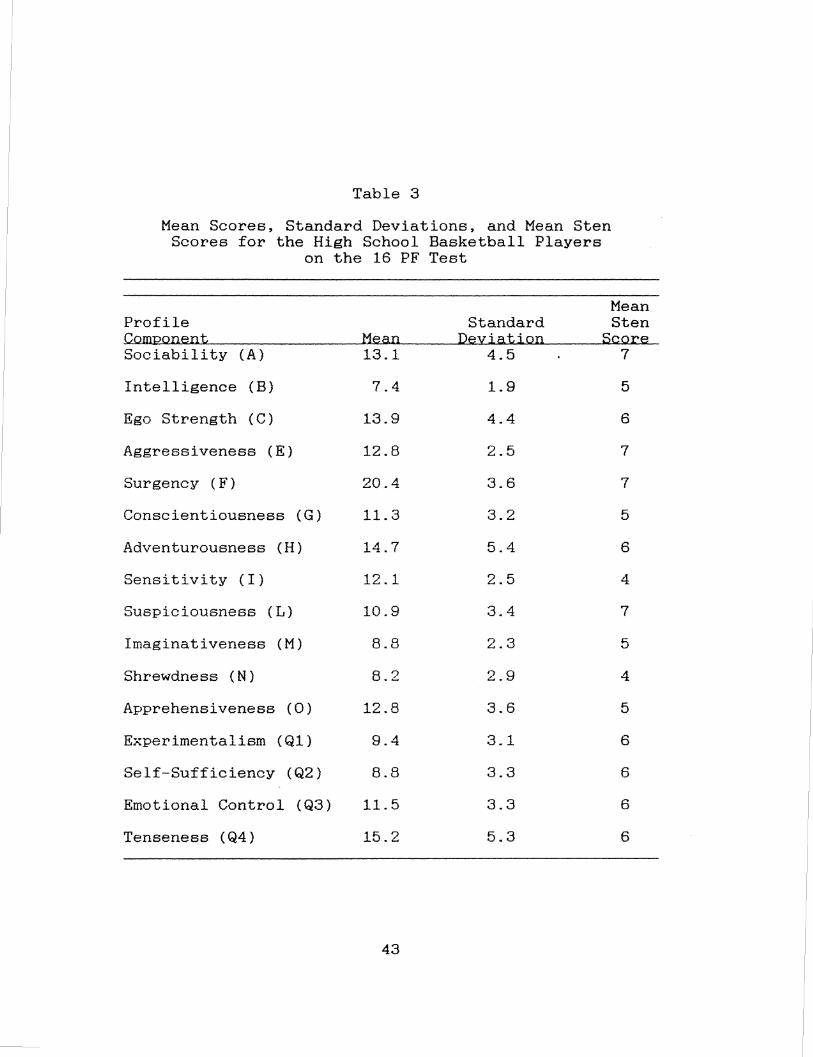
Table 3
Mean Scores, Standard Deviations, and Mean Sten Scores for the High School Basketball Players
on the 16 PF Test
Profile Standard Mean Sten
CQIDI2Qnent Mean DeYiatiQn SQ ore Sociability (A) 13.1 4.5 7
Intelligence (B) 7.4 1.9 5
Ego Strength ( c) 13.9 4.4 6
Aggressiveness (E) 12.8 2.5 7
Surgency (F) 20.4 3.6 7
Conscientiousness (G) 11.3 3.2 5
Adventurousness (H) 14.7 5.4 6
Sensitivity ( I ) 12.1 2.5 4
Suspiciousness (L) 10.9 3.4 7
Imaginativeness (M) 8.8 2.3 5
Shrewdness (N) 8.2 2.9 4
Apprehensiveness (0) 12.8 3.6 5
Experimentalism (Ql) 9.4 3.1 6
Self-Sufficiency (Q2) 8.8 3.3 6
Emotional Control (Q3) 11.5 3.3 6
Tenseness (Q4) 15.2 5.3 6
43
Traits -1~__..2..__--'3..._~--~_,,.__~---~-'-~-'"8,____.9..._~l~O~ Reserved vs. Outgoing (A)
Less Intelligent vs. More Intelligent (B)
Low Ego Strength vs. High Ego Strength (C)
Humble vs. Assertive (E)
Sober vs. Happy-GoLucky (F)
Expedient vs. Conscientious (G)
Shy vs. Venturesome (H)
Tough-Minded vs. Tender-Minded (I)
Trusting vs. Suspicious (L)
Practical vs. Imaginative (M)
Forthright vs. Shrewd (N)
Self-Assured vs. Apprehensive (0)
Conservative vs. Experimenting (Ql)
Group Dependent vs. Self-Sufficient (Q2)
Undisciplined Self-Conflict vs. Controlled (Q3)
Relaxed vs. Tense (Q4) 1 2 3 4 5
Figure 2
6 7 8 9
Profile of Mean Sten Scores For High School Basketball Players on the 16 PF Test
44
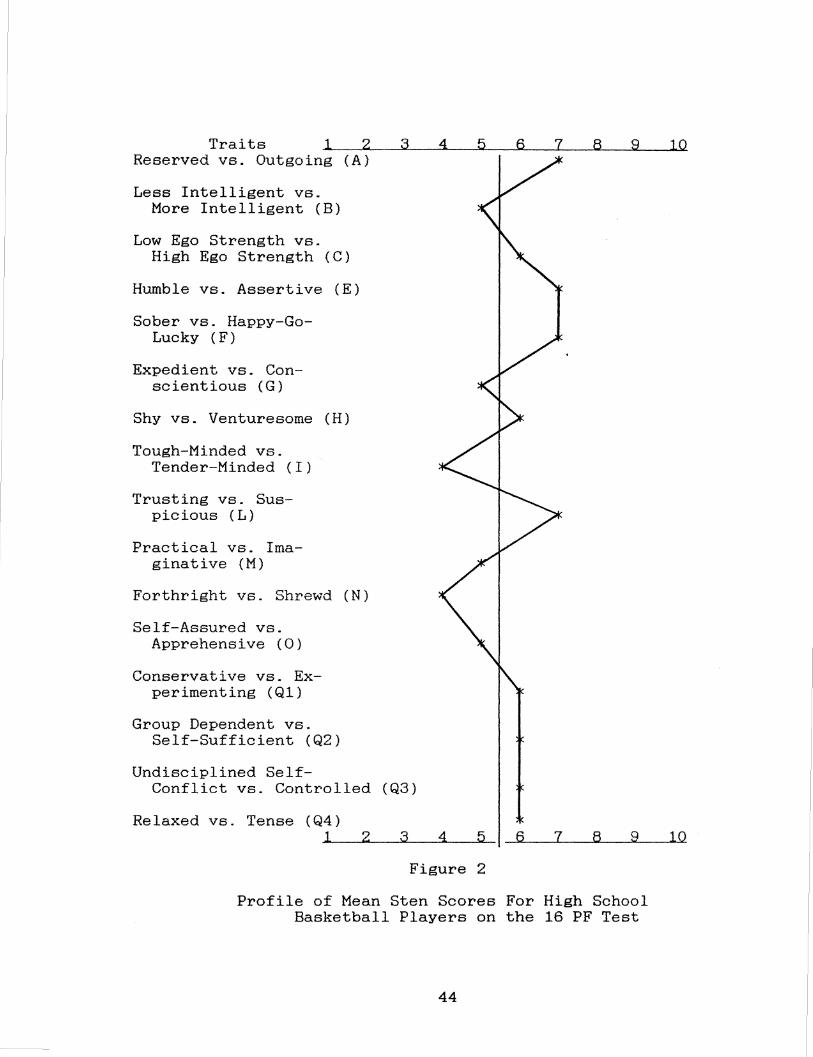
10
close to the norm on sociability (Factor A) and
shrewdness (Factor N). The basketball players were
also average on the trait of tenseness, (Factor Q4).
The mean sten scores for the high school softball
players, presented in Table 2, have also been
illustrated in Figure 1. The softball players scored
slightly higher than the norm on traits of
aggressiveness (Factor E), surgency {Factor F),
suspiciousness (Factor L), and tenseness (Factor Q4).
This characterizes them as assertive, happy-go-lucky,
hard to fool, and tense people. The softball players
scored slightly lower to the norm on the trait of
sensitivity (Factor I) which characterizes them as
tough-minded and practical.
Table 3 and Figure 2 have presented the mean sten
scores for the high school basketball players. Slight
deviations from the norm have been noted on the factors
listed below. The high school basketball players
demonstrated more sociability (Factor A),
aggressiveness (Factor E), surgency (Factor F), and
suspiciousness (Factor L). However, they were also
noted to be less sensitive (Factor I) and less
imaginative (Factor M). This characterizes high school
45
basketball players as reserved, assertive, happy-go
lucky, hard to fool, tough-minded, and attentive to
practical matters.
Analysis of Mean Sten Scores for the
College Softball and Basketball Groups
As shown in Tables 4 and 5 and in Figures 3 and 4,
the college groups also scored similar to the norm on
several traits. Both the softball and basketball
groups scored average on traits of sociability (Factor
A), intelligence (Factor B), ego strength (Factor C),
aggressiveness (Factor E), surgency (Factor F),
adventurousness (Factor H), shrewdness (Factor N),
apprehensiveness (Factor 0), experimentalism (Factor
Ql), self-sufficiency (Factor Q2), and tenseness
(Factor Q4). The softball players were also very close
to the norm on traits of sensitivity (Factor I) and
suspiciousness (Factor L). The basketball players
compared similarly to the norm on conscientiousness
(Factor G) and emotional control (Factor Q3).
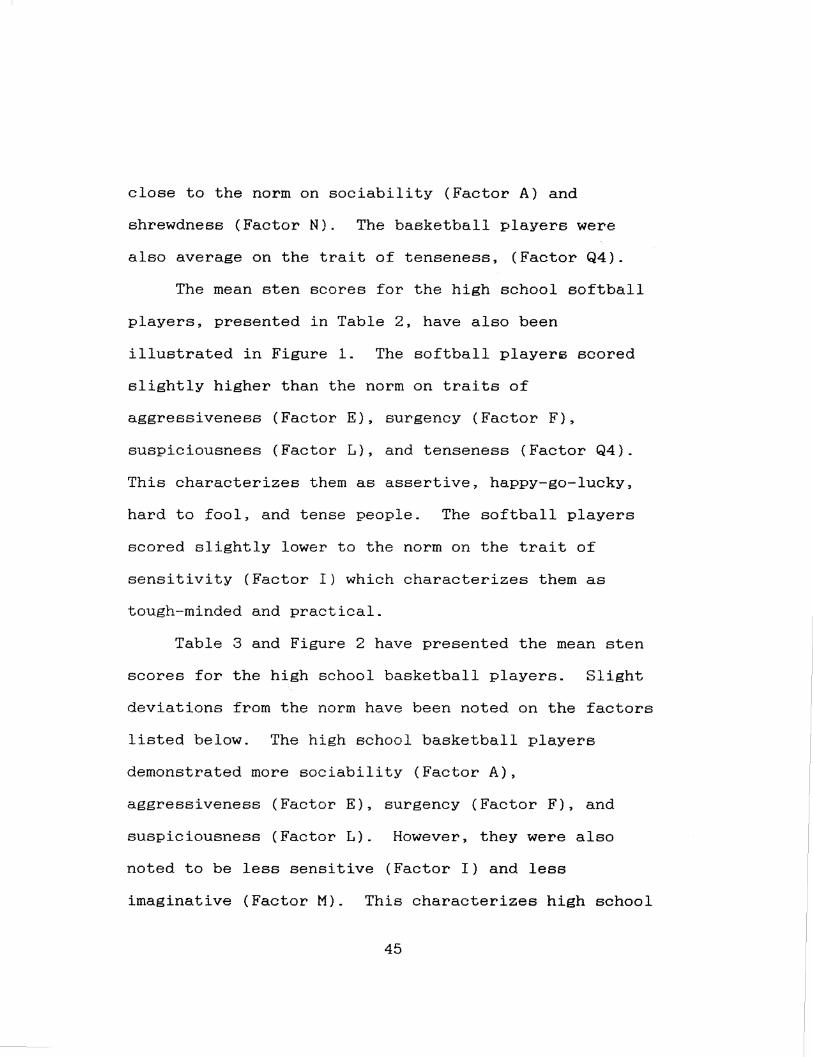
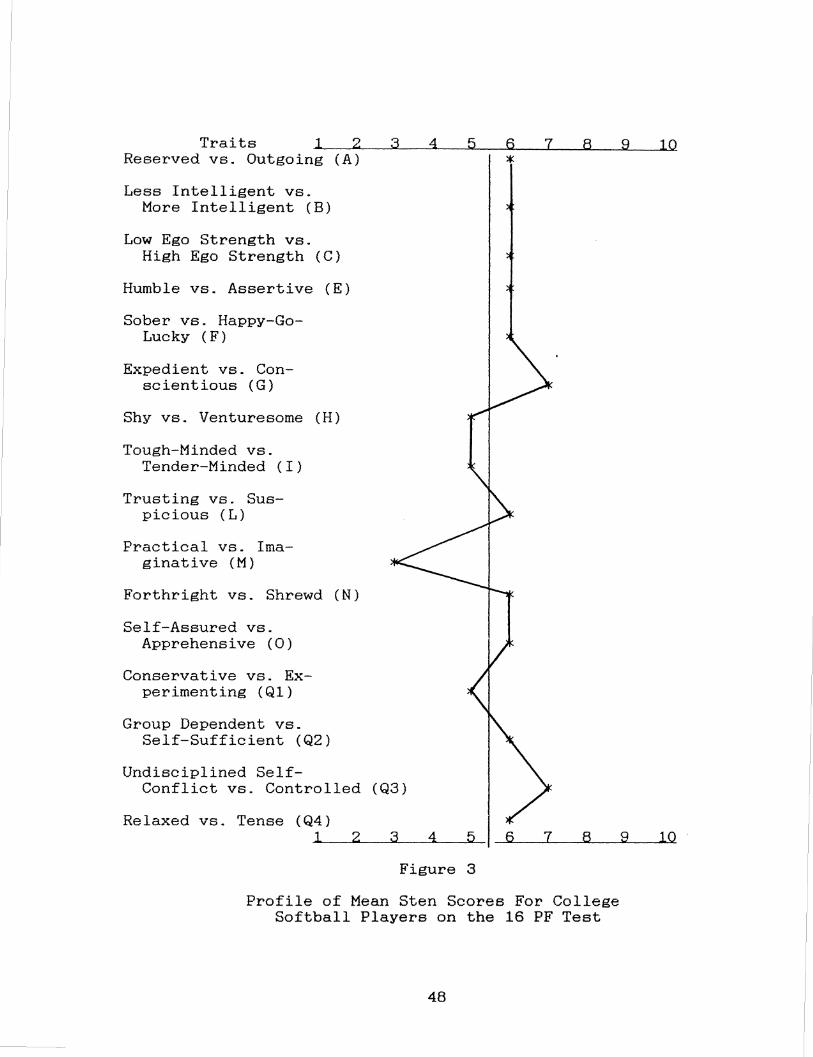
The deviations for the college softball players
can be seen in Table 4 and in Figure 3. They scored
slightly higher than the norms on conscientiousness
46
Table 4
Mean Scores, Standard Deviations, and Mean Sten Sten Scores for the College Softball Players
on the 16 PF Test
Mean Profile Standard Sten CQIDJ2Qnent Mean DeYiatiQD SoQre Sociability (A) 12.7 3.0 6
Intelligence (B) 8.5 1.6 6
Ego Strength (C) 15.5 3.3 6
Aggressiveness (E) 12.0 3.8 6
Surgency (F) 17.4 4.8 6
Conscientiousness (G) 14.0 2.9 7
Adventurousness (H) 13.1 6.4 5
Sensitivity ( I ) 12.8 2.6 5
Suspiciousness (L) 8.4 3.1 6
Imaginativeness (M) 9.2 3.9 3
Shrewdness (N) 9.8 3.3 6
Apprehensiveness (0) 11.9 3.4 6
Experimentalism (Ql) 6.4 3.0 5
Self-Sufficiency (Q2) 9.5 2.9 6
Emotional Control (Q3) 14.0 2.7 7
Tenseness (Q4) 16.2 4.5 6
47
Traits -1~_...2.__~3.._~4..____,5..__---'6...._~~7~_...8.__--"'9'--__.l~O Reserved vs. Outgoing (A)
Less Intelligent vs. More Intelligent (B)
Low Ego Strength vs. High Ego Strength {C)
Humble vs. Assertive (E)
Sober vs. Happy-GoLucky {F)
Expedient vs. Conscientious (G)
Shy vs. Venturesome {H)
Tough-Minded vs. Tender-Minded {I)
Trusting vs. Suspicious (L)
Practical vs. Imaginative (M)
Forthright vs. Shrewd (N)
Self-Assured vs. Apprehensive {0)
Conservative vs. Experimenting {Ql)
Group Dependent vs. Self-Sufficient {Q2)
Undisciplined SelfConflict vs. Controlled
Relaxed vs. Tense {Q4) 1 2 3 4 5 6 7 8
Figure 3
Profile of Mean Sten Scores For College Softball Players on the 16 PF Test
48
9 10
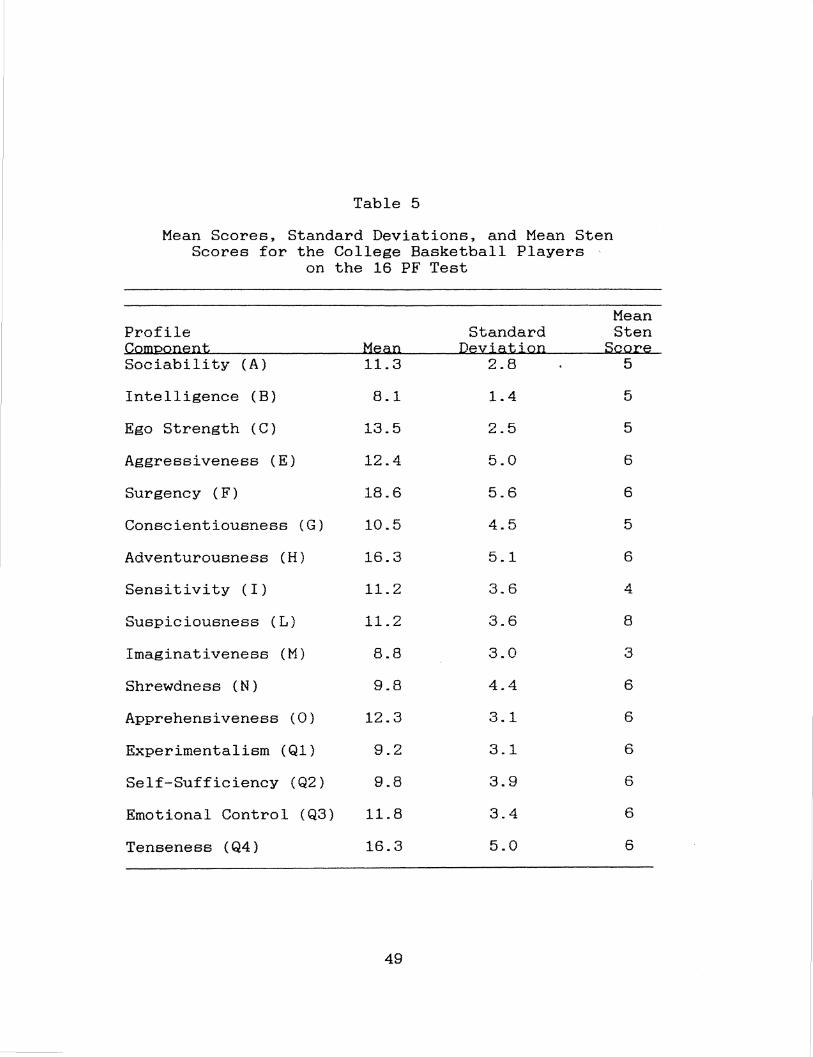
Table 5
Mean Scores, Standard Deviations, and Mean Sten Scores for the College Basketball Players
on the 16 PF Test
Profile Standard Mean Sten
QQm:QQmmt Mean I2eYiatiQn SQQ re Sociability (A) 11.3 2.8 5
Intelligence (B) 8.1 1.4 5
Ego Strength (C) 13.5 2.5 5
Aggressiveness (E) 12.4 5.0 6
Surgency (F) 18.6 5.6 6
Conscientiousness (G) 10.5 4.5 5
Adventurousness (H) 16.3 5.1 6
Sensitivity (I) 11.2 3.6 4
Suspiciousness (L) 11.2 3.6 8
Imaginativeness ( M) 8.8 3.0 3
Shrewdness (N) 9.8 4.4 6
Apprehensiveness (0) 12.3 3.1 6
Experimentalism (Ql) 9.2 3.1 6
Self-Sufficiency (Q2) 9.8 3.9 6
Emotional Control (Q3) 11.8 3.4 6
Tenseness (Q4) 16.3 5.0 6
49
Traits -l~_...2.____..3.__~4~~5.._---'6 __ ~~7~---8'--_..9'--___..1"""0 Reserved vs. Outgoing (A)
Less Intelligent vs. More Intelligent (B)
Low Ego Strength vs. High Ego Strength (C)
Humble vs. Assertive (E)
Sober vs. Happy-GoLucky (F)
Expedient vs. Conscientious (G)
Shy vs. Venturesome (H)
Tough-Minded vs. Tender-Minded (I)
Trusting vs. Suspicious (L)
Practical vs. Imaginative (M)
Forthright vs. Shrewd (N)
Self-Assured vs. Apprehensive (0)
Conservative vs. Experimenting (Ql)
Group Dependent vs. Self-Sufficient (Q2)
Undisciplined Self-Conflict vs. Controlled (Q3)
Relaxed vs. Tense (Q4) 1 2 3 4 5
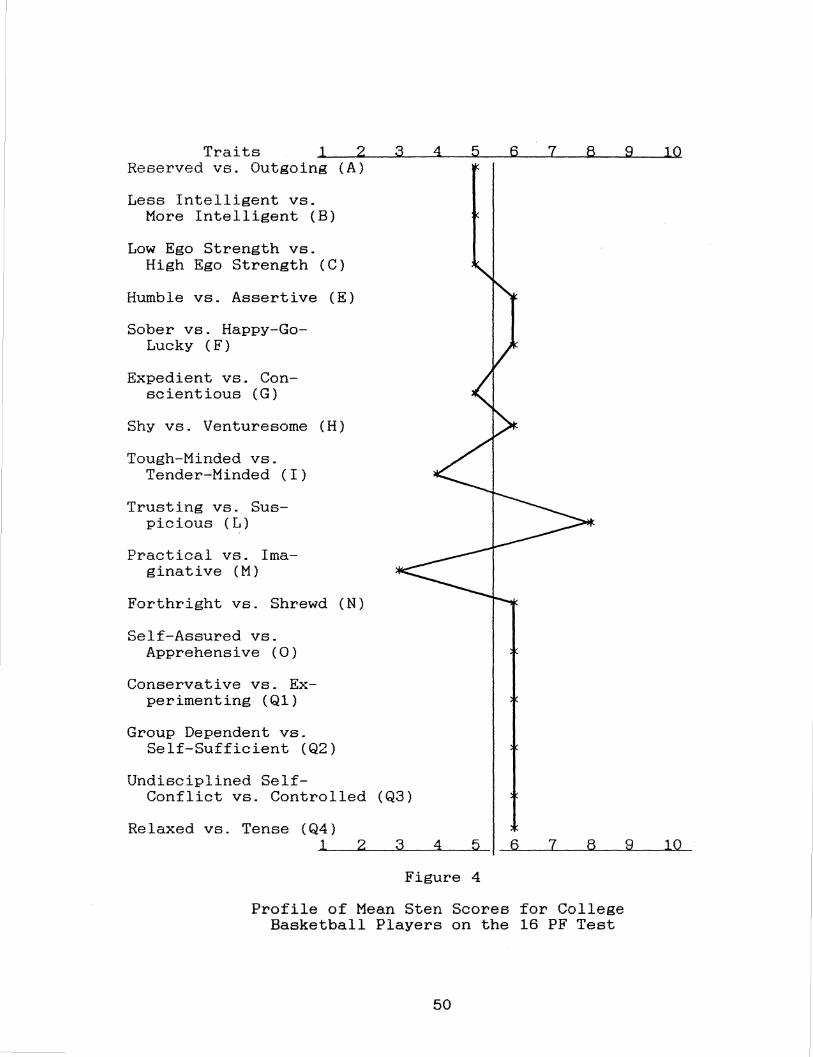
Figure 4
6 7 8
Profile of Mean Sten Scores for College Basketball Players on the 16 PF Test
50
9 10
(Factor G) and emotional control (Factor Q3). This
characterizes them as expedient and possessing an
undisciplined self conflict. They were strongly
deviant from the norm on imaginativeness (Factor M).
The low score obtained here would show that they tend
to be anxious to do the right things, attentive to
practical matters, and subject to the dictation of what
is obviously possible.
The basketball players at the college level,
deviated slightly from the norm on sensitivity (Factor
I), which characterizes them as tough-minded and self
reliant. The statistical information for this group
can be found in Table 5 and Figure 4. They were
strongly deviant from the norm on suspiciousness
(Factor L) and imaginativeness (Factor M). The high
score obtained on Factor L shows that these athletes
tend to be mistrusting, and doubtful. They are often
involved in their own egos, are self-opinionated, and
interested in internal, mental life. The low score on
Factor M would characterize them as anxious to do the
right things, attentive to practical matters, and
subject to the dictation of what is obviously possible.
Analysis of Mean Sten Scores for the
High School and College Athletic Groups
The statistical analysis determined the
51
significance of the results of this research project.
This section will present the analysis by
combining the sports and comparing the levels. Tables
6 and 7 and Figures 5 and 6 hold the graphic displays.
Both levels scored average to the norm on
sociability (Factor A), intelligence (Factor B), ego
strength (Factor C), conscientiousness (Factor G),
adventurousness (Factor H), shrewdness (Factor N),
apprehensiveness (Factor 0), experimentalism (Factor
Ql), self-sufficiency (Factor Q2), and tenseness
(Factor Q4). The high school athletes were also close
to the norm on traits of imaginativeness (Factor M) and
emotional control (Factor Q3). The college athletes
were similar to the norm on aggressiveness (Factor E),
surgency {Factor F), and suspiciousness (Factor L).
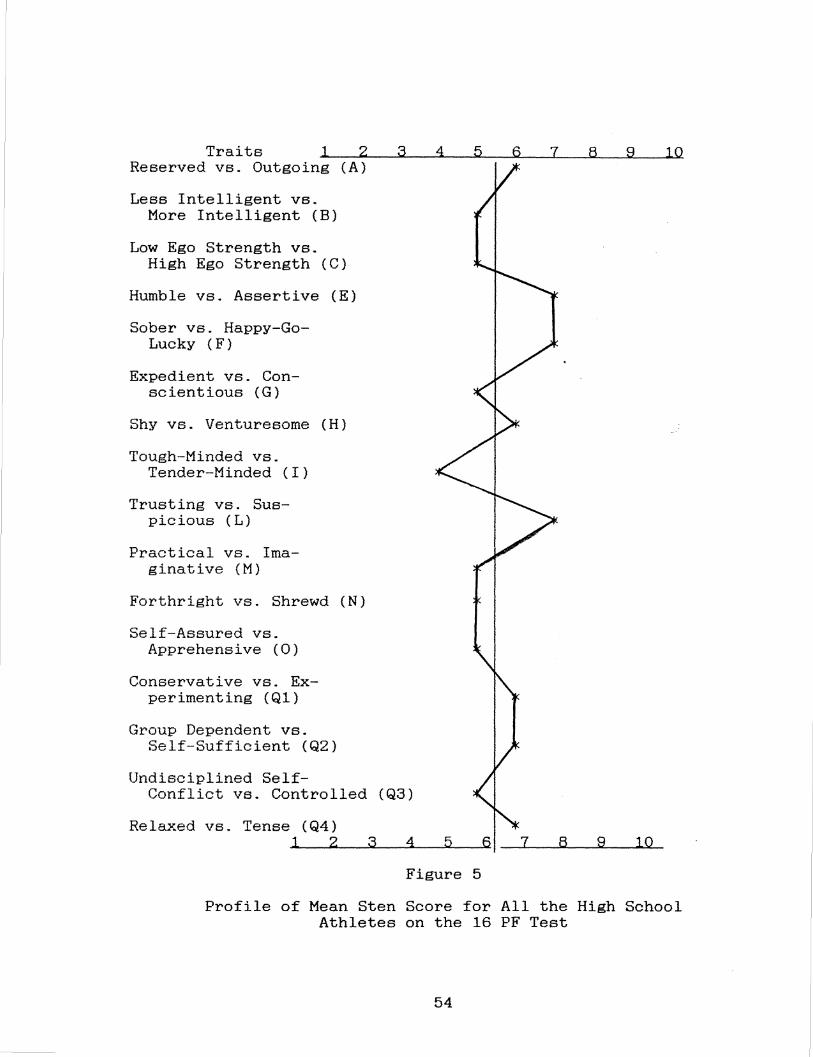
The high school athletes deviated slightly from
the norm on four factors. These were aggressiveness
(Factor E), surgency (Factor F), sensitivity (Factor
I), and suspiciousness (Factor L). These athletes were
characterized as being assertive, happy-go-lucky,
tough-minded, and hard to fool.
The college athletes deviated slightly from the
norm on traits of sensitivity (Factor I) and emotional
52
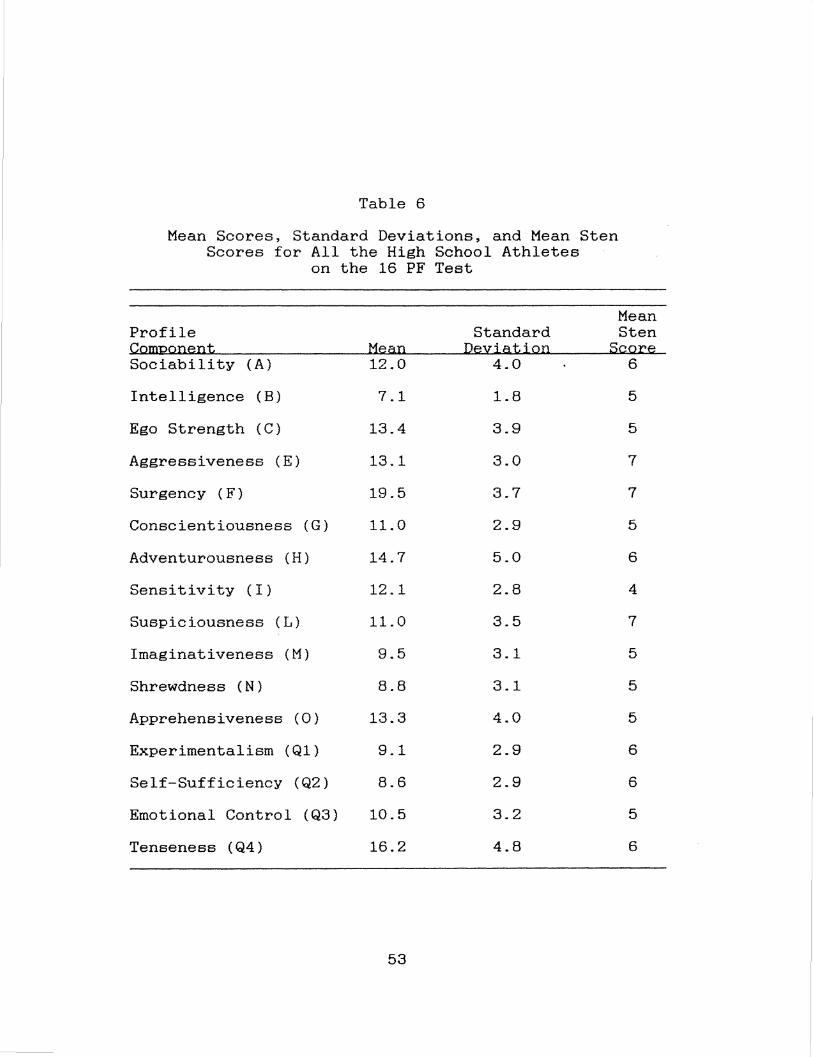
Table 6
Mean Scores, Standard Deviations, and Mean Sten Scores for All the High School Athletes
on the 16 PF Test
Profile Standard Mean Sten
Qom12onent Mean DeYia.tiQD SQQ re Sociability (A) 12.0 4.0 6
Intelligence ( B) 7.1 1.8 5
Ego Strength ( c) 13.4 3.9 5
Aggressiveness (E) 13.1 3.0 7
Surgency (F) 19.5 3.7 7
Conscientiousness ( G) 11.0 2.9 5
Adventurousness (H) 14.7 5.0 6
Sensitivity ( I ) 12.1 2.8 4
Suspiciousness (L) 11.0 3.5 7
Imaginativeness ( M) 9.5 3.1 5
Shrewdness (N) 8.8 3.1 5
Apprehensiveness (0) 13.3 4.0 5
Experimentalism (Ql) 9.1 2.9 6
Self-Sufficiency (Q2) 8.6 2.9 6
Emotional Control (Q3) 10.5 3.2 5
Tenseness (Q4) 16.2 4.8 6
53
Traits l 2 Reserved vs. Outgoing (A)
Less Intelligent vs. More Intelligent (B)
Low Ego Strength vs. High Ego Strength (C)
Humble vs. Assertive (E)
Sober vs. Happy-Go-Lucky (F)
Expedient vs. Con-scientious (G)
Shy vs. Venturesome (H)
Tough-Minded vs. Tender-Minded (I)
Trusting vs. Sus-picious ( L)
Practical vs. Ima-ginative (M)
Forthright vs. Shrewd (N)
Self-Assured vs. Apprehensive (0)
Conservative vs. Ex-perimenting (Ql)
Group Dependent vs. Self-Sufficient (Q2)
Undisciplined Self-Conflict vs. Controlled
Relaxed vs. Tense (Q4) l 2
3 8 9 lQ
(Q3)
3 4 5 6 7 8 9 10
Figure 5
Profile of Mean Sten Score for All the High School Athletes on the 16 PF Test
54
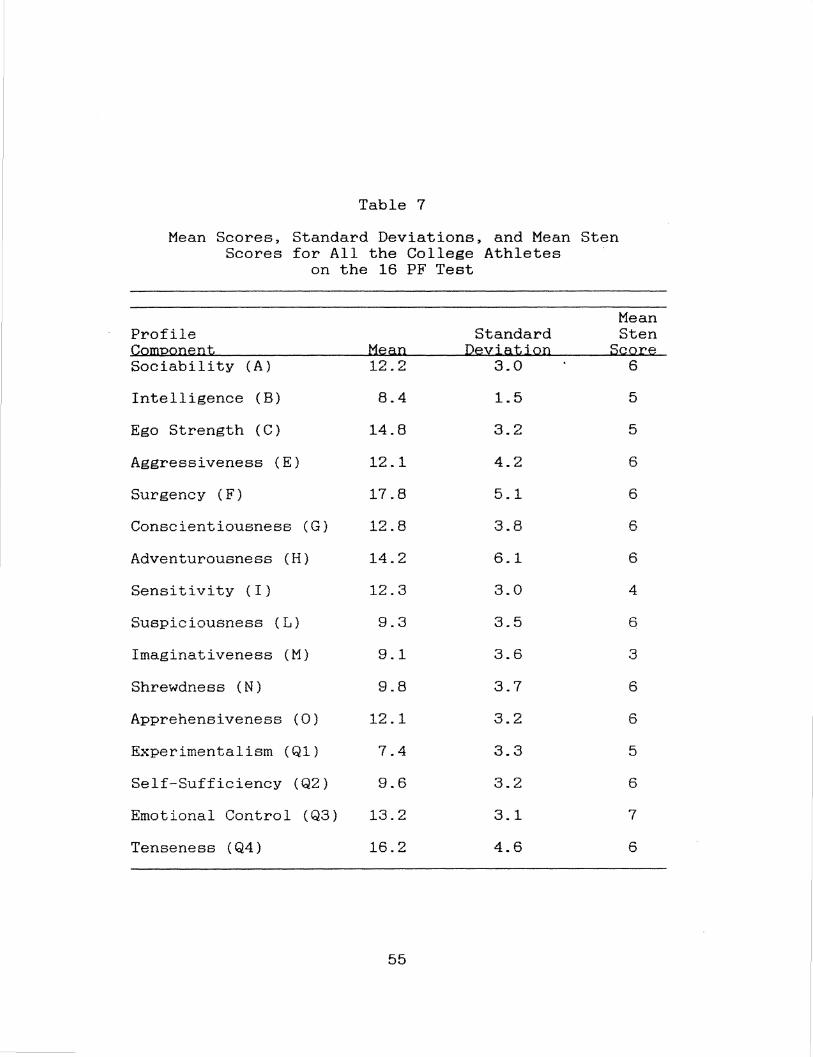
Table 7
Mean Scores, Standard Deviations, and Mean Sten Scores for All the College Athletes
on the 16 PF Test
Mean Profile Standard Sten CQm2Qnent Mean I2eYiatiQn SQQ re Sociability (A) 12.2 3.0 6
Intelligence ( B) 8.4 1.5 5
Ego Strength (C) 14.8 3.2 5
Aggressiveness (E) 12.1 4.2 6
Surgency (F) 17.8 5.1 6
Conscientiousness ( G) 12.8 3.8 6
Adventurousness (H) 14.2 6.1 6
Sensitivity (I) 12.3 3.0 4
Suspiciousness ( L) 9.3 3.5 6
Imaginativeness (M) 9.1 3.6 '::! •J
Shrewdness ( N) 9.8 3.7 6
Apprehensiveness ( 0) 12.1 3.2 6
Experimentalism (Ql) 7.4 3.3 5
Self-Sufficiency (Q2) 9.6 3.2 6
Emotional Control (Q3) 13.2 3.1 7
Tenseness (Q4) 16.2 4.6 6
55
Traits -1~--2~_.....3~_..4~_.....~_....~_._7~---'"'8~__..,_9~_..._1~0 Reserved vs. Outgoing (A)
Less Intelligent vs. More Intelligent (B)
Low Ego Strength vs. High Ego Strength (C)
Humble vs. Assertive (E)
Sober vs. Happy-GoLucky (F)
Expedient vs. Conscientious (G)
Shy vs. Venturesome (H)
Tough-Minded vs. Tender-Minded (I)
Trusting vs. Suspicious (L)
Practical vs. Imaginative (M)
Forthright vs. Shrewd (N)
Self-Assured vs. Apprehensive (0)
Conservative vs. Experimenting (Ql)
Group Dependent vs. Self-Sufficient (Q2)
Undisciplined Self-Conf lict vs. Controlled
Relaxed vs. Tense (Q4) 1 2 3 4 5 6 7 8 9 10
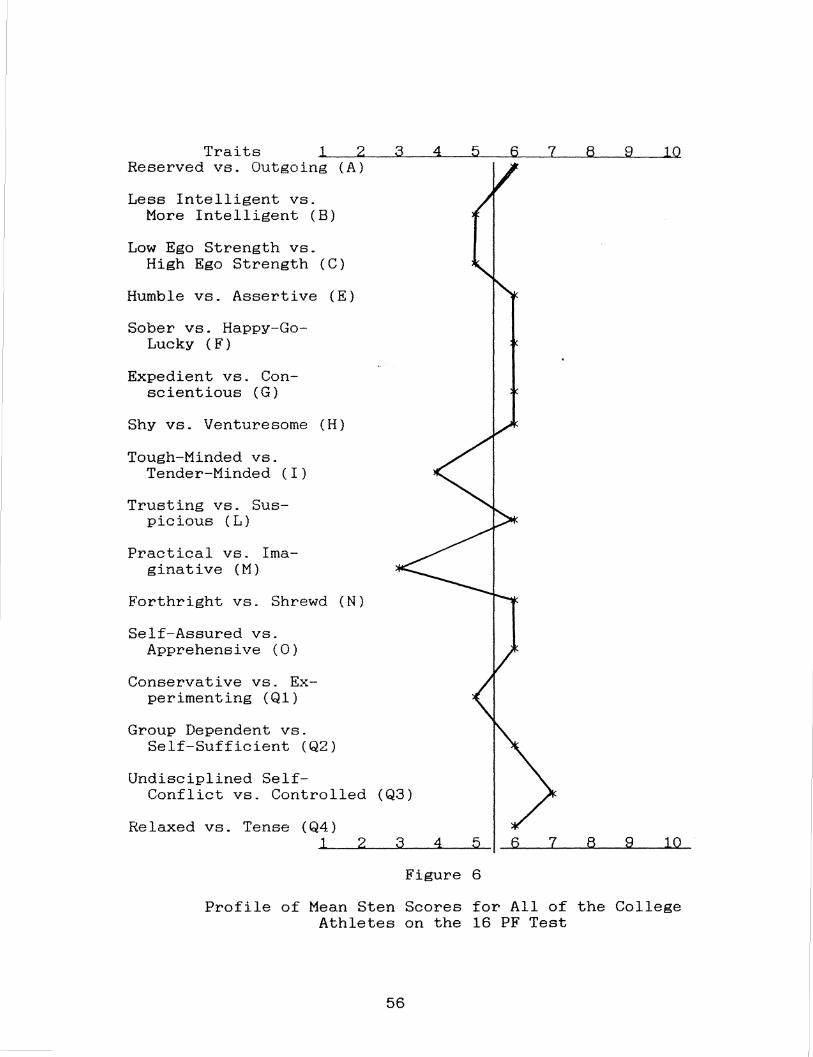
Figure 6
Profile of Mean Sten Scores for All of the College Athletes on the 16 PF Test
56
control (Factor Q3). They appear to be tough-
minded and have strong control of their emotions. They
strongly deviated from the norm on the trait of
imaginativeness (Factor M). The low score here shows
that they are anxious to do the right things, attentive
to practical matters, and subject to the dictation of
what is obviously possible.
Multivariate Analysis of Variance Between the
High School and College Level Athletes
The results of the multivariate analysis of
variance can be seen on Table 8. This statistical
procedure showed that there was a significant
difference between the two groups (F = .008, df = 16.00).
Two of the sixteen variables had a significant
difference (p = .05). These were intelligence (Factor
B) and emotional control (Factor Q3). Two other
variables, conscientiousness (Factor G) and
experimentalism (Factor Ql), approached statistical
significance (p = .01).
57
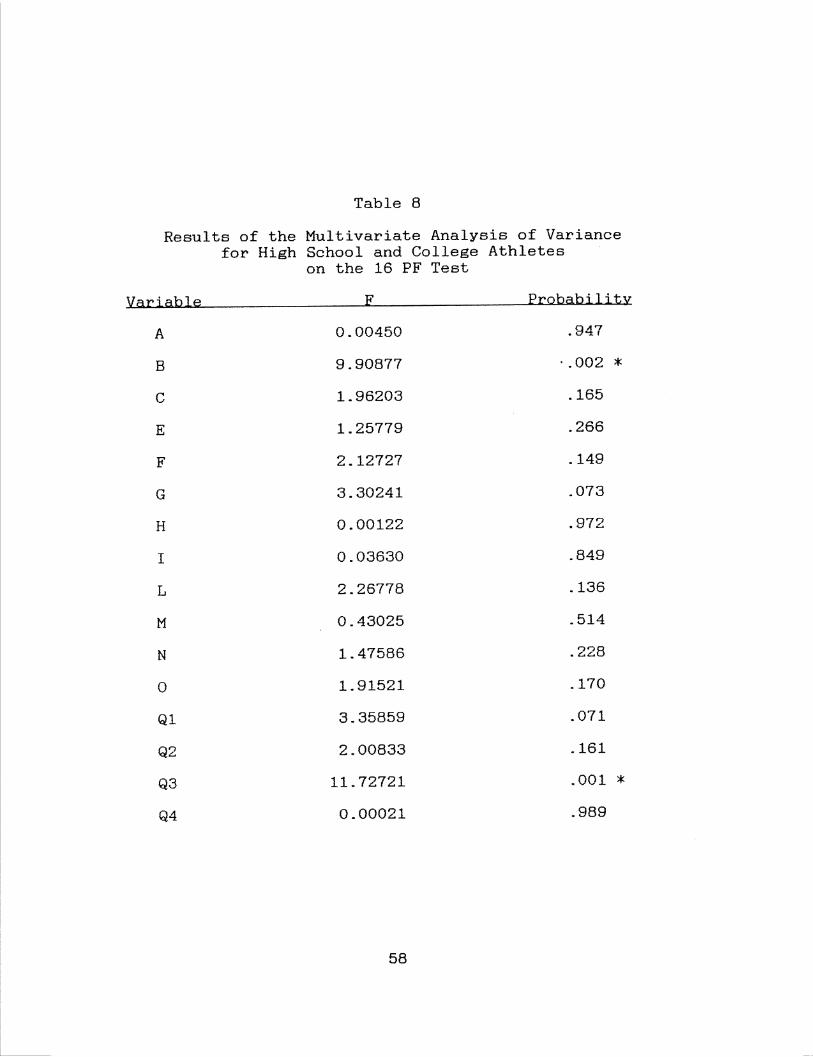
Table 8
Results of the Multivariate Analysis of Variance for High School and College Athletes
on the 16 PF Test
Variable F Probability
A 0.00450 .947
B 9.90877 .. 002 * c 1.96203 .165
E 1.25779 .266
F 2.12727 .149
G 3.30241 .073
H 0.00122 .972
I 0.03630 .849
L 2.26778 .136
M 0.43025 .514
N 1. 47586 .228
0 1.91521 .170
Ql 3.35859 .071
Q2 2.00833 .161
Q3 11. 72721 .001 * Q4 0.00021 .989
58
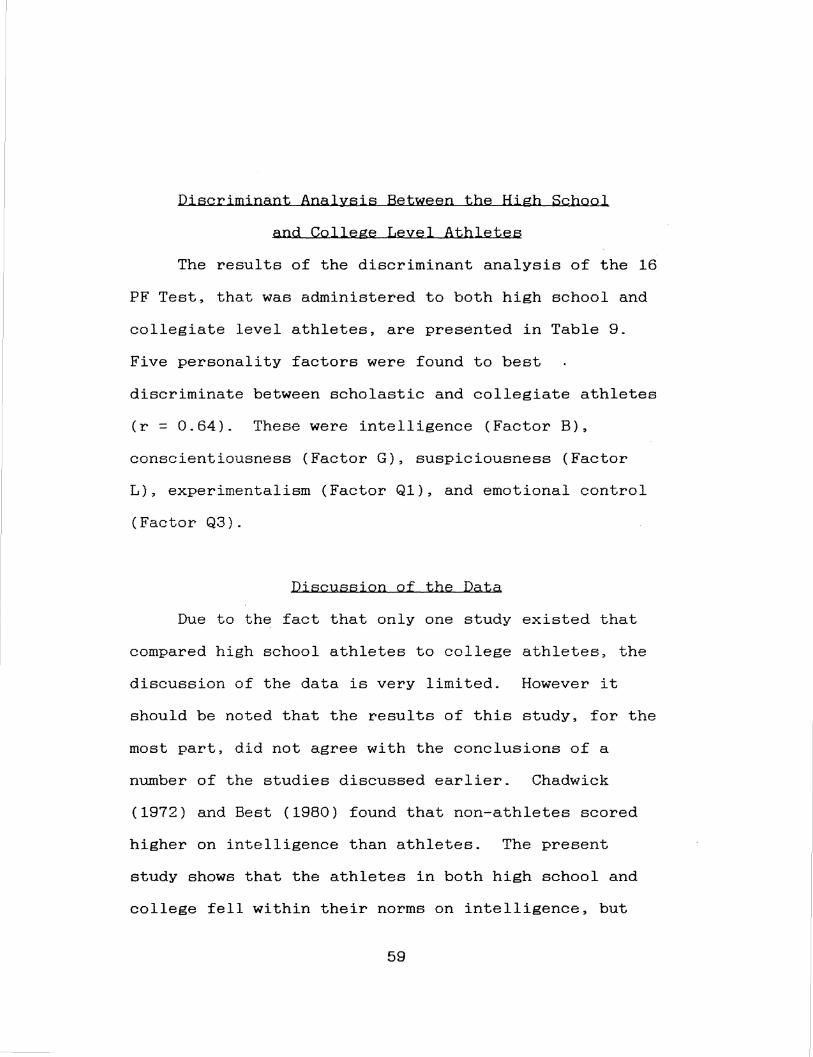
Discriminant Analvsis Between the High School
and College Level Athletes
The results of the discriminant analysis of the 16
PF Test, that was administered to both high school and
collegiate level athletes, are presented in Table 9.
Five personality factors were found to best
discriminate between scholastic and collegiate athletes
(r = 0.64). These were intelligence (Factor B),
conscientiousness (Factor G), suspiciousness (Factor
L), experimentalism (Factor Ql), and emotional control
{Factor Q3).
Discussion of the Data
Due to the fact that only one study existed that
compared high school athletes to college athletes, the
discussion of the data is very limited. However it
should be noted that the results of this study, for the
most part, did not agree with the conclusions of a
number of the studies discussed earlier. Chadwick
(1972) and Best {1980) found that non-athletes scored
higher on intelligence than athletes. The present
study shows that the athletes in both high school and
college fell within their norms on intelligence, but
59
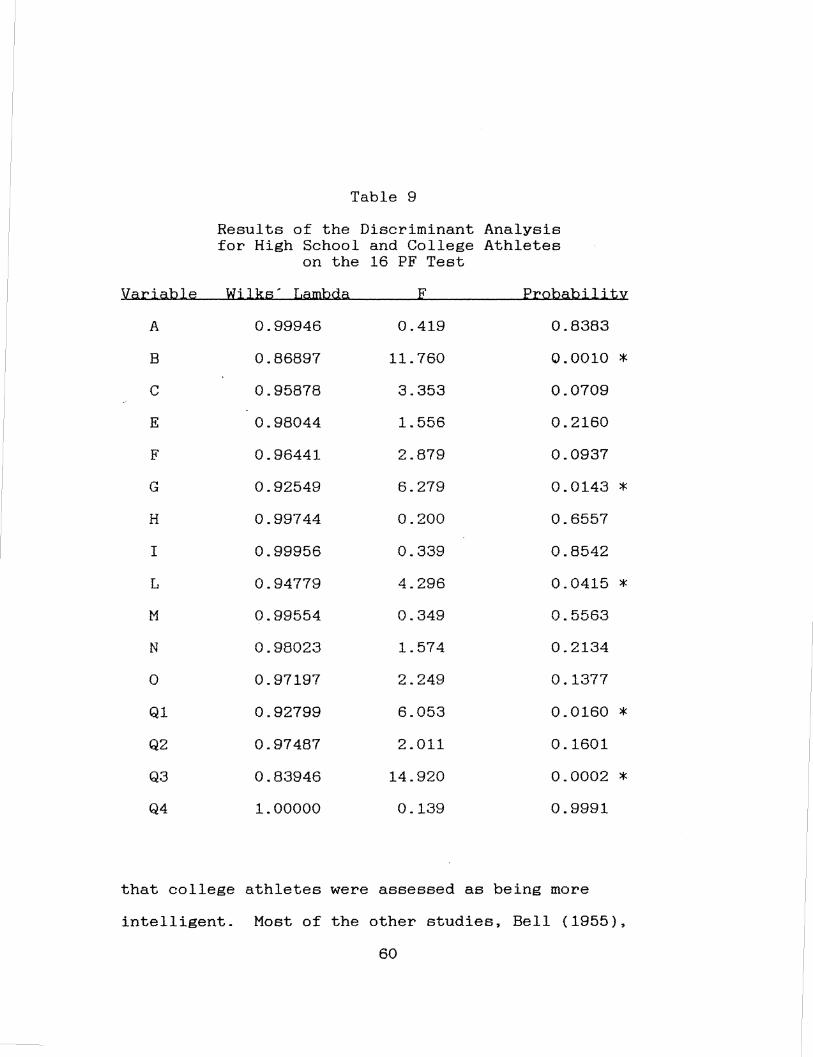
Table 9
Results of the Discriminant Analysis for High School and College Athletes
on the 16 PF Test
Variable Wilks' Lambda F Probability
A 0.99946 0.419 0.8383
B 0.86897 11.760 0.0010 * c 0.95878 3.353 0.0709
E 0.98044 1.556 0.2160
F 0.96441 2.879 0.0937
G 0.92549 6.279 0.0143 * H 0.99744 0.200 0.6557
I 0.99956 0.339 0.8542
L 0.94779 4.296 0.0415 * M 0.99554 0.349 0.5563
N 0.98023 1.574 0.2134
0 0.97197 2.249 0.1377
Ql 0.92799 6.053 0.0160 * Q2 0.97487 2.011 0.1601
Q3 0.83946 14.920 0.0002 * Q4 1.00000 0.139 0.9991
that college athletes were assessed as being more
intelligent. Most of the other studies, Bell (1955),
60
that college athletes were assessed as being more
intelligent. Most of the other studies, Bell (1955),
and Cooper (1969) however, compare different types of
groups than this study used; thus, it is difficult to
compare these results with results obtained comparing
athletes to non-athletes, etc.
As mentioned before, the two groups differed
significantly overall. The five factors that were
lowest in probability in the multivariate analysis of
variance and were significant in the discriminant
function were intelligence (Factor B),
conscientiousness (Factor G), suspiciousness (Factor
L), experimentalism (Factor Ql), and emotional control.
The high school athletes had a mean score of 7.1
in the area of intelligence. The college athletes had
a mean score of 8.4. Both of these scores fell into
the average when compared to the respective norms.
However, because the groups were being compared, the
college athletes were assessed as being more
intelligent than the high school athletes.
61
Factor G, conscientiousness, had the same outcome.
The high school athletes had a mean score of 11.0 and
the college athletes had a 12.8. Once again these fell
into the respective average categories when compared to
the norms provided. However, the high school athletes
were said to be more casual and lacking in ef iort for
group undertaking than the college athletes.
Suspiciousness had a different type of evaluation.
The high school athletes had a mean score of 11.0 and
the college athletes had a mean score of 9.3. In this
case the college athletes fell into the average when
compared to their norm, but the high school athletes
deviated slightly above their norm. The high school
athletes tend to be mistrusting and doubtful. They are
often involved in their own egos and are self
opinionated.
The high school athletes had a mean score of 9.1
in the area of experimentalism and the college athletes
had a score of 7.4. Once again they both fell into
their average population when compared to the
respective norms, but the high school athletes are said
to be more interested in intellectual matters and have
doubts on fundamental issues.
62
The last factor that was significant was emotional
control (Factor Q3). The high school athletes had a
mean score of 10.5 and the college athletes had a mean
score of 13.2. On this variable, the high school
athletes fell into their average population when
compared to the norms, but the college athletes
deviated slightly higher than their norm. Therefore,
the college athletes tend to have stronger control of
their emotions and general behavior, are inclined to be
more socially aware and careful, and have a higher
"self-respect" and high regard for social reputation.
Many things could explain why these particular
factors differed significantly. However, the overall
personalities of the coaches may determine why a
particular athlete's personality is attracted to a
personality type in a coach. Coaching personalities
and behaviors may have a definite effect on the
personality traits of athletes.
Recruitment is also a factor to be considered.
The fact that high school athletes are seldom recruited
and college athletes are, may also account for some
personality fifferences between high school and college
athletes. Perhaps, coaches look for specific traits;
63
or maybe only athletes possessing certain traits aspire
to become collegiate athletes. Such considerations
imply several reasons for the differences between high
school and college female athletes.
64
CHAPTER 5
SUMMARY, CONCLUSIONS AND RECOMMENDATIONS
The investigation was designed to compare the
personality traits that exist among female high school
athletes to female collegiate athletes.
Eighty athletes from either the high school or
college level were tested for the study. Forty-two of
them came form the high school level and thirty eight
of them came from the college level. They
participated in either basketball or softball at their
respective levels. The ages ranged from 15 - 22.
Form A of the Sixteen Personality Factor
Questionnaire, a consent from, and a personal
information questionnaire was completed by each of the
subjects. Following Cattell's recommendation, raw
scores were used for statistical analysis. Form A
answer sheets were hand scored by the investigator
using the respective scoring keys provided with the
tests. Results were then totaled and values for the
sixteen traits were assigned to each subject.
The SPSS (release 4) statistical package for the
IBM computer was used to calculate the mean scores,
standard deviations, discriminant analysis, and the
multivariate analysis of variance. A .05 level of
significance was selected to determine the significance
of the comparisons.
The mean scores were converted to sten scores
(standard ten) in relation to the norm tables provided.
There were separate norm tables for each age group.
Conclusions
The following conclusions relative to the.present
study have been made based on the acceptance of the
alternate hypotheses.
1. There is a significant difference between the
personalities of the high school athletes and
the college athletes ( = .05).
2. Five traits best discriminate between the two
groups of athletes.
3. The college athletes are assessed as being
more intelligent than the high school
athletes.
4. The high school athletes are characterized as
being more casual and lacking in effort for
group undertakings than the college athletes.
5. The high school athletes tend to be
mistrusting and doubtful. They could be said
to be involved with their own egos and were
66
more self opinionated than the college
athletes.
6. The high school athletes are shown to be more
interested in intellectual matters and had
more doubts on fundamental issues than the
college athletes.
7. The college athletes tend to have a stronger
control of their emotions and general
behavior, were inclined to be more socially
aware and careful, and evidenced what is
commonly termed "self-respect" and had a
higher regard for social reputation than the
high school athletes.
Recommendation
Based on the findings of the study, the following
recommendations have been made.
1. A similar study should be made that focuses on
a wider variety of athletes, one that takes into
consideration individual sports as well as team sport.
2. A similar investigation should be initiated
that takes into consideration more schools than just
those in Illinois.
67
3. Further studies should utilize a wider variety
of schools, variable in size, class or division.
4. Further studies should use a larger number of
subjects to get more randomness in their sample.
5. Other tests could be utilized along with the
Sixteen Personality Factor Questionnaire in order to
get more detailed information.
68

REFERENCES
69
REFERENCES
Ballinghoff, L. J. (1973). A Comparison of Selected Personality Factors of Female Secondary School Varsity Sports Participants (Master's thesis, 1972). Completed Research in HPER, .1.5., p. 7.
Bell, M. M. (1955). Measurement of Selected Otltcomes of Participation in Girls Athletics. High School Interscholastic Basketball Dissertation Abstracts, .1.5., 1544.
Best, L. (1980). Comparison of Personalitv Traits of Female Athletesand Non-Athletes at John Brown University. Unpublished master's thesis, Eastern Illinois University, Charleston.
Brasher, L. (1974). Personality Traits of Women Athletes at Bringham Young University. Unpublished master's thesis, Bringham Young University, Provo, Utah.
Cattell, R. B. (1965). The Scientific Analvsis of Personality (pp. 53-75). Maryland: Penguin Books.
Cattell, R. B. and Eber, H. W. (1957). Handbook for the Sixteen Personality Factor Questionnaire (p.4). Illinois: Illinois Personality Ability Testing.
Chadwick (1972). A Comparison of the Personality Traits and Kinesthetic Augmentation and Reduction of College Female Athletes and Non-Athletes. Unpublished doctoral dissertation, Florida State University, Tallahassee.
Charlisle, S. M. (1985). Relationship of Personality Characteristics and Performance Areas of Women Basketball Players in the Big State Conference of the 1984-1985 Season. Unpublished master's thesis, Southwest Texas State University, San Marcas.
70
Cooper, L. (1969). Athletes, Activity and Personality: A Review of Literature. Research Quarterly, .4Q, 17-22.
Foster, E. G. (1971). Personality Traits of Highlv Skilled Basketball and Softball Women Athlete. Unpublished doctoral dissertation, Indiana University, Bloomington.
Frost, R. B. (1971). Psychological Concepts Applied to Physical Education and Coaching (pp. 169-111). Massachusettes: Addison Wesley Publishing.
Fuoss, D. E. and Troppmann, R. J. (1981). Effective Coaching: A Psychological Approach (pp. 176-179). New York: John Wiley and Sons.
Gill, D. L. (1986). Psychological Dynamics of Sport (p. 30). Illinois: Human Kinetics Publishers.
Greendorfer, S. L. (Ed.). (1989). Future Directions for Women in Sport. Journal of Physical Education,
Recreation. and Dance, .6.Q, 31-31.
IPAT Staff (1986). Administrator's Manual for the Sixteen Personity Factor Questionnaire. Champaign: Institute of Personality and Ability Testing.
Malumphy, T. (1966). The Personalitv and General Characteristics of Women Athletes in Intercollegiate
Competition. Unpublished doctoral dissertation, Ohio University, Athens.
Malumphy, T. (1968). Personality of Women Athletes in Intercollegiate Competition. Research Quarterly, .3.9., 610-620.
Marks, R. E. (1971). A Study of Personality Factors of College Women Athletes. Unpublished master's thesis, Ithaca College, New York.
Moore, J. T. (1970). Personality Variables Between Selected Female High School Interscholastic Sports Participants. Unpublished master's thesis, Springfield College, Illinois.
71
Mushier, C. {1970). A Cross-Sectional Studv of the Personality Factors of Girls and Women in Competitive Lacrosse. Unpublished doctoral dissertation, University of Southern California, Los Angeles.
Neal, P. E. and Tutko, T. A. {1975). Coaching Girls and Women: Psycholgical Perspectives {p. 160). Massachusettes: Allyn and Bacon.
Niblock, M. W. {1960). Personality Traits and Intelligence Level of Female Athletes and NonParticipants from McNally High School. Unpublished doctoral dissertation, Pennsylvania State University, State College.
O'Connor, K. A. and Webb, J. L. {1976). Investigation of Personality Traits of College Female Athletes and Non-Athletes. Research Quarterly, £[, 203-210.
Ogilivie, B. {1967). The unanswered Question: Competition - It's Effect Upon Femininity (pp. 3-4). Address to the Olympic Development Committee, Santa Barbara, California.
Pestonjee, D. M., Singh, R. B., Singh, A. P., and Singh, U. B. (1981). Personality and Physical Abilities: An Empirical Investigation. International Journal of Sport Psychology, .12, 39-51.
Petersen, S., Weber, J. C., and Trousdale, W. (1967). Personality Traits of Women in Team Sport Versus women in Individual Sports. Research Quarterly, .aB., 686-690.
Radar, B. G. (1983). American Sports: From the ages of Folk Games to the Age of Spectator. New Jersey: Prentice Hall.
Rennecker C. A. {1970). Personalitv Traits of Selected Women Intercollegiate Athletes. Unpublished master's thesis, Illinois State University, Normal.
72
Rusch J. M. (1972). Personalitv Traits and Sports Participation of Adult Women. Unpublished master's thesis, University of Texas, El Paso.
Rushall, B. S. ( 1969). The Demonstration and Evalnatir-;n of a Research Model for the Investigation of the Relationship Between Personality and Physical Performance Categories. Unpublished doctoral dissertation, Indiana University, Bloomington.
Schendel J. (1965). Psychological Differences.Between Athletes and Non-Participants in Athletics at Three Educational Levels. Research Quarterly, .3.Q, 32-67.
Shafor L. K. (1971). Personality Trait Differences Between High School Female Athletes in Team and Individual Sports. Unpublished master's thesis, California State University, Long Beach.
V~nsk; M. and Cratty; B. (1970). Paycholo~y and the Superior Athlete. New York: MacMillan.
Warburton, F. W., and Kane, J. E. (1968). Personality Related to Sport and Physical Ability. Readings in Physical Education (pp. 61-89). London: Education Association.
Whiting, H. T. A., Hardman, K., Hendry, L. B., and Jones, M. G. (1973). Personality and Performance in Physical Education and Sport. London: Henry Kimpton Publishers.
73

APPENDICES
74
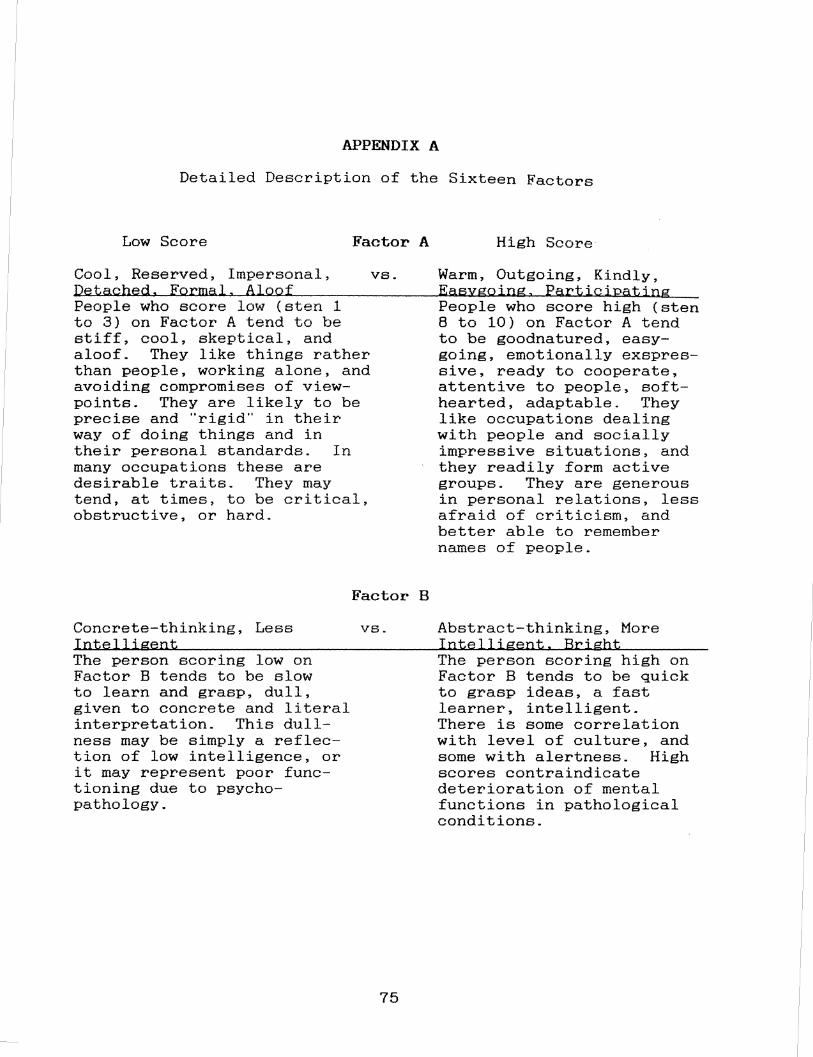
APPENDIX A
Detailed Description of the Sixteen Factors
Low Score Factor A
Cool, Reserved, Impersonal, vs. Detached. Formal. Aloof People who score low (sten 1 to 3) on Factor A tend to be stiff, cool, skeptical, and aloof. They like things rather than people, working alone, and avoiding compromises of viewpoints. They are likely to be precise and "rigid" in their way of doing things and in their personal standards. In many occupations these are desirable traits. They may tend, at times, to be critical, obstructive, or hard.
Factor B
Concrete-thinking, Less vs. Intelligent The person scoring low on Factor B tends to be slow to learn and grasp, dull, given to concrete and literal interpretation. This dullness may be simply a ref lect ion of low intelligence, or it may represent poor functioning due to psychopathology.
75
High Score
Warm, Outgoing, Kindly, Easygoing, Participating People who score high (sten 8 to 10) on Factor A tend to be goodnatured, easygoing, emotionally exspressive, ready to cooperate, attentive to people, softhearted, adaptable. They like occupations dealing with people and socially impressive situations, and they readily form active groups. They are generous in personal relations, less afraid of criticism, and better able to remember names of people.
Abstract-thinking, More Intelligent. Bright The person scoring high on Factor B tends to be quick to grasp ideas, a fast learner, intelligent. There is some correlation with level of culture, and some with alertness. High scores contraindicate deterioration of mental functions in pathological conditions.
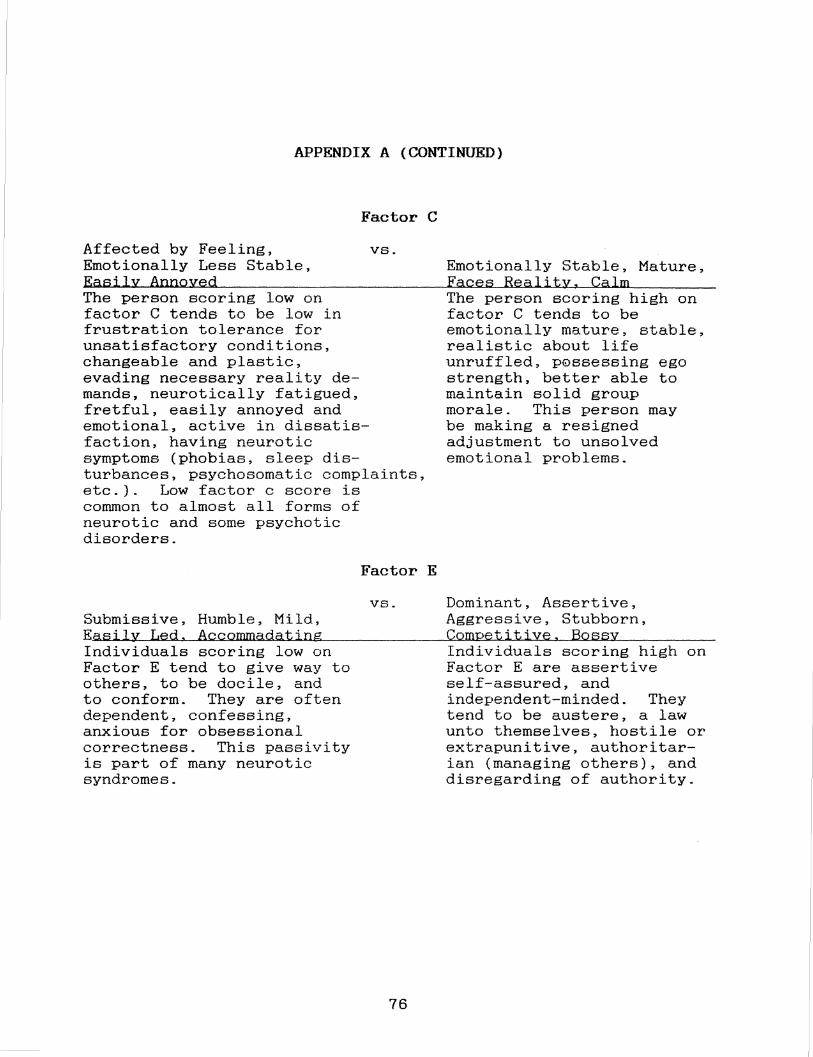
APPENDIX A (CONTINUED)
Factor C
Affected by Feeling, vs. Emotionally Less Stable, Easily Annoyed The person scoring low on factor C tends to be low in frustration tolerance for unsatisfactory conditions, changeable and plastic, evading necessary reality de-mands, neurotically fatigued, fretful, easily annoyed and emotional, active in dissatisfaction, having neurotic symptoms (phobias, sleep disturbances, psychosomatic complaints, etc.). Low factor c score is common to almost all forms of neurotic and some psychotic disorders.
Submissive, Humble, Mild, Easily Led, Accomroadating Individuals scoring low on Factor E tend to give way to others, to be docile, and to conform. They are often dependent, confessing, anxious for obsessional correctness. This passivity is part of many neurotic syndromes.
Factor E
VS.
76
Emotionally Stable, Mature, Faces Reality, Calm The person scoring high on factor C tends to be emotionally mature, stable, realistic about life unruffled, p0ssessing ego strength, better able to maintain solid group morale. This person may be making a resigned adjustment to unsolved emotional problems.
Dominant, Assertive, Aggressive, Stubborn, Competitive, Bossy Individuals scoring high on Factor E are assertive self-assured, and independent-minded. They tend to be austere, a law unto themselves, hostile or extrapunitive, authoritarian (managing others), and disregarding of authority.
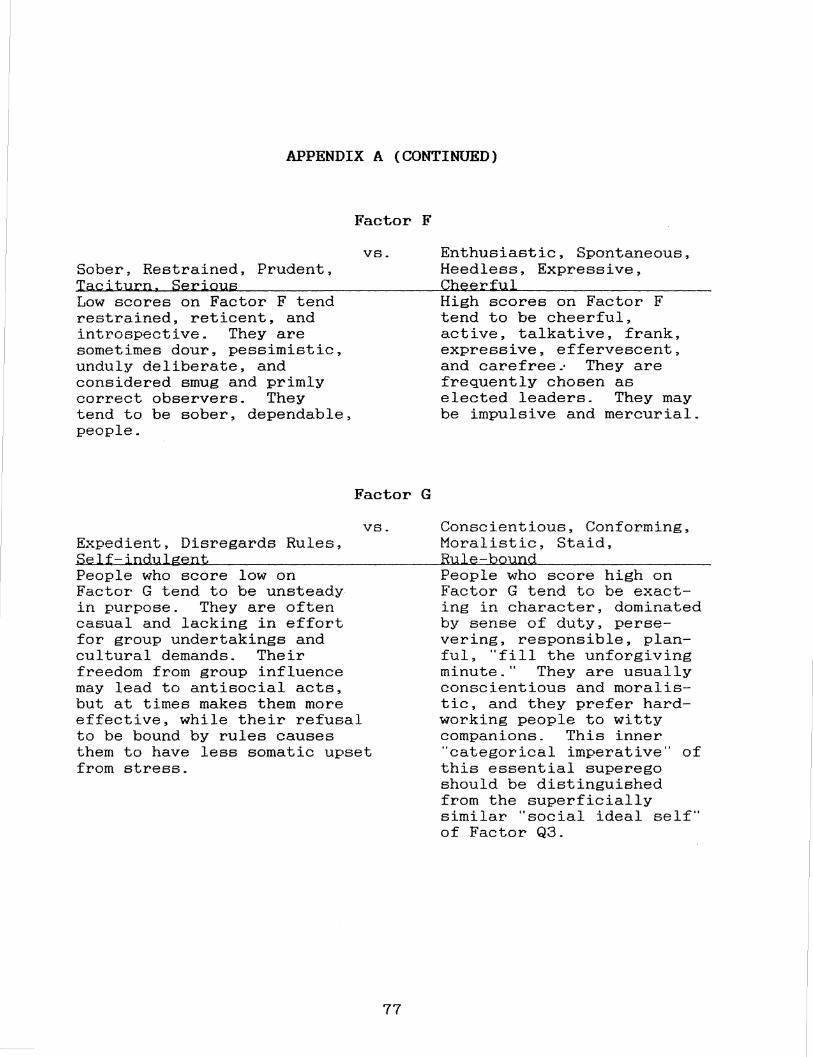
APPENDIX A (CONTINUED)
Factor F
VS.
Sober, Restrained, Prudent, Taciturn. Serious Low scores on Factor F tend restrained, reticent, and introspective. They are sometimes dour, pessimistic, unduly deliberate, and considered smug and primly correct observers. They tend to be sober, dependable, people.
Factor G
vs. Expedient, Disregards Rules, Self-indulgent People who score low on Factor G tend to be unsteady in purpose. They are often casual and lacking in effort for group undertakings and cultural demands. Their freedom from group influence may lead to antisocial acts, but at times makes them more effective, while their refusal to be bound by rules causes them to have less somatic upset from stress.
77
Enthusiastic, Spontaneous, Heedless, Expressive, Cheerful High scores on Factor F tend to be cheerful, active, talkative, frank, expressive, effervescent, and carefree~ They are frequently chosen as elected leaders. They may be impulsive and mercurial.
Conscientious, Conforming, Moralistic, Staid, Rule-bound People who score high on Factor G tend to be exacting in character, dominated by sense of duty, persevering, responsible, planful, "fill the unforgiving minute." They are usually conscientious and moralistic, and they prefer hardworking people to witty companions. This inner "categorical imperative" of this essential superego should be distinguished from the superficially similar "social ideal self" of Factor Q3.
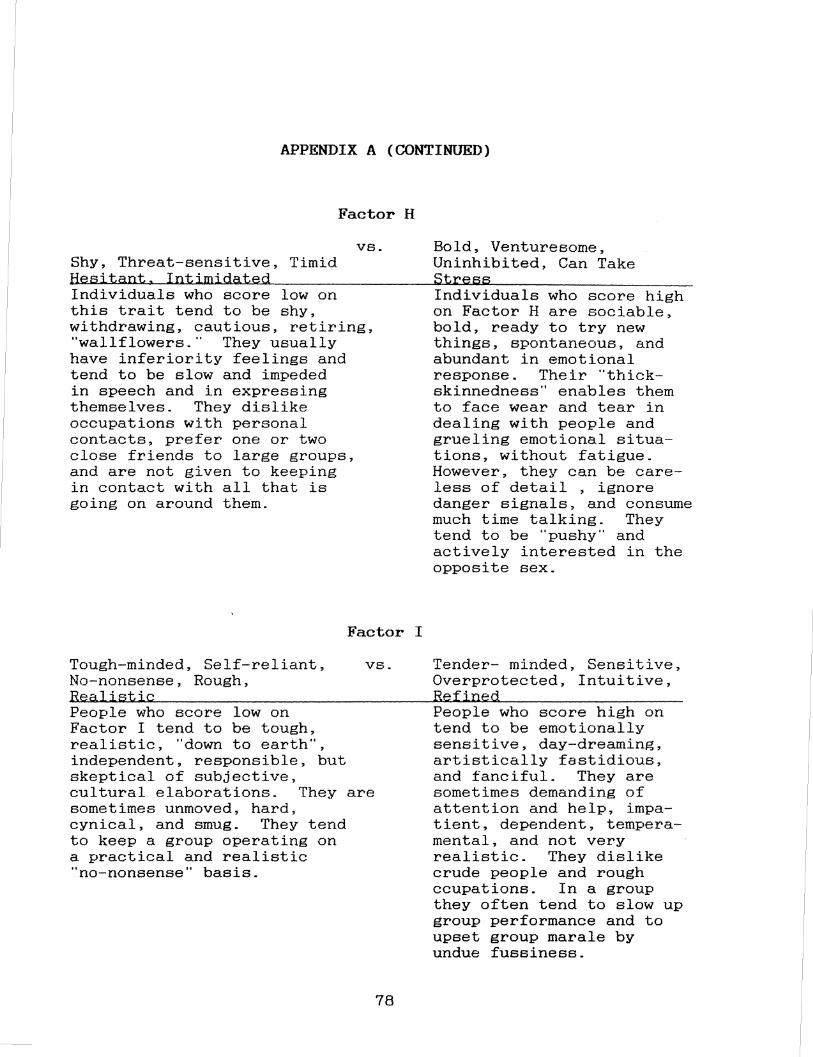
APPENDIX A {CONTINUED)
Factor H
vs. Shy, Threat-sensitive, Timid Hesitant. Intimidated Individuals who score low on this trait tend to be shy, withdrawing, cautious, retiring, "wallflowers." They usually have inferiority feelings and tend to be slow and impeded in speech and in expressing themselves. They dislike occupations with personal contacts, prefer one or two close friends to large groups, and are not given to keeping in contact with all that is going on around them.
Factor I
Tough-minded, Self-reliant, vs. No-nonsense, Rough, Realistic People who score low on Factor I tend to be tough, realistic, "down to earth", independent, responsible, but skeptical of subjective, cultural elaborations. They are sometimes unmoved, hard, cynical, and smug. They tend to keep a group operating on a practical and realistic
no-nonsense" basis.
78
Bold, Venturesome, Uninhibited, Can Take Stress Individuals who score high on Factor H are sociable, bold, ready to try new things, spontaneous, and abundant in emotional response. Their "thickskinnedness" enables them to face wear and tear in dealing with people and grueling emotional situations, without fatigue. However, they can be careless of detail , ignore danger signals, and consume much time talking. They tend to be "pushy" and actively interested in the opposite sex.
Tender- minded, Sensitive, Overprotected, Intuitive, Refined People who score high on tend to be emotionally sensitive, day-dreaming, artistically fastidious, and fanciful. They are sometimes demanding of attention and help, impatient, dependent, temperamental, and not very realistic. They dislike crude people and rough ccupations. In a group they often tend to slow up group performance and to upset group marale by undue fussiness.
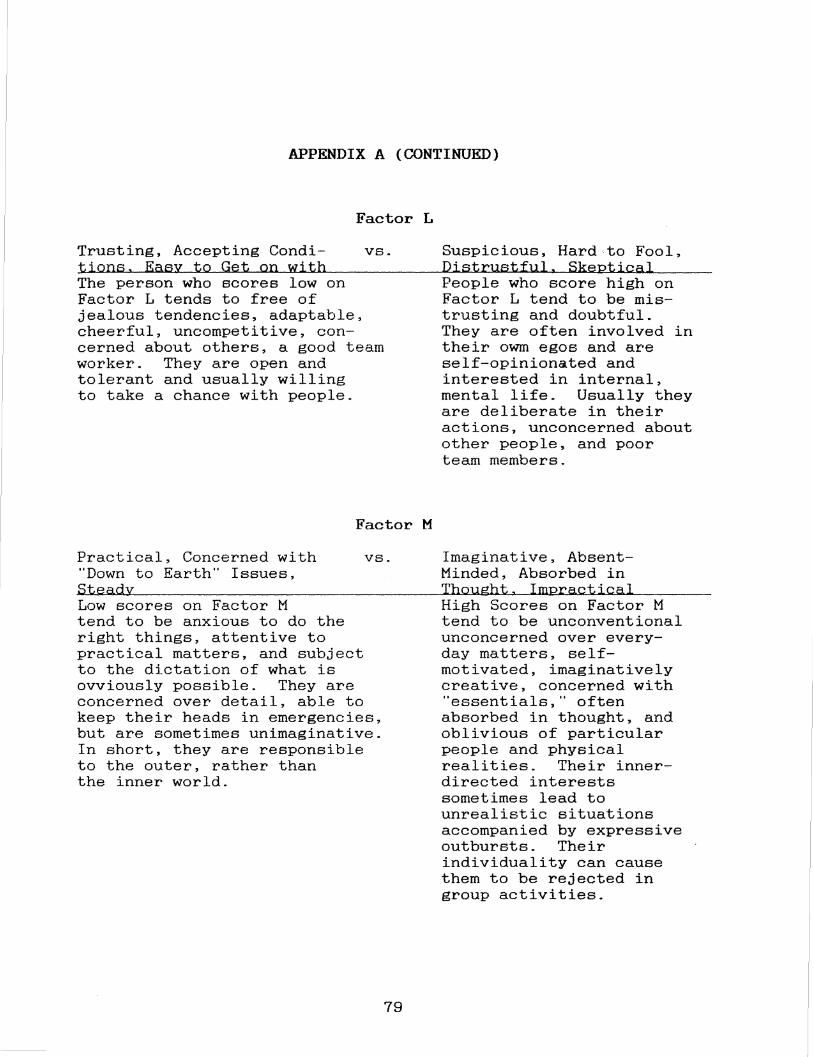
APPENDIX A (CONTINUED)
Factor L
Trusting, Accepting Condi- vs. tions. Easy to Get on with The person who scores low on Factor L tends to free of jealous tendencies, adaptable, cheerful, uncompetitive, concerned about others, a good team worker. They are open and tolerant and usually willing to take a chance with people.
Factor M
Practical, Concerned with vs. "Down to Earth" Issues, Steady Low scores on Factor M tend to be anxious to do the right things, attentive to practical matters, and subject to the dictation of what is ovviously possible. They are concerned over detail, able to keep their heads in emergencies, but are sometimes unimaginative. In short, they are responsible to the outer, rather than the inner world.
79
Suspicious, Hard to Fool, Distrustful. Skeptical People who score high on Factor L tend to be mistrusting and doubtful. They are often involved in their owm egos and are self-opinionated and interested in internal, mental life. Usually they are deliberate in their actions, unconcerned about other people, and poor team members.
Imaginative, AbsentMinded, Absorbed in Thought. Impractical High Scores on Factor M tend to be unconventional unconcerned over everyday matters, selfmotivated, imaginatively creative, concerned with "essentials," often absorbed in thought, and oblivious of particular people and physical realities. Their innerdirected interests sometimes lead to unrealistic situations accompanied by expressive outbursts. Their individuality can cause them to be rejected in group activities.
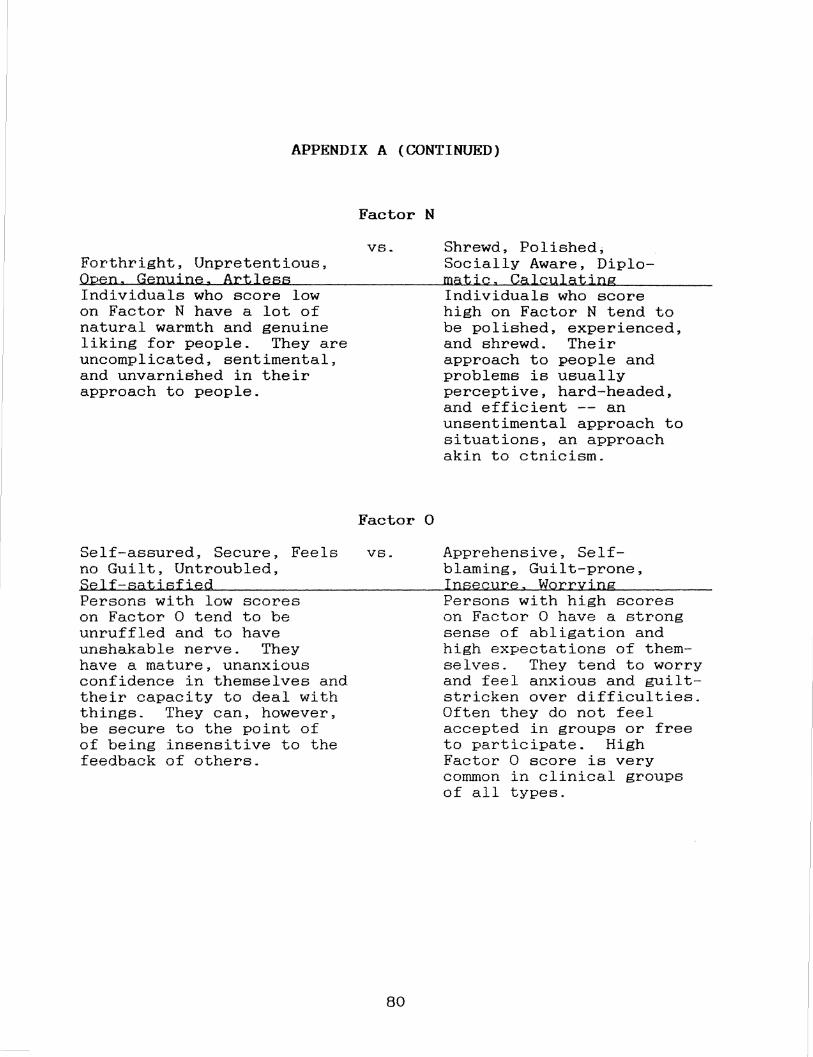
APPENDIX A (CONTINUED)
Forthright, Unpretentious, Open. Genuine. Artless Individuals who score low on Factor N have a lot of natural warmth and genuine liking for people. They are uncomplicated, sentimental, and unvarnished in their approach to people.
Factor N
vs.
Factor 0
Self-assured, Secure, Feels vs. no Guilt, Untroubled, Self-satisfied Persons with low scores on Factor 0 tend to be unruffled and to have unshakable nerve. They have a mature, unanxious confidence in themselves and their capacity to deal with things. They can, however, be secure to the point of of being insensitive to the feedback of others.
80
Shrewd, Polished; Socially Aware, Diplomatic. Calculating Individuals who score high on Factor N tend to be polished, experienced, and shrewd. Their approach to people and problems is usually perceptive, hard-headed, and efficient -- an unsentimental approach to situations, an approach akin to ctnicism.
Apprehensive, Selfblaming, Guilt-prone, Insecure. Worrying Persons with high scores on Factor 0 have a strong sense of abligation and high expectations of themselves. They tend to worry and feel anxious and guiltstricken over difficulties. Often they do not feel accepted in groups or free to participate. High Factor 0 score is very common in clinical groups of all types.
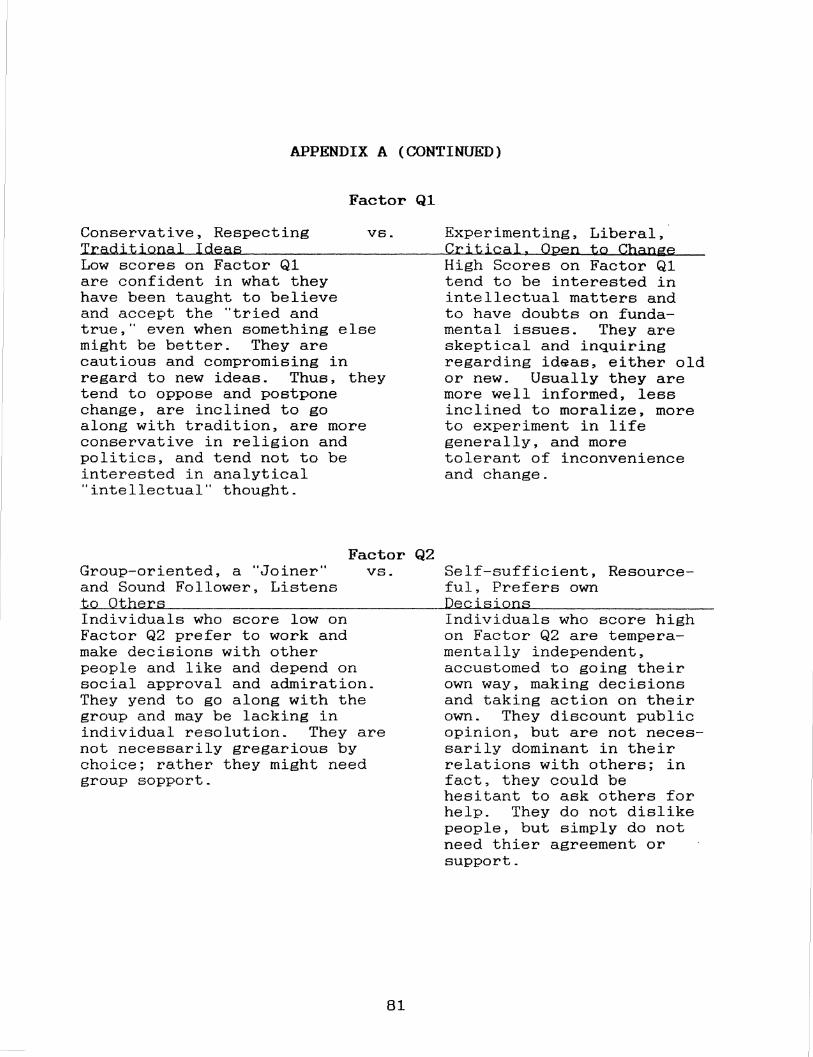
APPENDIX A (CONTINUED)
Factor Ql
Conservative, Respecting vs. Traditional Ideas Low scores on Factor Ql are confident in what they have been taught to believe and accept the "tried and true," even when something else might be better. They are cautious and compromising in regard to new ideas. Thus, they tend to oppose and postpone change, are inclined to go along with tradition, are more conservative in religion and politics, and tend not to be interested in analytical "intellectual" thought.
Factor Q2 Group-oriented, a "Joiner" vs. and Sound Follower, Listens to Others Individuals who score low on Factor Q2 prefer to work and make decisions with other people and like and depend on social approval and admiration. They yend to go along with the group and may be lacking in individual resolution. They are not necessarily gregarious by choice; rather they might need group sopport.
81
Experimenting, Liberal, Critical, Open to Change High Scores on Factor Ql tend to be interested in intellectual matters and to have doubts on fundamental issues. They are skeptical and inquiring regarding id~as, either old or new. Usually they are more w~ll informed, less inclined to moralize, more to experiment in life generally, and more tolerant of inconvenience and change.
Self-sufficient, Resourceful, Prefers own Decisions Individuals who score high on Factor Q2 are temperamentally independent, accustomed to going their own way, making decisions and taking action on their own. They discount public opinion, but are not necessarily dominant in their relations with others; in fact, they could be hesitant to ask others for help. They do not dislike people, but simply do not need thier agreement or support.
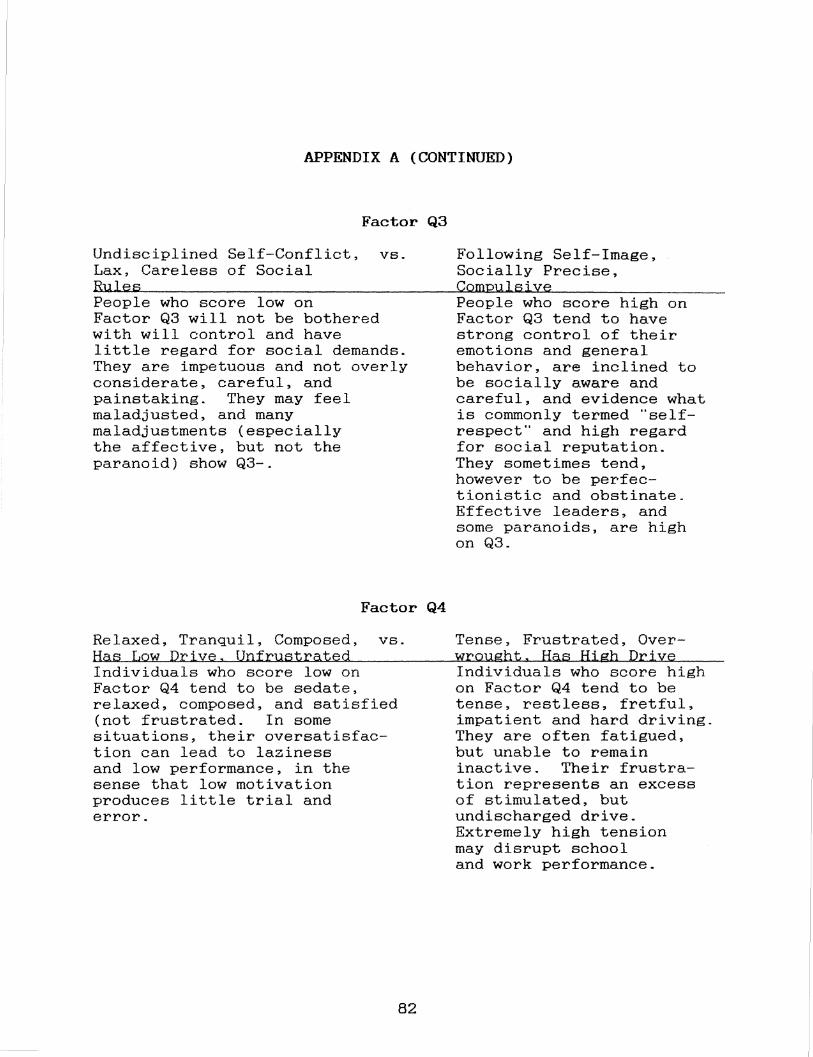
APPENDIX A (CONTINUED)
Factor Q3
Undisciplined Self-Conflict, vs. Lax, Careless of Social Rules People who score low on Factor Q3 will not be bothered with will control and have little regard for social demands. They are impetuous and not overly considerate, careful, and painstaking. They may feel maladjusted, and many maladjustments (especially the affective, but not the paranoid) show Q3-.
Factor Q4
Relaxed, Tranquil, Composed, vs. Has Low Drive. Unfrustrated Individuals who score low on Factor Q4 tend to be sedate, relaxed, composed, and satisfied (not frustrated. In some situations, their oversatisfaction can lead to laziness and low performance, in the sense that low motivation produces little trial and error.
82
Following Self-Image, Socially Precise, Compulsive People who score high on Factor Q3 tend to have strong control of their emotions and general behavior, are inclined to be socially aware and careful, and evidence what is commonly termed "selfrespect" and high regard for social reputation. They sometimes tend, however to be perf ec-t ionist ic and obstinate. Effective leaders, and some paranoids, are high on Q3.
Tense, Frustrated, Overwrought. Has High Drive Individuals who score high on Factor Q4 tend to be tense, restless, fretful, impatient and hard driving. They are often fatigued, but unable to remain inactive. Their frustration represents an excess of stimulated, but undischarged drive. Extremely high tension may disrupt school and work performance.
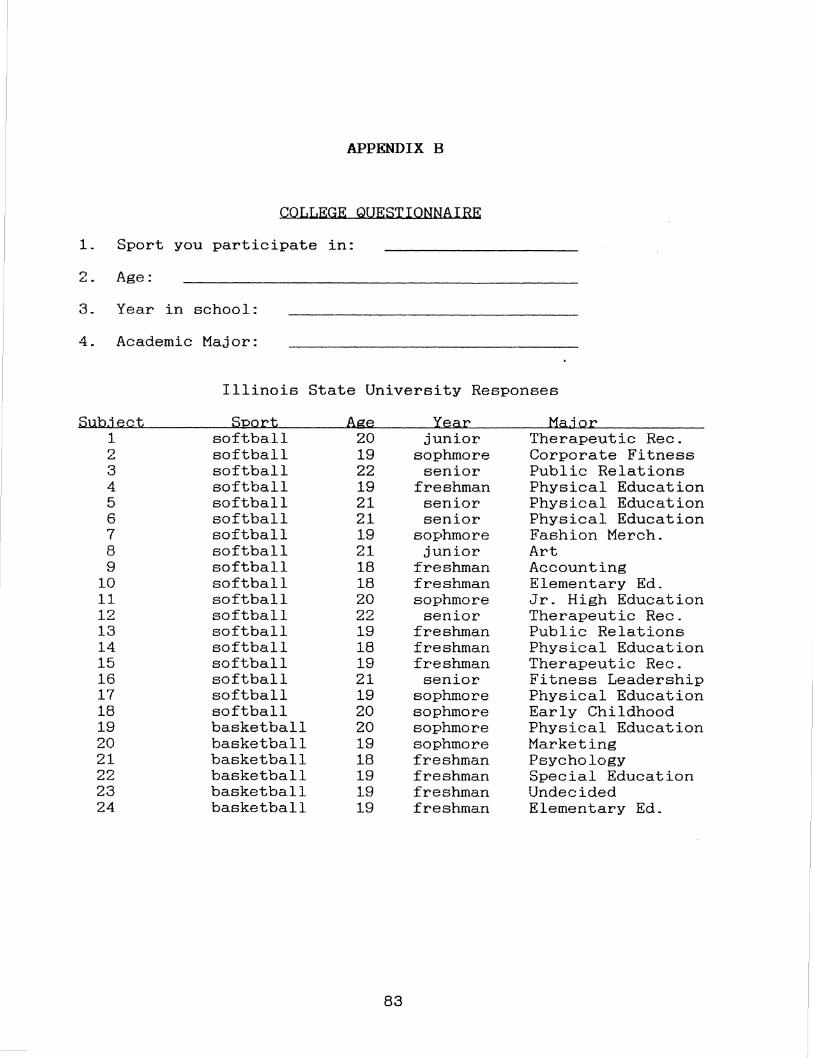
APPENDIX B
COLLEGE QUESTIONNAIRE
1. Sport you participate in:
2. Age:
3. Year in school:
4. Academic Major:
Illinois State University Responses
Sub.ject St!Qrt Age Year Maj Qr 1 softball 20 junior Therapeutic Rec. ., softball 19 sophmore Corporate Fitness .::..
3 softball 22 senior Public Relations 4 softball 19 freshman Physical Education 5 softball 21 senior Physical Education 6 softball 21 senior Physical Education 7 softball 19 sophmore Fashion Merch. 8 softball 21 junior Art 9 softball 18 freshman Accounting
10 softball 18 freshman Elementary Ed. 11 softball 20 sophmore Jr. High Education 12 softball 22 senior Therapeutic Rec. 13 softball 19 freshman Public Relations 14 softball 18 freshman Physical Education 15 softball 19 freshman Therapeutic Rec. 16 softball 21 senior Fitness Leadership 17 softball 19 sophmore Physical Education 18 softball 20 sophmore Early Childhood 19 basketball 20 sophmore Physical Education 20 basketball 19 sophmore Marketing 21 basketball 18 freshman Psychology 22 basketball 19 freshman Special Education 23 basketball 19 freshman Undecided 24 basketball 19 freshman Elementary Ed.
83
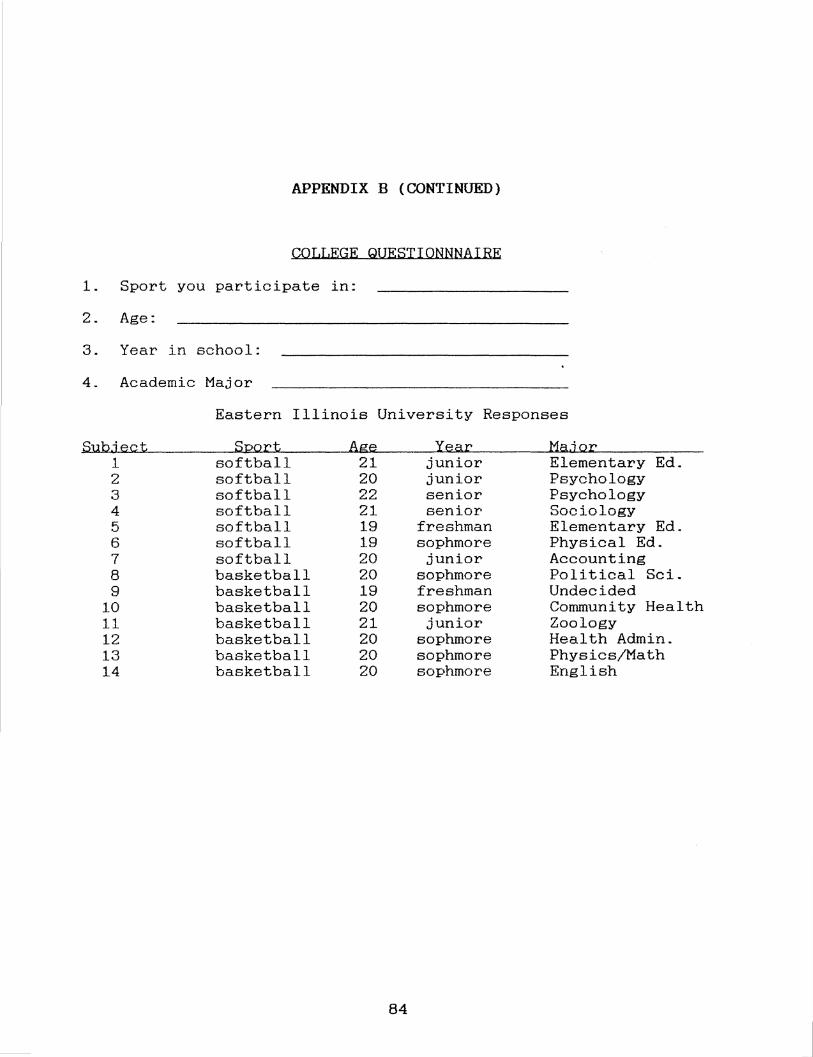
APPENDIX B {CONTINUED)
COLLEGE QUESTIONNNAIRE
1. Sport you participate in:
2. Age:
3. Year in school:
4. Academic Major
Eastern Illinois University Responses
S:ubjeQt S12Qrt 8ge Year Ma.jQr 1 softball 21 junior Elementary Ed. 2 softball 20 junior Psychology 3 softball 22 senior Psychology 4 softball 21 senior Sociology 5 softball 19 freshman Elementary Ed. 6 softball 19 sophmore Physical Ed. 7 softball 20 junior Accounting 8 basketball 20 sophmore Political Sci. g basketball 19 freshman Undecided
10 basketball 20 sophmore Community Health 11 basketball 21 junior Zoology 12 basketball 20 sophmore Health Admin. 13 basketball 20 sophmore Physics/Math 14 basketball 20 sophmore English
84
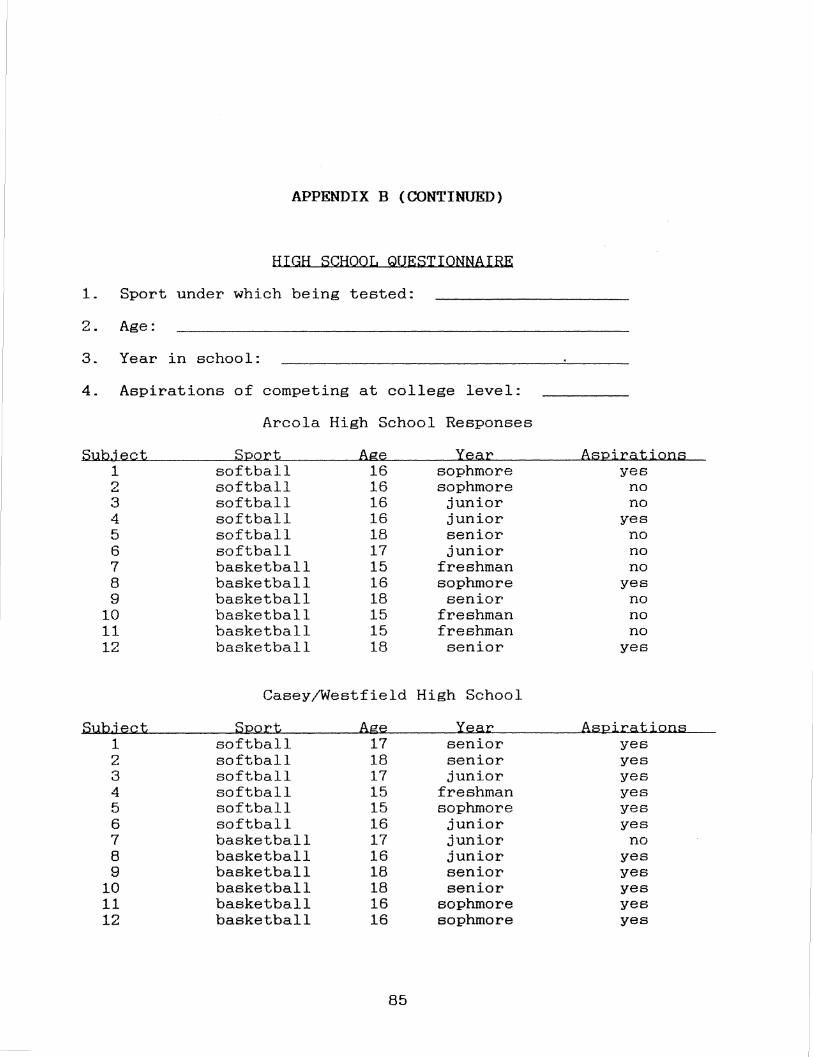
APPENDIX B (CONTINUED)
HIGH SCHOOL QUESTIONNAIRE
1. Sport under which being tested:
2. Age:
3. Year in school:
4. Aspirations of competing at college level:
Subject 1 2 3 4 5 6 7 8 9
10 11 12
Subject 1 2 3 4 5 6 7 8 9
10 11 12
Arcola High School Responses
Sport Age Year softball 16 sophmore softball 16 sophmore softball 16 junior softball 16 junior softball 18 senior softball 17 junior basketball 15 freshman basketball 16 sophmore basketball 18 senior basketball 15 freshman basketball 15 freshman basketball 18 senior
Casey/Westfield High School
Sport Age Year softball 17 senior softball 18 senior softball 17 junior softball 15 freshman softball 15 sophmore softball 16 junior basketball 17 junior basketball 16 junior basketball 18 senior basketball 18 senior basketball 16 sophmore basketball 16 sophmore
85
Aspirations yes
no no
yes no no no
yes no no no
yes
Aspirations yes yes yes yes yes yes
no yes yes yes yes yes
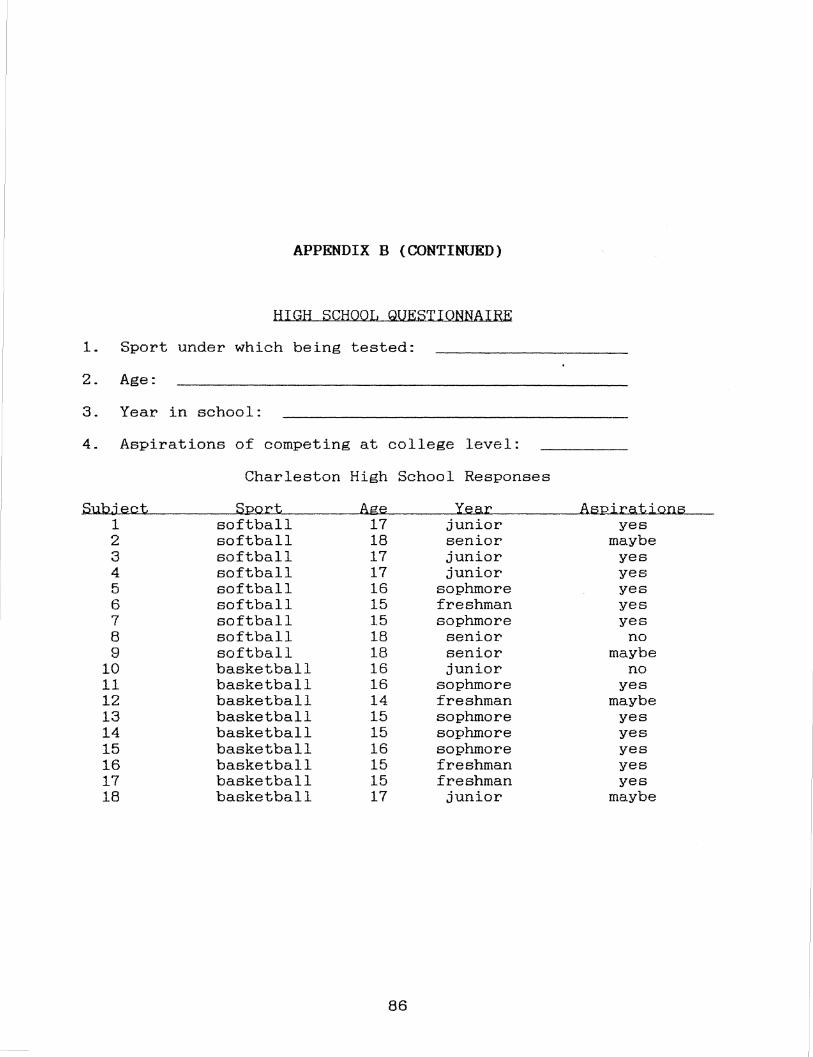
APPENDIX B {CONTINUED)
HIGH SCHOOL QUESTIONNAIRE
1. Sport under which being tested:
2. Age:
3. Year in school:
4. Aspirations of competing at college level:
Charleston High School Responses
Subject Sport Age Year Aspirations 1 softball 17 junior yes 2 softball 18 senior maybe 3 softball 17 junior yes 4 softball 17 junior yes 5 softball 16 sophmore yes 6 softball 15 freshman yes 7 softball 15 sophmore yes 8 softball 18 senior no 9 softball 18 senior maybe
10 basketball 16 junior no 11 basketball 16 sophmore yes 12 basketball 14 freshman maybe 13 basketball 15 sophmore yes 14 basketball 15 sophmore yes 15 basketball 16 sophmore yes 16 basketball 15 freshman yes 17 basketball 15 freshman yes 18 basketball 17 junior maybe
86
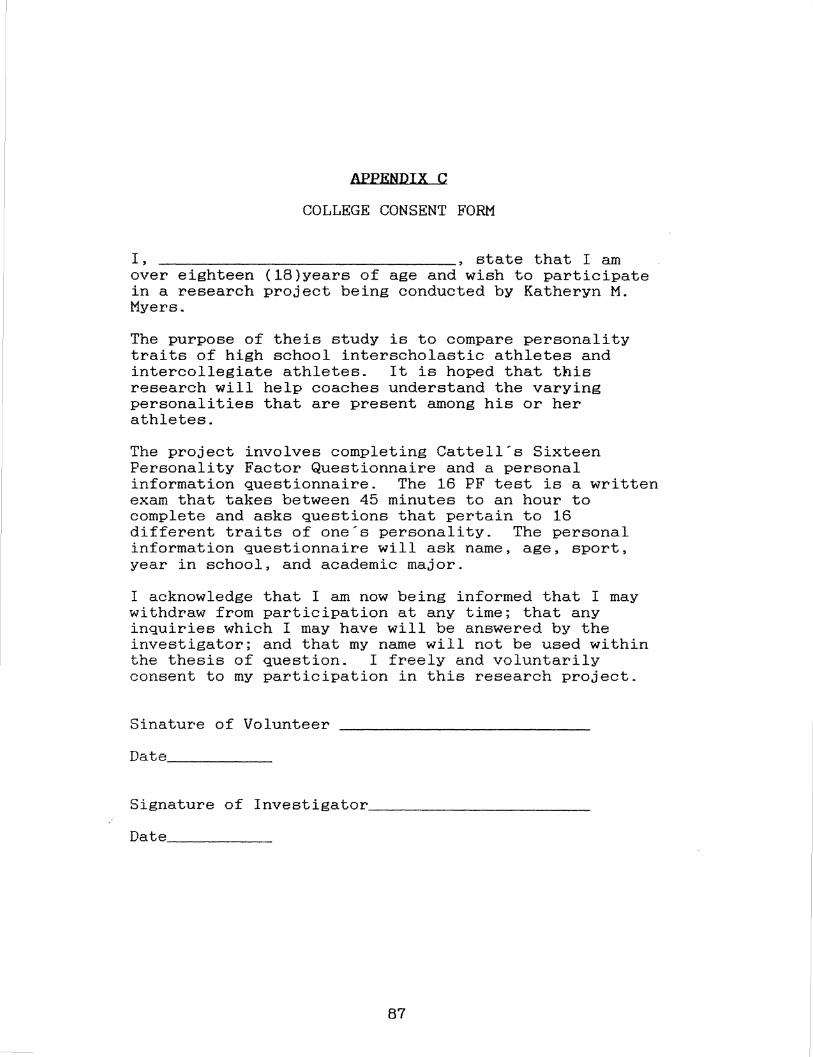
APPENDIX C
COLLEGE CONSENT FORM
I , ~~~~~~~~~~~~~~~~~• state that I am over eighteen in a research Myers.
(18)years of age and wish to participate project being conducted by Katheryn M.
The purpose of theis study is to compare personality traits of high school interscholastic athletes and intercollegiate athletes. It is hoped that this research will help coaches understand the varying personalities that are present among his or her athletes.
The project involves completing Cattell's Sixteen Personality Factor Questionnaire and a personal information questionnaire. The 16 PF test is a written exam that takes between 45 minutes to an hour to complete and asks questions that pertain to 16 different traits of one's personality. The personal information questionnaire will ask name, age, sport, year in school, and academic major.
I acknowledge that I am now being informed that I may withdraw from participation at any time; that any inquiries which I may have will be answered by the investigator; and that my name will not be used within the thesis of question. I freely and voluntarily consent to my participation in this research project.
Sinature of Volunteer
Signature of Investigator~~~~~~~~~~~~-
87
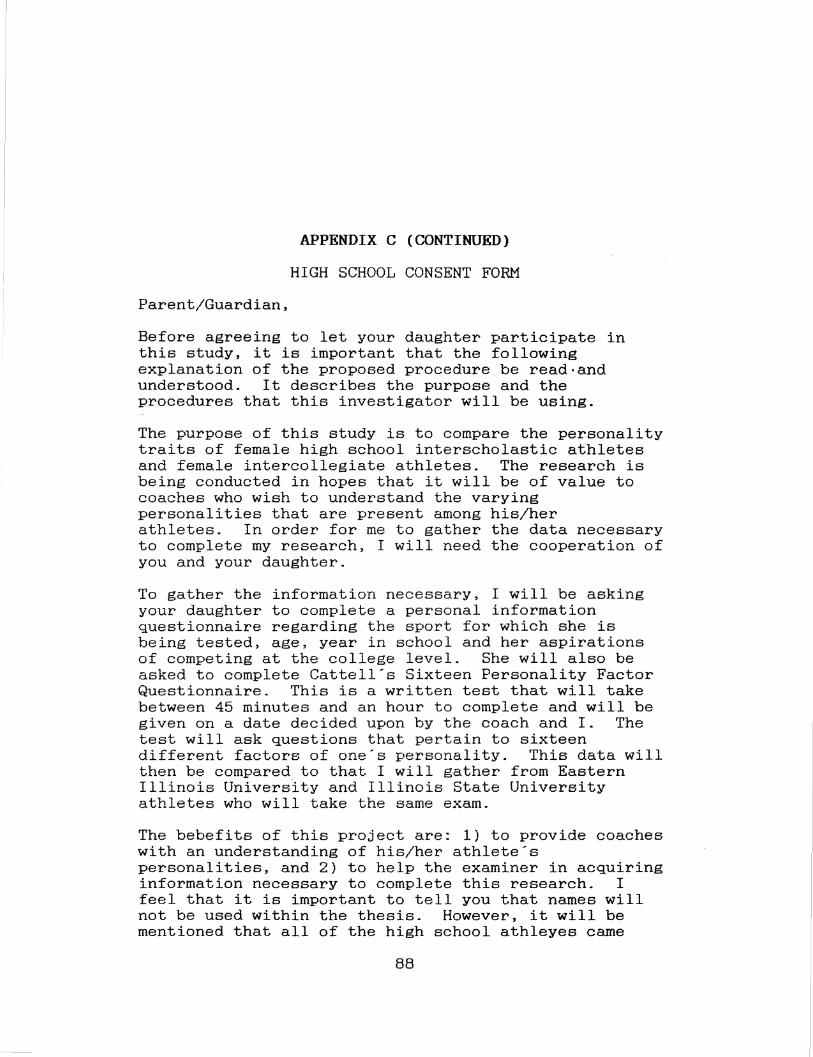
Parent/Guardian,
APPENDIX C (CONTINUED)
HIGH SCHOOL CONSENT FORM
Before agreeing to let your daughter participate in this study, it is important that the following explanation of the proposed procedure be read·and understood. It describes the purpose and the procedures that this investigator will be using.
The purpose of this study is to compare the personality traits of female high school interscholastic athletes and female intercollegiate athletes. The research is being conducted in hopes that it will be of value to coaches who wish to understand the varying personalities that are present among his/her athletes. In order for me to gather the data necessary to complete my research, I will need the cooperation of you and your daughter.
To gather the information necessary, I will be asking your daughter to complete a personal information questionnaire regarding the sport for which she is being tested, age, year in school and her aspirations of competing at the college level. She will also be asked to complete Cattell's Sixteen Personality Factor Questionnaire. This is a written test that will take between 45 minutes and an hour to complete and will be given on a date decided upon by the coach and I. The test will ask questions that pertain to sixteen different factors of one's personality. This data will then be compared to that I will gather from Eastern Illinois University and Illinois State University athletes who will take the same exam.
The bebefits of this project are: 1) to provide coaches with an understanding of his/her athlete's personalities, and 2) to help the examiner in acquiring information necessary to complete this research. I feel that it is important to tell you that names will not be used within the thesis. However, it will be mentioned that all of the high school athleyes came
88
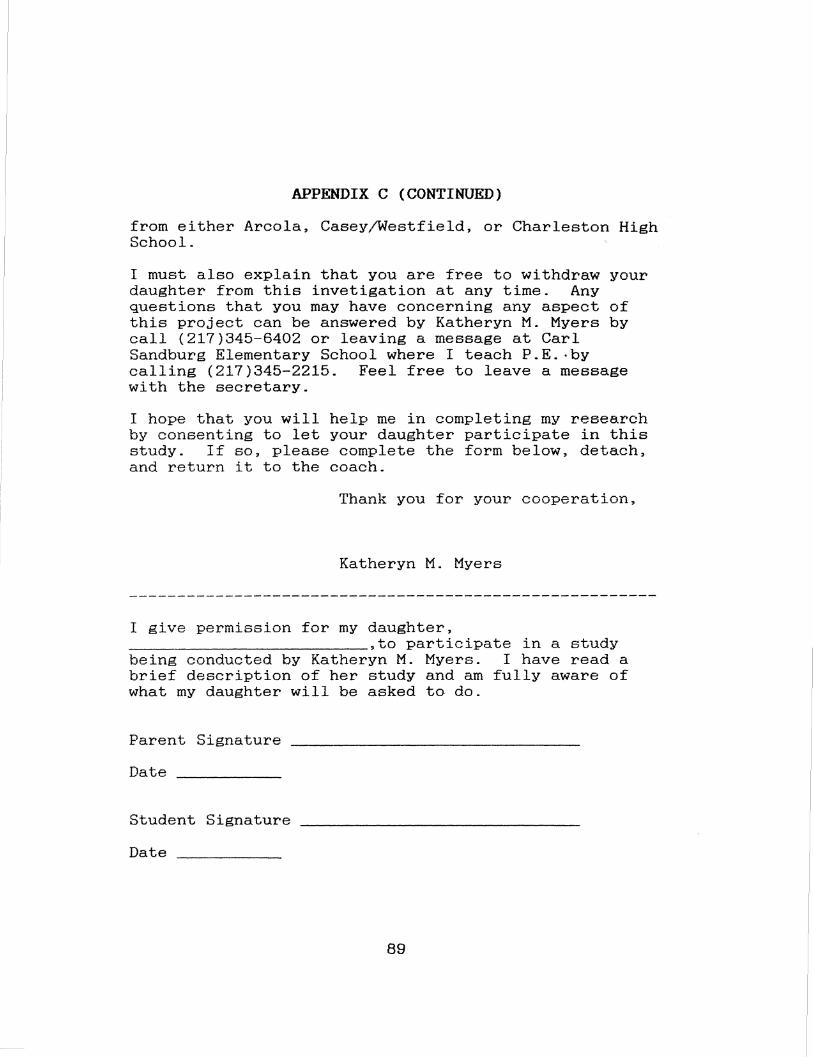
APPENDIX C {CONTINUED)
from either Arcola, Casey/Westfield, or Charleston High School.
I must also explain that you are free to withdraw your daughter from this invetigation at any time. Any questions that you may have concerning any aspect of this project can be answered by Katheryn M. Myers by call (217)345-6402 or leaving a message at Carl Sandburg Elementary School where I teach P.E. ·by calling (217)345-2215. Feel free to leave a message with the secretary.
I hope that you will help me in completing my research by consenting to let your daughter participate in this study. If so, please complete the form below, detach, and return it to the coach.
Thank you for your cooperation,
Katheryn M. Myers
I give permission for my daughter, ~~~~~~~~~~~~~~•to participate in a study being conducted by Katheryn M. Myers. I have read a brief description of her study and am fully aware of what my daughter will be asked to do.
Parent Signature
Date
Student Signature
Date
89
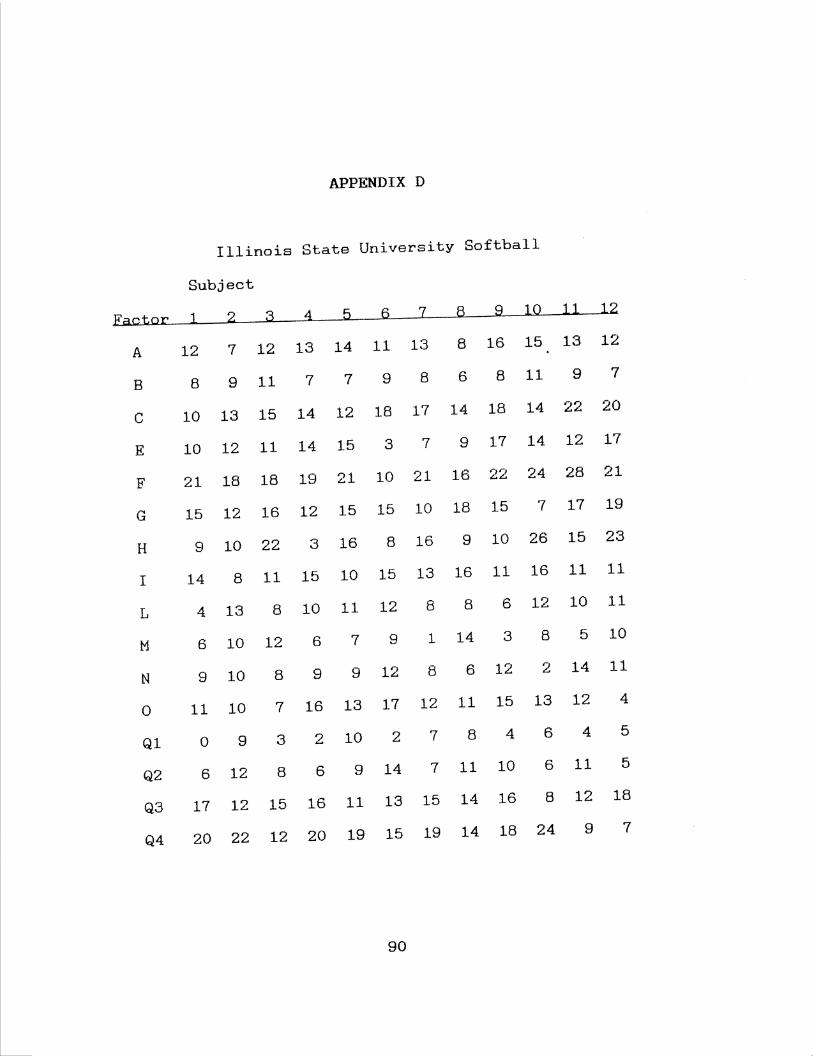
APPENDIX D
Illinois State University Softball
Subject
Factor 1 2 3 4 5 6 7 8 9 10 11 12
A 12 7 12 13 14 11 13 8 16 15 13 12
B 8 9 11 7 7 9 8 6 8 11 9 7
c 10 13 15 14 12 18 17 14 18 14 22 20
E 10 12 11 14 15 3 7 9 17 14 12 17
F 21 18 18 19 21 10 21 16 22 24 28 21
G 15 12 16 12 15 15 10 18 15 7 17 19
H 9 10 22 3 16 8 16 9 10 26 15 23
I 14 8 11 15 10 15 13 16 11 16 11 11
L 4 13 8 10 11 12 8 8 6 12 10 11
M 6 10 12 6 7 9 1 14 3 8 5 10
N 9 10 8 9 9 12 8 6 12 2 14 11
0 11 10 7 16 13 17 12 11 15 13 12 4
Ql 0 9 3 2 10 2 7 8 4 6 4 5
Q2 6 12 8 6 9 14 7 11 10 6 11 5
Q3 17 12 15 16 11 13 15 14 16 8 12 18
Q4 20 22 12 20 19 15 19 14 18 24 9 7
90
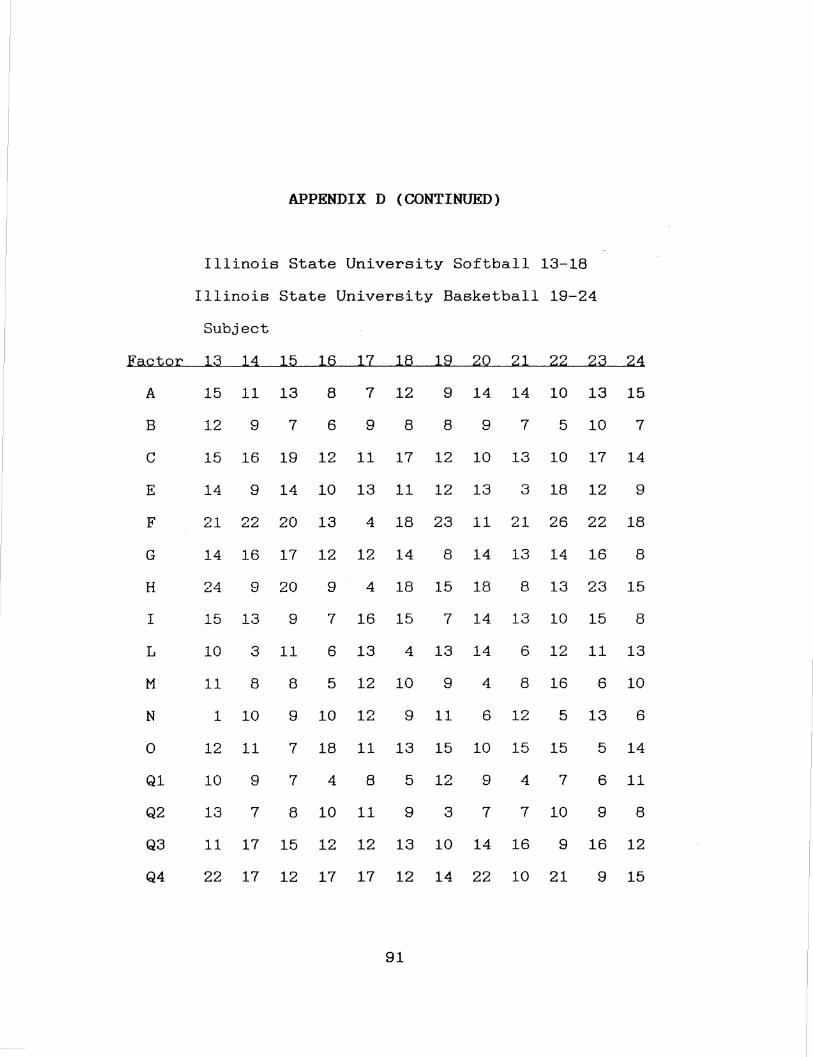
APPENDIX D (CONTINUED)
Illinois State University Softball 13-18
Illinois State University Basketball 19-24
Subject
Factor 13 14 15 16 17 18 19 20 21 22 23 24
A 15 11 13 8 7 12 9 14 14 10 13 15
B 12 9 7 6 9 8 8 9 7 5 10 7
c 15 16 19 12 11 17 12 10 13 10 17 14
E 14 9 14 10 13 11 12 13 3 18 12 9
F 21 22 20 13 4 18 23 11 21 26 22 18
G 14 16 17 12 12 14 8 14 13 14 16 8
H 24 9 20 9 4 18 15 18 8 13 23 15
I 15 13 9 7 16 15 7 14 13 10 15 8
L 10 3 11 6 13 4 13 14 6 12 11 13
M 11 8 8 5 12 10 9 4 8 16 6 10
N 1 10 9 10 12 9 11 6 12 5 13 6
0 12 11 7 18 11 13 15 10 15 15 5 14
Ql 10 9 7 4 8 5 12 9 4 7 6 11
Q2 13 7 8 10 11 9 3 7 7 10 9 8
Q3 11 17 15 12 12 13 10 14 16 9 16 12
Q4 22 17 12 17 17 12 14 22 10 21 9 15
91
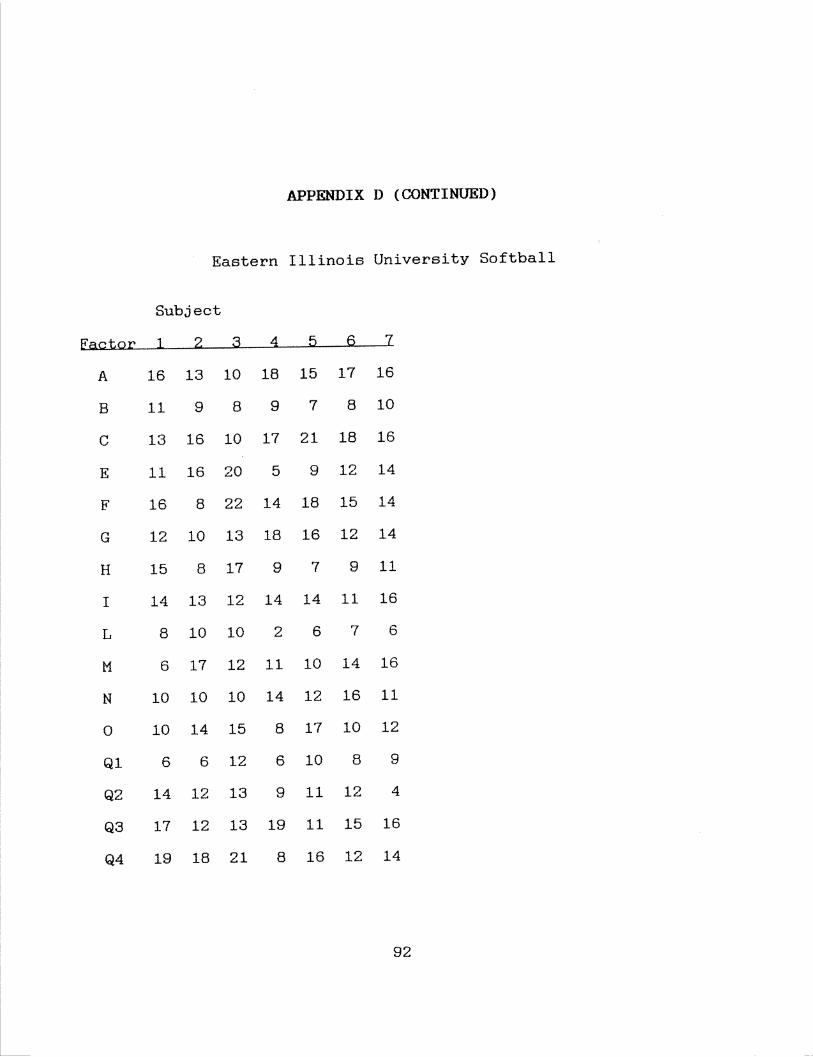
APPENDIX D (CONTINUED)
Eastern Illinois University Softball
Subject
[actor 1 2 3 4 5 6 7
A 16 13 10 18 15 17 16
B 11 9 8 9 7 8 10
c 13 16 10 17 21 18 16
E 11 16 20 5 9 12 14
F 16 8 22 14 18 15 14
G 12 10 13 18 16 12 14
H 15 8 17 9 7 9 11
I 14 13 12 14 14 11 16
L 8 10 10 2 6 7 6
M 6 17 12 11 10 14 16
N 10 10 10 14 12 16 11
0 10 14 15 8 17 10 12
Ql 6 6 12 6 10 8 9
Q2 14 12 13 9 11 12 4
Q3 17 12 13 19 11 15 16
Q4 19 18 21 8 16 12 14
92
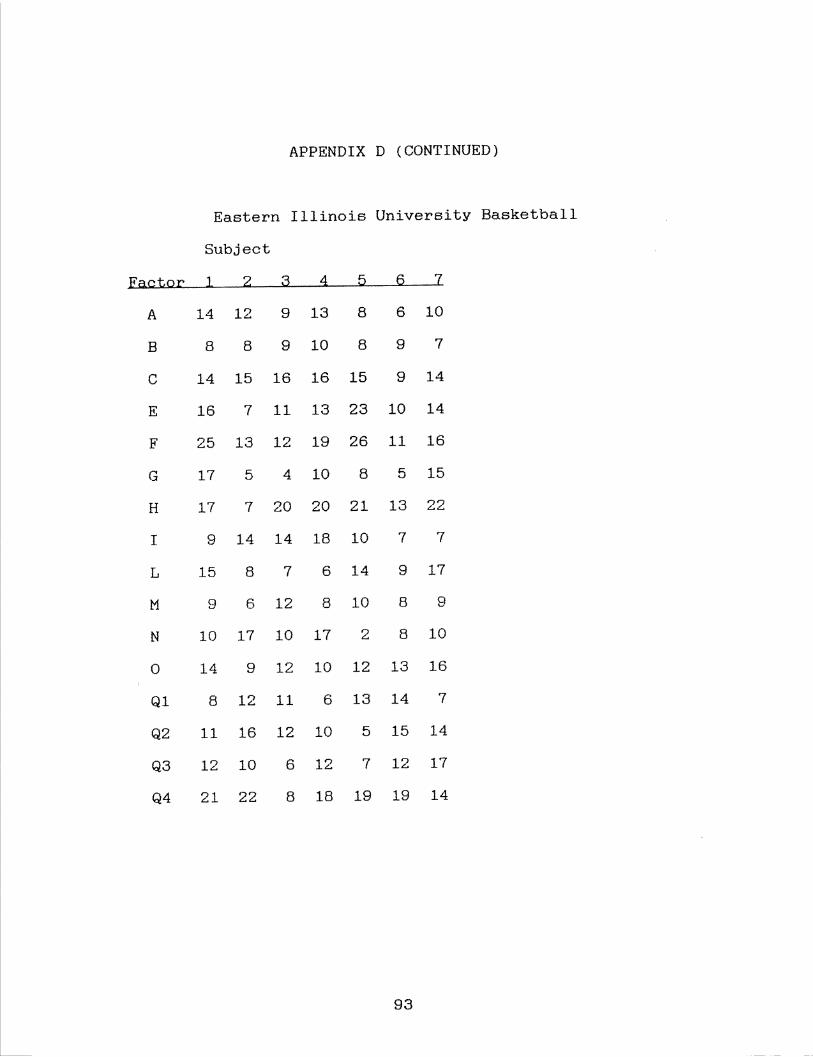
APPENDIX D (CONTINUED)
Eastern Illinois University Basketball
Subject
Factor 1 2 3 4 5 6 7
A 14 12 9 13 8 6 10
B 8 8 9 10 8 9 7
c 14 15 16 16 15 9 14
E 16 7 11 13 23 10 14
F 25 13 12 19 26 11 16
G 17 5 4 10 8 5 15
H 17 7 20 20 21 13 22
I 9 14 14 18 10 7 7
L 15 8 7 6 14 9 17
M 9 6 12 8 10 8 9
N 10 17 10 17 2 8 10
0 14 9 12 10 12 13 16
Ql 8 12 11 6 13 14 7
Q2 11 16 12 10 5 15 14
Q3 12 10 6 12 7 12 17
Q4 21 22 8 18 19 19 14
93
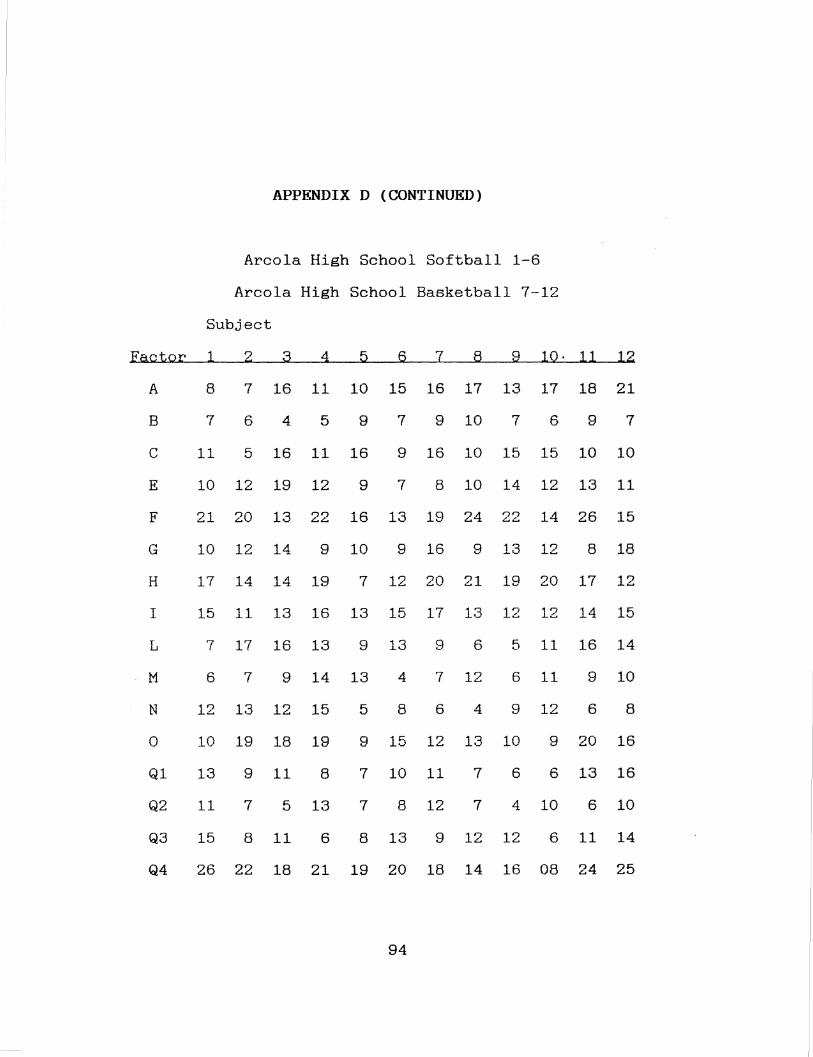
APPENDIX D (CONTINUED)
Arcola High School Softball 1-6
Arcola High School Basketball 7-12
Subject
Factor 1 2 3 4 5 6 7 8 9 10· 11 12 I
A 8 7 16 11 10 15 16 17 13 17 18 21
B 7 6 4 5 9 7 9 10 7 6 9 7
c 11 5 16 11 16 9 16 10 15 15 10 10
E 10 12 19 12 9 7 8 10 14 12 13 11
F 21 20 13 ,,,.., L.L. 16 13 19 24 22 14 26 15
G 10 12 14 9 10 9 16 9 13 12 8 18
H 17 14 14 19 7 12 20 21 19 20 17 12
I 15 11 13 16 13 15 17 13 12 12 14 15
L 7 17 16 13 9 13 9 6 5 11 16 14
M 6 7 9 14 13 4 7 12 6 11 9 10
N 12 13 12 15 5 8 6 4 9 12 6 8
0 10 19 18 19 9 15 12 13 10 9 20 16
Ql 13 9 11 8 7 10 11 7 6 6 13 16
Q2 11 7 5 13 7 8 12 7 4 10 6 10
Q3 15 8 11 6 8 13 9 12 12 6 11 14
Q4 26 22 18 21 19 20 18 14 16 08 24 25
94
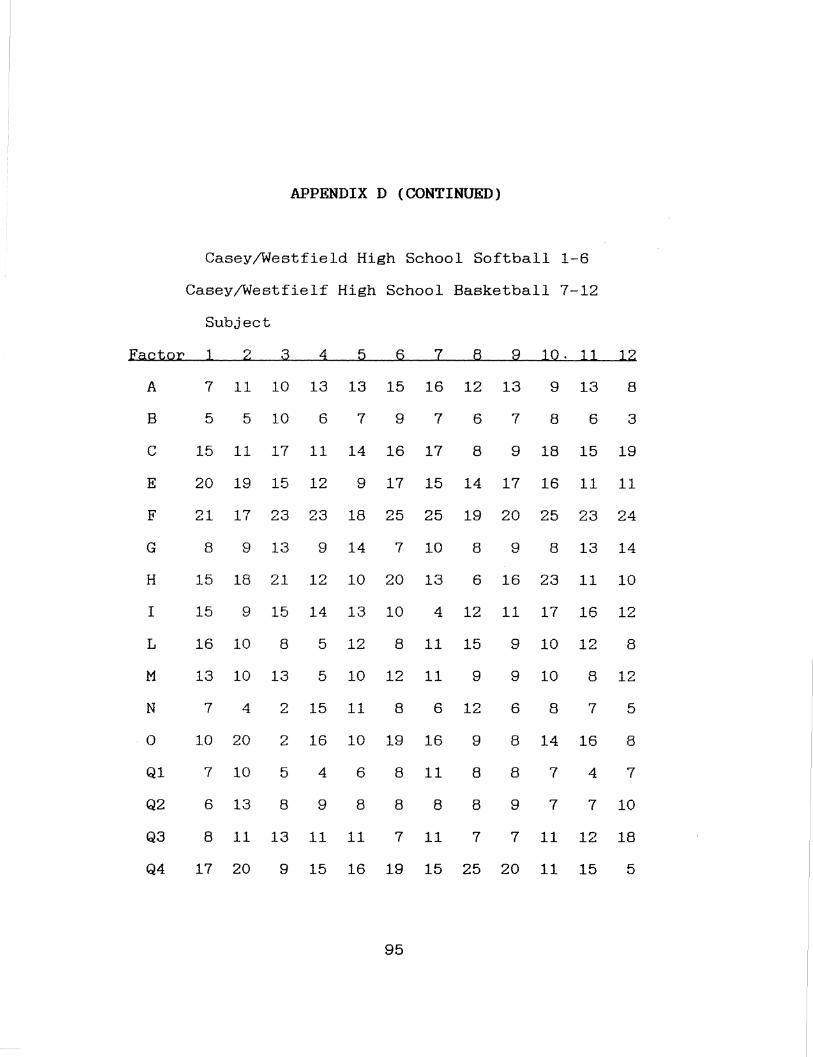
APPENDIX D {CONTINUED)
Casey/Westfield High School Softball 1-6
Casey/Westfielf High School Basketball 7-12
Subject
Factor 1 2 3 4 5 6 7 8 9 10. 11 12
A 7 11 10 13 13 15 16 12 13 9 13 8
B 5 5 10 6 7 9 7 6 7 8 6 3
c 15 11 17 11 14 16 17 8 9 18 15 19
E 20 19 15 12 9 17 15 14 17 16 11 11
F 21 17 23 23 18 25 25 19 20 25 23 24
G 8 9 13 9 14 7 10 8 9 8 13 14
H 15 18 21 1"., .!.. 10 20 13 6 16 23 11 10
I 15 9 15 14 13 10 4 12 11 17 16 12
L 16 10 8 5 12 8 11 15 9 10 12 8
M 13 10 13 5 10 12 11 9 9 10 8 12
N 7 4 2 15 11 8 6 12 6 8 7 5
0 10 20 ,.., 16 10 19 16 9 8 14 16 8 .!..
Ql 7 10 5 4 6 8 11 8 8 7 4 7
Q2 6 13 8 9 8 8 8 8 9 7 7 10
Q3 8 11 13 11 11 7 11 7 7 11 12 18
Q4 17 20 9 15 16 19 15 25 20 11 15 5
95
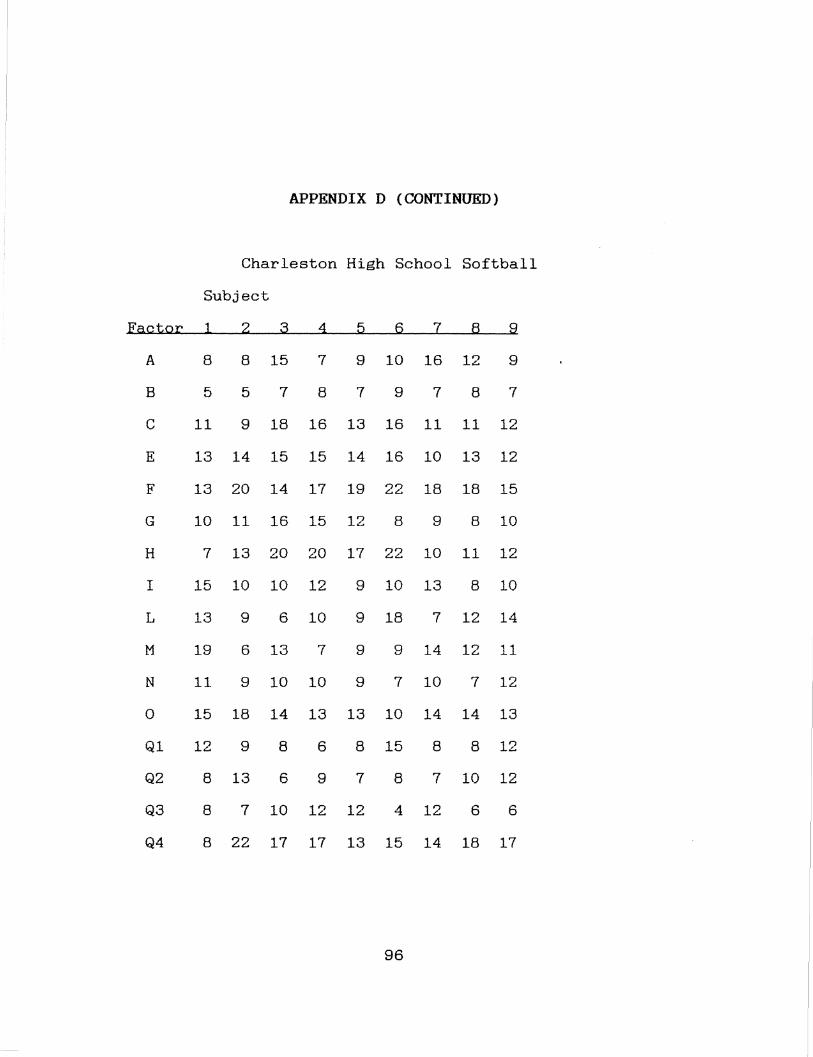
APPENDIX D {CONTINUED)
Charleston High School Softball
Subject
Factor 1 2 3 4 5 6 7 8 9
A 8 8 15 7 9 10 16 12 9
B 5 5 7 8 1 9 7 8 7
c 11 9 18 16 13 16 11 11 12
E 13 14 15 15 14 16 10 13 12
F 13 20 14 17 19 22 18 18 15
G 10 11 16 15 12 8 9 8 10
H 7 13 20 20 17 22 10 11 12
I 15 10 10 12 9 10 13 8 10
L 13 9 6 10 9 18 7 12 14
M 19 6 13 7 9 9 14 12 11
N 11 9 10 10 9 7 10 7 12
0 15 18 14 13 13 10 14 14 13
Ql 12 9 8 6 8 15 8 8 12
Q2 8 13 6 9 7 8 7 10 12
Q3 8 7 10 12 12 4 12 6 6
Q4 8 22 17 17 13 15 14 18 17
96
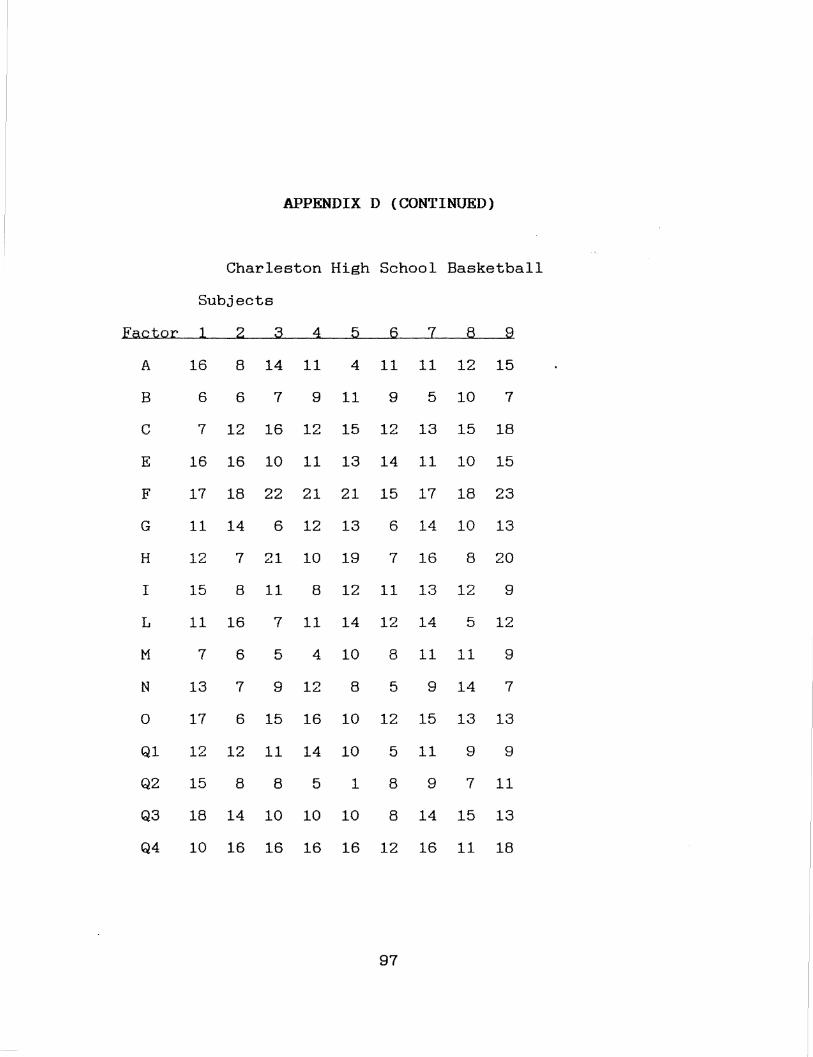
APPENDIX D {CONTINUED)
Charleston High School Basketball
Subjects
Factor 1 2 3 4 5 6 7 8 9
A 16 8 14 11 4 11 11 12 15
B 6 6 7 9 11 9 5 10 7
c 7 12 16 12 15 12 13 15 18
E 16 16 10 11 13 14 11 10 15
F 17 18 22 21 21 15 17 18 23
G 11 14 6 12 13 6 14 10 13
H 12 7 21 10 19 7 16 8 20
I 15 8 11 8 12 11 13 12 9
L 11 16 7 11 14 12 14 5 12
M 7 6 5 4 10 8 11 11 9
N 13 7 9 12 8 5 9 14 7
0 17 6 15 16 10 12 15 13 13
Ql 12 12 11 14 10 5 11 9 9
Q2 15 8 8 5 1 8 9 7 11
Q3 18 14 10 10 10 8 14 15 13
Q4 10 16 16 16 16 12 16 11 18
97
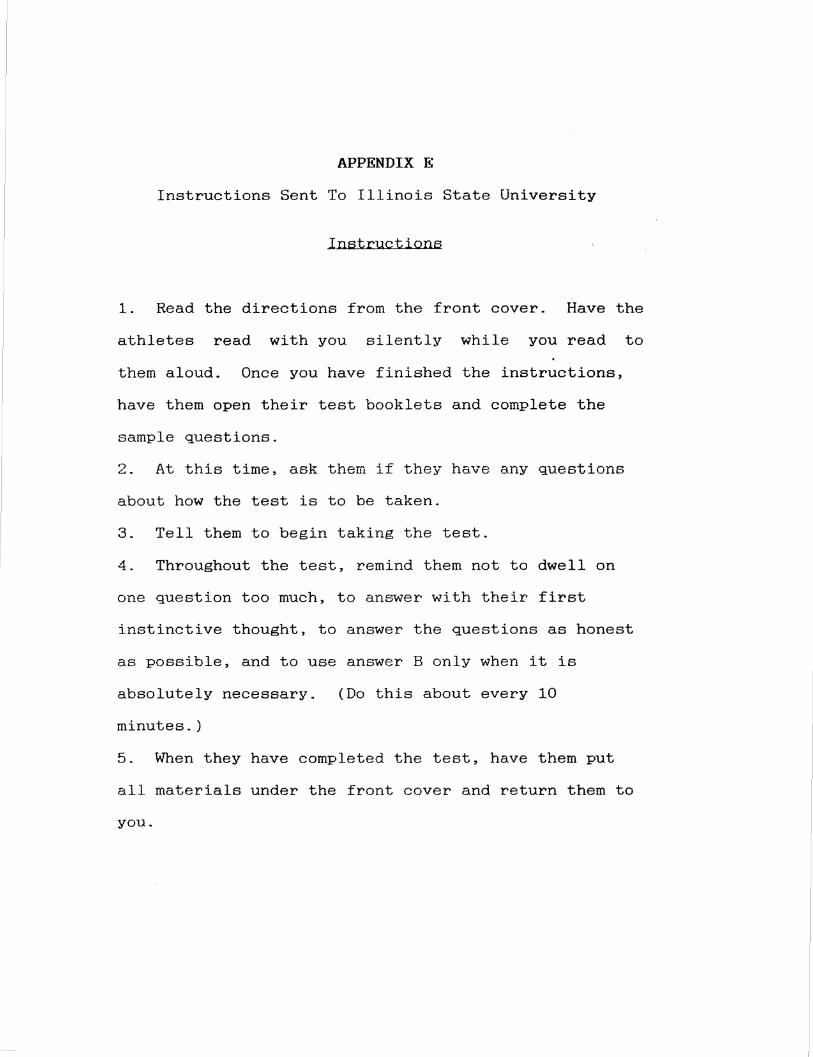
APPENDIX E
Instructions Sent To Illinois State University
Instructions
1. Read the directions from the front cover. Have the
athletes read with you silently while you read to
them aloud. Once you have finished the instructions,
have them open their test booklets and complete the
sample questions.
2. At this time, ask them if they have any questions
about how the test is to be taken.
3. Tell them to begin taking the test.
4. Throughout the test, remind them not to dwell on
one question too much, to answer with their first
instinctive thought, to answer the questions as honest
as possible, and to use answer B only when it is
absolutely necessary. (Do this about every 10
minutes.)
5. When they have completed the test, have them put
all materials under the front cover and return them to
you.
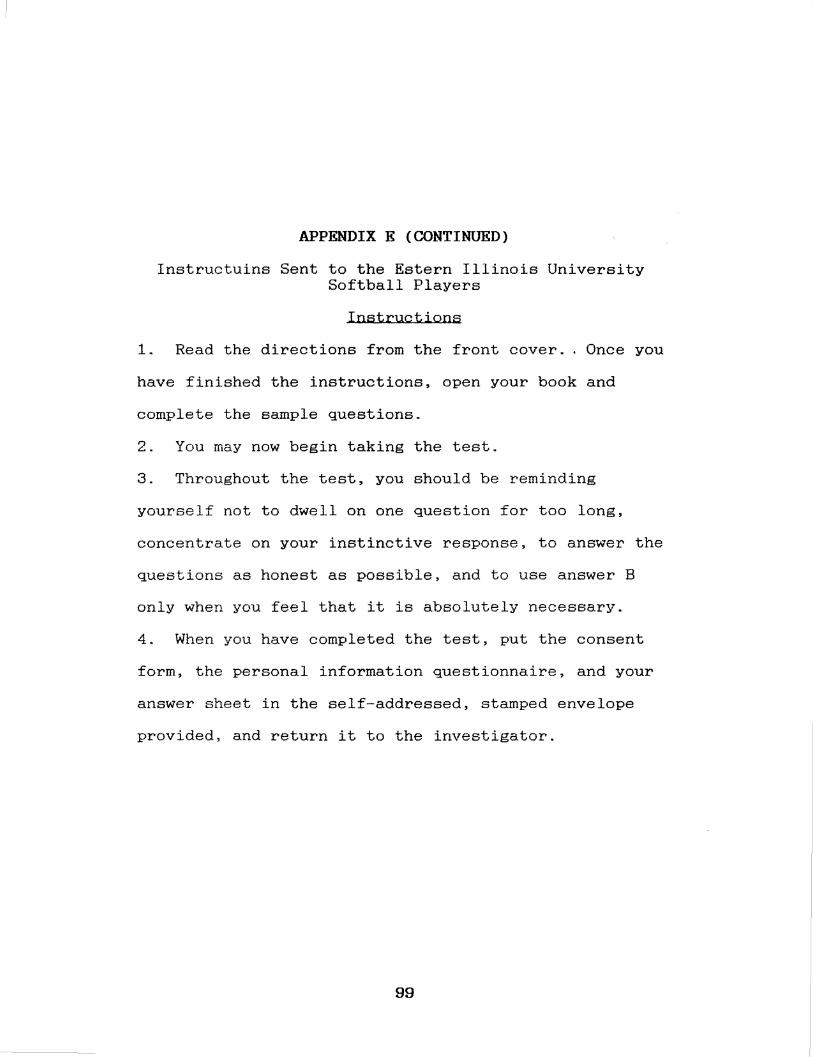
APPENDIX E (CONTINUED)
Instructuins Sent to the Estern Illinois University Softball Players
Instructions
1. Read the directions from the front cover .. Once you
have finished the instructions, open your book and
complete the sample questions.
2. You may now begin taking the test.
3. Throughout the test, you should be reminding
yourself not to dwell on one question for too long,
concentrate on your instinctive response, to answer the
questions as honest as possible, and to use answer B
only when you feel that it is absolutely necessary.
4. When you have completed the test, put the consent
form, the personal information questionnaire, and your
answer sheet in the self-addressed, stamped envelope
provided, and return it to the investigator.
99