Embed Size (px)
Citation preview
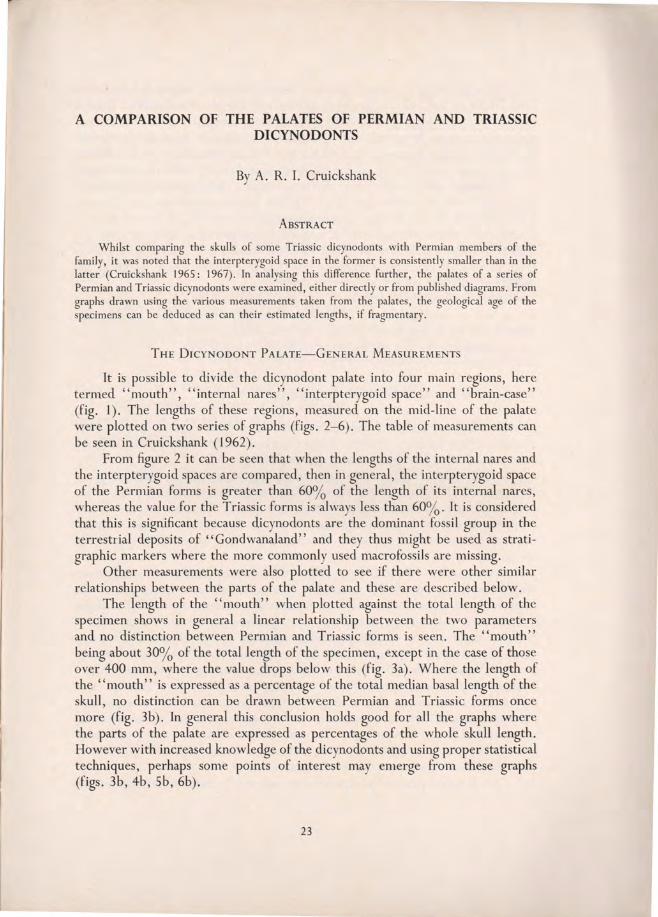
A COMPARISON OF THE PALATES OF PERMIAN AND TRIASSIC DICYNODONTS
By A. R. I. Cruickshank
ABSTRACT
Whilst comparing the skulls of some Triassic dicynodonts with Permian members of the family, it was noted that the interpterygoid space in the former is consistently smaller than in the latter (Cruickshank 1965: 1967). In analysing this difference further, the palates of a series of Permian and Triassic dicynodonts were examined, either directly or from published diagrams. From graphs drawn using the various measurements taken from the palates, the geological age of the specimens can be deduced as can their estimated lengths, if fragmentary.
THE DICYNODONT PALATE-GENERAL MEASUREMENTS
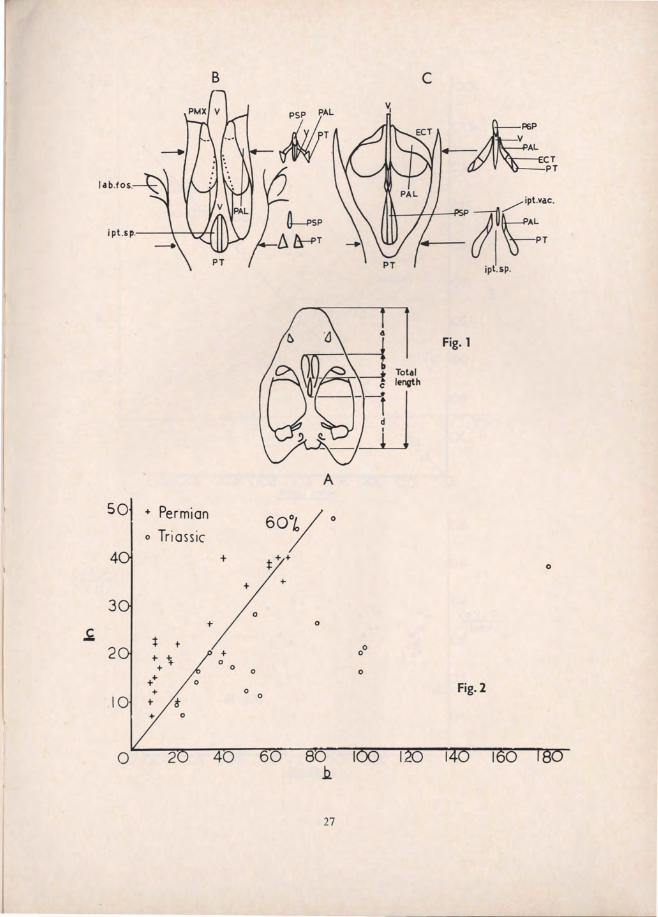
It is possible to divide the dicynodont palate into four main regions, here d " h" ". I "". ·d" d "b· " terme mout , mterna nares , mterpterygOl space an ram-case
(fig. 1). The lengths of these regions, measured on the mid-line of the palate were plotted on two series of graphs (figs. 2-6). The table of measurements can be seen in Cruickshank (1962) .
From figure 2 it can be seen that when the lengths of the internal nares and the interpterygoid spaces are compared, then in general, the interpterygoid space of the Permian forms is greater than 60% of the length of its internal nares, whereas the value for the Triassic forms is always less than 60%. It is considered that this is significant because dicynodonts are the dominant fossil group in the terrestrial deposits of "Gondwanaland" and they thus might be used as stratigraphic markers where the more commonly used macrofossils are missing.
Other measurements were also plotted to see if there were other similar relationships between the parts of the palate and these are described below.
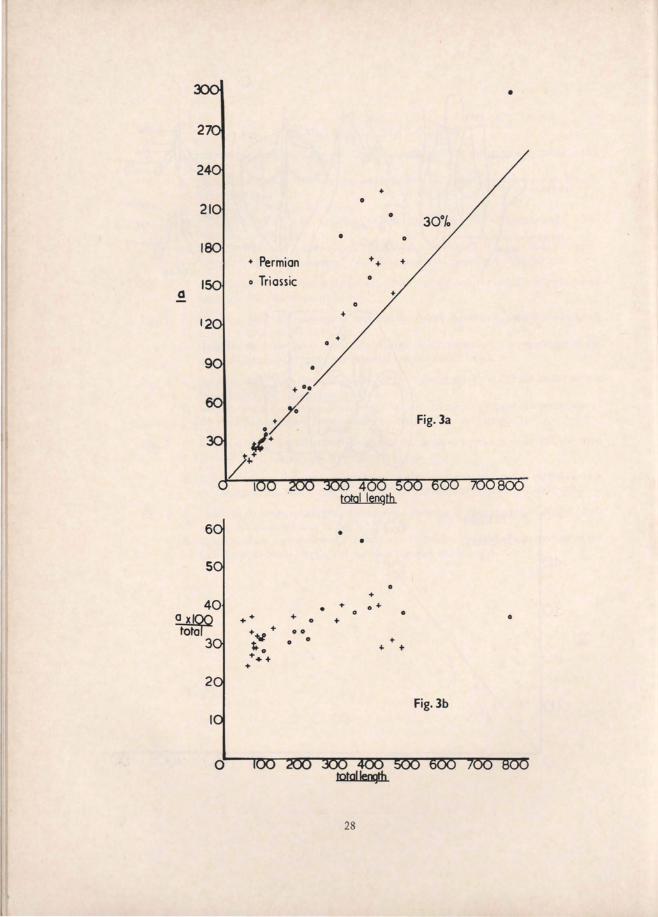
The length of the "mouth" when plotted against the total length of the specimen shows in general a linear relationship between the two parameters and no distinction between Permian and Triassic forms is seen. The "mouth" being about 30% of the total length of the specimen, except in the case of those over 400 mm, where the value drops below this (fig. 3a). Where the length of the "mouth" is expressed as a percentage of the total median basal length of the skull, no distinction can be drawn between Permian and Triassic forms once more (fig. 3b). In general this conclusion holds good for all the graphs where the parts of the palate are expressed as percentages of the whole skull length. However with increased knowledge of the dicynodonts and using proper statistical techniques, perhaps some points of interest may emerge from these graphs (figs. 3b, 4b, 5b, 6b).
23
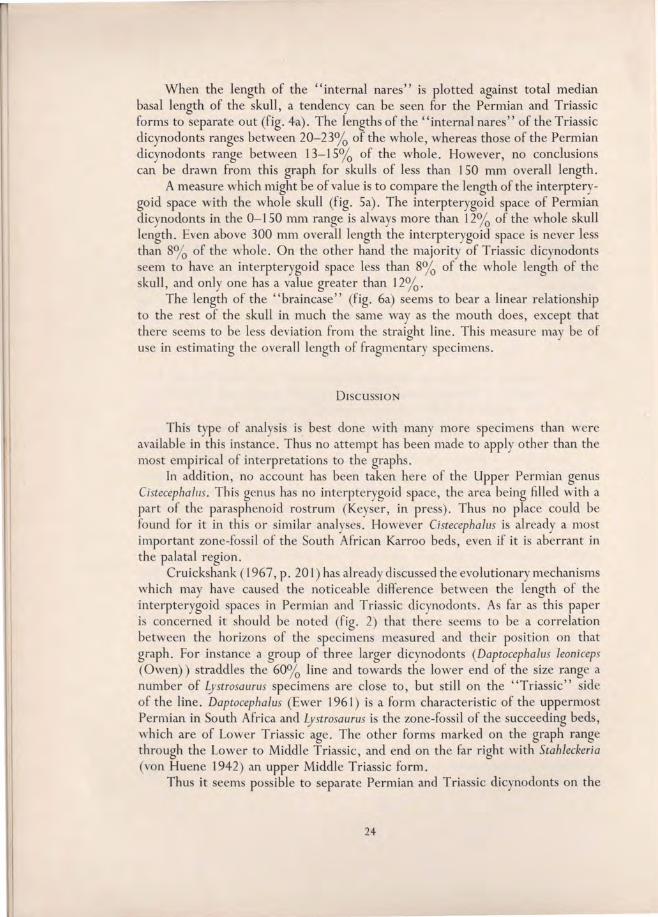
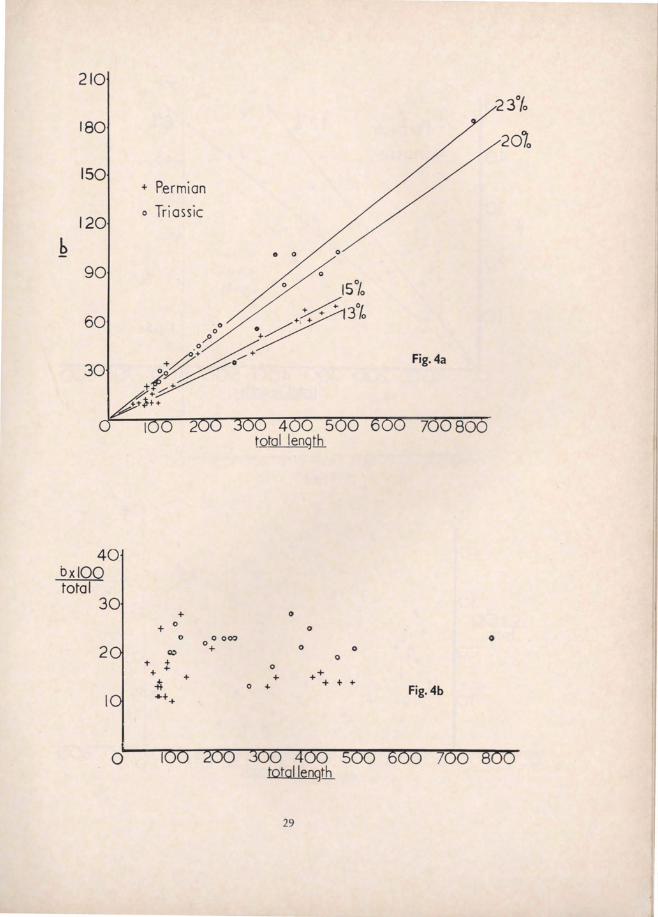
When the length of the "internal nares" is plotted against total median basal length of the skull, a tendency can be seen for the Permian and Triassic forms to separate out (fig. 4a) . The lengths of the "internal nares" of the Triassic dicynodonts ranges between 20-23% of the whole, whereas those of the Permian dicynodonts range between 13-150/0 of the whole. However, no conclusions can be drawn from this graph for skulls of less than 150 mm overall length.
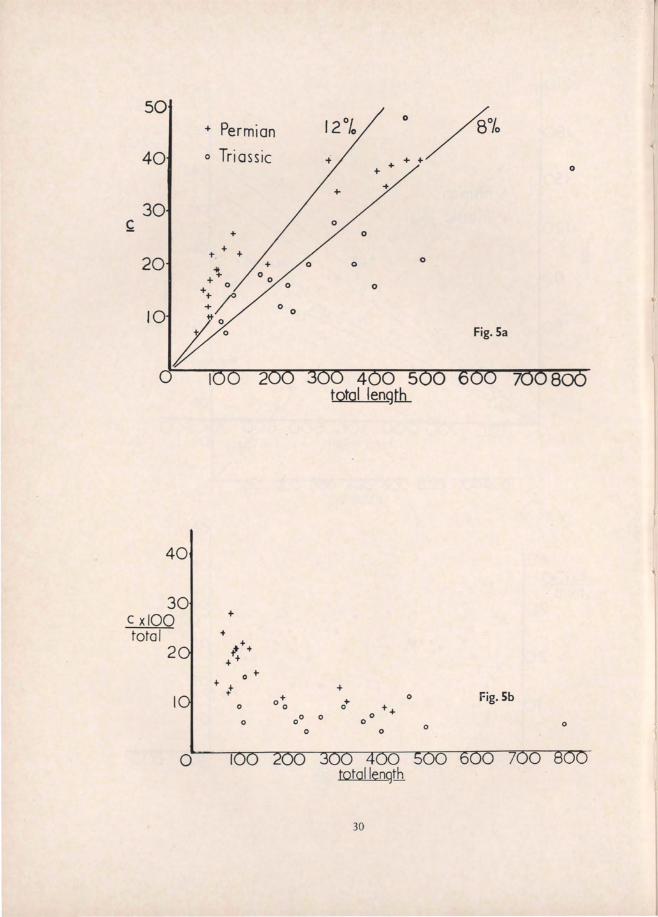
A measure which might be of value is to compare the length of the interpterygoid space with the whole skull (fig. Sa). The interpterygoid space of Permian dicynodonts in the 0-150 nml range is always more than 12% of the whole skull length. Even above 300 mm overall length the interpterygoid space is never less than 8% of the whole. On the other hand the majority of Triassic dicynodonts seem to have an interpterygoid space less than 80/0 of the whole length of the skull, and only one has a value greater than 12%.
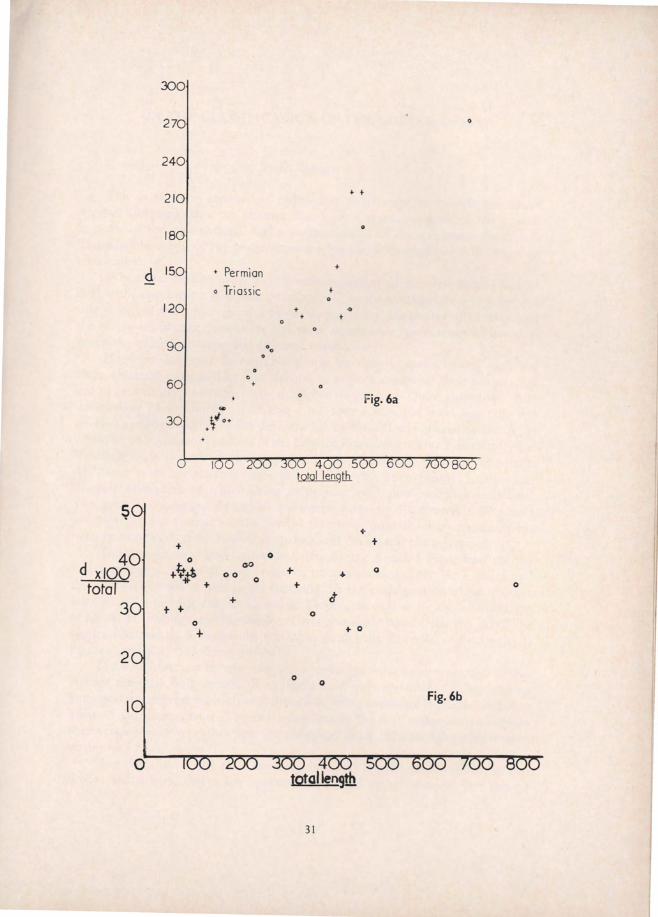
The length of the "braincase" (fig. 6a) seems to bear a linear relationship to the rest of the skull in much the same way as the mouth does, except that there seems to be less deviation from the straight line. This measure may be of use in estimating the overall length of fragmentary specimens.
DISCUSSION
This type of analysis is best done with many more specimens than were available in this instance. Thus no attempt has been made to apply other than the most empirical of interpretations to the graphs.
In addition, no account has been taken here of the Upper Permian genus Cistecephallls. This genus has no interpterygoid space, the area being filled with a part of the parasphenoid rostrum (Keyser, in press). Thus no place could be found for it in this or similar analyses. However Cistecephalus is already a most important zone-fossil of the South African Karroo beds, even if it is aberrant in the palatal region.
Cruickshank (J 967, p. 201) has already discussed the evolutionary mechanisms which may have caused the noticeable difference between the length of the interpterygoid spaces in Permian and Triassic dicynodonts. As far as this paper is concerned it should be noted (fig. 2) that there seems to be a correlation between the horizons of the specimens measured and their position on that graph. For instance a group of three larger dicynodonts (Daptocephalus leoniceps (Owen» straddles the 60% line and towards the lower end of the size range a number of Lystrosaurus specimens are close to, but still on the "Triassic" side of the line. Daptocephalus (Ewer 1961) is a form characteristic of the uppermost Permian in South Africa and Lystrosaurus is the zone-fossil of the succeeding beds, which are of Lower Triassic age. The other forms marked on the graph range through the Lower to Middle Triassic, and end on the far right with Stahleckeria (von Huene 1942) an upper Middle Triassic form.
Thus it seems possible to separate Permian and Triassic dicynodonts on the
24
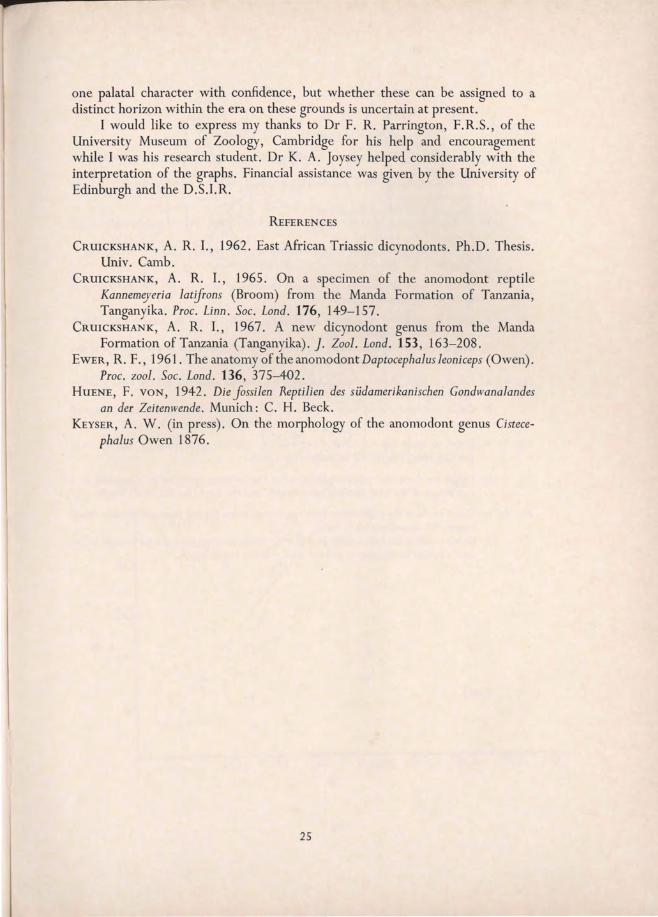
one palatal character with confidence, but whether these can be assigned to a distinct horizon within the era on these grounds is uncertain at present.
I would like to express my thanks to Dr F. R. Parrington, F.R.S., of the University Museum of Zoology, Cambridge for his help and encouragement while I was his research student. Dr K. A. Joysey helped considerably with the interpretation of the graphs. Financial assistance was given by the University of Edinburgh and the D.S.I.R.
REFERENCES
CRUICKSHANK, A. R. I., 1962. East African Triassic dicynodonts. Ph.D. Thesis. Univ. Camb.
CRUICKSHANK, A. R. I., 1965. On a specimen of the anomodont reptile Kannemeyeria 1atifrons (Broom) from the Manda Formation of Tanzania, Tanganyika. hoc. Linn. Soc. Lond. 176, 149-157.
CRUICKSHANK, A. R. I., 1967. A new dicynodont genus from the Manda Formation of Tanzania (Tanganyika). J. Zool. Lond. 153, 163-208.
EWER, R. F., 1961. The anatomy of the anomodont Daptocephalus leoniceps (Owen). Proc. zool. Soc. Lond. 136, 375-402.
HUENE, F. VON, 1942. Die Jossi1en Repti1ien des siidamerikanischen Gondwanalandes an der Zeitenwende. Munich: C. H. Beck.
KEYSER, A. W. (in press). On the morphology of the anomodont genus Cistecepha1us Owen 1876.
25
EXPLANATION OF TEXT FIGURES
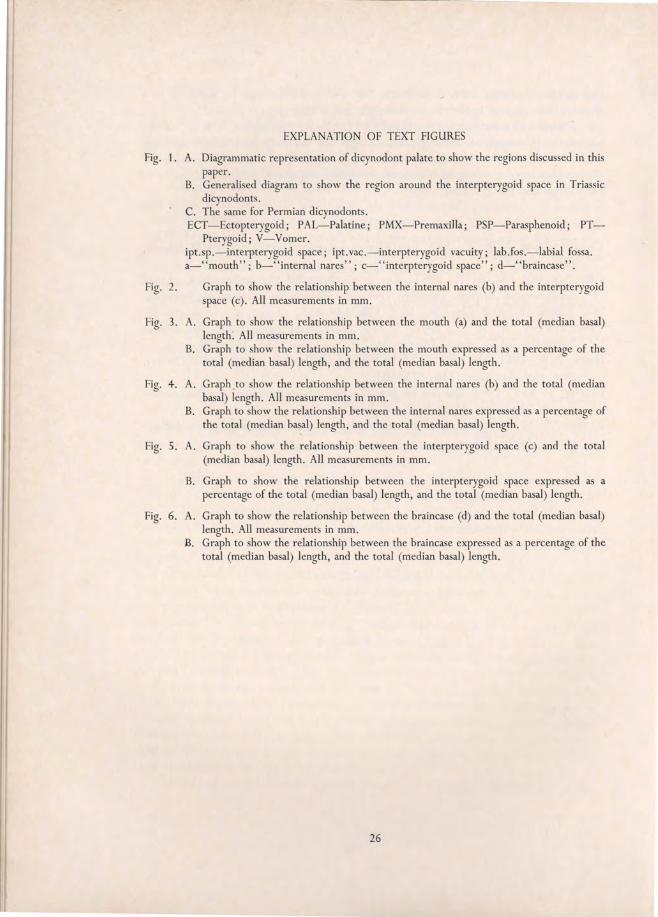
Fig. 1. A. Diagrammatic representation of dicynodont palate to show the regions discussed in this paper.
Fig. 2.
Fig. 3.
Fig. 4.
B. Generalised diagram to show the region around the interpterygoid space in Triassic dicynodonts.
C. The same for Permian dicynodonts. ECT -Ectopterygoid; PAL-Palatine; PM X-Premaxilla ; PSP-Parasphenoid; PT
Pterygoid; V-Vomer. ipt.sp.-interpterygoid space; ipt. vac.-interpterygoid vacuity; lab.fos.-labial fossa. a-"mouth"; b-"internal nares"; c-" interpterygoid space"; d-"braincase".
A.
B.
A.
B.
Graph to show the relationship between the internal nares (b) and the interpterygoid space (c). All measurements in mm.
Graph to show the relationship between the mouth (a) and the total (median basal) length. All measurements in mm. Graph to show the relationship between the mouth expressed as a percentage of the total (median basal) length, and the total (median basal) length.
Graph ,to show the relationship between the internal nares (b) and the total (median basal) length. All measurements in mm. Graph to show the relationship between the internal nares expressed as a percentage of the total (median basal) length, and the total (median basal) length.
Fig. 5. A. Graph to show the relationship between the interpterygoid space (c) and the total (median basal) length. All measurements in mm.
B. Graph to show the relationship between the interpterygoid space expressed as a percentage of the total (median basal) length, and the total (median basal) length.
Fig. 6. A. Graph to show the relationship between the braincase (d) and the total (median basal) length. All measurements in mm.
B. Graph to show the relationship between the braincase expressed as a percentage of the total (median basal) length, and the total (median basal) length.
26
EXPLANATION OF TEXT FIGURES
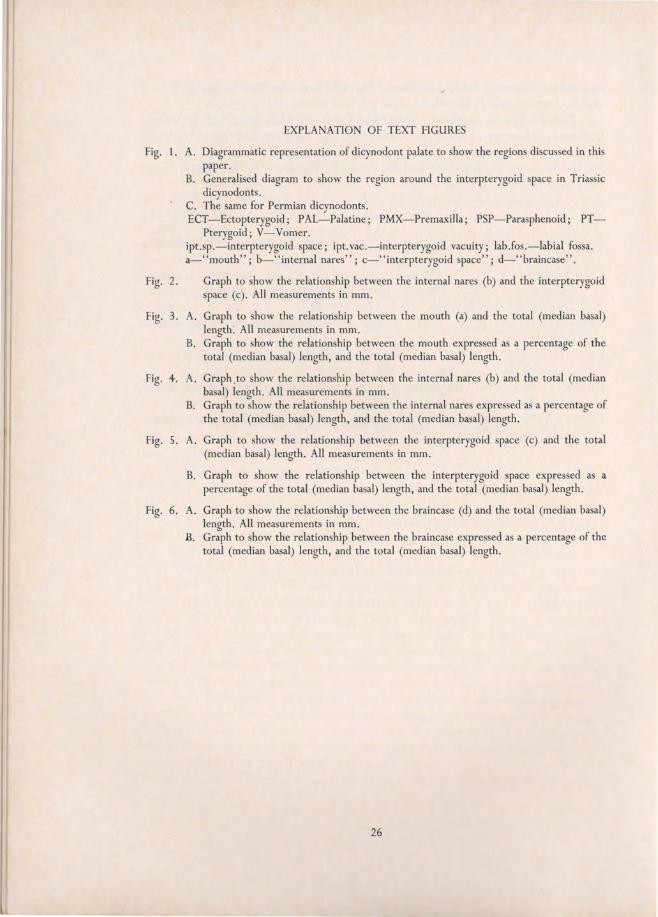
Fig. 1. A. Diagrammatic representation of dicynodont palate to show the regions discussed in this paper.
Fig. 2.
Fig. 3.
Fig. 4.
B. Generalised diagram to show the region around the interpterygoid space in Triassic dicynodonts.
C. The same for Permian dicynodonts. ECT -Ectopterygoid; PAL-Palatine; PMX-Premaxilla; PSP-Parasphenoid; PT
Pterygoid ; V-Vomer. ipt.sp.-interpterygoid space; ipt. vac.-interpterygoid vacuity; labJos.-labial fossa. a-"mouth"; b-"internal nares" ; c-"interpterygoid space"; d-"braincase".
A.
B.
A.
B.
Graph to show the relationship between the internal nares (b) and the interpterygoid space (c). All measurements in mm.
Graph to show the relationship between the mouth (a) and the total (median basal) length. All measurements in mm. Graph to show the relationship between the mouth expressed as a percentage of the total (median basal) length, and the total (median basal) length.
Graph .to show the relationship between the internal nares (b) and the total (median basal) length. All measurements in mm. Graph to show the relationship between the internal nares expressed as a percentage of the total (median basal) length, and the total (median basal) length.
Fig. 5. A. Graph to show the relationship between the interpterygoid space (c) and the total (median basal) length. All measurements in mm.
B. Graph to show the relationship between the interpterygoid space expressed as a percentage of the total (median basal) length, and the total (median basal) length.
Fig. 6. A. Graph to show the relationship between the braincase (d) and the total (median basal) length. All measurements in mm.
E. Graph to show the relationship between the braincase expressed as a percentage of the total (median basal) length, and the total (median basal) length.
26
B
50 + Permian
o Triassic
4 +
3 +
~ t t +
+ ~ 0 0 +
++ 0
+ 10 + it
+ 0
40
A
60Y' t + +
+ +
0 0
0
o 0
60 80 .b.
27
0 0
0
c
& p
v AL - CT
PT
/ ipt.vac.
7~AL '-(j I tr-PT
ipt.sP·
Fig. 1
0
Fig. 2
•
+ 0
0
30%
210
0
° 180 • Permian ++ +
° Triassic 0
a +
° +
• 0
•
. /. Fig.3a
ti· .+
/~
I
6 • •
° + + ° ... • 0
• ° + ... • + + + .0
+ ++.,j
• 0
+ + ;. . .... +
+
Fig.3b
o
28
210
180
150
120
b 90
60
30
40 bxlOO total
30
2
o
+ Permian o Triassic
+ 0
Q;)
T +
+
o
+ + .... + ~
+++
0: 00:)
0
o +
o ....
0
0
o
29
0
0
o
o 0 o
++ + + +
23%
2070
Fig.4a
700800
o
Fig.4b
50 + Permian
40 o Triassic
30 ~ t
20 t . t t
"* ++
0 +:;
10 p' t 0
0
40
30 c x/OO total
2
o
+
+ + I +
++ o +
+ + +
o
o
+ 00
0
12~
+ + o
0
0
o + + o
o
30
• ~'k + t
0
0
Fig. Sa
o Fig. Sb
o o
300
270
240
210 • t
180
d 150 + Permian +
o Triassic
120 + ·0
+
90 . 0
0
60 t
0 .. Fig.6a
30 + \" 0+
800
$0 +
+ t
40 0 0
d xlOO +tt..t. GO
+ 00 .. 0
* + 0 + total 0
30 + a-t + 0
0
+ + 0
2 0
0
Fig.6b
o totalle!2gth
31