Embed Size (px)
Citation preview
) L/
A COMPARISON OF THE SELF ACTUALIZED VALUE SCALE OF THE PERSONAL
ORIENTATION INVENTORY, SELECTED SCALES OF THE MINNESOTA
MULTIPHASIC PERSONALITY INVENTORY, AND SELECTED
CARDS OF THE THEMATIC APPERCEPTION TEST
A Thesis
Presented to
the Department of Psychology
Emporia Kansas State College
In Partial Fulfillment
of the Requirements for the Degree
Master of Science
by
Warner Reed Blackburn
May 1975

, T '\i \ f _;
,; ')
~
Approved for the MaJor Department
..) ,~ ,.;;7 " >~-~-:'k J? "J?it: '7 Ui & 4. f:; Approved for the Graduate Council
.-. ~ r; ,-' ".11-~ 5 u'O.:;;, .... '-;· ..)

ACKNOWLEDGMENrS
I extend my deep appreciation to my advisor, Dr.
Elton Amburn, as well as to Dr. W. Maurice McLean and
Dr. Howard Schwartz, who served on my committee. Their
assistance and cooperation helped considerably in making
this study possible.
Acknowledgment and appreciation is also expressed
to my wife, Rhnae, whose support and encouragement was
invaluable.
J.J.

• • • • • • • • • • • • • • • •
• • • • • • • • •
• •
• • • • • • • • •
• • • • • • • • • • •
• • • • • • • • • • • •
• • • • •
• • • • • • • • • • • • •
• • • • • • • • • • •
• •
• •
• • • • • • • • • • • • • • • •
TABLE OF CONTENTS
Page
LIST OF TABLES v
Chapter
1. INTRODUCTION • • • • • • • • • • • • • • • • 1
THE PROBLEM • 2
Statement of the Problem 4
Statement of the Hypotheses • • • • • • •• 4
Purpose of the Study • • • • • • • • • • • 5
Importance of the Study • • • • • • • • 5
DEFINITION OF TERMS • 6
Objective Test 6
Projective Test • 6
Self-Actualization • • • • • • • • • • • • 6
LIMITATIONS OF THE STUDY • • • • 6
2. REVIEW OF LITERATURE 8
J. METHODS AND PROCEDURES lJ
SUBJECTS lJ
INSTRUMENTATION • 14
Personal Orientation Inventory • • • • • • 15
Minnesota Multiphasic Personality Inventory • • • • • • • • • • • • • • • • 15
Thematic Apperception Test • • • • • • • • 17
PROCEDURES 18
1.1.1.

• • •
•
•
•
•
•
•
• •
• • • •
•
•
• •
• •
• •
•
•
• • •
• • • • •
•
• • • • • • • • • • •
l.V
Chapter Page
DATA COLLECTION • 19
STATISTICAL PROCEDURE 19
4. ANALYSIS OF DATA • • • 2)
POI and TAT • • • • • • • • • • • • • • • • 2)
Analysis of Data in Table 1 • • • • • • • • 24
TAT and MMPI (Pd) • • • • • • • • • • • • 25
Analysis of Data in Table 2 • • • • • • • • 25
TAT and MMPI (Si) • • • • • • • • • • • • 27
Analysis of Data in Table ) • • • • • • • • 27
POI and MMPI (Pd) • • • • • • • • • • 29
Analysis of Data in Table 4 • • • • • • • • 29
POI and MMPI (Si) • • • • • • • • • • • • )0
Analysis of Data in Table 5 • • • • • • • )0
Summary of Findings • • • • • • • • • • • )2
5. SUMMARY, CONCLUSIONS, AND RECOMMENDATIONS • )4•
SUMl-fA.RY • • • • • • • • • • • • • • • • • • )4
CONCLUSIONS • • • • • • • • • • • • • • • • • )5
RECOMMENDATIONS • • • • • • • • • • • • • • • )6
BIBLIOGRAPHY • • • • • )7
APPENDICES 40
A. Thematic Apperception Test Continuum 41
B. Raw Scores of the POI, MMPI, and TAT • • • • • 4)
C. T Scores of the POI, MMPI, and TAT • • • • 48
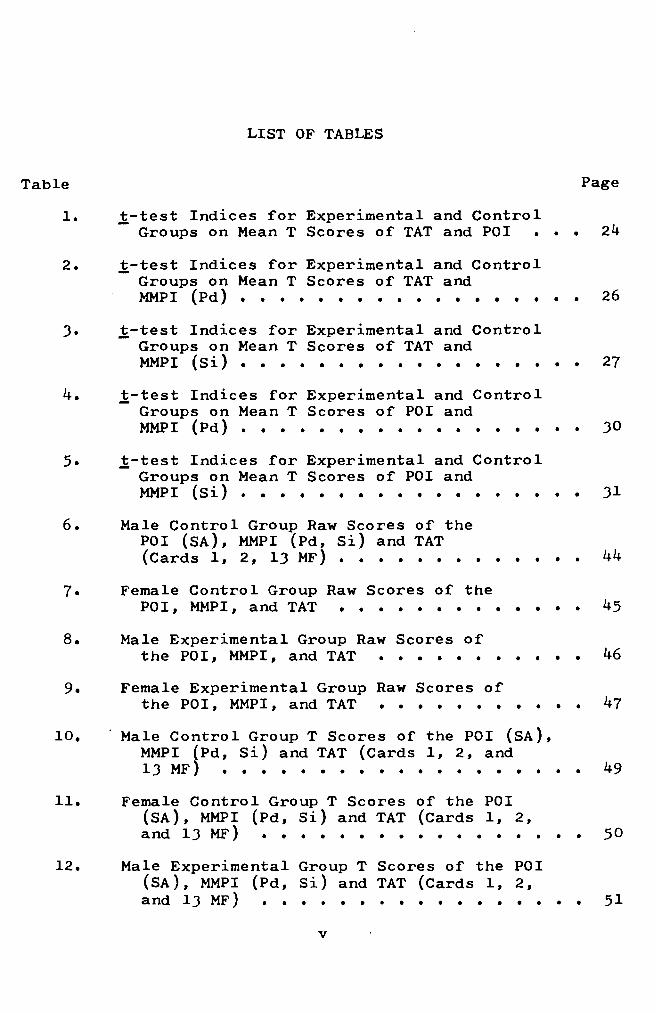
LIST OF TABLES
Table Page
1. t-test Indices for Experimental and Control Groups on Mean T Scores of TAT and POI ••• 24
2. i-test Indices for Experimental and Control Groups on Mean T Scores of TAT and MMPI (Pd) • • • • • • • • • • • • • • • • • • 26
). t-test Indices for Experimental and Control Groups on Mean T Scores of TAT and MMPI (S i) • • • • • • • • • • • • • • • • • 27
4. t-test Indices for Experimental and Control Groups on Mean T Scores of POI and MMPI (Pd) • • • • • • • • • • • • • • • • • • )0
5. t-test Indices for Experimental and Control Groups on Mean T Scores of POI and MMPI (Si) ••••••••••••• • • • • )1
6. Male Control Group Raw Scores of the POI (SA), MMPI (Pd, Si) and TAT (Cards I, 2, 1) MF} ••••••• • • • • • 44
7. Female Control Group Raw Scores of the POI, MMPI, and TAT •••••••• • • • • • 45
8. Male Experimental Group Raw Scores of the POI, MMPI, and TAT ••••••• • • 46
9. Female Experimental Group Raw Scores of the POI, MMPI, and TAT ••••••• • • • • 47
10. Male Control Group T Scores of the POI (SA), MMPI (Pd, Si) and TAT (Cards I, 2, and 1) MF} •••••••••••••••• • • 49
11. Female Control Group T Scores of the POI (SA), MMPI (Pd, Si) and TAT (Cards I, 2, and 1) MF} •••••••••••••• • • 50
12. Male Experimental Group T Scores of the POI (SA), MMP I (Pd , Si) and TAT (Cards I, 2, and 1) MF) • • • • • • • • • • • • • • 51
v

V~
Table Page
1J. Female Ex~erimenta1 Grou~ T Scores of the POI (SA), MMPI (Pd, Si) and TAT (Cards 1, 2, and 1JHF) •••••••••••• • • • 52

Chapter 1
INTRODUCTION
One or the concerns of this investigation is the
manner in which self-actualization is indicated in both pro
jective and objective tests. Maslow has stated that indivi
duals who are less self-actualized exhibit fewer resources
that can be utilized in building positive, creative, and
healthy conceptions of their environment. Maslow defined
self-actualization as, " ,- . • the full use and exploitation
of talents, capacities, potentialities, etc."l Thus, people
with these characteristics seem to be rulfilling themselves
by doing the best that they are capable of doing. 2 Knapp
has written that self-actualization is positively and s1gn1
ficantly related to the lack of neurotic symptoms and be
havioral tendencies. Persons manifesting neurotic symptoms
and behavioral tendencies apparemtly are not living up to
their full potential. J
lAbraham Maslow, Motivation and Personality (New Yorks Harper and Brothers, 1954), p. 200.
2Ibid., p. 201.
JRobert R. Knapp, "The Relationship of a Measure of Self-Actualization to Neuroticism and Extraversion," Journal of Consulting Psychology, 29 (1965), 168-172.
1

2
People suffering from emotional difficulties show
social ineptness and/or have problems in dealing with their
environment. Research by Shostrom and Knapp revealed that
patients in beginning stages of therapy manifest more social
alienation and withdrawal, while patients in advanced stages
of therapy tend to display more healthy interpersonal rela
tions. Clients in advanced therapy tend to view man's es
sential nature in constructive terms and are more capable of
·· . . 4deve 1 op1ng 1nt1mate contacts.
Many instruments have been designed to measure
aspects of social behavior, including alienation, uneasiness,
and attitudes. Instruments such as the Minnesota Multiphasic
Personality Inventory and the Personal Orientation Inventory
are designed to obtain a numerical score upon which judgments
are based. Projective techniques are also capable of
measuring these areas, even though their usefulness depends
more upon the judgment and analysis of the examiner.
THE PROBLEM
The primary purpose of this investigation was to
explore the relationship between objective techniques versus
projective techniques as used in the area of personality
assessment. The theoretical base for this investigation was
4 Everett L. Shostrom and Robert R. Knapp, "The Rela
tionship of a Measure of Self-Actualization (POI) to a Measure of Pathology (MMPI) and to Therapeutic Growth," American Journal of Psychotherapy, 20 (1966), 193-201.

J
Allport's contention of the manner in which abnormal and
normal subjects respond when administered both objective and
projective personality tests. Allport has written thatl
• • the direct responses of the psychoneurotic cannot be taken at their face value. The defenses are high; the true motives are hidden and are betrayed only by a projective technique. The normal sUbjects, on the other hand, tell you by the direct method precisely what they tell you by the projective method. 5
Other studies designed to investigate the above
statement by Allport concerning projective and objective
techniques have been reported in literature. Rodgers inves
tigated the relationship of projective expression to direct
6expression of achievement, aggression, and nurturance. In
a separate study, the Thematic Apperception Test and the
California Study Methods Survey were utilized by Honor to
measure attitudes toward educational achievement in high
schoo 1 boys. 7
This investigation was concerned with self-actualiza
tion factors and other personality factors that enable indi
viduals to cope with environmental demands. The tests used
in this study were the Personal Orientation Inventory, the
5Gordon W. Allport, Personality and Social Encounter (Bostonl Beacon Press, 1960), p. 101.
6Charles W. Rodgers, "The Relationship of Projective to Direct Expression of Need Aggression, Achievement, and Nurturance in Selected Populations," Dissernation Abstracts, JJBI2J55, November, 1972.
7Stephen H. Honor, "The TAT and Direct Methods of Obtaining Educational Attitudes of High and Low Achieving High School Boys," Journal of Clinical Psychology, 28 (1972), 81-9.

4
Minnesota Multiphasic Personality Inventory, and the The
ma~ic Apperception Test.
statement of the Problem
A comparative study of objective and projective tests
reveals the significance of the control group and experi
mental group responses. One of the primary questions to be
answered involves whether projective tests reveal the same
personality traits as objective tests. If a cluster of
personality traits are revealed by the POI and MMPI, then
would these same personality traits become manifest by use
of the TAT?
Statement of the Hypotheses
1. There are no significant differences between the
male and female subjects of the experimental and control
groups as indicated by the mean T scores of the Thematic
Apperception Test and the Personal Orientation Inventory.
2. There are no significant differences between
the male and female subjects of the experimental and con
trol groups as indicated by the mean T scores of the
Thematic Apperception Test and the Minnesota Multiphasic
Personality Inventory.
J. There are no signi£icant differences between the
male and female subjects of the experimental group and control

6
DEFINITION OF TERMS
Objective Test
Allport has defined "objective testing" as, "
any kind of testing where the final scores represent a sum
or pattern of a series of conscious choices on the part of
the subject."B
Projective Test
With regard to "projective tests," Abt and Bellak
statedl
The basic assumption in the use of these tests is that the subject is presented with a number of ambiguous stimuli and is then invited to respond to these stimuli. By such means it is assumed that the subject projects his own needs and pres~ and tha~ th~s~ will appear as responses to the amb1guous st1mu11.
Self-Actualization
Concerning self-actualized people, Maslow wrotel
Such people seem to be fulfilling themselves and to be doing the best that they are capable of doing. They are people who have developed or are developing to the full stature of which they are capable. 10
LIMITATIONS OF STUDY
The subjects comprising the control group were
limited to the freshmen class of 1974 at Emporia Kansas State
College.
8 ,A1 Iport, loco C1t. 9Lawrence Abt and Leopold Bellak, Projective Psy
chology (new Yorkl Alfred A. Knopf, 1950), p. 9.
10Maslow, loco cit.

7
The control group was selected by the writer and his com
mittee chairman.
The subjects comprising the experimental group were
limited to patients institutionalized at Osawatomie state
Hospital. Out-patients at Osawatomie State Hospital were
not included.
Forty sUbjects were selected to participate. The
control group and experimental group were each made up of
ten males and ten females. An additional male and female
sUbject was chosen for each group to help cope with possible
losses. The subjects' age range was 17 to 24 years of
age inclusive.
The selected personality inventory scales utilized
1n this study were the Self Actualized Value Scale of the POI
and the Psychopathic Deviate and Social Introversion scales
of the MMPI. The selected TAT cards utilized in this study
were cards 1, 2, and 13 MF.

Chapter 2
REVIEW OF LITERATURE
A search of the literature revealed little material
directly relevant to the present study. Several of the
studies cited in this chapter utilized the measurement of
achievement factors to determine the attainment of primary
goals. The present study utilized self-actualization fac
tors.
Rodgers investigated the relationship of projective
tests and self reports. The theoretical base used for this
investigation was Allport's contention that only normal
sUbjects indicate through objective testing techniques what
they reveal by projective methods. In Rodgers' investigation,
group TATs were administered to 161 subjects. Each TAT pro
tocol was judged for the strengths of aggression, achieve
ment, and nurturance needs. A self report schedule was
utilized to obtain the sUbjects' self reported need strengths
for these three factors. Rodgers concluded that highly re
liable inter judge ratings can be obtained for assessing the
need strengths of aggression, achievement and nurturance
from TAT protocols. Rodgers also stated thats
•• self reports don't provide the same information for nonpsychotic sUbjects as provided by the projective expression of these need strengths. Projective test
8
9
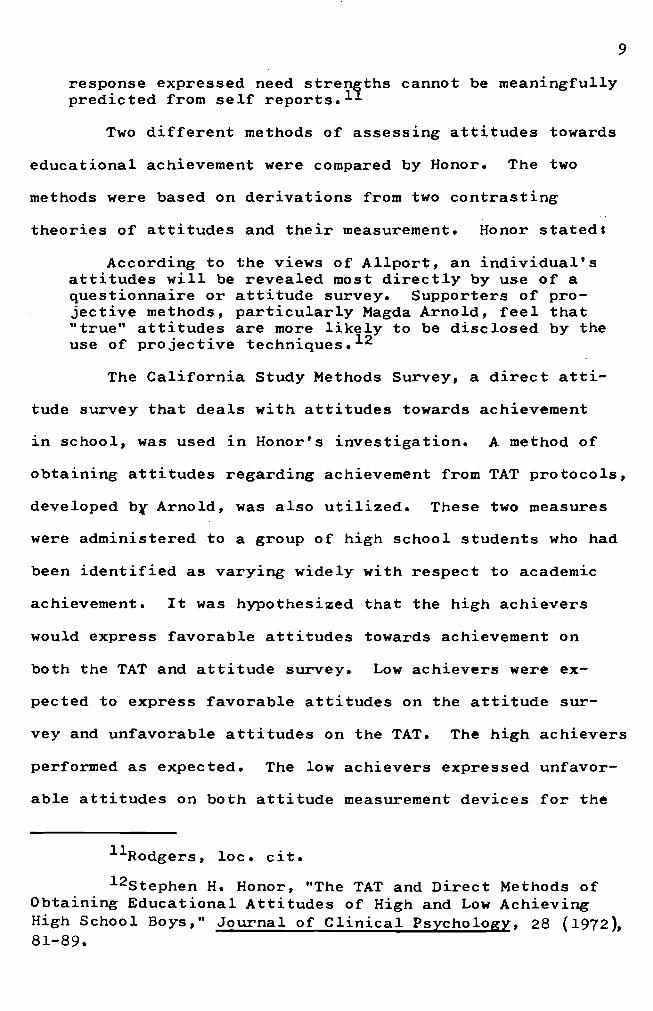
response expressed need streniths cannot be meaningfully predicted from self reports. l
Two different methods of assessing attitudes towards
educational achievement were compared by Honor. The two
methods were based on derivations from two contrasting
theories of attitudes and their measurement. Honor stated.
According to the views of Allport, an individual's attitudes will be revealed most directly by use of a questionnaire or attitude survey. Supporters of projective methods, particularly Magda Arnold, feel that "true" attitudes are more likely to be disclosed by the use of projective techniques. 12
The California Study Methods Survey, a direct atti
tude survey that deals with attitudes towards achievement
in school, was used in Honor's investigation. A method of
obtaining attitudes regarding achievement from TAT protocols,
developed b¥ Arnold, was also utilized. These two measures
were administered to a group of high school students who had
been identified as varying widely with respect to academic
achievement. It was hypothesized that the high achievers
would express favorable attitudes towards achievement on
both the TAT and attitude survey. Low achievers were ex
pected to express favorable attitudes on the attitude sur
vey and unfavorable attitudes on the TAT. The high achievers
performed as expected. The low achievers expressed unfavor
able attitudes on both attitude measurement devices for the
IIRodgers, loco cit.
12Stephen H. Honor, "The TAT and Direct Methods of Obtaining Educational Attitudes of High and Low Achieving High School Boys," Journal of Clinical Psychology, 28 (1972), 81-89.

10
majority of the low aChieving sample. In both cases, the
TAT was found to be a more accurate discriminative tool than
the attitude scale. It was concluded that the TAT was a
more potent predictor of high and low achievement than the
direct attitude scale. 13
Cummin utilized the TAT in an investigation of
executive performance. It was hypothesized that successful
executives would score high in Achievement, Power, Aggres
sion, and Deference needs. A written form of the TAT and a
modified version of McClelland's scoring manual for Achieve
ment, Affiliation, and Power needs were administered to the
subjects. The descriptive and scoring manual for Autonomy,
Aggression, and Deference needs were devised by Cummin. It
was concluded that the analysis of motives by means of the
TAT has promise for executive selection, although practical
use of this technique is limited. 14
Whitely, in a study designed to assess adaptive ego
functioning, stated, "The concept of adaptive ego function
ing relates to differences among individuals in their
capacity to cope with and to master the environment in which
they live.,,15 Citing a study involving superior achievers
and underachievers, Whitely continued.
l3Ibid.
l4pearson C. Cummin, "TAT Correlates of Executive Performance," Journal of Applied Psychology, 51 (1967),78-81.
l5John M. Whitely, "A Method for Assessing Adaptive Ego Functioning Using the Thematic Apperception Test," ~
Journal of Experimental Psychology, 34 (1966), 1-21.

11
It appears that there is substantial agreement between prediction of how the heroes in TAT stories should behave and emperical findings. The TAT heroes of superior achievers were more adaptive in their handling of needs and press, more often accepted responsibility for their behavior and were better able to control their impulses in the handling of conflict. 16
Harrison investigated leadership in children as re
lated to intellectual ability, academic performance, social
interaction patterns, and scores on a number of psychological
tests. The tests utilized were the WRAT reading and arith
metic subtests, the Draw-A-Man Test, the WISC vocabulary
and block design subtests, and five cards of the TAT. No
identifiable patterns of thematic expression discriminating
leaders from nonleaders were revealed by analysis of the TAT
results. However, a few isolated language and thematic
variables within chance limits did significantly differen
tiate the two groups of children. The results indicated
that children chosen as leaders tend to be healthier, higher
achievers in school, and more socially adept than those in
frequently chosen as leaders. 17
Schwartz administered the MMPI, TAT, Rorschach, and
Marlowe-Crowne Social Desirability Scale to nineteen college
students and nineteen psychiatric patients. The TAT was
scored for social desirability by two judges who assigned
16Ibid •
17C • Wade Harrison, James R. Rawls, and Donna J. Rawls, "Differences Between Leaders and Nonleaders in Six to Eleven-year-old Children," The Journal of Social Psychology, 84 (1971), 269-72.

12
each theme a score £rom one (not at all socially desirable)
to £ive (extremely socially desirable). Analysis of the
tests indicated that the true and false measures o£ the
Marlowe-Crowne SDS and the TAT measures o£ social desira
bility and adjustment had some degree o£ validity. Regard
ing the TAT measure o£ social desirability, Schwartz reported
that his investigationl
••• doesn't agree with Reynolds who found that jUdges did not agree in their ratings of the titles of frequently occurring TAT themes for the degree of social desirability. In this studYS the interrater reliability for the two judges was .87. 1
It can be concluded that there has been little
research but much discussion into the relationship that
exists between projective and objective techniques. Dis
agreement exists on whether projective techniques provide
the same information as objective techniques. These dif
fering viewpoints concerning information manifested on ob
jective and projective tests are expressed by personalities
in different fields o£ psychology.
18Stephen Schwartz, "Convergent and Discriminant Validity o£ Three Measures o£ Adjustment and Three Measures of Social Desirability," The Journal of Consulting and
Clinical Psychology, 39 (1972), 239-42.

Chapter )
METHODS AND PROCEDURES
The relationship between objective test results
and projective test results achieved by normal and abnormal
sUbjects was investigated in this study. The procedures
utilized in this investigation will be discussed in this
chapter, which has been divided into five sections. These
sections area subjects, instrumentation, procedure, data
collection, and statistical procedure.
SUBJECTS
Two groups of sUbjects, consisting of twenty indi
viduals per group, were selected for this study. The age
range was 17 to 24 years of age inclusive for both groups.
The control group was chosen from four departments at Emporia
Kansas State College. The departments were the Biology,
Art, Industrial Education, and Chemistry Departments. A list
was compiled of all the freshmen level class sections under
these four departments. Each class section was assigned a
four digit numeral from a book of random digits. The four
digits were added together and the sections corresponding
to the lowest and highest figures resulting from this summa
tion were chosen for this study. From the class rosters of
I)

14
these two sections, the names of all males enrolled in the
sections were obtained. Each name received a number from a
book of random numbers. The names of ten males that had been
paired with an odd number were chosen to take part in the
control group. This same procedure was used to randomly
select the ten female sUbjects for the control group.
The experimental group was randomly selected from
forty patients institutionalized at Osawatomie state Hospital.
The forty patients, comprised of twenty males and twenty
females, were between the ages of 17 and 24 inclusive. The
names of the twenty male patients each received a number from
a table of random numbers. Ten patients whose name had been
paired with an even number were chosen to take part in the
experimental group. The same procedure was used to choose
ten female subjects for the experimental group. One extra
male and one extra female subject were randomly chosen for
both the control group and experimental group to help cope
with the possible loss of sUbjects.
INSTRUMENTATION
The Personal Orientation Inventory, the Minnesota
Multiphasic Personality Inventory, and the Thematic Apper
ception Test were utilized in this study. The following
is a description of the above tests.

15
Personal Orientation Inyentory
The Personal Orientation Inventory, or POI, is a
150 item, forced choice questionnaire that requires about
thirty minutes to complete. The POI attempts to identify the
self-actualized person who is more fully functioning and
lives a more enriched life than the average person. The 150
items are scored first for two basic scales of self-
actualization. The Support Scale was developed to measure
whether reactivity is basically "other-oriented" or "self
oriented". A self-actualized person integrates both orien
tations and this integration expresses itself in an optimal
ratio between other directedness and inner directedness.
The Time Competence Scale measures the degree to which an
individual uses his time effectively. Ratio scores are
19expressed for both scales.
The "self-actualized value" scale (SAV scale) of the
POI was used in this investigation. High scores on the SAV
scale implies the presence of self-actualized personality
traits.
Minnesota Multiphasic Personality Inyentory
The Minnesota Multiphasic Personality Inventory, or
MMPI, is a 566 item test designed to provide an objective
assessment of some of the major personality characteristics
19J. Fox and R. R. Knapp, "Assessment of Selfactualization of Psychiatric Patientsl Validity of the Personal Orientation Inventory," Educational and Psychological Measurement, 28 (1968), 565-66.

16
that affect personal and social adjustment. Two scales were
selected for use in this study out of the original ten pro
file scales that have been developed for clinical use of
the MMPI. These scales were the psychopathic deviate scale
(scale Pd) and the social introversion scale (scale Si).
The psychopathic deviate scale was developed to
measure the personality characteristics of the amoral and
asocial subgroup of persons with psychopathic personality
disorders. The main features of the personality pattern in-
elude a repeated and flagrant disregard for social customs
and an emotional shallowness in relation to others. Some of
the items of the scale involve poor morale, sexual problems,
and frank admission of personal limitations. 20
The social introversion scale contains items that
describe the person's uneasiness in social situations in
addition to having items that cover a variety of special
. . . . 21sensitivities, 1nsecur1t1es, and worr1es. Individuals
who score high on the Si scale often prefer to avoid social
activity and tend to be introverted, shy and socially inept.
Low scorers are gregarious, outgoing, sociable, assertive,
. 1· 1 . 22and adept at 1nterpersona man1pu at1on.
2Ow. Grant Dahlstrom and George Schlager Welsh, AD MMPI Handbook (Minneapolis. University of Minnesota Press, 1960), pp. 60-63.
211 .b1d., p. 77.
22Richard I. Lanyon, A Handbook of MMPI Group Profiles (Minneapolis. University of Minnesota Press, 1968), p. 8.

17
Thematic Apperception Test
The Thematic Apperception Test, or TAT, consists of
thirty pictures printed on individual cards. For administra
tion of the test, ten cards are usually chosen from the
available thirty. The subject is instructed to tell a story
about each picture presented to him. He is asked to include
what the events were that led up to the situation depicted
in the picture, what the actual situation is, and what the
final outcome might be. The stories are later analyzed for
information concerning the individual's fantasies, attitudes,
aspirations, and preoccupations. In this investigation,
TAT cards 1, 2, and lJ MF were utilized.
The TAT was designed for investigative purposes and
may be viewed as representative of reality situations. The
pictures permit systematic exploration of specific areas of
potential conflict. Experimental use has revealed that the
TAT is a multidimensional instrument that elicits from a
subject a rich source of data about himself. 2J The TAT 1S
capable of a wide variety of interpretations. Clues to 1 ,i personality can be identified through the subject's tendency
to interpret ambiguous situations in directions conforming to
. . 24h1s own present wants and to past behav10rs.
'I 2JHarold H. Anderson and Gladys L. Anderson, An Intro
duction to Pro "ective Techni ues (Englewood Cliffs. Prentice~ Hall, Inc., 1951 , pp. 181-82.
24Leonard W. Ferguson, Personality Measurement (New York. McGraw-Hill Book Co., 1952), pp. J59-60.

18
One conclusion that can be formulated is that the PO~
MMPI, and TAT provide information pertaining to how a~ indi
vidual responds to his environment. This information includes
his interpersonal contacts, as well as how he uses his re
sources to form positive and healthy concepts of life and
human nature.
PROCEDURES
The POI and MMPI were administered to the control
group us~ng the standard procedures outlined by the authors
of the tests. The instructions printed on the front of the
test booklets were carefully explained to the subjects.
After administration of the POI and MMPI, the TAT was ad
ministered in group form. 25 The sUbjects were required to
write out their stories in response to each of the three
TAT cards. The cards were presented one at a time and placed
where they could be seen clearly. The subjects comprising
the experimental group were administered the same three tests
as the control group and received identical instructions.
All of the subjects in the study were able to cooperate and
it was not necessary to use the two extra subjects.
25Leopold Bellak, The TAT and CAT in Clinical Use (New Yorks Grune and Stratton, 1971), p. 115.

19
DATA COLLECTION
Data collection consisted of administering and col
lecting the answer sheets in order for them to be scored and
recorded. Each subject's set of test data received a code
number which simplified organizing and recording the data.
STATISTICAL PROCEDURE
The subjects' MMPI answer sheets were hand scored.
The raw scores were placed on MMPI profile sheets which con
tained precalculated T scores. The T scores of the Pd and
Si scales were entered on tables for use in the study.
The subjects' POI answer sheets were machine scored.
The raw scores were placed on POI profile sheets which con
tained precalculated T scores. The T scores on the SAY scale
were entered on tables.
Each subject's set of three TAT stories were rated by
the experimenter on a three point continuum. Point one im
plied "difficulty in coping effectively with environmental
demands." This level of response corresponded to a T score
of less than 43 and was designated as being below average for
the normal population. Point three implied the "ability to
cope effectively with environmental demands." This level
of response corresponded to a T score greater than 57 and was
designated as being above average for the normal population.
Point two was designated as a neutral continuum position.
This level of response corresponded to T scores from 43 to 57

20
and was designated as being average for the normal popula
tion. For a more detailed examination of the continuum,
see Appendix A.
The accuracy of the experimenter's TAT ratings were
checked by a psychologist with experience in projective
techniques. Using the continuum, the psychologist rated
eight sets of TAT stories. Four sets of stories were ran
domly selected from the experimental group and four sets
were randomly selected from the control group. The results
of the psychologist's ratings were withheld until the experi
menter had completed a TAT continuum rating on each subject
involved in the study. The completed ratings performed by
the psychologist and experimenter were then compared. When
a discrepancy was found as to what level a particular set of
TAT stories should receive, the two ratings were averaged
together. The raw continuum scores that resulted from this
procedure were converted into T scores by using the for
26mula I
T :: 50 + 10Z
Where, Z:: X - X = A standard score S
X ; An original measurement i = The mean of the distribution S ; The standard deviation of the distribution
26Woodrow W. Wyatt and Charles M. Bridges, Statistics for the Behavioral Sciences (Boston: D. C. Heath and Company, 1967), p. 36.

21
All of the statistical information concerning the raw TAT
scores was programmed into a computer which then calculated
the T scores.
The T scores for the POI, MMPI, and TAT were recorded
on IBM cards and the mean T scores for the male control grou~
female control group, male experimental group, and female
experimental group were calculated. A computer was then used
to calculate !-tests between the mean T scores achieved by
the four groups of sUbjects. 27 A table of the £-distribu
tion contained !-tests indices of various levels of signi
ficance. 28 After examining this table, the £-test indices
calculated in this study were reorganized into five tables to
simplify examination and analysis of the data. The procedure
of using !-tests was for the purpose of detecting a level of
significance, above which the hypothesis was rejected.
After consultation with authorities, it was decided
that in order to reject a group-hypotheses, three or more
factors should be significantly different on at least the
.05 level. Two or less factors, significantly different at
the .05 level, were the criteria to accept the hypotheses. 29
The statistical procedures employed in this study
involved the computation of t-tests between the mean T scores
27B. J. Winer, Statistical Princi les in Ex erimental Design {New Yorks McGraw-Hill, 1962 , p. 218.
28Wyatt, Ope cit., p. 271.
29Based on consultation with Dr. Cooper Holmes and Dr. Chris Joseph.

22
of the POI, MMPI, and TAT. The computing of 1-tests was for
the purpose of revealing significant differences, thereby
accepting or rejecting the hypotheses.
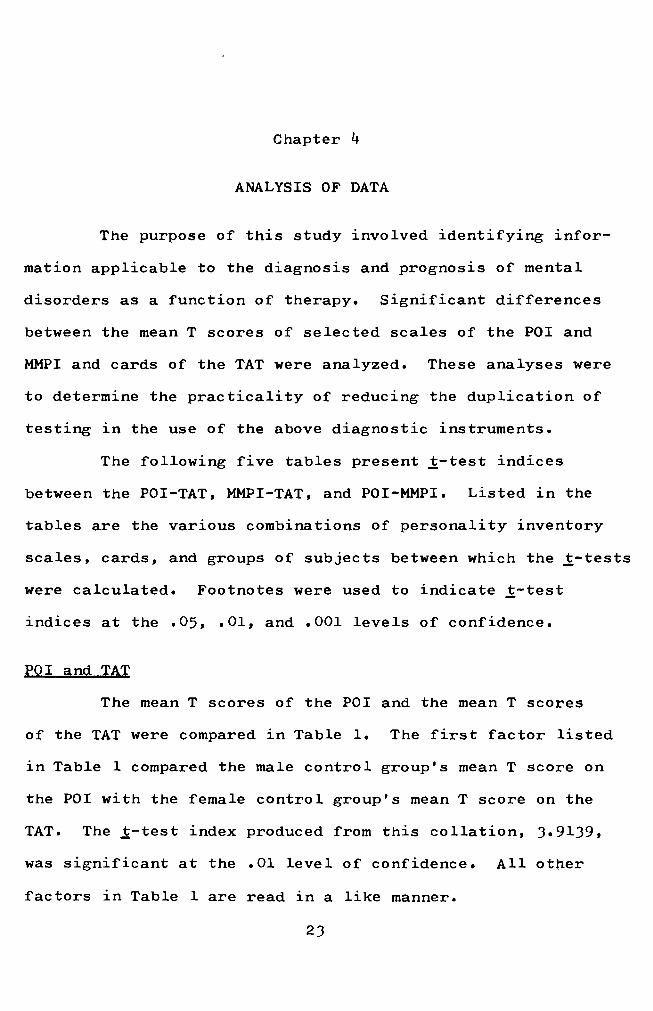
Chapter 4
ANALYSIS OF DATA
The purpose of this study involved identifying infor
mation applicable to the diagnosis and prognosis of mental
disorders as a function of therapy. Significant differences
between the mean T scores of selected scales of the POI and
MMPI and cards of the TAT were analyzed. These analyses were
to determine the practicality of reducing the duplication of
testing in the use of the above diagnostic instruments.
The following five tables present £-test indices
between the POI-TAT, MMPI-TAT, and POI-MMPI. Listed in the
tables are the various combinations of personality inventory
scales, cards, and groups of subjects between which the £-tests
were calculated. Footnotes were used to indicate £-test
indices at the .05, .01, and .001 levels of confidence.
POI and TAT
The mean T scores of the POI and the mean T scores
of the TAT were compared in Table 1. The first factor listed
1n Table 1 compared the male control group's mean T score on
the POI with the female control group's mean T score on the
TAT. The £-test index produced from this collation, 3.9139,
was significant at the .01 level of confidence. All otper
factors in Table 1 are read in a like manner.
23

24
Table 1
£-test Indices for Experimental and Control Groups on Mean T Scores of TAT and POI
Group Personality Test t-test
Male Control Female Control
Male Control Male Experimental
Male Control Female Experimental
Female Control Male Experimental
Female Control Female Experimental
Male Experimental Female Experimental
POI TAT
POI TAT
POI TAT
POI TAT
POI TAT
POI TAT
J.9lJ9b
1.1248
.6627
.44J6
1. 0428
.0662
a. OS level of significance
b. Ol level of significance
c. OOl level of significance
Analysis of Data in Table 1
No significant differences were computed between the
sUbjects' responses on the TAT and POI with the exception of
the male control-female control factor. The occurrence of
a significant difference in this factor may have been due to
an inefficient use of time and effort spent by the male
control group in answering the POI questions carefully. Low
scores on the POI may reflect a hurried or careless approach
to the test since it measures the effective use of time and

25
the optimal use of an individual's resources. Since only
one factor demonstrated a significant difference, the hy
pothesis was accepted that there were no significant dif
ferences between the mean T scores of the TAT and POI. This
implies that there is little difference between the infor
mation provided by the TAT and POI about the sUbjects in this
study.
TAT and MMPI {Pdl
Table 2 compares the mean T scores of the TAT and
the mean T scores of the MMPI (Pd). The purpose of the
table was to make known any significant differences that
might exist between the MMPI (Pd) and TAT. Table 2, as well
as the other tables that follow, should be read in the same
manner as 1n the reading of Table I on page 24.
Analysis of Data in Table 2
Analysis of the data in Table 2 revealed the factors
that were significantly different between the TAT and
MMPI (Pd) at the .05 level of significance or greater. Sig
nificant differences were revealed on all factors with the
exception of the male control-female control factor. The
probable cause of this anomaly was that the TAT themes
expressed by the female control group implied an above
average ability in coping with environmental demands. The
female control group's mean TAT score was high enough to
warrant this assumption. The hypothesis that there were no
significant differences between the mean T scores of the

26
Table 2
!-test Indices for Experimental and Control Groups on Mean T Scores of TAT and MMPI (Pd)
Group Personality Test !-test
Male Control Female Control
Male Control Male Experimental
Male Control Female Experimental
Female Control Male Experimental
Female Control Female Experimental
Male Experimental Female Experimental
MMPI POI
MMPI POI
MMPI POI
MMPI POI
MMPI POI
MMPI POI
(Pd)
(Pd)
(Pd)
(Pd)
(Pd)
(Pd)
.6320
3.2064b
4.l557c
2.l325a
2.884lb
lO.2837 c
a. 05 level of significance
b. Ol level of significance
c. OOl level of significance
TAT and MMPI (Pd) was rejected since five factors showed
significance. It can be inferred that a subject revealing
factors of good adjustment on the TAT would correspondingly
score in the normal range or between a T score of 46 and 54
0 on the MMPI (Pd),3 thereby verifying a lack of pathological
symptoms.
30Starke R. Hathaway and Elio D. Monachesi, Adolescent Personality and Behavior (Minneapolis I University of Minnesota Press, 1963), p. 30.

27
TAT and MMPI (sil
The mean T scores of the TAT were compared with the
mean T scores of the MMPI (Si) in Table 3. The purpose of
the table was to show significant differences, if any, be
tween the TAT and MMPI (Si) by using a control and experi
mental group of females and males.
Table 3
t-test Indices for Experimental and Control Groups on Mean T Scores of TAT and MMPI (Si)
Group Personality Test t-test
Ma Ie Co ntro 1 Female Control
MMPI (Si) TAT .6112
Male Control Male Experimental
MMPI (Si) TAT 2.l586a
Male Control Female Experimental
MMPI (Si) TAT 2.9859b
Female Contro 1 Male Experimental
MMPI (Si) TAT 1. 3514
Female Control Female Experimental
MMPI (Si) TAT 2.lll7a
Male Experimental Female Experimental
MMPI (Si) TAT 1.1959
a.05 level of significance
i. ,.,
I b. Ol level of significance
c.OOl level of significance
Analysis of Data in Table 3
Three of the six factors of the TAT and MMPI (Si) had
significant differences at the .05 level or greater. The

28
factors that did not embody significant differences were the
male control-female control, female control-male experimental
and male experimental-female experimental factors.
The male control group's high scoring on the MMPI
(Si) was the most likely cause for an absence of a signi
ficant difference in the male control-female control factor.
This group's responses on the Si scale were on the average
slightly above the normal range.
The lack of a significant difference in the female
control-male experimental factor may have been due to an
overall difficulty by the male experimental group in coping
adequately to environmental challenges. This difficulty
was indicated in the male experimental group's low mean T
score on the TAT continuum.
An absence of a significant difference between the
male experimental-female experimental factor may have been
caused by the female experimental group experiencing diffi
culty in contending with environmental demands. This dif
ficulty was signified in the low scores achieved by the
female experimental group on the TAT continuum. The mean
TAT score produced by this group was the lowest of the four
groups of subjects involved in the study and was designated
as being below average for the normal population.
As a result of the findings described above, the
hypothesis that there were no significant differences between
the mean T scores of the TAT and MMPI (Si) was rejected.

29
There~ore, it can be stated that a subject producing TAT
responses re~lecting at least an average amount o~ per
sonality integration would be apt to score in the normal
range on the MMPI (Si).
POI and MMPI (Pd)
The mean T scores of the POI and the mean T scores
o~ the Pd scale of the MMPI were compared in Table 4. Plac
1ng the test scores in tabular form facilitated examination
and analysis o~ the data.
Analysis o~ Data in Table 4
The comparisons of all six factors o~ the POI and
MMPI (pd) revealed signi~icant dif~erences at the .01 level
o~ con~idence. The most likely explanation ~or the occur
rence o~ these signi~icant di~~erences is the diversity be
tween the POI and MMPI. Higher scores on the POI imply a
person who is more ~ully ~unctioning, who makes good use o~
his talents and capabilities, and who enjoys a more enriched
li~e. Higher scores on the MMPI (Pd), however, suggest the
characteristics o~ emotional shallowness in relation to
others and poor morale. The hypothesis stating there were
no signi~icant di~ferences between the mean T scores o~ the
POI and MMPI (Pd) was rejected since all ~actors showed
signi~icant di~~erences. This implies that a person scoring
high on the POI would score in the normal range or below on
the MMPI (Pd).

JO
Table 4
!-test Indices for Experimental and Control Groups on Mean T Scores of POI and MMPI (Pd)
Group Personality Test !-test
Male Control Female Control
Male Control Male Experimental
Male Control Female Experimental
Female Control Male Experimental
Female Control Female Experimental
Male Experimental Female Experimental
POI MMPI
POI MMPI
POI MMPI
POI MMPI
POI MMPI
POI MMPI
(Pd)
(Pd)
(Pd)
(Pd)
(Pd)
(Pd)
J.097Jb
8.7940c
6.8646c
7.6l72c
5.7908c
6.2656c
a. 05 level of significance
b.Ol level of significance
c.OOl level of significance
POI and MMPI (Si)
Compared in Table 5 were the mean T scores of the
POI and the mean T scores of the MMPI (Si). The table
facilitated analysis of the data in order to examine any
significant differences between the POI and MMPI (Si).
Analysis of Data in Table 5
Significant differences were computed between the POI
and MMPI (Si). Four of the factors were found to be signi
ficant at the .05 level of confidence or greater. The

Jl
Table 5
!-test Indices for Experimental and Control Groups on Mean T Scores of POI and MMPI (Si)
Group Personality Test !-test
Male Control Female Control
Male Control Male Experimental
Male Control Female Experimental
Female Control Male Experimental
Female Control Female Experimental
Male Experimental Female Experimental
POI MMPI (Si)
POI MMPI (Si)
POI MMPI (Si)
POI MMPI (Si)
POI MMPI (Si)
POI MMPI (Si)
2.4J18a
1.6709
5.7511c
.0000
4.J657 c
4.9816 c
a.05 level of significance
b. Ol level of significance
c. OOl level of significance
statistical treatment of the male control-male experimental
and female control-male experimental factors did not reveal
significant differences.
The absence of a significant difference in the male
control-male experimental factor was probably caused by the
low scoring on the Si scale by the male experimental group.
The mean Si scale attributed to this group was within the
normal range for the MMPl t but was the lowest of the four
groups of SUbjects involved in this study.

32
The probable cause for a !-test index of .0000 within
the female control-male experimental factor also envolved the
low scores produced by the male experimental group on the Si
scale. In addition, the female control group's mean POI
score was the highest of the four groups of subjects. The
scores on the POI and MMPI (Si) both imply normal function
ing and no significant difference was noted.
Since four factors contained significant differences,
the hypothesis that there were no significant differences
between the POI and MMPI (Si) was rejected. A person
scor1ng well on the POI would therefore be expected to score
within the normal limits of the MMPI (Si).
Summary of Findings
Analysis of the data implied that little difference
existed between the information provided by the TAT and POI
about the subjects in this study. An individual scoring
high on the POI or TAT would most likely score in the normal
range on the Pd and Si scales of the MMPI. Any duplication
of information between the POI, TAT, and MMPI would result
1n significant differences between the factors of the POI
MMPI and TAT-MMPI. These significant differences would occur
because high scores on the POI and TAT imply normal function
ing, while high scores on the MMPI indicate possible patho
logical disorders.
A collation of the TAT and MMPI (Pd) indicated that
about 83 percent of the factors showed significance on at

33
least the .05 level of confidence. Comparing the POI and
MMPI (Pd) revealed that 100 percent of the factors were
significant on at least the .01 level of confidence. This
was the normal expectancy range of scores.
Comparing the TAT and MMPI (Si) revealed that
significant differences on the .05 level of confidence or
greater existed between 50 percent of the factors. About
66 percent of the factors between the POI and MMPI (Si)
showed significance on the .05 level.
A congruency by the POI, TAT, and MMPI of information
about the subjects in this study was implied by the signifi
cant differences described above. Ten factors of the POI
MMPI were significantly different on at least the .05 level
of confidence. Eight factors of the TAT-MMPI were signifi
cantly different on the same level of confidence. The
number of significantly different POI-MMPI factors was about
sixteen percentage points greater than the number of TAT
MMPI factors showing significant differences. The mean T
scores of the TAT and POI duplicated the mean T scores of
the MMPI. The POI, however, evidently produced more scores
of the type replicating the information obtained from the
MMPI.

Chapter 5
SUMMARY, CONCLUSIONS, AND RECOMMENDATIONS
This study was designed to provide information on
reducing the dupiication in the use of projective and
objective testing. The information provided by such tests
plays an important part in the diagnosis and treatment of
mental disorders. Gathering and analyzing the data in this
investigation resulted in a number of conclusions. These
conclusions could make possible a more effective use of the
POI, MMPI, and TAT.
SUMMARY
An experimental and control group, each consisting
of twenty sUbjects between the ages of 17 and 24 inclusive,
were randomly selected to participate in the study. The
experimental group was selected from patients institutional
ized at Osawatomie State Hospital. The control group was
chosen from the freshman class of 1974 at Emporia Kansas
State College. All subjects were administered the POI and
MMPI in their entirety and cards 1, 2, and 1) MF of the TAT.
After administration and scoring of the subjects' responses
to the instruments, £-tests were used to detect significant
differences between the mean T scores of the SAY scale of the
POI, scales Pd and Si of the MMPI, and the three cards of
)4

35
the TAT. It was hypothesized that there would be no signifi
cant differences between these mean T scores.
A lack of significant differences between the POI
and TAT was revealed by analysis of the data. This implied
that the information provided by the POI and TAT about the
subjects in this study was quite similar. The analyses of
the POI-MMPI (Pd, Si) and TAT-MMPI (Pd, Si), which were
conducted in the same manner as in the comparison of the POI
and TAT, revealed significant differences at the .05 level
of confidence or greater. The most likely cause of these
significant differences was that high scores on the POI and
TAT imply normal functioning while high scores on the MMPI
imply pathological disorders. A congruency of the mean T
scores of the POI, MMPI, and TAT was tmplied by the signi
ficant differences that were calculated.
CONCLUSIONS
One of the findings of this study is that the POI
and TAT evoke quite similar information. Therefore, in a
battery of tests, only one of the two instruments would
probably be needed for diagnostic purposes. It has been re
vealed that the POI indicated only normal responses. Both
the MMPI and TAT indicate normal and abnormal responses. The
use of the MMPI and TAT in the diagnosis and prognosis of men
tal disorders would provide information concerning aspects Of
good personality functioning in addition to any indications

J6
of pathological disorders. The use of the POI could add
supportive information to the findings of the MMPI and TAT
1n cases of normal personality diagnosis, and therefore might
be useful in verifying the information obtained from the ad
ministration of these two tests.
RECOMMENDATIONS
The following four recommendations might prove
beneficial to researchers in this area of study.
1. The use of a larger number of subjects for both
the control and experimental groups would improve the ef
fectiveness of the sampling procedures. This improvement
would result because larger groups of randomly selected sub
jects are apt to be more representative of the normal popu
lation than smaller groups.
2. A five-point continuum could be substituted for
the three-point continuum utilized in this study. The
addition of two points to the scale with which to perform
the TAT ratings would contribute to the ratings' accuracy
by enabling the scoring to be more precise.
J. Specific groups of mental illness such as
schizophrenia could be isolated and compared to normal
groups of subjects by using the three instruments described
in this study.
4. Using a greater number of scales of the POI and
MMPI and cards of the TAT would increase the reliability of
the instruments.

L(

BIBLIOGRAPHY
BOOKS
Abt, Lawrence and Leopold Bellak. Projective Psychology. New Yorkr Al£red A. Knop£, 195 0 •
Allport, Gordon W. Personality and Social Encounter. Boston. Beacon Press, 1960.
Anderson, Harold H. and 'Gladys L. Anderson. An Introduction to Projective Techniques. Englewood Clif£s. Prentice-Hall, Inc., 1951.
Bellak, Leopold. The TAT and CAT in Clinical Use. New York. Grune and Stratton, 1971.
Dahlstrom, W. Grant and George Schlager Welsh. An MMPI Handbook. Minneapolisr University of Minnesota Press, 1960.
Ferguson, Leonard W. Personality Measurement. New Yorkl McGraw-Hill Book Company, 1952.
Hathaway, Starke R. and Elio D. Monachesi. Adolescent Personality and Behavior. Minneapolis I University of Minnesota Press, 1963.
Lanyon, Richard I. A Handbook of MMPI Group Profiles. Minneapolis I University of Minnesota Press, 1968.
Maslow, Abraham. Motivation and Personality. New Yorks Harper and Brothers, 1954.
Winer, B. J. Statistical Principles in Experimental Design. New Yorkl McGraw-Hill Book Company, 1962.
Wyatt, Woodrow W. and Charles M. Bridges. Statistics for the Behavioral Sciences. Bostonl D. C. Heath and Company, 1967.
PERIODICALS
Cummin, Pearson C. "TAT Correlates of Executive Performance." Journal of Applied Psychology, 51 (1967), 78-81.
38

J9
Fox, J. and R. R. Knapp. "Assessment of Self-Actualization of Psychiatric Patients. Validity of the Personal Orientation Inventory," Educational and Psychological Measurement, 28 (1968), 565-66.
Honor, Stephen H. "The TAT and Direct Methods of Obtaining Educational Attitudes of High and Low Achievement in High School Boys," Journal of Clinical Psychology, 29 (1965) 168-72.
Knapp, Robert R. "The Relationship of a Measure of SelfActualization to Neuroticism and Extraversion," Journal of Consulting Psychology, 29 (1965), 168-72.
Rodgers, Charles W. "The Relationship of Projective to Direct Expression of Need Aggression, Achievement, and Nurturance in Selected Populations," Dissertation Abstracts, JJBs 2J55, November, 1972.
Schwartz, Stephen. Three Measures Desirability, " Psychology, J9
Shostrom, Everett L. and Robert R. Knapp. "The Relationship of a Measure of Self-Actualization(POI) to a Measure of Pathology (MMPI) and to Therapeutic Growth," American Journal of Psychotherapy, 20 (1966), 19J-20l.
Whitely, John M. "A Method for Assessing Adaptive Ego Functioning Using the Thematic Apperception Test," The Journal of Experimental Psychology, J4 (1966), 1-21.

Of"(
S3~I<IN3ddV

v XION3:ddV

THEMATIC APPERCEPTION TEST CONTINUUM
Cards 1, 2, and 13 MF
Subject Number
After reading the enclosed set of TAT stories,
please summarize their overall tone and mood by placing a
mark on the appropriate continuum point. The three con
tinuum points correspond to the three levels of response
listed below.
I I l 1 2 3
1 • • • Difficulty in coping with environmental demands
2 • • • Neither distinct ability nor distinct difficulty in coping with environmental demands
3 ••• Ability to cope effectively with environmental demands
42

.LY.L aNY I IdHH I IOd 3H.L ..!IO S3HO:)S }\VH
8 XIaN3ddY

Table 6
Male Control Group Raw Scores of the POI (SA), MMPI (Pd, Si), and
TAT (Cards 1, 2, 13 MF)
Raw Scores
MMPI
Subject POI Pd Si TAT
1 20 2822 3
2 24 21 32 3
16 24 2173
4 2017 28 3
20 20 25 25
6 116 25 36
14 2307 23
8 20 20 24 3
112 289 47
10 117 2827
44

Table 7
Female Control Group Raw Scores of the POI, MMPI, and TAT
Raw Scores
MMPI
SUbject POI Pd Si TAT
11 2J 21 21 J
12 20 22 J1 2
1J 20 26 1) )
14 20 19 21 2
15 19 17 28 )
16 19 24 )6 2
17 14 29 2) 2
18 2) 20 22 )
19 24 16 )5 )
20 16 19 )) )
45

Table 8
Male Experimental Group Raw Scores of the POI, MMPI, and TAT
Raw Scores
MMPI
SUbject POI Pd Si TAT
21 19 26 16 3
22 21 28 27 2
23 22 28 17 3
24 16 29 35 1
25 17 32 27 1
26 20 31 23 1
27 20 31 12 1
28 13 3 1 16 1
29 14 32 31 2
30 24 3 0 28 2
46

Table 9
Female Experimental Group Raw Scores of the POI, MMPI, and TAT
Raw Scores
MMPI
Subject
31
4 32'i
~ ,1 ,~ ;tf
j " 33 1 ·1i 34 ~ .'1
35
36
37
38
39
40
POI
17
16
20
17
19
14
23
10
17
17
Pd
37
36
34
35
33
18
34
32
28
27
47
Si TAT
47 1
46 1
42 1
39 1
31 2
34 1
27 1
41 2
44 2
41 3

~V~ aNV 'IdHW 'IOd 3H~ ~O S3~O:)S ~
:) XI<IN3ddV

Table 10
Male Control Group T Scores of the POI (SA), MMPI (Pd, Si) and TAT (Cards 1, 2, 13 MF)
=
T Scores
MMPI
SUbject POI Pd Si TAT
1 49 57 53 62
2 62 55 58 62
3 36 46 49 50
4 39 53 53 62
5 49 64 45 50
6 36 64 63 38
7 29 60 55 50
8 49 53 49 62
9 22 71 74 38
10 39 69 53 38
Mean T Scores 41. ° 59.2 55.0 51.8
1 1 }
'1
J,I
49

Table 11
Female Control Group T Scores of the POI (SA), MMPI (Pd, Si) and TAT (Cards 1, 2, 1) MF)
T Scores
MMPI
SUbject POI Pd TATSi
11 624659 55
12 49 505657
1) )8 6249 67
14 46 5049 50
6215 46 46 5)
16 46 62 6) 50
17 48 5029 74
18 625) 4759
19 4) 6262 62
20 )6 60 6250
Mean T Scores 48.4 51.955.7 57.2
50

Table 12
Male Experimental Group T Scores of the POI (SA), MMPI (Pd, Si) and TAT (Cards 1, 2, and 13 MF)
SUbject
T Scores
POI
MMPI
TATPd Si
21 46 67 41 62
22 52 71 52 50
23 55 71 42 62
24 36 74 62 38
25 39 81 52 38
26 49 79 48 38
27 49 79 37 38
28 26 79 41 38
29 29 81 56 50
30 62 76 53 50
Mean T Scores 44.3 75.8 48.4 46.4
51

Table 13
Female Experimental Group T Scores of the POI (SA), MMPI (Pd, Si) and TAT (Cards 1, 2, 13 MF)
T Scores
MMPI
Subject POI Pd Si TAT
31 39 93 74 38
32 36 90 73 38
33 49 86 69 38
34 39 88 66 38
35 46 83 56 50
36 29 48 61 38
37 59 86 52 38
38 16 81 68 50
39 39 71 71 50
40 39 69 68 62
Mean T Scores 39.1 79.5 65.8 44.0
52