Embed Size (px)
Citation preview
Fort Hays State UniversityFHSU Scholars Repository
Master's Theses Graduate School
Spring 2012
A Comparison Of Three Bicycle Pedal Types AndPower OutputBrandon KuhnFort Hays State University
Follow this and additional works at: https://scholars.fhsu.edu/theses
Part of the Rehabilitation and Therapy Commons, and the Sports Sciences Commons
This Thesis is brought to you for free and open access by the Graduate School at FHSU Scholars Repository. It has been accepted for inclusion inMaster's Theses by an authorized administrator of FHSU Scholars Repository.
Recommended CitationKuhn, Brandon, "A Comparison Of Three Bicycle Pedal Types And Power Output" (2012). Master's Theses. 119.https://scholars.fhsu.edu/theses/119
A COMPARISON OF THREE BICYCLE PEDAL TYPES AND POWER OUTPUT
being
A Thesis Presented to the Graduate Faculty
of the Fort Hays State University in
Partial Fulfillment of the Requirements for
the Degree of Master of Science
by
Brandon Kuhn
B.S., Fort Hays State University
Date_____________________ Approved________________________________
Major Professor
Approved________________________________
Chair, Graduate Council

Thesis Committee Approval
The Thesis Committee of Brandon J. Kuhn hereby approves his thesis as meeting partial
fulfillment of the requirements for the Degree of Master of Science
Approved __________________________ Dr. John Zody
Chair, Thesis Committee Approved __________________________ Dr. Gavin Buffington Committee Member Approved __________________________ Dr. Joyce Ellis Committee Member Approved __________________________ Dr. Greg Kandt Committee Member
1
ABSTRACT
The purpose of this study was to examine the power output over a 30-second
maximum effort bicycle sprint with three different pedal types; clipless, toe-strap, and
flat. The participants for this investigation were eight (7 males and 1 female) mountain
bikers with ages between 20 and 55 ( Age = 40) from the Central Kansas Mountain Bike
Club. Each participant was required to provide his or her own bicycle and the researchers
provided the training stand, Saris CycleOps PowerTap rear wheel, and Garmin Edge 500
cycling computer used for data collection. Testing procedure consisted of a warmup, 30-
second maximal sprint with one pedal type, followed by a 20-minute passive recovery,
the second 30-second sprint, followed by a 20-minute passive recovery, and finally the
third 30-second sprint with the last pedal type. Pedal sequence was randomized for each
individual. Mean power output was higher using clipless pedals ( = 617 watts, SD =
112) than toe-strap ( = 572 watts, SD = 77), and flat ( = 566 watts, SD = 83). Pedal
comparison results showed significant differences in power output when comparing
clipless pedals to toe-strap pedals (p < .001) and clipless pedals to flat pedals (p < .000),
but not between toe-strap pedals and flat pedals (p < .644). Tukey LSD test analysis
showed significant difference between intervals: 5-second and 30-second (p < .008), and
10-second and 30-second (p < .03), but no significance between any other intervals.

2
ACKNOWLEDGMENTS
I would like to express my sincerest gratitude to all of the individuals who have
contributed to the completion of this study. First, I must thank Dr. John Zody for his
time, patience, and encouragement throughout this entire process. To my committee
members; Dr. Gavin Buffington, Dr. Joyce Ellis, and Dr. Greg Kandt for their advice,
time and encouragement. To Dr. John Raacke for his time assistance with statistical
analysis and interpretation. Finally, thanks to the participants for making this study
possible.
3
DEDICATION
To my parents, Tom and Cathy Kuhn, for all of your love and support, I can never
express my gratitude. To my brother, Brian, for the support and perfectly timed humor
that made this project possible. Finally, to my friends who stood by my side throughout
this process, for all the help you have provided, I cannot thank you enough.

4
Table of Contents
Page
ABSTRACT ......................................................................................................................... i
ACKNOWLEDGMENTS .................................................................................................. ii
DEDICATION ................................................................................................................... iii
TABLE OF CONTENTS ................................................................................................... iv
LIST OF TABLES ............................................................................................................. vi
LIST OF FIGURES .......................................................................................................... vii
LIST OF APPENDIXES.................................................................................................. viii
INTRODUCTION
Statement of the Problem .........................................................................................2
Sub-problems ...........................................................................................................2
Definition of Terms..................................................................................................3
Limitations ...............................................................................................................4
Delimitations ............................................................................................................4
Assumptions .............................................................................................................5
Null Hypotheses .......................................................................................................5
Significance of the Study .........................................................................................5
REVIEW OF LITERATURE
Introduction ..............................................................................................................7
Biomechanical Factors .............................................................................................7
Wingate Test and Peak Power .................................................................................8
Sprint Power.............................................................................................................9
Recovery from Maximal Effort ...............................................................................9
5
Validity and Reliability of PowerTap ....................................................................10
Recovery Duration .................................................................................................11
Summary ................................................................................................................12
METHODOLOGY
Introduction ............................................................................................................13
Preliminary Procedures ..........................................................................................13
Subjects ..................................................................................................................13
Instrumentation ......................................................................................................14
Test Administration ..............................................................................................15
Research Design.....................................................................................................15
Instruction for Participants .....................................................................................16
Data Collection ......................................................................................................16
RESULTS
Introduction ............................................................................................................17
Pedal Type Comparison Results ............................................................................17
Mean Power Output ...............................................................................................18
Interval Comparison Results ..................................................................................19
Conclusions ............................................................................................................21
SUMMARY AND RECOMMENDATIONS
Introduction ............................................................................................................22
Summary ................................................................................................................22
Recommendations for Further Study .....................................................................25
REFERENCES ..................................................................................................................26

6

7
LIST OF TABLES
Table Page
1 Repeated Measures of ANOVA.............................................................................17
2 Pedal Types ............................................................................................................18
3 Interval ANOVA ....................................................................................................20
4 Tukey LSD Post Hoc Interval Analysis .................................................................20

8
LIST OF FIGURES
Figure Page
1 Mean Power Output ...............................................................................................19
9
LIST OF APPENDIXES
Appendix Page
A Participation Flyer ..................................................................................................31
B Informed Consent...................................................................................................33
C Mean and Standard Deviation for Intervals ...........................................................38
10
CHAPTER I
Introduction
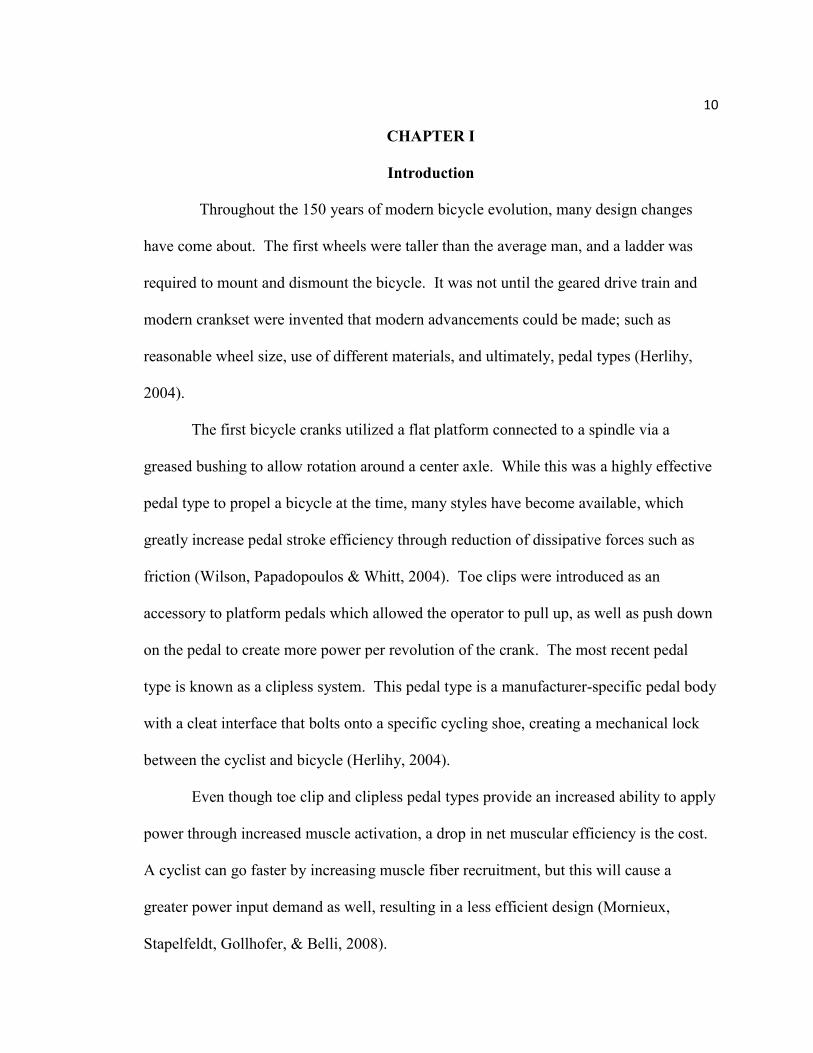
Throughout the 150 years of modern bicycle evolution, many design changes
have come about. The first wheels were taller than the average man, and a ladder was
required to mount and dismount the bicycle. It was not until the geared drive train and
modern crankset were invented that modern advancements could be made; such as
reasonable wheel size, use of different materials, and ultimately, pedal types (Herlihy,
2004).
The first bicycle cranks utilized a flat platform connected to a spindle via a
greased bushing to allow rotation around a center axle. While this was a highly effective
pedal type to propel a bicycle at the time, many styles have become available, which
greatly increase pedal stroke efficiency through reduction of dissipative forces such as
friction (Wilson, Papadopoulos & Whitt, 2004). Toe clips were introduced as an
accessory to platform pedals which allowed the operator to pull up, as well as push down
on the pedal to create more power per revolution of the crank. The most recent pedal
type is known as a clipless system. This pedal type is a manufacturer-specific pedal body
with a cleat interface that bolts onto a specific cycling shoe, creating a mechanical lock
between the cyclist and bicycle (Herlihy, 2004).
Even though toe clip and clipless pedal types provide an increased ability to apply
power through increased muscle activation, a drop in net muscular efficiency is the cost.
A cyclist can go faster by increasing muscle fiber recruitment, but this will cause a
greater power input demand as well, resulting in a less efficient design (Mornieux,
Stapelfeldt, Gollhofer, & Belli, 2008).
11
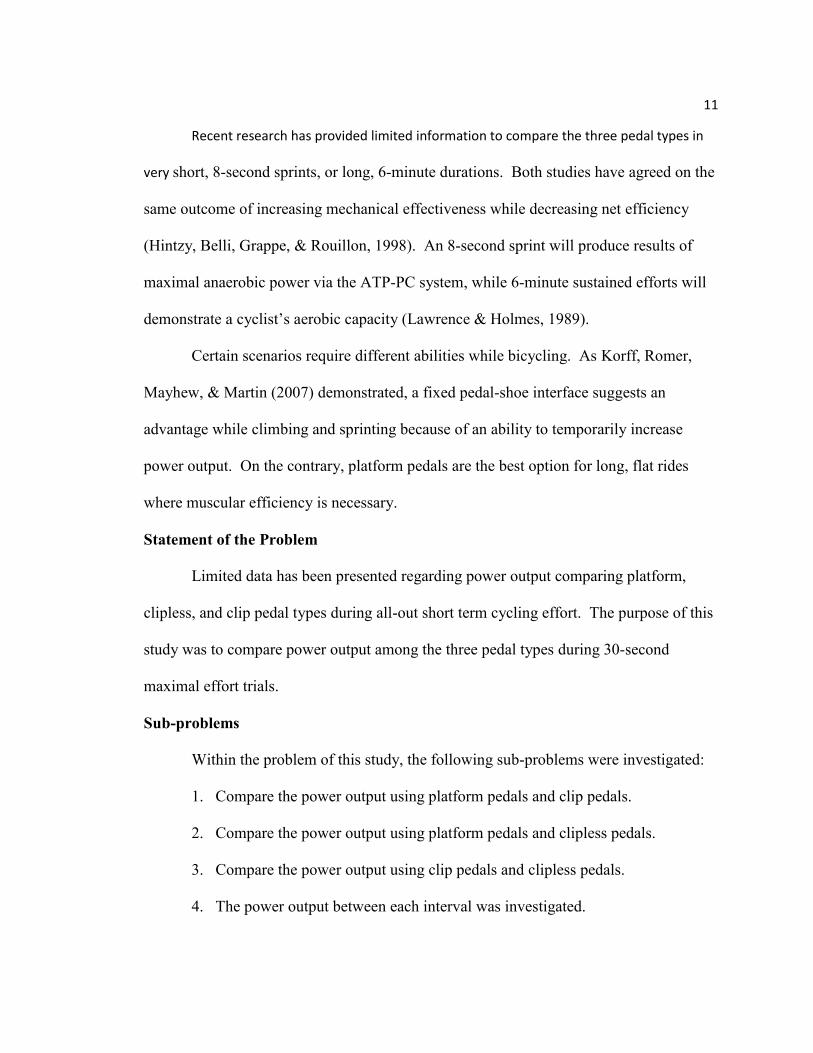
Recent research has provided limited information to compare the three pedal types in
very short, 8-second sprints, or long, 6-minute durations. Both studies have agreed on the
same outcome of increasing mechanical effectiveness while decreasing net efficiency
(Hintzy, Belli, Grappe, & Rouillon, 1998). An 8-second sprint will produce results of
maximal anaerobic power via the ATP-PC system, while 6-minute sustained efforts will
demonstrate a cyclist’s aerobic capacity (Lawrence & Holmes, 1989).
Certain scenarios require different abilities while bicycling. As Korff, Romer,
Mayhew, & Martin (2007) demonstrated, a fixed pedal-shoe interface suggests an
advantage while climbing and sprinting because of an ability to temporarily increase
power output. On the contrary, platform pedals are the best option for long, flat rides
where muscular efficiency is necessary.
Statement of the Problem
Limited data has been presented regarding power output comparing platform,
clipless, and clip pedal types during all-out short term cycling effort. The purpose of this
study was to compare power output among the three pedal types during 30-second
maximal effort trials.
Sub-problems
Within the problem of this study, the following sub-problems were investigated:
1. Compare the power output using platform pedals and clip pedals.
2. Compare the power output using platform pedals and clipless pedals.
3. Compare the power output using clip pedals and clipless pedals.
4. The power output between each interval was investigated.
12
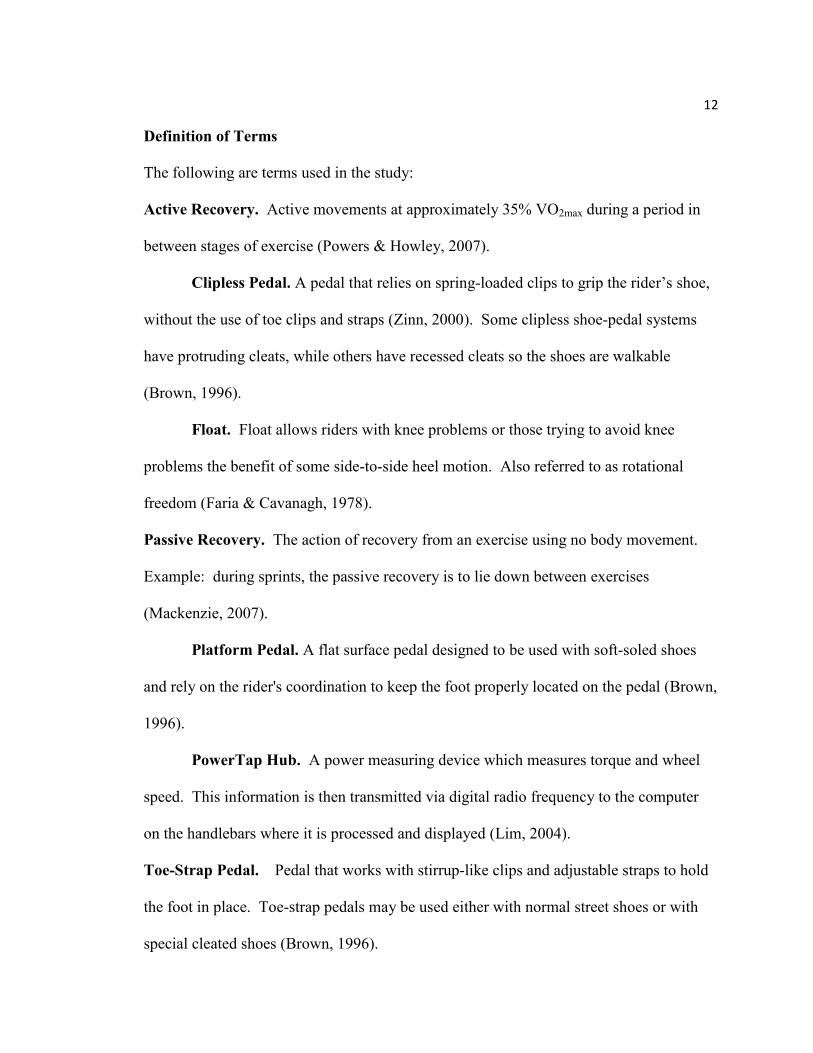
Definition of Terms
The following are terms used in the study:
Active Recovery. Active movements at approximately 35% VO2max during a period in
between stages of exercise (Powers & Howley, 2007).
Clipless Pedal. A pedal that relies on spring-loaded clips to grip the rider’s shoe,
without the use of toe clips and straps (Zinn, 2000). Some clipless shoe-pedal systems
have protruding cleats, while others have recessed cleats so the shoes are walkable
(Brown, 1996).
Float. Float allows riders with knee problems or those trying to avoid knee
problems the benefit of some side-to-side heel motion. Also referred to as rotational
freedom (Faria & Cavanagh, 1978).
Passive Recovery. The action of recovery from an exercise using no body movement.
Example: during sprints, the passive recovery is to lie down between exercises
(Mackenzie, 2007).
Platform Pedal. A flat surface pedal designed to be used with soft-soled shoes
and rely on the rider's coordination to keep the foot properly located on the pedal (Brown,
1996).
PowerTap Hub. A power measuring device which measures torque and wheel
speed. This information is then transmitted via digital radio frequency to the computer
on the handlebars where it is processed and displayed (Lim, 2004).
Toe-Strap Pedal. Pedal that works with stirrup-like clips and adjustable straps to hold
the foot in place. Toe-strap pedals may be used either with normal street shoes or with
special cleated shoes (Brown, 1996).
13
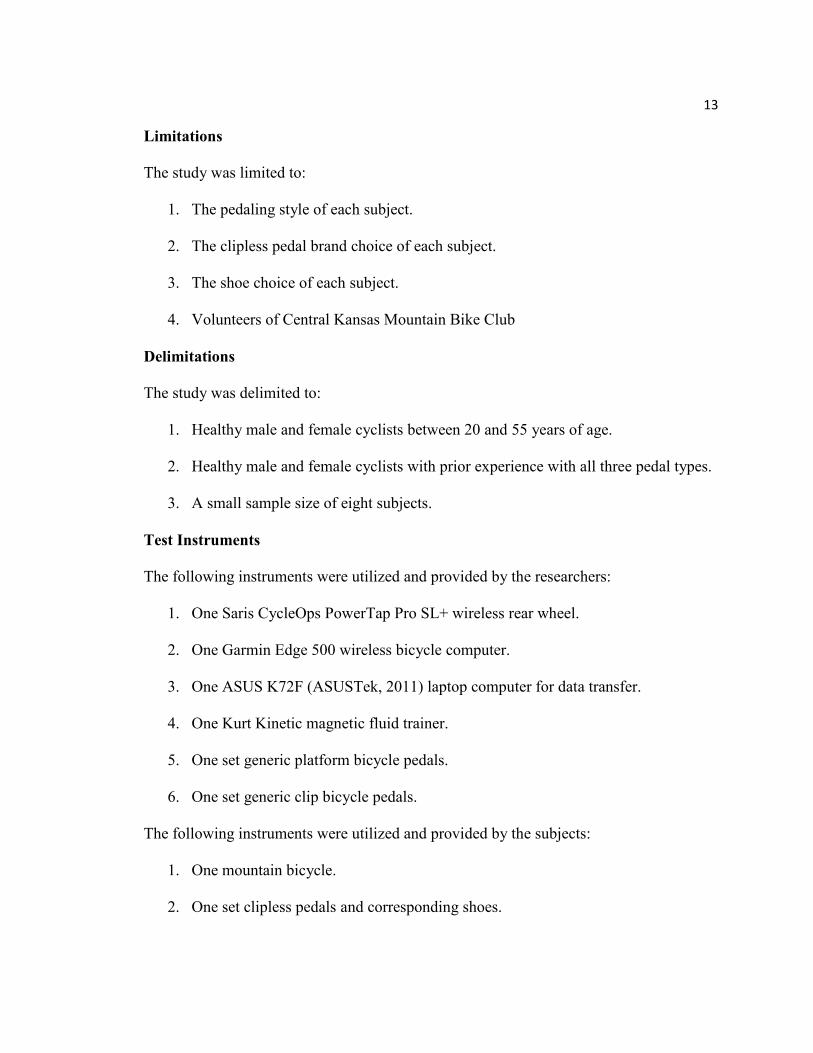
Limitations
The study was limited to:
1. The pedaling style of each subject.
2. The clipless pedal brand choice of each subject.
3. The shoe choice of each subject.
4. Volunteers of Central Kansas Mountain Bike Club
Delimitations
The study was delimited to:
1. Healthy male and female cyclists between 20 and 55 years of age.
2. Healthy male and female cyclists with prior experience with all three pedal types.
3. A small sample size of eight subjects.
Test Instruments
The following instruments were utilized and provided by the researchers:
1. One Saris CycleOps PowerTap Pro SL+ wireless rear wheel.
2. One Garmin Edge 500 wireless bicycle computer.
3. One ASUS K72F (ASUSTek, 2011) laptop computer for data transfer.
4. One Kurt Kinetic magnetic fluid trainer.
5. One set generic platform bicycle pedals.
6. One set generic clip bicycle pedals.
The following instruments were utilized and provided by the subjects:
1. One mountain bicycle.
2. One set clipless pedals and corresponding shoes.

14
Assumptions
The following assumptions were made during the study:
1. Each participant was healthy enough to provide an all-out effort for each exercise.
2. The participant’s bicycle was properly fitted.
3. The participant’s bicycle was operating correctly.
4. The readings for power output, time, and heart rate were accurate.
5. All information was accurately recorded and transferred.
6. The participants gave full effort on each test.
Null Hypotheses
The following null hypotheses were tested at the 0.05 level of significance.
1. The difference in power output of clipless versus flat pedals will not be
statistically significant.
2. The difference in power output of clipless versus toe-strap pedals will not be
statistically significant.
3. The difference in power output of toe-strap versus flat pedals will not be
statistically significant.
4. The difference in power output between intervals will not be significant.
Significance of the Study
Current research does not provide any data for comparison of the three major pedal types
in cycling during a 30 second all-out effort. The purpose of this study was to provide a
comparison of the three major pedal types currently used by cyclists; platform, clip, and
clipless. The demand for information regarding any differences in power output between
pedal types is growing because of the wide array of pedal options available. Trainers and
15
coaches will have the ability to carry out a similar procedure in their own lab and analyze
weaknesses within the pedal stroke of cyclists in an effort to create better training
programs for their athletes. Also, with data provided on each of the three major pedal
types, cyclists can make an informed decision on pedal choice given the specific
scenarios and conditions presented.
7
Chapter 2
Review of Literature
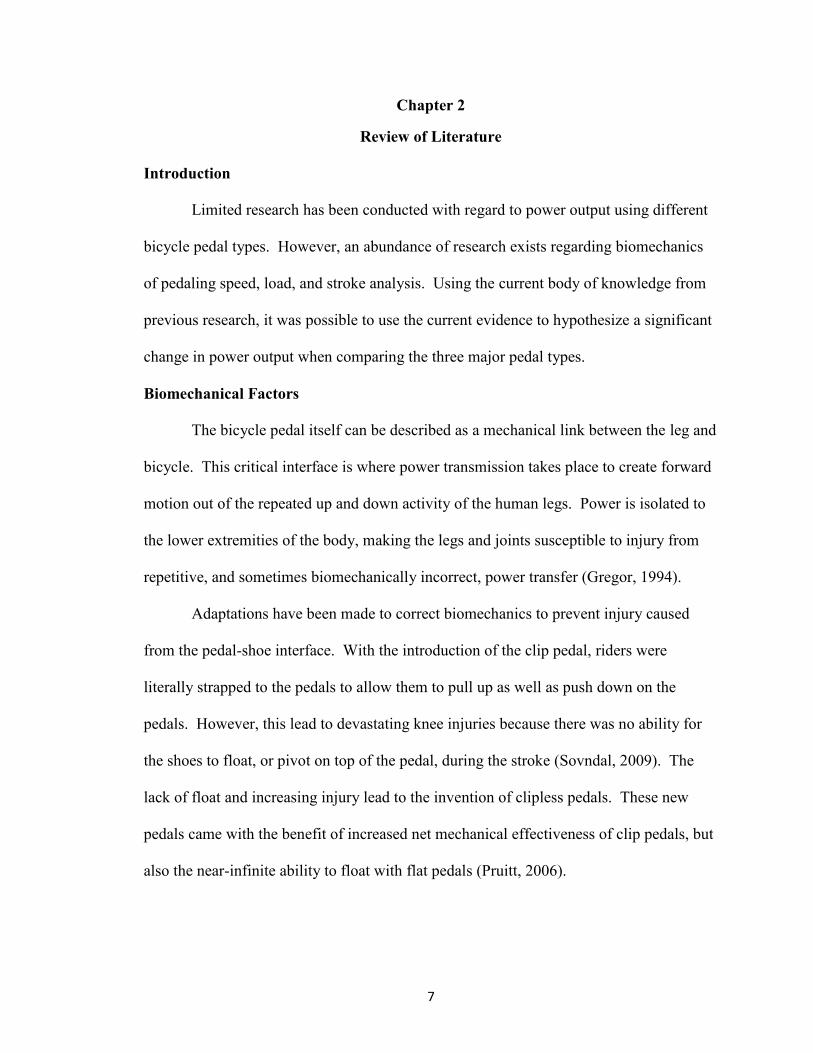
Introduction
Limited research has been conducted with regard to power output using different
bicycle pedal types. However, an abundance of research exists regarding biomechanics
of pedaling speed, load, and stroke analysis. Using the current body of knowledge from
previous research, it was possible to use the current evidence to hypothesize a significant
change in power output when comparing the three major pedal types.
Biomechanical Factors
The bicycle pedal itself can be described as a mechanical link between the leg and
bicycle. This critical interface is where power transmission takes place to create forward
motion out of the repeated up and down activity of the human legs. Power is isolated to
the lower extremities of the body, making the legs and joints susceptible to injury from
repetitive, and sometimes biomechanically incorrect, power transfer (Gregor, 1994).
Adaptations have been made to correct biomechanics to prevent injury caused
from the pedal-shoe interface. With the introduction of the clip pedal, riders were
literally strapped to the pedals to allow them to pull up as well as push down on the
pedals. However, this lead to devastating knee injuries because there was no ability for
the shoes to float, or pivot on top of the pedal, during the stroke (Sovndal, 2009). The
lack of float and increasing injury lead to the invention of clipless pedals. These new
pedals came with the benefit of increased net mechanical effectiveness of clip pedals, but
also the near-infinite ability to float with flat pedals (Pruitt, 2006).
8
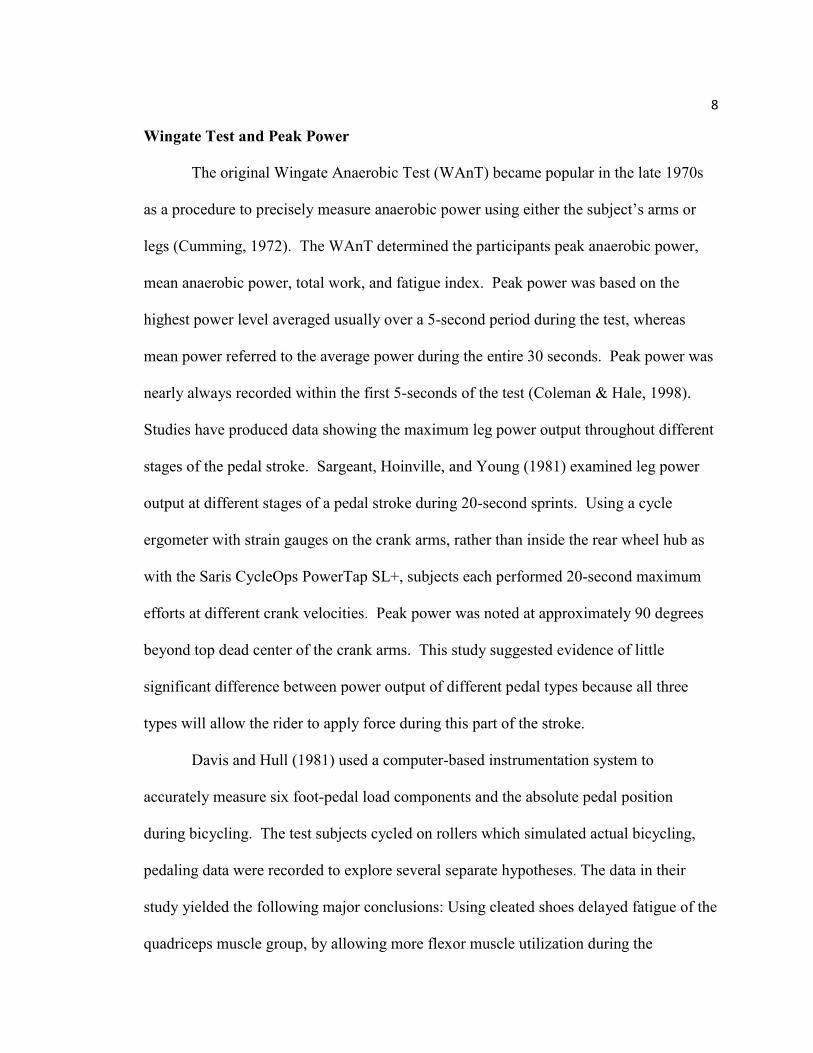
Wingate Test and Peak Power
The original Wingate Anaerobic Test (WAnT) became popular in the late 1970s
as a procedure to precisely measure anaerobic power using either the subject’s arms or
legs (Cumming, 1972). The WAnT determined the participants peak anaerobic power,
mean anaerobic power, total work, and fatigue index. Peak power was based on the
highest power level averaged usually over a 5-second period during the test, whereas
mean power referred to the average power during the entire 30 seconds. Peak power was
nearly always recorded within the first 5-seconds of the test (Coleman & Hale, 1998).
Studies have produced data showing the maximum leg power output throughout different
stages of the pedal stroke. Sargeant, Hoinville, and Young (1981) examined leg power
output at different stages of a pedal stroke during 20-second sprints. Using a cycle
ergometer with strain gauges on the crank arms, rather than inside the rear wheel hub as
with the Saris CycleOps PowerTap SL+, subjects each performed 20-second maximum
efforts at different crank velocities. Peak power was noted at approximately 90 degrees
beyond top dead center of the crank arms. This study suggested evidence of little
significant difference between power output of different pedal types because all three
types will allow the rider to apply force during this part of the stroke.
Davis and Hull (1981) used a computer-based instrumentation system to
accurately measure six foot-pedal load components and the absolute pedal position
during bicycling. The test subjects cycled on rollers which simulated actual bicycling,
pedaling data were recorded to explore several separate hypotheses. The data in their
study yielded the following major conclusions: Using cleated shoes delayed fatigue of the
quadriceps muscle group, by allowing more flexor muscle utilization during the

9
backstroke; cleated shoes distribute the workload and alleviate the peak load demand on
the quadriceps group. Overall pedaling efficiency increases with power level. Also, non-
motive load components which apply adverse forces and torque to the knee joint are of
significant magnitude.
Sprint Power
Hintzy (1998) performed an experiment with two groups of elite road cyclists who each
performed four separate sprints. Two different load settings were utilized on a cycle
ergometer with clip and platform pedals for duration of eight seconds on each attempt.
The results were consistent across all subjects and load settings with maximal sprint
power output significantly greater with the clip pedals. While this experiment was based
solely on anaerobic sprint capacity with the ATP-PC system as the sole energy
contributor, the results remained consistent and irrefutable. Hintzy noted the significant
difference in maximal power was likely due to the ability to reach optimal pedal velocity
using greater muscular activity.
Recovery from Maximal Effort
In order to achieve accuracy of data, the subjects must be fresh for each trial of
maximal effort. Subjects in a study regarding active and passive recovery methods
between two 5-minute maximal efforts on a cycle ergometer were given 20 minutes of
recovery between efforts with blood lactate levels monitored every five minutes.
Recovery methods included active, both above and below the subject’s anaerobic
threshold, active while breathing 100% oxygen, as well as passive. The lactate levels
were significantly higher (P < 0.05) in all recovery methods at the beginning of the

10
second effort, although the power output values were not significantly different after
completion of the second effort (Weltman, Stamford & Fulco, 1979).
In a similar study, eight male cyclists performed two sprints using a cycle
ergometer on two separate occasions. The first sprint remained consistent on both
occasions and lasted 30-seconds. The second sprint duration was either 10 or 30 seconds.
Each subject was given a 4-minute passive recovery. Muscle biopsies were obtained at
rest, immediately after the first 30-s sprint, after 3.8 min of recovery, and after the second
10- and 30-s sprints. At the end of sprint 1, phosphocreatine (PCr) was 16.9% +/- 1.4% of
the resting value, and muscle PH dropped to 6.69 +/- 0.02. After 3.8 min of recovery,
muscle PH remained unchanged (6.80 +/- 0.03), but PCr was resynthesized to 78.7% +/-
3.3% of the resting value. PCr during sprint 2 was almost completely utilized in the first
10s and remained unchanged thereafter. High correlations were found between the
percentage of PCr resynthesis and the percentage recovery of power output and pedaling
speed during the initial 10 s of sprint 2 (r = 0.84, P < 0.05 and r = 0.91, P < 0.01).
Despite an approximately 41% decrease in anaerobic energy, total work during the
second 30s sprint decreased only approximately 18%. These data suggest that aerobic
metabolism provides a significant part (approximately 49%) of the energy during the
second sprint, whereas PCr availability is important for high power output during the
initial 10-seconds (Bogdanis, Nevill, Boobis & Lakomy, 1996).
Validity and Reliability of PowerTap
The Schoberer Rad Messtechnik (SRM) crank-based power meter was long
considered the ideal choice for professional cyclists because of its integrated design and
accuracy which is comparable to a laboratory-grade cycle ergometer. As the PowerTap
11
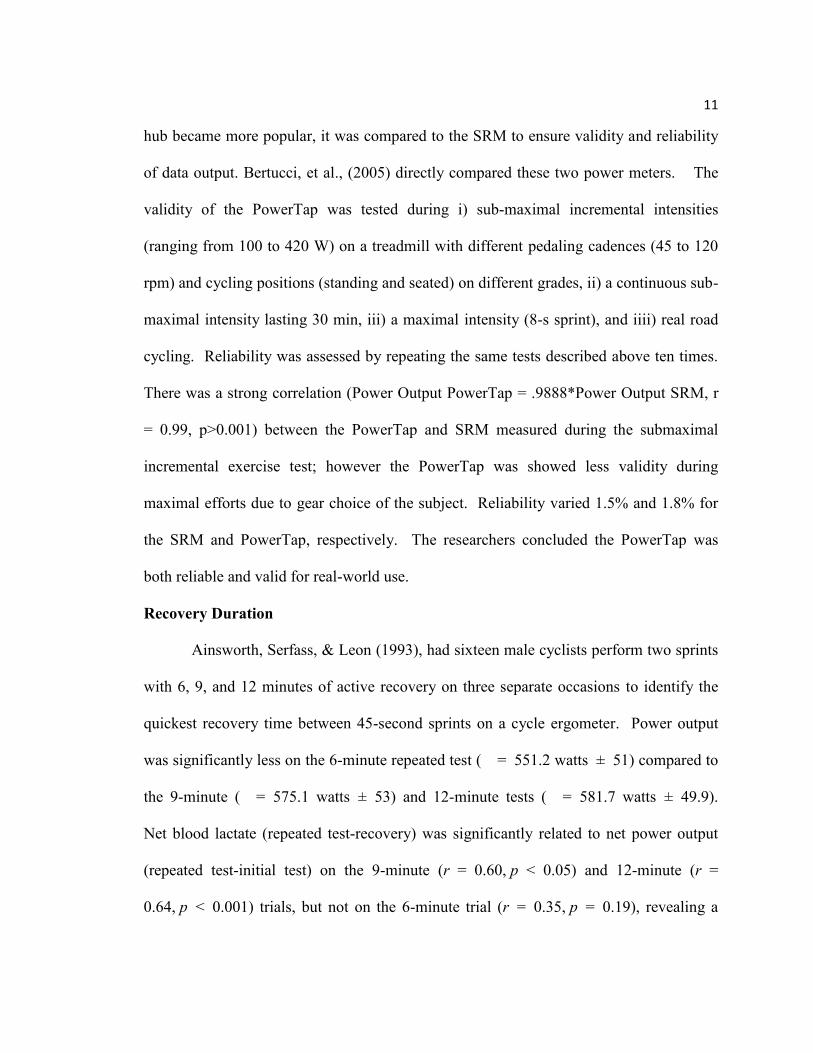
hub became more popular, it was compared to the SRM to ensure validity and reliability
of data output. Bertucci, et al., (2005) directly compared these two power meters. The
validity of the PowerTap was tested during i) sub-maximal incremental intensities
(ranging from 100 to 420 W) on a treadmill with different pedaling cadences (45 to 120
rpm) and cycling positions (standing and seated) on different grades, ii) a continuous sub-
maximal intensity lasting 30 min, iii) a maximal intensity (8-s sprint), and iiii) real road
cycling. Reliability was assessed by repeating the same tests described above ten times.
There was a strong correlation (Power Output PowerTap = .9888*Power Output SRM, r
= 0.99, p>0.001) between the PowerTap and SRM measured during the submaximal
incremental exercise test; however the PowerTap was showed less validity during
maximal efforts due to gear choice of the subject. Reliability varied 1.5% and 1.8% for
the SRM and PowerTap, respectively. The researchers concluded the PowerTap was
both reliable and valid for real-world use.
Recovery Duration
Ainsworth, Serfass, & Leon (1993), had sixteen male cyclists perform two sprints
with 6, 9, and 12 minutes of active recovery on three separate occasions to identify the
quickest recovery time between 45-second sprints on a cycle ergometer. Power output
was significantly less on the 6-minute repeated test ( = 551.2 watts ± 51) compared to
the 9-minute ( = 575.1 watts ± 53) and 12-minute tests ( = 581.7 watts ± 49.9).
Net blood lactate (repeated test-recovery) was significantly related to net power output
(repeated test-initial test) on the 9-minute (r = 0.60, p < 0.05) and 12-minute (r =
0.64, p < 0.001) trials, but not on the 6-minute trial (r = 0.35, p = 0.19), revealing a
12
minimum 9-minute recovery is necessary to reach a similar power output in a repeated
bout of intense effort.
Summary
Upon review of current available literature it became clear; more research needs
to be considered for differences in pedal types. An abundance of research is offered with
regards to optimal pedal velocity, stroke analysis, and biomechanical factors of cycling.
The majority of the studies have been conducted with very short, sprint-type durations of
ten seconds or less, with very few longer than 30-seconds. The ATP-PC (phosphagens)
energy pathway has clearly been covered and the future should provide more information
on other energy pathways such as glycolysis and the oxidative energy systems.
13
Chapter 3
Methodology
Introduction
The objective of this study was to determine if any difference in 30-second all-out
power output exists between three pedal types used in bicycling. Preliminary and
operational procedures were used to further investigate the hypothesis of this study. The
preliminary procedures utilized consisted of: subjects being tested, instrumentation,
research design, and test administration. Operational procedures explain and outline the
approach used to conduct this study. The operational procedures consist of: information
and specific instructions for the subjects, test methods, and data collection.
Preliminary Procedures
Subjects
The subjects for this study included volunteer cyclists of the Central Kansas Mountain
Bike Club (CKMBC. Subjects were recruited through a flyer (See Appendix A) posted
in bicycle shops within the CKMBC community. Volunteers included in the study were
7 males and 1 female, 20-55 years of age, and had a minimum of five years combined
cycling experience with all three pedals types mentioned in this study. All subjects
provided their own bicycle, cycling equipment, and a signed copy of the informed
consent form (See Appendix B). The researchers provided a Saris CycleOps PowerTap
SL+ rear wheel, a Kurt Kinetic Fluid training stand, toe-strap and flat pedals.

14
Instrumentation
This study was conducted in the Health and Human Performance Lab at Fort Hays State
University. Prior to testing, the subject’s bicycle was fitted with the Saris CycleOps
PowerTap SL+ rear wheel assembly and checked for calibration using the auto-calibrate
function within the Garmin Edge 500 cycling computer interface and to ensure the entire
apparatus was working properly. The bicycle was then placed on the trainer stand
provided. During each effort, the Saris CycleOps PowerTap SL+ hub relayed
information wirelessly to a Garmin Edge 500 computer where it was recorded and
transferred to an ASUS K72F laptop computer to analyze results.
The Saris CycleOps PowerTap SL+ hub was chosen for this study due for several
reasons. Use of this hub allowed all subjects to use their personal bike which may have
been more comfortable for all-out efforts required. When compared to the competing
brand on-bicycle SRM power meter, both with factory calibrations, Gardner, A. S.,
Stephens, S., Martin, D. T., Lawton, E., Lee, H., & Jenkins, D., 2004, recorded a power
mean power variability range of -2.5% ± 0.5% for the Saris CycleOps PowerTap SL+,
whereas the variability range of SRM was 2.3% ± 4.9%. This was especially important
because the cost of an SRM power meter was approximately double that of a Saris
CycleOps PowerTap SL+. Furthermore, the Saris CycleOps PowerTap SL+ was much
more cost effective than the Monark cycle ergometer, which was approximately four
times the price and was limited to lab use only.
Research Design
This study was intended to evaluate the differences and similarities of bicycle pedal types
using a quasi-experimental research approach. All variables could not be controlled in
15
this study, though most relevant variables were controlled. While instrumentation
variables remained constant, human subjects were involved, which lead to differences in
pedaling cadence, and preferred clipless pedal system. These variables were not
controllable by the researchers and should not have had a significant effect on outcome.
Instruction for Subjects
Each of the participants signed an informed consent form (See Appendix B) prior to
participation. A researcher met with each subject before the test to answer any possible
questions and reviewed the full procedure to ensure that subject safety was a priority.
During that discussion, the researcher explicitly urged the participant to give an all-out
effort on each test, in attempt to maintain validity. All participants were given the option
to view their data values after the last test was completed.
Test Administration
The data for this study was collected by individuals trained for the test protocol in the
Health and Human Performance Lab at Fort Hays State University. All researchers were
knowledgeable of proper testing procedures and integration of data to a computer for
analysis. One subject was tested at a time using a randomized pedal sequence.
Each subject was allowed to warm-up on the test apparatus for a period of five minutes
before proceeding with the experiment. Following warm-up, the subject began with the
first randomly selected pedal type for an all-out effort of 30 seconds, which was recorded
via Garmin Edge 500 cycling computer. A 20-minute passive cool-down was then
allowed to recover before continuing onto the next session. Pedals were changed to the
next randomly selected type by the administrator during the passive cool-down period for
the next test. After 20 minutes of passive cool-down, the subject repeated the all-out
16
effort for 30-seconds using the second selected pedal type. Following the second trial
was a 20-minute passive cool-down, at which time the administrator changed the pedals
to the last remaining pedal type for the participant. A final 30-second sprint effort was
made by the participant and upon completion was allowed to cool-down with his or her
own preferred method. This procedure was repeated for all test subjects.
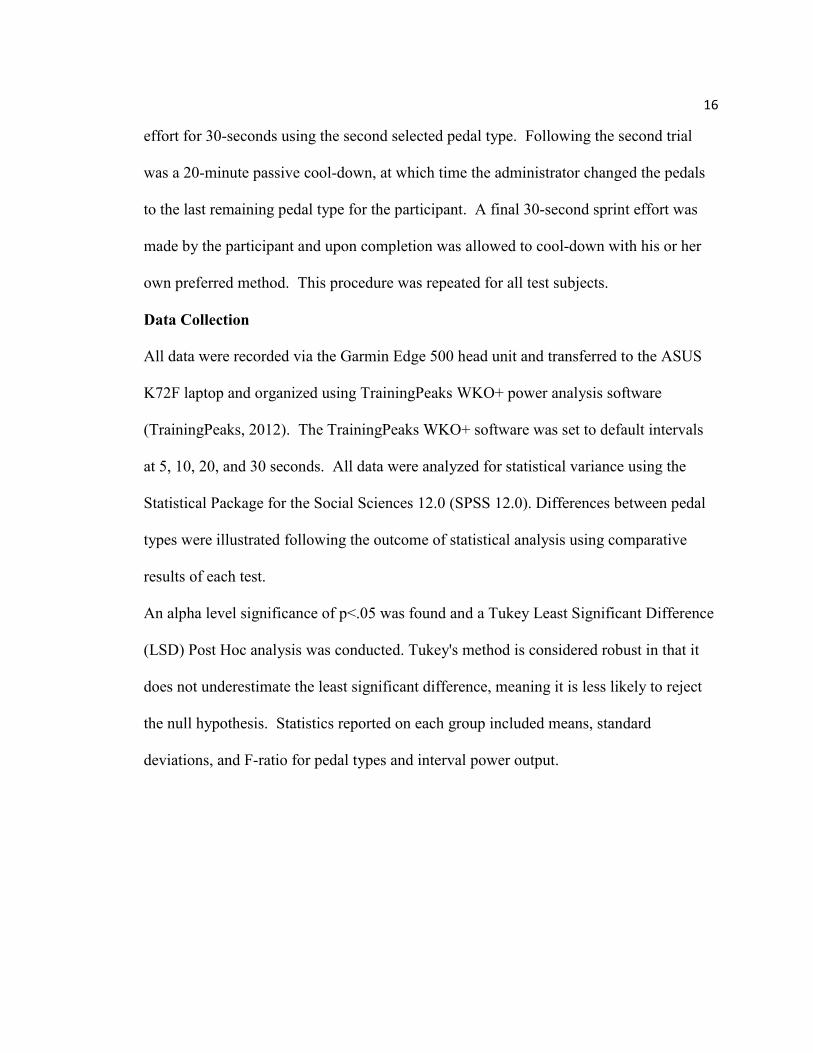
Data Collection
All data were recorded via the Garmin Edge 500 head unit and transferred to the ASUS
K72F laptop and organized using TrainingPeaks WKO+ power analysis software
(TrainingPeaks, 2012). The TrainingPeaks WKO+ software was set to default intervals
at 5, 10, 20, and 30 seconds. All data were analyzed for statistical variance using the
Statistical Package for the Social Sciences 12.0 (SPSS 12.0). Differences between pedal
types were illustrated following the outcome of statistical analysis using comparative
results of each test.
An alpha level significance of p<.05 was found and a Tukey Least Significant Difference
(LSD) Post Hoc analysis was conducted. Tukey's method is considered robust in that it
does not underestimate the least significant difference, meaning it is less likely to reject
the null hypothesis. Statistics reported on each group included means, standard
deviations, and F-ratio for pedal types and interval power output.
17
Chapter 4
Results
Introduction
The purpose of this study was to examine differences in 30-second sprint power output
between clipless, toe-strap, and flat bicycle pedal types. Eight test subjects (7 male, 1
female) included competitive cyclists from the central Kansas area; due to proximity of
the testing lab. These subjects were between the ages of 20 and 55 ( = 40) years and able
to participate in three maximum effort sprints using clipless, toe-strap, and flat pedal
types. All data was collected via a Garmin Edge 500 cycling computer and transferred to
an ASUS K72F laptop computer for integration into the SPSS 12.0 statistical analysis
software.
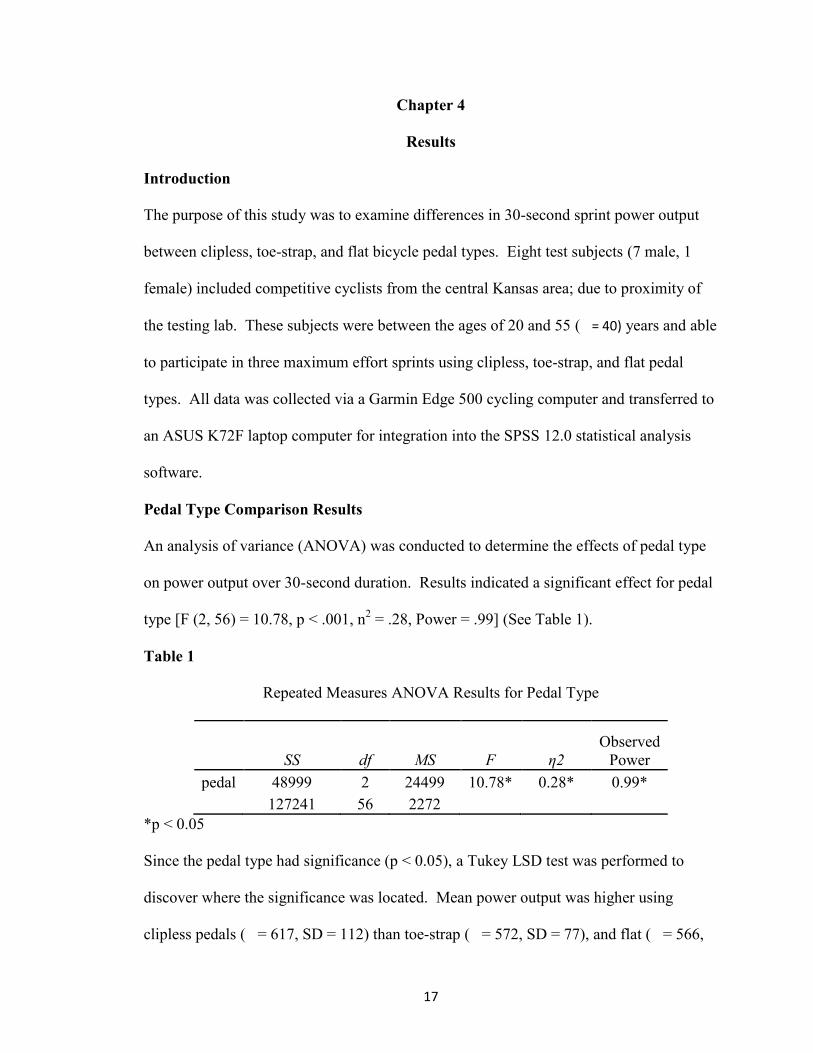
Pedal Type Comparison Results
An analysis of variance (ANOVA) was conducted to determine the effects of pedal type
on power output over 30-second duration. Results indicated a significant effect for pedal
type [F (2, 56) = 10.78, p < .001, n2 = .28, Power = .99] (See Table 1).
Table 1
Repeated Measures ANOVA Results for Pedal Type
SS df MS F η2 Observed
Power pedal 48999 2 24499 10.78* 0.28* 0.99* 127241 56 2272
*p < 0.05
Since the pedal type had significance (p < 0.05), a Tukey LSD test was performed to
discover where the significance was located. Mean power output was higher using
clipless pedals ( = 617, SD = 112) than toe-strap ( = 572, SD = 77), and flat ( = 566,
18
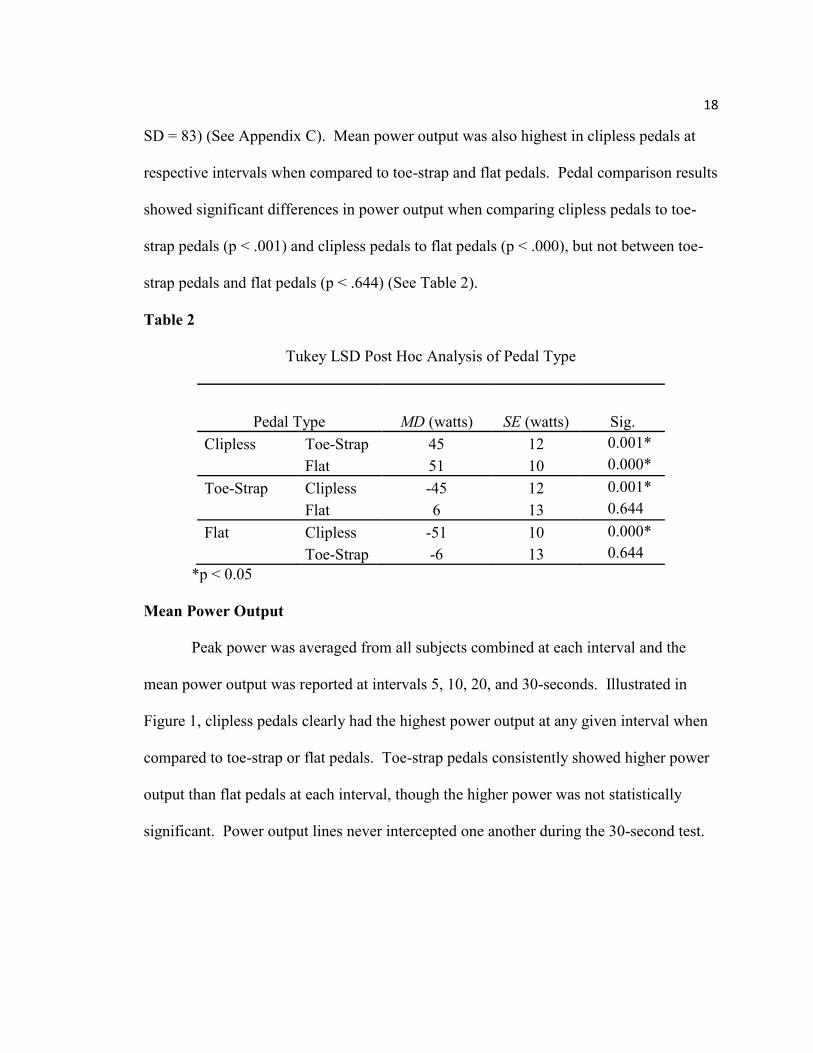
SD = 83) (See Appendix C). Mean power output was also highest in clipless pedals at
respective intervals when compared to toe-strap and flat pedals. Pedal comparison results
showed significant differences in power output when comparing clipless pedals to toe-
strap pedals (p < .001) and clipless pedals to flat pedals (p < .000), but not between toe-
strap pedals and flat pedals (p < .644) (See Table 2).
Table 2
Tukey LSD Post Hoc Analysis of Pedal Type
Pedal Type MD (watts) SE (watts) Sig. Clipless Toe-Strap 45 12 0.001* Flat 51 10 0.000* Toe-Strap Clipless -45 12 0.001* Flat 6 13 0.644 Flat Clipless -51 10 0.000* Toe-Strap -6 13 0.644
*p < 0.05
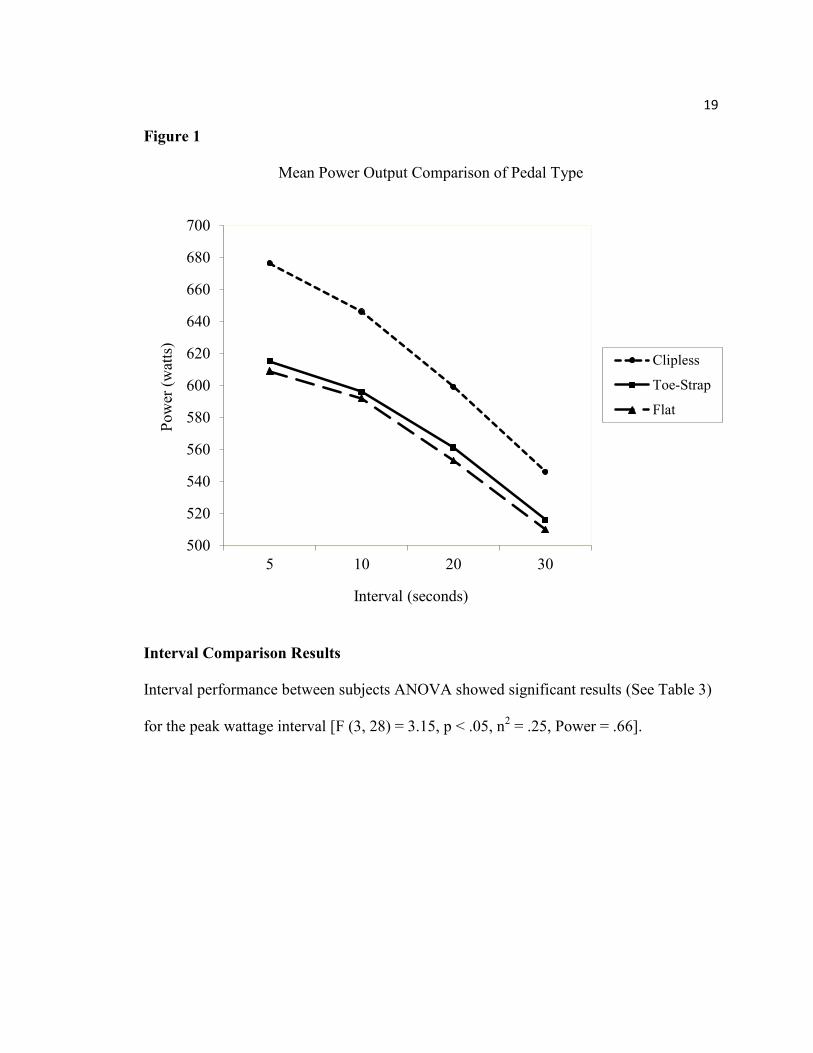
Mean Power Output
Peak power was averaged from all subjects combined at each interval and the
mean power output was reported at intervals 5, 10, 20, and 30-seconds. Illustrated in
Figure 1, clipless pedals clearly had the highest power output at any given interval when
compared to toe-strap or flat pedals. Toe-strap pedals consistently showed higher power
output than flat pedals at each interval, though the higher power was not statistically
significant. Power output lines never intercepted one another during the 30-second test.
19
Figure 1
Mean Power Output Comparison of Pedal Type
Interval Comparison Results
Interval performance between subjects ANOVA showed significant results (See Table 3)
for the peak wattage interval [F (3, 28) = 3.15, p < .05, n2 = .25, Power = .66].
500
520
540
560
580
600
620
640
660
680
700
5 10 20 30
Pow
er (w
atts
)
Interval (seconds)
Clipless
Toe-Strap
Flat
-~--.-
20
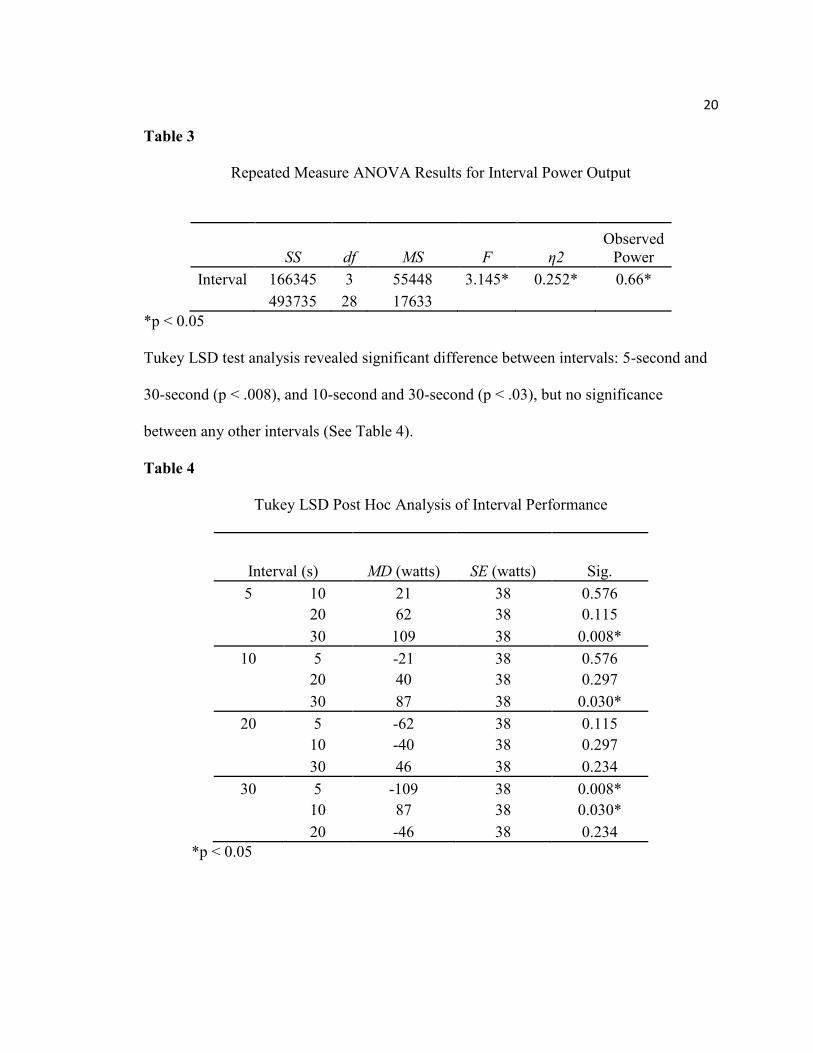
Table 3
Repeated Measure ANOVA Results for Interval Power Output
SS df MS F η2
Observed Power
Interval 166345 3 55448 3.145* 0.252* 0.66* 493735 28 17633
*p < 0.05
Tukey LSD test analysis revealed significant difference between intervals: 5-second and
30-second (p < .008), and 10-second and 30-second (p < .03), but no significance
between any other intervals (See Table 4).
Table 4
Tukey LSD Post Hoc Analysis of Interval Performance
Interval (s) MD (watts) SE (watts) Sig. 5 10 21 38 0.576
20 62 38 0.115
30 109 38 0.008*
10 5 -21 38 0.576
20 40 38 0.297
30 87 38 0.030*
20 5 -62 38 0.115
10 -40 38 0.297
30 46 38 0.234
30 5 -109 38 0.008*
10 87 38 0.030*
20 -46 38 0.234
*p < 0.05

21
Conclusions
Based upon the results and within the limitations of the present study, the
following conclusions were drawn.
1. The difference in power output of clipless versus flat pedals was statistically
significant. The null hypothesis was rejected.
2. The difference in power output of clipless versus toe-strap pedals was
statistically significant. The null hypothesis was rejected.
3. The difference in power output of toe-strap versus flat pedals was not
statistically significant. The null hypothesis was retained.
4. The difference in power output between intervals was significantly different.
The null hypothesis was rejected.
30
Chapter 5
Summary and Recommendations
Introduction
The primary purpose of this study was to determine if significant power output
differences existed during a 30-second maximum effort between three major pedal types;
clipless, toe-strap, and flat. Eight subjects performed a maximum effort sprint using each
pedal type in a randomly assigned order, with twenty minutes passive recovery between
each sprint. Power output data were wirelessly recorded to a Garmin Edge 500 cycling
computer and transferred to a ASUS K72F laptop computer for analysis using SPSS 12.0
software. Upon finding significant differences between pedal types, a Tukey LSD Post
Hoc test was used determine the time intervals affected.
Summary
Current literature reports significant differences of power output between pedal
types during various time intervals including short sprints lasting only seconds, as well as
longer durations of two minutes or more. The primary factor for the difference in power
output was likely due to the ability of certain pedal types, clipless and toe-strap, to allow
the rider to pull up on the pedal during the back stroke and also push down on the pedal
during the down stroke (Hendler, 2004).
Participants included in the present study consisted of eight (7 males and 1 female)
cyclists between the ages of 20 and 55 ( Age = 40). Each subject volunteered to
participate based on his or her ability to provide three maximal sprint efforts, proximity
to test facility, and age. The repeated measures ANOVA (SPSS 12.0) was implemented
31
31
to provide a means to examine repeated measure differences within pedal types and
ascertain if power output differences existed.
The testing condition involved the measure of power output during the entire 30-second
test for each pedal type. Test protocol followed Wingate Anaerobic Test procedures
(Vandewalle, Gilbert & Monod, 1987). All measurements were obtained via Garmin
Edge 500 cycling computer and transferred to a ASUS K72F laptop computer and
analyzed using SPSS 12.0 statistical analysis program.
The analysis of power output between pedal types indicated significant difference at the
.05 level between clipless and toe-strap pedals, and also between clipless and flat pedals.
No significant difference in power output was found between toe-strap and flat pedals.
The average power output was higher for clipless pedals ( = 617 watts, SD = 112) than
toe-strap ( = 572 watts, SD = 77), and flat ( = 566 watts, SD = 83).
Analysis of power output between intervals indicated significant difference at the 0.05
level between 5-seconds and 30-seconds, and between 10-seconds and 30-seconds.
Significance was not found between intervals; 5-seconds and 10-seconds, 5-seconds and
20-seconds, 10-seconds and 20-seconds, or 20-seconds and 30-seconds.
The findings in this study remained consistent with literature regarding peak power
during 20-second sprints (Sargeant, Hoinville, & Young, 1981) and 6-second sprints
(Hintzy, 1998). Peak power was higher in both clipless and toe-strap pedals when
compared to flat pedals, although toe-strap power output was not significantly different.
Similar to Wingate Anaerobic Test results from Coleman and Hale (1998), Peak power
was always evident during the first five second interval, regardless of pedal type.
32
32
Mornieux et al., (2008) discussed a significant power difference of maximal power output
between toe-strap pedals and flat pedals. Although the present study illustrated a higher
mean power output at all intervals with toe-strap pedals when compared to flat pedals, the
results were not statistically significant, indicating a possible error due to small sample
size.
Although muscle fatigue was not directly measured in this study, the findings were not
consistent with the findings by Davis and Hull (1981). According to this research, the
use of clipless pedals delayed muscular fatigue of the primary muscle groups used in
cycling, which resulted in a flatter power output curve. The findings in the present study,
as illustrated in Figure 1 (See Page 19), revealed a steeper drop in clipless mean power
output compared to flat and toe-strap pedals, indicating a faster onset of muscular fatigue.
In order to achieve accuracy of data in the present study, the subjects needed to be fully
recovered for each trial. Weltman, Stamford, and Fulco (1979), stated a 20-minute
recovery period between two 5-minute maximal efforts on a cycle ergometer was ample
to recover, even though lactate levels monitored every five minutes during recovery were
elevated at the start of the second trial. Even though lactate was not measured in the
present study, some subjects noted a feeling of muscle fatigue at the start of the third trial,
regardless of pedal type order. The feeling of fatigue reported did not translate to a
statistically significant difference in power output.
One female was included in the eight subjects used in the present study. Ideally, males
and females would be separated into two groups for comparison within gender; however,
the small sample size was a delimiting factor. The female subject was a category one
33
33
road cyclist at the time of data collection and produced power similar to the male
participants in the study. Gender was not a factor for difference in power output for this
study.
Recommendations for Further Study
1. Future studies should include a greater number of participants.
2. Some participants noted a feeling of fatigue by the third sprint. Future studies
should consider multiple testing sessions with one sprint per day.
3. Future research should expand the duration to analyze the possible
intersection of power output between pedal types.
4. Future studies should have separate groups for male and female subjects.
34
34
References
Ainsworth, B., Serfass, R., & Leon, A. (1993). Effects of recovery duration and blood
lactate level on power output during cycling. Canadian Journal of Applied
Physiology, 18(1), 19-30.
ASUSTek. (2011, July 25). Asus k72f series. Retrieved from
http://http://www.asus.com/Notebooks/Versatile_Performance/K72F
Bertucci, W., Duc, S., Villerius, V., Pernin, J., & Grappe, F. (2005). Validity and
reliability of the powertap mobile cycling powermeter when compared with the srm
device. International Journal of Sports Medicine, 26(10), 868-873.
Bogdanis, G., Nevill, M., Boobis, L., & Lakomy, H. (1996). Contribution of
phosphocreatine and aerobic metabolism to energy supply during repeated sprint
exercise. Journal of Applied Physiology, 80(3), 876-884.
Brown, S. (1996). Sheldon brown's bicycle glossary. Retrieved from
http://sheldonbrown.com/glossary.html
Coleman, S., & Hale, T. (1998). The effect of different calculation methods of flywheel
parameters on the wingate anaerobic test. Canadian Journal of Applied Physiology, (23),
409.
Cumming, G. (1972). Correlation of athletic perfomance and aerobic power in 12 to 17-
year old children with bone age, calf muscle, total body potassium, heart volume and two
35
35
indices of anaerobic power.Proceedings of the Fourth International Symposium on
Pediatric Work Physiology, 109.
Davis, R., & Hull, M. (1981). Measurement of pedal loading in bicycling: Ii. analysis and
results. Journal of Biomechanics, 14(12), 857-861. doi: 10.1016/0021-9290(81)90013-0
Faria, I., & Cavanagh, P. (1978). The physiology and biomechanics of cycling . (1 ed.).
New York: Wiley.
Gardner, A. S., Stephens, S., Martin, D. T., Lawton, E., Lee, H., & Jenkins, D. (2004).
Accuracy of SRM and powertap power monitoring systems for bicycling. Medicial
Science Sports Exercise, (36), 1252-1258.
Gregor, R. J., & Wheeler, J. B. (1994). Biomechanical factors associated with shoe/pedal
interfaces: Implications for injury. Sports Medicine, 17(2), 117-131.
Hendler, B. (2004). Pedal efficiency: Round & round we go. Retrieved from
http://www.pezcyclingnews.com/?pg=fullstory&id=2417
Herlihy, D. V. (2004). Bicycle: the history. New Haven, CT: Yale University Press.
Hintzy, D. V., Belli, A., Grappe, F., & Rouillon, J. D. (1998). The effect of clip-less
pedals on mechanical characteristics measured during sprinting on a non-isokinetic cycle
ergometer. Science and Sports,14(3), 137-144. doi: 10.1016/s0765-1597(99)80055-0
36
36
Korff, T., Romer, L. M., Mayhew, I., & Martin, J. C. (2007). Effect of pedaling technique
on mechanical effectiveness and efficiency in cyclists. Medicial Science Sports
Exercise, 39(6), 991-995.
Lawrence, E., & Holmes, S. (1989). Henderson's dictionary of biological terms. New
York: Wiley.
Lim, A. (2004, November). Powertap introduction. Retrieved from
http://www.cycleops.com/cycleops-university/athletes-cu.html
Mackenzie, B. (2007). The complete sports science training library. London, England:
P2P Publishing.
Mornieux, G., Stapelfeldt, B., Gollhofer, A., & Belli, A. (2008). Effects of pedal type and
pull-up action during cycling. Sports Medicine, 29(10), 817-822. doi: 10.1055/s-2008-
1038374
Powers, S.K., & Howley, E.T., (2007). Exercise physiology: Theory and application to
fitness, performance, (6th ed.) New York, NY: McGraw-Hill Companies, Inc.
Pruitt, A. L. (2006). Complete medical guide for cyclists. Boulder, CO: VeloPress.
Sargeant, A. J., Hoinville, E., & Young, A. (1981). Maximum leg force and power output
during short-term dynamic exercise. Journal of Applied Physiology, 51(5), 1175-1182.
Silberman, M., Webner, D., Collina, S., & Shiple, B. (2005). Road bicycle fit. Clinical
Journal of Sports Medicine, 15(4), 271-276.
37
37
Sovndal, S. (2009). Cycling anatomy: Your illustrated guide for cycling strength, speed,
and endurance. Champaign, IL: Human Kinetics.
TrainingPeaks. (2012). TrainingPeaks LLC: WKO+ (Version 3.0) [Software]. Available
from http://home.trainingpeaks.com/products-desktop/wko.aspx
Vandewalle, D., Gilbert, P., & Monod, H. (1987). Standard anaerobic tests. Sports
Medicine, 4, 268-289.
Weltman, A., Stamford, B., & Fulco, C. (1979). Recovery from maximal effort exercise:
Lactate disappearance and subsequent performance. Journal of Applied
Physiology, 47(4), 677-682. Retrieved from http://jap.physiology.org/content/47/4/677
Wilson, D. G., Papadopoulos, J., & Whitt, F. R. (2004).Bicycling science. (3rd ed.).
Cambridge, MA: The MIT Press.
Zinn, L. (2000). Zinn and the art of road bike maintenence. (p. 264). Boulder, CO:
VeloPress.

38
38
APPENDIXES

31
APPENDIX A
Participation Flyer
32
Interested in getting better as a cyclist?
Research Participation Needed! Brandon Kuhn and the Department of Health and Human Performance at Fort Hays State University are currently looking for research participants in a cycling-related study. Your personal test results will be analyzed and interpreted to you AT NO COST! Attributes necessary to participate:
Competitive cyclist between the ages of 18 and 55 years Minimum 2-years experience each with Flat, Toe-Clip, AND
Clipless pedals Ability to give 3 all-out efforts without bias to any specific
trial Multi-speed mountain bicycle in good mechanical condition Good physical condition and health
Brief overview of the test protocol: Each participant will have his/her own session of testing lasting approximately 1 hour. The test will use our rear Powertap wheel fitted to your own bicycle on our trainer. After a warm up, you will be required to do three, 30-second all-out efforts with a 20-minute recovery between each. Each trial is with a different pedal type. ALL INFORMATION, DATA, AND RESULTS ARE KEPT PRIVATE! Further information can be found by contacting Brandon Kuhn at 785-650-5045 or [email protected]

33
APPENDIX B
Informed Consent
34
CONSENT TO PARTICIPATE IN RESEARCH
Department of Health and Human Performance, Fort Hays State University
Study title: A Comparison of Three Bicycle Pedal Types and Power Output
Name of Researcher: Brandon Kuhn Contact Information: 785-650-5045 or [email protected] Name of Faculty Supervisor & Contact Information, if student research: Dr. Greg Kandt, 785-628-4371 or [email protected] You are being asked to participate in a research study. It is your choice whether or not to participate. Your decision whether or not to participate will have no effect on benefits or services the quality of your care, academic standing, etc. to which you are otherwise entitled, Please ask questions if there is anything you do not understand. What is the purpose of this study ? The purpose of the study is to analyze and compare cycling power between three different bicycle pedal types. Information from this study will provide cyclists with more information about relationships between pedal type and peak power production. What does this study involve ? Participants of this study will be asked to report to the Kinesiology Lab in Cunningham Hall on the Fort Hays State University Campus for a single session of testing that will last a total of approximately one hour including rest/recovery breaks. Prior to beginning testing, the exact procedure will be described again and participants will be allowed a chance to ask any questions. The first pedal type will be randomly selected and installed by the researchers and the subject will then be allowed to warm up. The participant will provide a maximal effort for 30 seconds, during which all data will be recorded via a wireless computer. A 20-minute recovery period will then take place while the next randomly-assigned pedal type is installed. After the recovery period, the 30-second test will be performed again, with another 20-minute recovery period. Following the third and final 30-second test, a recovery period will not be required because data collection will be complete. Data for each subject will be analyzed before release back to the subject. If you decide to participate in this research study, you will be asked to sign this consent form after you have had all your questions answered and
35
understand what will happen to you. The length of time of your participation in this study is approximately 60 minutes. Approximately 10 participants will be in this study. Are there any benefits from participating in this study ? Each participant will be informed of his or her own scores, as well as a brief consultation to interpret the data. Your participation will help us develop a greater knowledge base for smarter training of competitive cyclists and for recommending pedal types. Will you be paid or receive anything to participate in this study ? You will not receive monetary compensation for participation in this study. What about the costs of this study ? There are no costs for participating in this study other than the time you will spend. What are the risks involved with being enrolled in this study ? It is unlikely that participation in this project will result in harm to you, although there is a small potential risk due to the short-term maximal effort required during testing. Risks of participating in this study include, but are not limited to: muscle injury, discomfort, cardiorespiratory problems, or even death. If you should decide to participate in this study, the physical demand required is no greater than the demand of a typical bicycle race. Risk of injury will be minimized as the test administrators will be continuously monitoring heart rate and perceived physical exertion during the entire test procedure. As a participant, you have the decision to discontinue participation at any time. In the event of physical and/or mental injury resulting from participation in this research project, Fort Hays State University does not provide any medical, hospitalization or other insurance for participants in this research study, nor will Fort Hays State University provide any medical treatment or compensation for any injury sustained as a result of participation in this research study, except as required by law. How will your privacy be protected? The information collected as data for this study includes: age, weight, gender, heart rate, power output and time. The data will be stored by the principal investigator on a personal computer until the study is completed. It will then be compiled and a copy will be given to the faculty advisor to store for 10 years should there be any questions regarding the study. If the data is not accessed within 10 years, it will be permanently erased

36
from all computer hard drives. All coded results, however, will be kept by the principal investigator and faculty advisor. Efforts will be made to protect the identities of the participants and the confidentiality of the research data used in this study, such as: Potentially identifiable information about you will consist of age, weight and gender. All permanent records are being identified using a randomly assigned participant identification number, not your name. This identifier is assigned by the two investigators. The faculty advisor will keep the demographic, informed consent forms, and data collection forms in a secured location. All access to the data will be limited to the research. The information collected for this study will be used only for the purposes of conducting this study. What we find from this study may be presented as meetings or published, but your name will never be used at any time. Other important items you should know: • Withdrawal from the study: You may choose to stop your participation in this study at any time. Your decision to stop your participation will have no effect on the quality of care, academic standing, etc. • Funding: K-INBRE (Kansas Idea Network of Biomedical Research Excellence) may provide funding to Fort Hays State University for monitoring equipment used in this research.
Compensation for Injury
“I have been informed and I understand that Fort Hays State University is not required to provide medical treatment or other forms of reimbursement to persons injured as a result of or in connection with participation in research activities conducted by Fort Hays State University or its faculty, but that Fort Hays State University may provide such treatment or reimbursement at its discretion. If I believe that I have been injured as a result of participating in the research covered by this consent form, I should contact the Office of Scholarship and Sponsored Projects, Fort Hays State University at 785-628-4349.” Whom should you call with questions about this study ? Questions about this study or concerns about a research related injury may be directed to the researcher in charge of this study: Brandon Kuhn at (785) 650-5045 or the Research Faculty Advisor: Dr. Greg Kandt at (785) 628-4371.
37
If you have questions, concerns, or suggestions about human research at FHSU, you may call the Office of Scholarship and Sponsored Projects at FHSU (785) 628-4349 during normal business hours. CONSENT I have read the above information about A Comparison of Three Bicycle Pedal Types and Power Output and have been given an opportunity to ask questions. By signing this I agree to participate in this study and I have been given a copy of this signed consent document for my own records. I understand that I can change my mind and withdraw my consent at any time. By signing this consent form I understand that I am not giving up any legal rights. I am 18 years or older. Participant's Signature and Date
38
APPENDIX C
Mean and Standard Deviation for Intervals
39
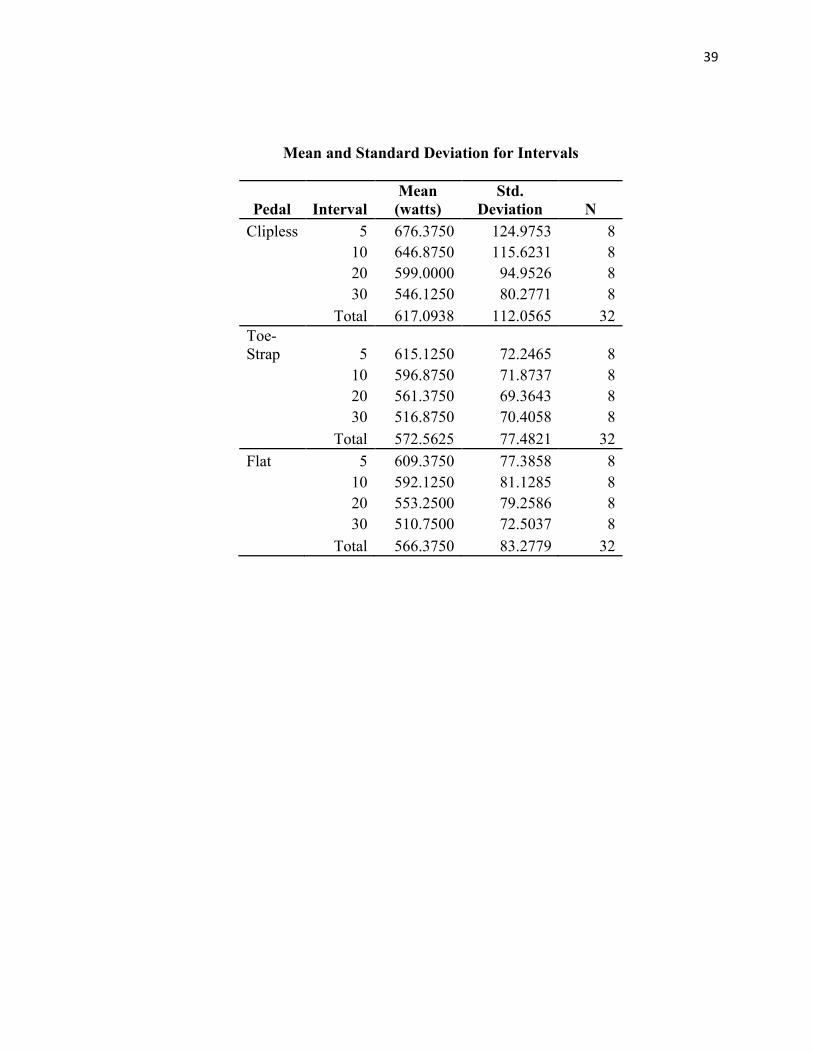
Mean and Standard Deviation for Intervals
Pedal Interval Mean (watts)
Std. Deviation N
Clipless 5 676.3750 124.9753 8
10 646.8750 115.6231 8
20 599.0000 94.9526 8
30 546.1250 80.2771 8
Total 617.0938 112.0565 32 Toe-Strap 5 615.1250 72.2465 8
10 596.8750 71.8737 8
20 561.3750 69.3643 8
30 516.8750 70.4058 8
Total 572.5625 77.4821 32 Flat 5 609.3750 77.3858 8
10 592.1250 81.1285 8
20 553.2500 79.2586 8
30 510.7500 72.5037 8
Total 566.3750 83.2779 32