Embed Size (px)
Citation preview
PAPER
GENERAL
Emma A. Levin,1,2,3 M.Res.; Ruth M. Morgan,1,2 D.Phil.; Lewis D. Griffin,4 Ph.D.; andVivienne J. Jones,3 Ph.D.
A Comparison of Thresholding Methods forForensic Reconstruction Studies UsingFluorescent Powder Proxies for TraceMaterials*
ABSTRACT: Image segmentation is a fundamental precursor to quantitative image analysis. At present, no standardised methodologyexists for segmenting images of fluorescent proxies for trace evidence. Experiments evaluated (i) whether manual segmentation is repro-ducible within and between examiners (with three participants repeatedly tracing three images) (ii) whether manually defining a thresh-old level offers accurate and reproducible results (with 20 examiners segmenting 10 images), and (iii) whether a global thresholdingalgorithm might perform with similar accuracy, while offering improved reproducibility and efficiency (16 algorithms tested). Statisti-cally significant differences were seen between examiners’ traced outputs. Manually thresholding produced good accuracy on average(within �1% of the expected values), but poor reproducibility (with multiple outliers). Three algorithms (Yen, MaxEntropy, andRenyiEntropy) offered similar accuracy, with improved reproducibility and efficiency. Together, these findings suggest that appropriatealgorithms could perform thresholding tasks as part of a robust workflow for reconstruction studies employing fluorescent proxies fortrace evidence.
KEYWORDS: forensic science, trace evidence, transfer and persistence, ultraviolet, fluorescence, image processing, segmentation,thresholding
Powder which fluoresces under ultraviolet light has been suc-cessfully employed as a proxy for microscopic trace evidence inexperiments exploring the transfer and persistence of particulatesin forensically relevant scenarios (1–3). With a diameter ofapproximately 15 lm (2), fluorescent powder has been used torepresent diverse evidence types, including silt-sized elements ofsoil (1,4) and pollen grains (5). Utilising a fluorescent proxy canallow for the rapid generation of data, since sampling can benondestructive (photographic) rather than destructive (involvingthe physical or chemical processing of samples) (2). Accord-ingly, such studies can help to expand our understanding of traceevidence dynamics and, therefore, inform the nuanced
interpretation of evidence within casework scenarios, a currentpriority for research within the forensic sciences (6).Studies which utilise fluorescent proxies tend to follow sim-
ilar methodologies; the fluorescent material is introduced to asurface, imaged repeatedly during the experiment, and theresultant images are segmented and analysed. At present, theredoes not appear to be a standardised methodology for seg-menting images in the context of persistence studies whichemploy a fluorescent proxy, but most appear to involve aform of thresholding (Table 1; (e.g., [1,3–5,7]). Where it isexplicit that thresholding has been used to segment the images(e.g., [7]) it is not readily apparent whether the thresholdvalue was manually defined or calculated with an algorithm(Table 1).Thresholding is one of the simplest methods of image seg-
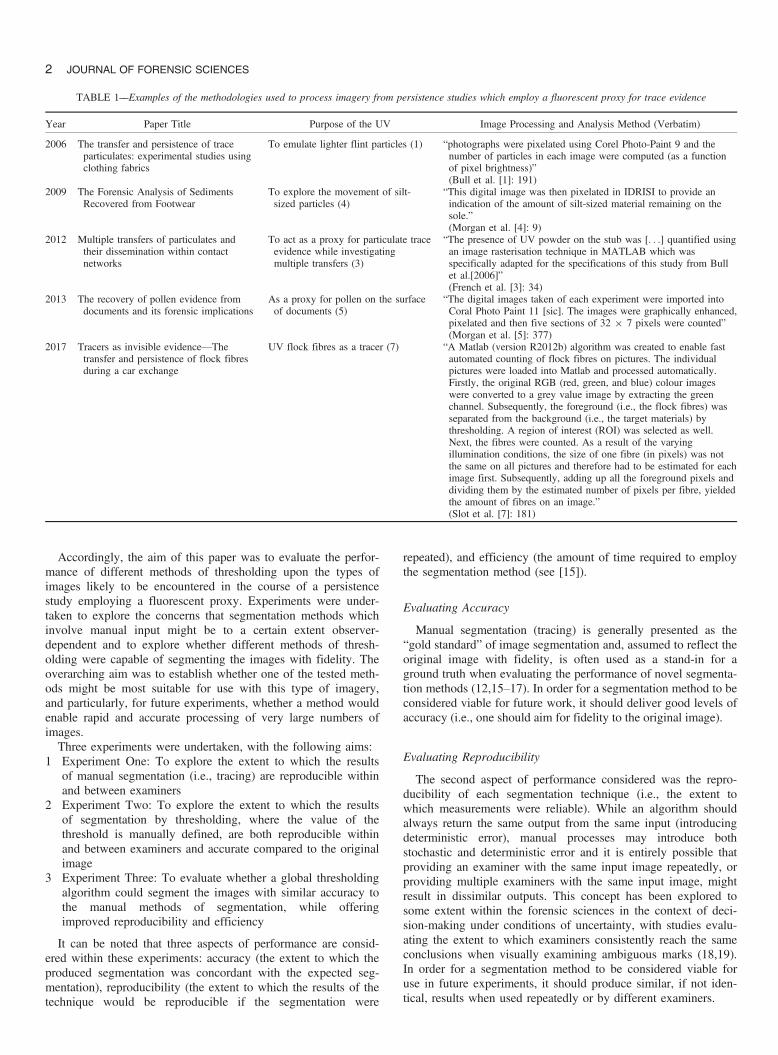
mentation; a threshold value is defined for an attribute of eachpixel (e.g., brightness or luminance levels), and every pixel’sbrightness value is reassigned to either black or white dependingon whether the original value of the pixel fell above or belowthe threshold (8,9). It has been firmly established within thefields of computer science and machine vision that differentthresholding algorithms are appropriate for different contexts,and treating the same input image with different algorithms canresult in very different outputs ([8,10,11]; Fig. 1). It has alsobeen suggested that manually defining a threshold level may beunreliable, and therefore problematic as part of a reproducibleworkflow (12–14).
1Centre for the Forensic Sciences, University College London, 35 Tavis-tock Square, London, WC1H 9EZ, U.K.
2Department of Security and Crime Science, University College London,35 Tavistock Square, London, WC1H 9EZ,U.K.
3Environmental Change Research Centre, Department of Geography,University College London, Pearson Building, Gower Street, London, WC1E6BT, U.K.
4Deparment of Computer Science, University College London, GowerStreet, London, WC1E 6BT, UK.Corresponding author: Emma A. Levin. M.Res. E-mail: [email protected]
*Funded by the Engineering and Physical Sciences Research Council of theUK through the Security Science Doctoral Training Research Centre (UCLSECReT) based at University College London (EP/G037264/1).
Received 12 June 2018; and in revised form 8 Oct. 2018; accepted 8 Oct.2018.
1© 2018 The Authors Journal of Forensic Sciences published by Wiley Periodicals, Inc. on behalf of American Academy of Forensic SciencesThis is an open access article under the terms of the Creative Commons Attribution License, which permits use,distribution and reproduction in any medium, provided the original work is properly cited.
J Forensic Sci, 2018doi: 10.1111/1556-4029.13938
Available online at: onlinelibrary.wiley.com
Accordingly, the aim of this paper was to evaluate the perfor-mance of different methods of thresholding upon the types ofimages likely to be encountered in the course of a persistencestudy employing a fluorescent proxy. Experiments were under-taken to explore the concerns that segmentation methods whichinvolve manual input might be to a certain extent observer-dependent and to explore whether different methods of thresh-olding were capable of segmenting the images with fidelity. Theoverarching aim was to establish whether one of the tested meth-ods might be most suitable for use with this type of imagery,and particularly, for future experiments, whether a method wouldenable rapid and accurate processing of very large numbers ofimages.Three experiments were undertaken, with the following aims:
1 Experiment One: To explore the extent to which the resultsof manual segmentation (i.e., tracing) are reproducible withinand between examiners
2 Experiment Two: To explore the extent to which the resultsof segmentation by thresholding, where the value of thethreshold is manually defined, are both reproducible withinand between examiners and accurate compared to the originalimage
3 Experiment Three: To evaluate whether a global thresholdingalgorithm could segment the images with similar accuracy tothe manual methods of segmentation, while offeringimproved reproducibility and efficiency
It can be noted that three aspects of performance are consid-ered within these experiments: accuracy (the extent to which theproduced segmentation was concordant with the expected seg-mentation), reproducibility (the extent to which the results of thetechnique would be reproducible if the segmentation were
repeated), and efficiency (the amount of time required to employthe segmentation method (see [15]).
Evaluating Accuracy
Manual segmentation (tracing) is generally presented as the“gold standard” of image segmentation and, assumed to reflect theoriginal image with fidelity, is often used as a stand-in for aground truth when evaluating the performance of novel segmenta-tion methods (12,15–17). In order for a segmentation method to beconsidered viable for future work, it should deliver good levels ofaccuracy (i.e., one should aim for fidelity to the original image).
Evaluating Reproducibility
The second aspect of performance considered was the repro-ducibility of each segmentation technique (i.e., the extent towhich measurements were reliable). While an algorithm shouldalways return the same output from the same input (introducingdeterministic error), manual processes may introduce bothstochastic and deterministic error and it is entirely possible thatproviding an examiner with the same input image repeatedly, orproviding multiple examiners with the same input image, mightresult in dissimilar outputs. This concept has been explored tosome extent within the forensic sciences in the context of deci-sion-making under conditions of uncertainty, with studies evalu-ating the extent to which examiners consistently reach the sameconclusions when visually examining ambiguous marks (18,19).In order for a segmentation method to be considered viable foruse in future experiments, it should produce similar, if not iden-tical, results when used repeatedly or by different examiners.
TABLE 1––Examples of the methodologies used to process imagery from persistence studies which employ a fluorescent proxy for trace evidence
Year Paper Title Purpose of the UV Image Processing and Analysis Method (Verbatim)
2006 The transfer and persistence of traceparticulates: experimental studies usingclothing fabrics
To emulate lighter flint particles (1) “photographs were pixelated using Corel Photo-Paint 9 and thenumber of particles in each image were computed (as a functionof pixel brightness)”(Bull et al. [1]: 191)
2009 The Forensic Analysis of SedimentsRecovered from Footwear
To explore the movement of silt-sized particles (4)
“This digital image was then pixelated in IDRISI to provide anindication of the amount of silt-sized material remaining on thesole.”(Morgan et al. [4]: 9)
2012 Multiple transfers of particulates andtheir dissemination within contactnetworks
To act as a proxy for particulate traceevidence while investigatingmultiple transfers (3)
“The presence of UV powder on the stub was [. . .] quantified usingan image rasterisation technique in MATLAB which wasspecifically adapted for the specifications of this study from Bullet al.[2006]”(French et al. [3]: 34)
2013 The recovery of pollen evidence fromdocuments and its forensic implications
As a proxy for pollen on the surfaceof documents (5)
“The digital images taken of each experiment were imported intoCoral Photo Paint 11 [sic]. The images were graphically enhanced,pixelated and then five sections of 32 9 7 pixels were counted”(Morgan et al. [5]: 377)
2017 Tracers as invisible evidence—Thetransfer and persistence of flock fibresduring a car exchange
UV flock fibres as a tracer (7) “A Matlab (version R2012b) algorithm was created to enable fastautomated counting of flock fibres on pictures. The individualpictures were loaded into Matlab and processed automatically.Firstly, the original RGB (red, green, and blue) colour imageswere converted to a grey value image by extracting the greenchannel. Subsequently, the foreground (i.e., the flock fibres) wasseparated from the background (i.e., the target materials) bythresholding. A region of interest (ROI) was selected as well.Next, the fibres were counted. As a result of the varyingillumination conditions, the size of one fibre (in pixels) was notthe same on all pictures and therefore had to be estimated for eachimage first. Subsequently, adding up all the foreground pixels anddividing them by the estimated number of pixels per fibre, yieldedthe amount of fibres on an image.”(Slot et al. [7]: 181)
2 JOURNAL OF FORENSIC SCIENCES
Evaluating Efficiency
Given that the time required to conduct visual data analysiscan place a ceiling on the amount of data that can be collectedover the course of experiments (20), it would be useful to arriveat a segmentation method that is not only comparatively accurateand comparatively reproducible, but also comparatively rapid(see also [15]). Accordingly, this paper also intended to evaluate,on the basis of time, whether it would be viable to employ eachsegmentation method upon a large set of images.The overall aim, therefore, was to identify a method of seg-
mentation that could be used as part of a robust workflow forthe analysis of ultraviolet fluorescence images in the context offuture persistence studies.
Materials
Images
Images were generated during a persistence study where fluo-rescent powder with a median diameter of approximately 15 lmhad been transferred to swatches of black cotton by flicking with
a stiff-bristled paintbrush, after (2). Ultraviolet illumination wasprovided with a 385 nm torch, and imaging followed the proce-dure outlined in (3), with samples housed in a purpose-built UV-dark box which excluded visible light and held the torch andcamera lens a fixed distance from the samples. Images wereacquired as 8-bit red, green, and blue (RGB) colour (see Figs 2and 3). Each swatch was composed of multiple layers of fabric,bound together by a staple (visible in the images in Fig. 3). Thestaple performed two functions: binding the upper layer of sam-ple fabric to a lower layer which could be attached to other sur-faces and handled without removing particles from theexperiment, and, secondly, providing a landmark that could beused for image registration during the analysis of images from apersistence study.
Methods
Experiment 1: Implementing Manual Segmentation (Tracing)
Experiment one aimed to assess the reproducibility of manualsegmentation (tracing) under optimal conditions, addressing theconcerns raised over variation between examiners (12–14). Three
FIG. 1––The results of applying four different local thresholding algorithms to the same input image (in this case a diatom, a form of environmental traceevidence). Algorithms were applied in ImageJ, with a radius of 15 pixels (from L-R, Bernsen, Contrast, Median, and Phansalkar).
LEVIN ET AL. . THRESHOLDING IMAGES OF FLUORESCENT POWDER PROXIES 3
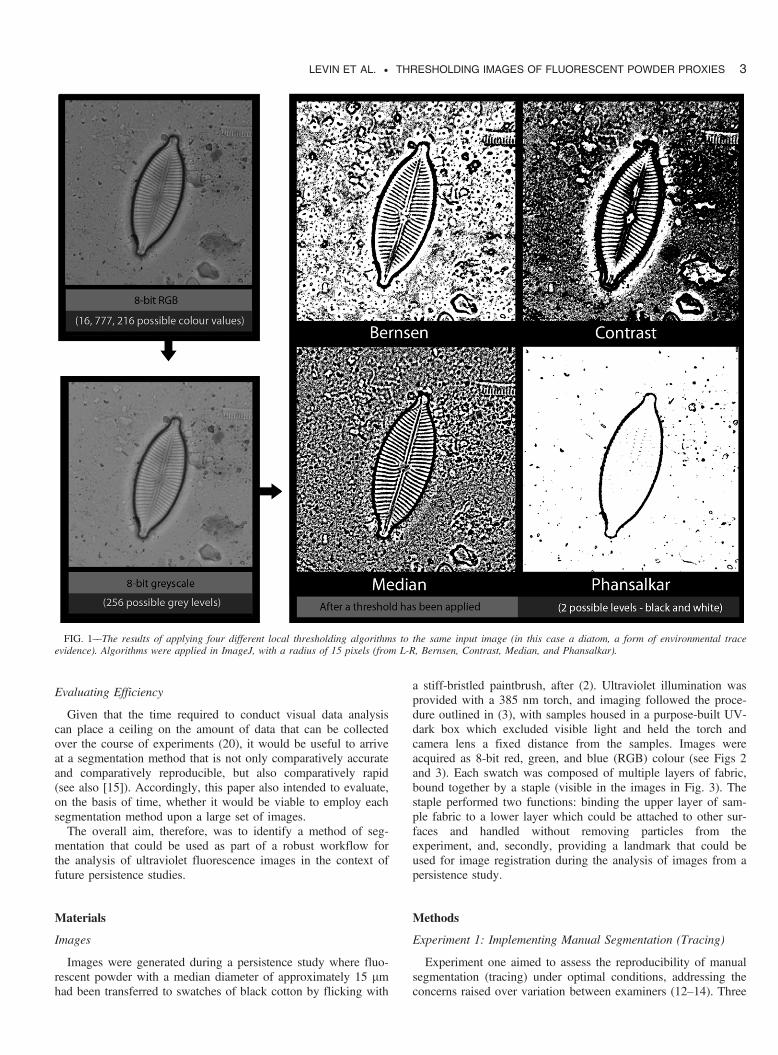
participants were provided with three 300 9 300 pixel subsec-tions of images in three rotations (Fig. 2), and asked to manuallysegment them to the best of their ability, by tracing over the flu-orescent particles in white, and filling the background withblack. The tracing was conducted in Adobe Photoshop (CS4) byopening the image, creating a new layer with a lowered opacity,
and tracing over the foreground regions of the images using thebrush and pencil tools. The participants were not aware that thenine images they were presented with were actually multiple ori-entations of three images. These images were all in focus andevenly illuminated; no efforts were made to deliberately compli-cate the task.
FIG. 2––The images and rotations used in Experiment 1.
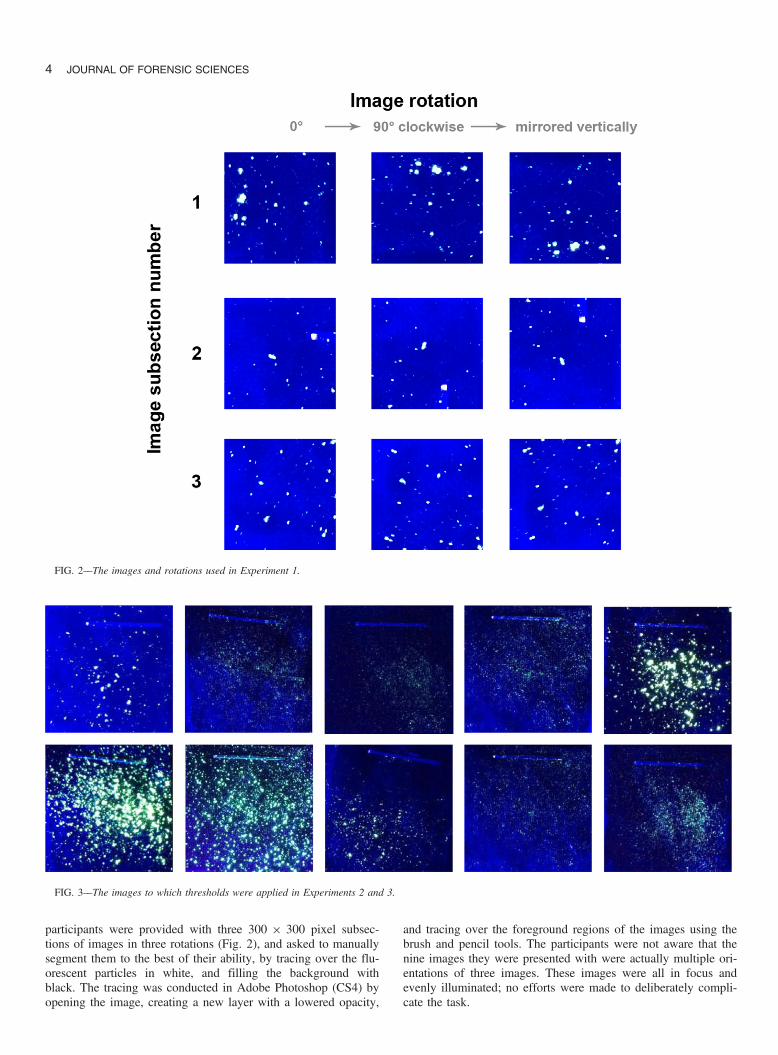
FIG. 3––The images to which thresholds were applied in Experiments 2 and 3.
4 JOURNAL OF FORENSIC SCIENCES
Experiment 2: Implementing Manually Defined Threshold Values
In order to explore inter-examiner reproducibility, images often swatches (Fig. 3) were given to 20 participants. The partici-pants were asked to apply a threshold filter to segment the imageinto the foreground (fluorescent particles) and background (non-fluorescent fabric). This was done in Adobe Photoshop (CS4),using the pathway Image > Adjustments > Threshold. In orderto explore intra-examiner reproducibility, one examiner wasasked to threshold each image 20 times with this method. Thiswas conducted over a period of several weeks so that the exam-iner could not recall previous answers. The amount of time takenfor each participant to complete the task was noted.
Experiment 3: Implementing the Thresholding Algorithms
The thresholding algorithms were implemented using NIH Ima-geJ. ImageJ was chosen for its accessibility (it is freeware with anintuitive graphical user interface) and for its potential to be cus-tomised through the installation of additional plugins and the writ-ing of macros (21–24). In this study, a suite of 16 globalthresholding algorithms were applied to the same 10 images used inexperiment 2 (Fig. 3) utilising the plugin Auto Threshold v1.15(25). Mathematical notation for each algorithm is available in thepublications outlined in (25), namely (26–38). Macros were writtenin order to open, process, and save the outputs of batches of images.As it has been established within the fields of computer
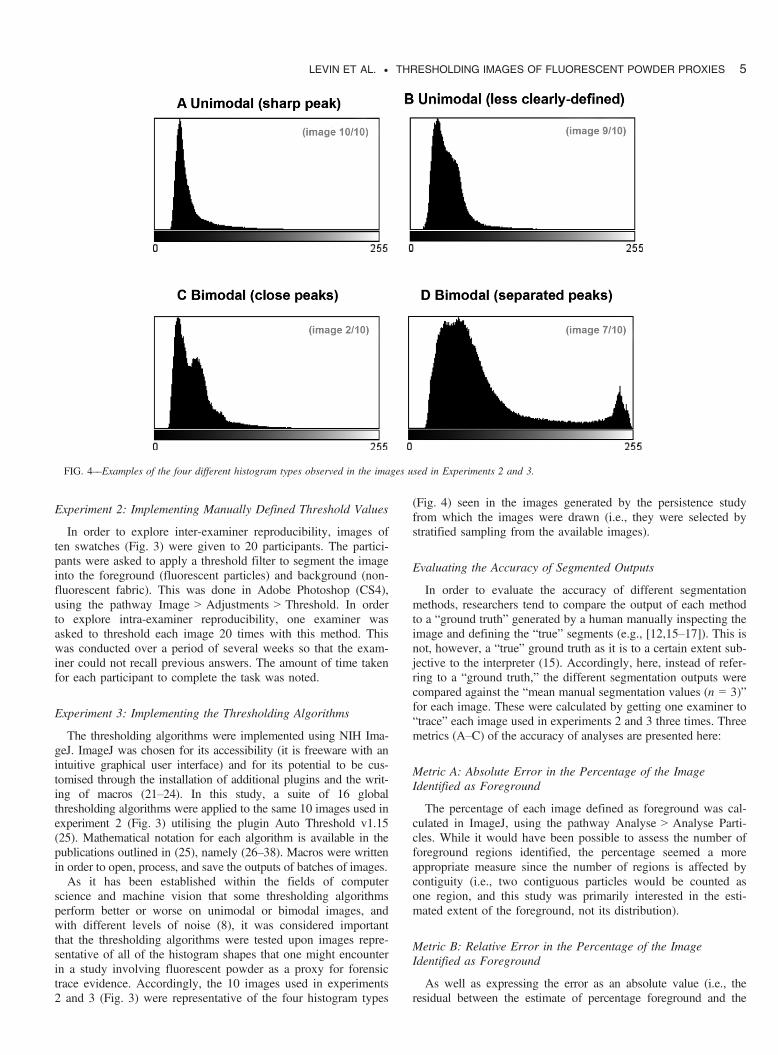
science and machine vision that some thresholding algorithmsperform better or worse on unimodal or bimodal images, andwith different levels of noise (8), it was considered importantthat the thresholding algorithms were tested upon images repre-sentative of all of the histogram shapes that one might encounterin a study involving fluorescent powder as a proxy for forensictrace evidence. Accordingly, the 10 images used in experiments2 and 3 (Fig. 3) were representative of the four histogram types
(Fig. 4) seen in the images generated by the persistence studyfrom which the images were drawn (i.e., they were selected bystratified sampling from the available images).
Evaluating the Accuracy of Segmented Outputs
In order to evaluate the accuracy of different segmentationmethods, researchers tend to compare the output of each methodto a “ground truth” generated by a human manually inspecting theimage and defining the “true” segments (e.g., [12,15–17]). This isnot, however, a “true” ground truth as it is to a certain extent sub-jective to the interpreter (15). Accordingly, here, instead of refer-ring to a “ground truth,” the different segmentation outputs werecompared against the “mean manual segmentation values (n = 3)”for each image. These were calculated by getting one examiner to“trace” each image used in experiments 2 and 3 three times. Threemetrics (A–C) of the accuracy of analyses are presented here:
Metric A: Absolute Error in the Percentage of the ImageIdentified as Foreground
The percentage of each image defined as foreground was cal-culated in ImageJ, using the pathway Analyse > Analyse Parti-cles. While it would have been possible to assess the number offoreground regions identified, the percentage seemed a moreappropriate measure since the number of regions is affected bycontiguity (i.e., two contiguous particles would be counted asone region, and this study was primarily interested in the esti-mated extent of the foreground, not its distribution).
Metric B: Relative Error in the Percentage of the ImageIdentified as Foreground
As well as expressing the error as an absolute value (i.e., theresidual between the estimate of percentage foreground and the
FIG. 4––Examples of the four different histogram types observed in the images used in Experiments 2 and 3.
LEVIN ET AL. . THRESHOLDING IMAGES OF FLUORESCENT POWDER PROXIES 5
mean estimate of percentage foreground obtained by manual seg-mentation [tracing]), it is here also expressed as a relative value(i.e., the percentage overestimation or underestimation compared tothe mean percentage value obtained from the manual segmentation).It was considered important to express both since the values for theextent of the foreground were variable, ranging from approximately3% to approximately 22% of the image. Accordingly, a 1% abso-lute difference in the estimate is not equally significant for eachimage. Similarly, an apparently large relative deviation might trans-late to a relatively small absolute deviation.
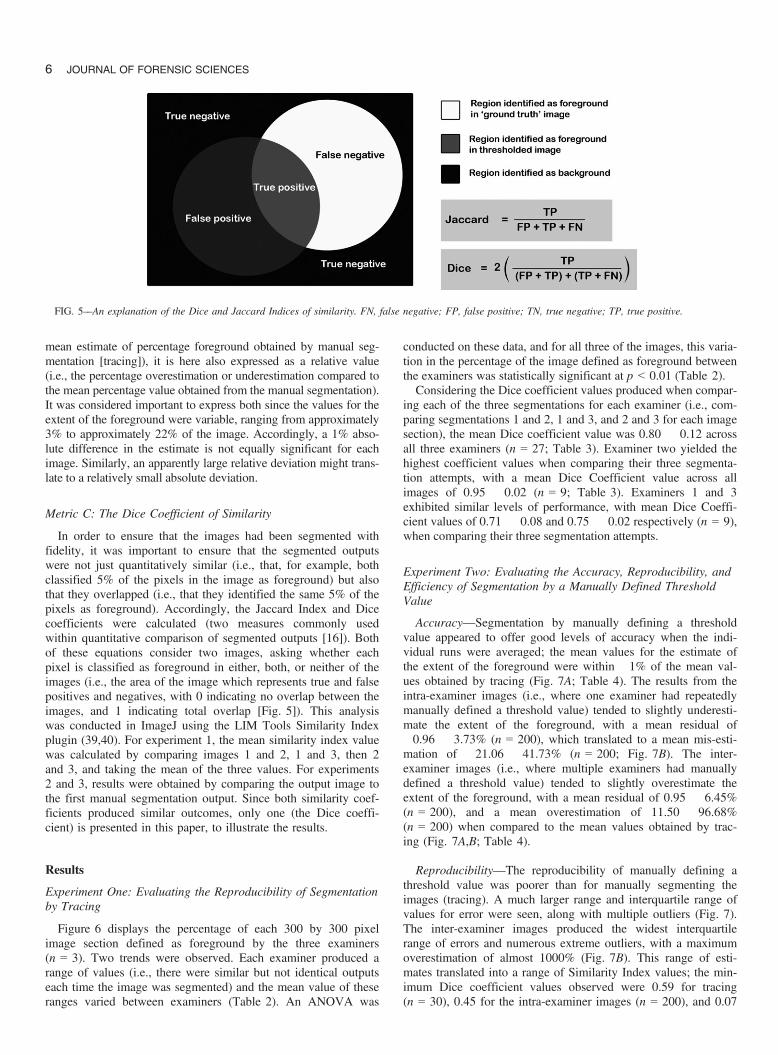
Metric C: The Dice Coefficient of Similarity
In order to ensure that the images had been segmented withfidelity, it was important to ensure that the segmented outputswere not just quantitatively similar (i.e., that, for example, bothclassified 5% of the pixels in the image as foreground) but alsothat they overlapped (i.e., that they identified the same 5% of thepixels as foreground). Accordingly, the Jaccard Index and Dicecoefficients were calculated (two measures commonly usedwithin quantitative comparison of segmented outputs [16]). Bothof these equations consider two images, asking whether eachpixel is classified as foreground in either, both, or neither of theimages (i.e., the area of the image which represents true and falsepositives and negatives, with 0 indicating no overlap between theimages, and 1 indicating total overlap [Fig. 5]). This analysiswas conducted in ImageJ using the LIM Tools Similarity Indexplugin (39,40). For experiment 1, the mean similarity index valuewas calculated by comparing images 1 and 2, 1 and 3, then 2and 3, and taking the mean of the three values. For experiments2 and 3, results were obtained by comparing the output image tothe first manual segmentation output. Since both similarity coef-ficients produced similar outcomes, only one (the Dice coeffi-cient) is presented in this paper, to illustrate the results.
Results
Experiment One: Evaluating the Reproducibility of Segmentationby Tracing
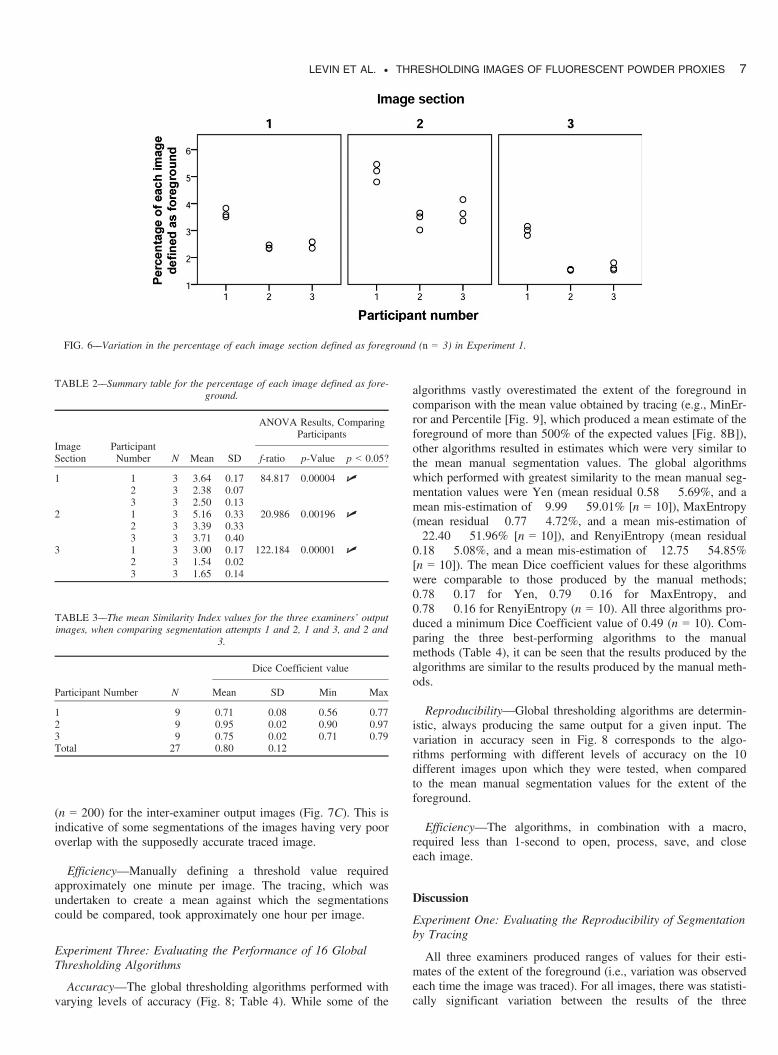
Figure 6 displays the percentage of each 300 by 300 pixelimage section defined as foreground by the three examiners(n = 3). Two trends were observed. Each examiner produced arange of values (i.e., there were similar but not identical outputseach time the image was segmented) and the mean value of theseranges varied between examiners (Table 2). An ANOVA was
conducted on these data, and for all three of the images, this varia-tion in the percentage of the image defined as foreground betweenthe examiners was statistically significant at p < 0.01 (Table 2).Considering the Dice coefficient values produced when compar-
ing each of the three segmentations for each examiner (i.e., com-paring segmentations 1 and 2, 1 and 3, and 2 and 3 for each imagesection), the mean Dice coefficient value was 0.80 � 0.12 acrossall three examiners (n = 27; Table 3). Examiner two yielded thehighest coefficient values when comparing their three segmenta-tion attempts, with a mean Dice Coefficient value across allimages of 0.95 � 0.02 (n = 9; Table 3). Examiners 1 and 3exhibited similar levels of performance, with mean Dice Coeffi-cient values of 0.71 � 0.08 and 0.75 � 0.02 respectively (n = 9),when comparing their three segmentation attempts.
Experiment Two: Evaluating the Accuracy, Reproducibility, andEfficiency of Segmentation by a Manually Defined ThresholdValue
Accuracy—Segmentation by manually defining a thresholdvalue appeared to offer good levels of accuracy when the indi-vidual runs were averaged; the mean values for the estimate ofthe extent of the foreground were within �1% of the mean val-ues obtained by tracing (Fig. 7A; Table 4). The results from theintra-examiner images (i.e., where one examiner had repeatedlymanually defined a threshold value) tended to slightly underesti-mate the extent of the foreground, with a mean residual of�0.96 � 3.73% (n = 200), which translated to a mean mis-esti-mation of �21.06 � 41.73% (n = 200; Fig. 7B). The inter-examiner images (i.e., where multiple examiners had manuallydefined a threshold value) tended to slightly overestimate theextent of the foreground, with a mean residual of 0.95 � 6.45%(n = 200), and a mean overestimation of 11.50 � 96.68%(n = 200) when compared to the mean values obtained by trac-ing (Fig. 7A,B; Table 4).
Reproducibility—The reproducibility of manually defining athreshold value was poorer than for manually segmenting theimages (tracing). A much larger range and interquartile range ofvalues for error were seen, along with multiple outliers (Fig. 7).The inter-examiner images produced the widest interquartilerange of errors and numerous extreme outliers, with a maximumoverestimation of almost 1000% (Fig. 7B). This range of esti-mates translated into a range of Similarity Index values; the min-imum Dice coefficient values observed were 0.59 for tracing(n = 30), 0.45 for the intra-examiner images (n = 200), and 0.07
FIG. 5––An explanation of the Dice and Jaccard Indices of similarity. FN, false negative; FP, false positive; TN, true negative; TP, true positive.
6 JOURNAL OF FORENSIC SCIENCES
(n = 200) for the inter-examiner output images (Fig. 7C). This isindicative of some segmentations of the images having very pooroverlap with the supposedly accurate traced image.
Efficiency—Manually defining a threshold value requiredapproximately one minute per image. The tracing, which wasundertaken to create a mean against which the segmentationscould be compared, took approximately one hour per image.
Experiment Three: Evaluating the Performance of 16 GlobalThresholding Algorithms
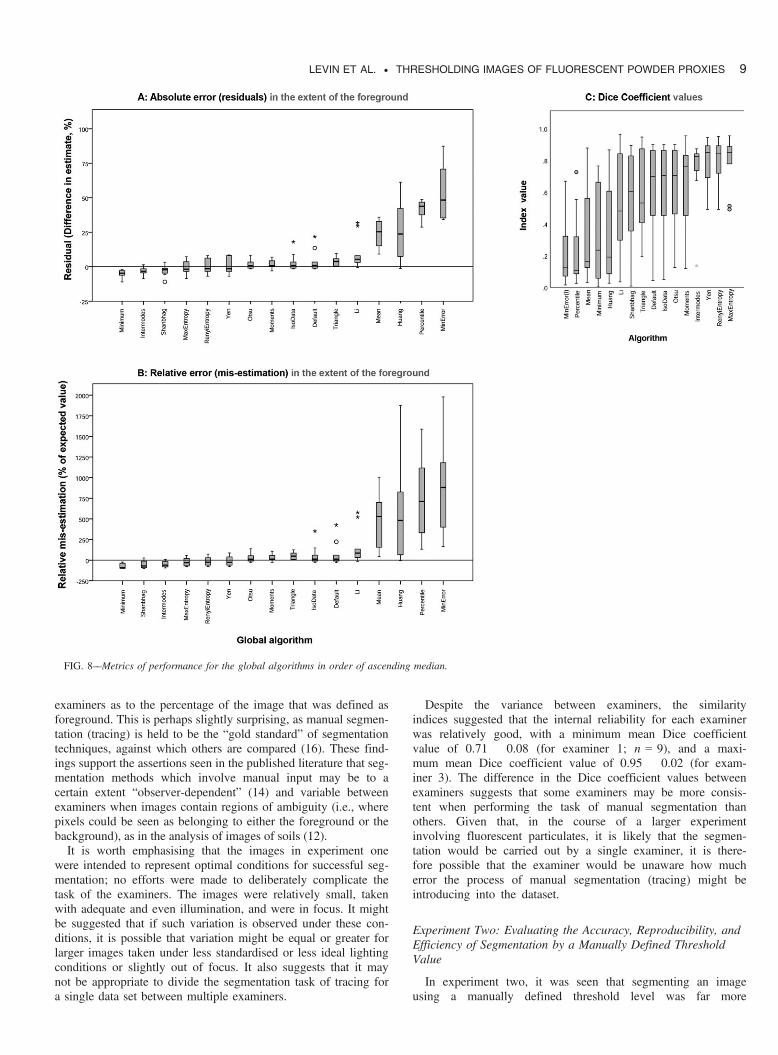
Accuracy—The global thresholding algorithms performed withvarying levels of accuracy (Fig. 8; Table 4). While some of the
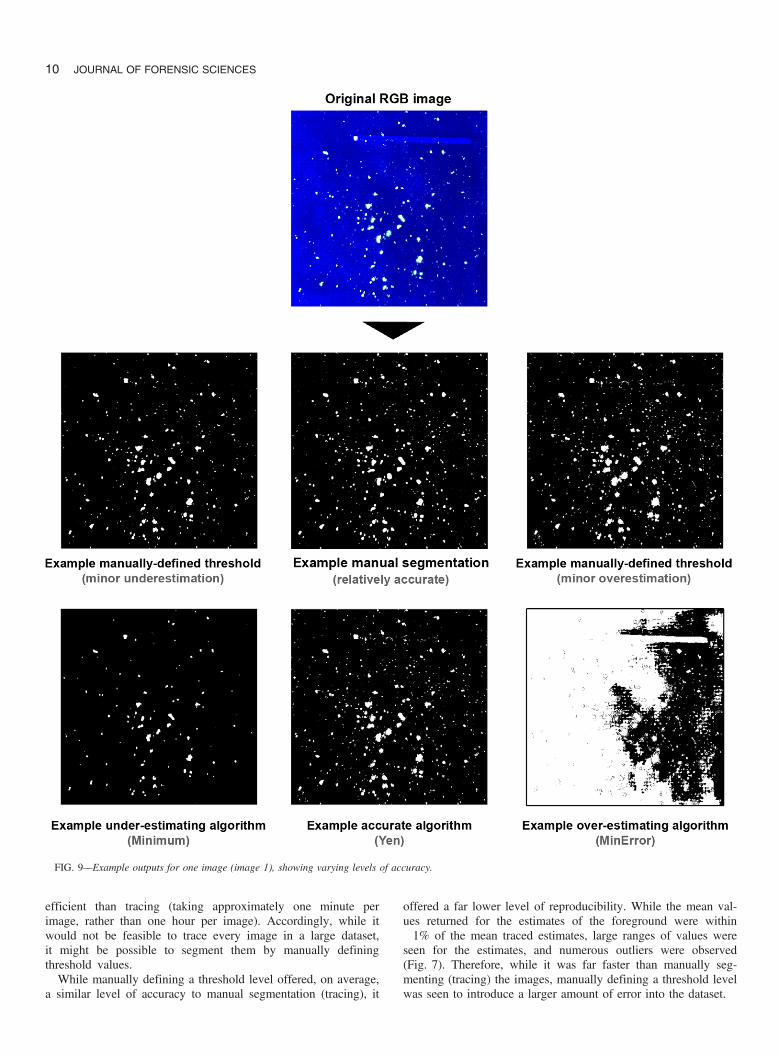
algorithms vastly overestimated the extent of the foreground incomparison with the mean value obtained by tracing (e.g., MinEr-ror and Percentile [Fig. 9], which produced a mean estimate of theforeground of more than 500% of the expected values [Fig. 8B]),other algorithms resulted in estimates which were very similar tothe mean manual segmentation values. The global algorithmswhich performed with greatest similarity to the mean manual seg-mentation values were Yen (mean residual 0.58 � 5.69%, and amean mis-estimation of �9.99 � 59.01% [n = 10]), MaxEntropy(mean residual �0.77 � 4.72%, and a mean mis-estimation of�22.40 � 51.96% [n = 10]), and RenyiEntropy (mean residual0.18 � 5.08%, and a mean mis-estimation of �12.75 � 54.85%[n = 10]). The mean Dice coefficient values for these algorithmswere comparable to those produced by the manual methods;0.78 � 0.17 for Yen, 0.79 � 0.16 for MaxEntropy, and0.78 � 0.16 for RenyiEntropy (n = 10). All three algorithms pro-duced a minimum Dice Coefficient value of 0.49 (n = 10). Com-paring the three best-performing algorithms to the manualmethods (Table 4), it can be seen that the results produced by thealgorithms are similar to the results produced by the manual meth-ods.
Reproducibility—Global thresholding algorithms are determin-istic, always producing the same output for a given input. Thevariation in accuracy seen in Fig. 8 corresponds to the algo-rithms performing with different levels of accuracy on the 10different images upon which they were tested, when comparedto the mean manual segmentation values for the extent of theforeground.
Efficiency—The algorithms, in combination with a macro,required less than 1-second to open, process, save, and closeeach image.
Discussion
Experiment One: Evaluating the Reproducibility of Segmentationby Tracing
All three examiners produced ranges of values for their esti-mates of the extent of the foreground (i.e., variation was observedeach time the image was traced). For all images, there was statisti-cally significant variation between the results of the three
FIG. 6––Variation in the percentage of each image section defined as foreground (n = 3) in Experiment 1.
TABLE 2––Summary table for the percentage of each image defined as fore-ground.
ImageSection
ParticipantNumber N Mean SD
ANOVA Results, ComparingParticipants
f-ratio p-Value p < 0.05?
1 1 3 3.64 0.17 84.817 0.00004 U2 3 2.38 0.073 3 2.50 0.13
2 1 3 5.16 0.33 20.986 0.00196 U2 3 3.39 0.333 3 3.71 0.40
3 1 3 3.00 0.17 122.184 0.00001 U2 3 1.54 0.023 3 1.65 0.14
TABLE 3––The mean Similarity Index values for the three examiners’ outputimages, when comparing segmentation attempts 1 and 2, 1 and 3, and 2 and
3.
Participant Number N
Dice Coefficient value
Mean SD Min Max
1 9 0.71 0.08 0.56 0.772 9 0.95 0.02 0.90 0.973 9 0.75 0.02 0.71 0.79Total 27 0.80 0.12
LEVIN ET AL. . THRESHOLDING IMAGES OF FLUORESCENT POWDER PROXIES 7
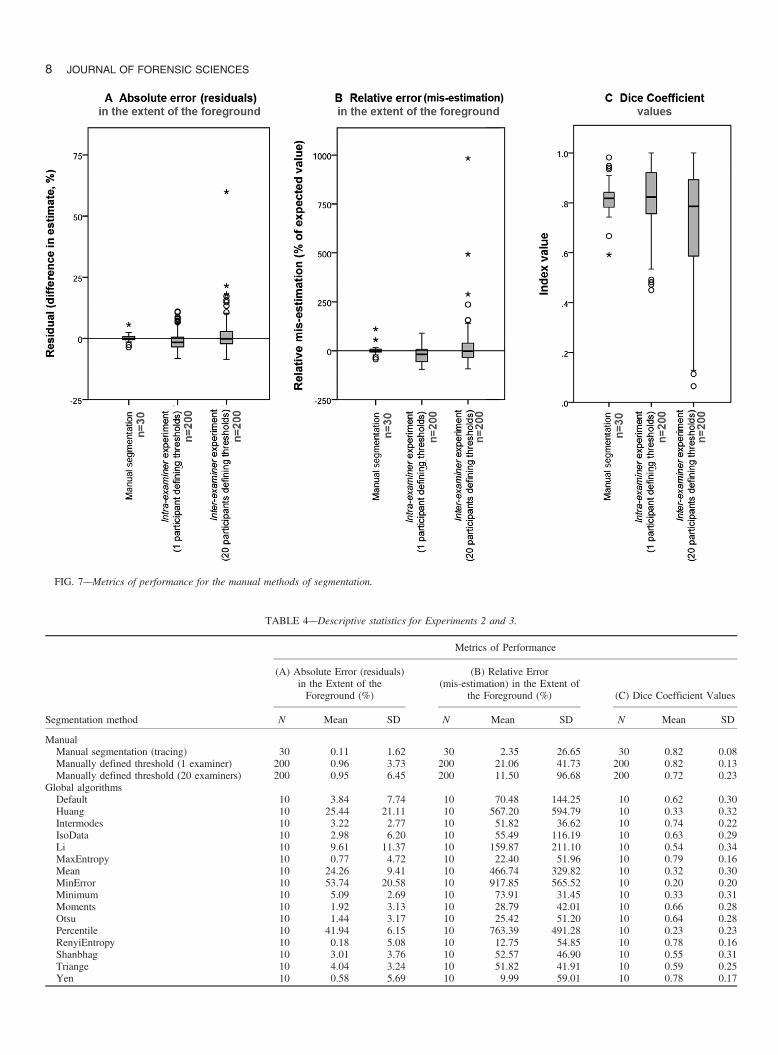
FIG. 7––Metrics of performance for the manual methods of segmentation.
TABLE 4––Descriptive statistics for Experiments 2 and 3.
Segmentation method
Metrics of Performance
(A) Absolute Error (residuals)in the Extent of theForeground (%)
(B) Relative Error(mis-estimation) in the Extent of
the Foreground (%) (C) Dice Coefficient Values
N Mean SD N Mean SD N Mean SD
ManualManual segmentation (tracing) 30 0.11 1.62 30 2.35 26.65 30 0.82 0.08Manually defined threshold (1 examiner) 200 �0.96 3.73 200 �21.06 41.73 200 0.82 0.13Manually defined threshold (20 examiners) 200 0.95 6.45 200 11.50 96.68 200 0.72 0.23
Global algorithmsDefault 10 3.84 7.74 10 70.48 144.25 10 0.62 0.30Huang 10 25.44 21.11 10 567.20 594.79 10 0.33 0.32Intermodes 10 �3.22 2.77 10 �51.82 36.62 10 0.74 0.22IsoData 10 2.98 6.20 10 55.49 116.19 10 0.63 0.29Li 10 9.61 11.37 10 159.87 211.10 10 0.54 0.34MaxEntropy 10 �0.77 4.72 10 �22.40 51.96 10 0.79 0.16Mean 10 24.26 9.41 10 466.74 329.82 10 0.32 0.30MinError 10 53.74 20.58 10 917.85 565.52 10 0.20 0.20Minimum 10 �5.09 2.69 10 �73.91 31.45 10 0.33 0.31Moments 10 1.92 3.13 10 28.79 42.01 10 0.66 0.28Otsu 10 1.44 3.17 10 25.42 51.20 10 0.64 0.28Percentile 10 41.94 6.15 10 763.39 491.28 10 0.23 0.23RenyiEntropy 10 0.18 5.08 10 �12.75 54.85 10 0.78 0.16Shanbhag 10 �3.01 3.76 10 �52.57 46.90 10 0.55 0.31Triange 10 4.04 3.24 10 51.82 41.91 10 0.59 0.25Yen 10 0.58 5.69 10 �9.99 59.01 10 0.78 0.17
8 JOURNAL OF FORENSIC SCIENCES
examiners as to the percentage of the image that was defined asforeground. This is perhaps slightly surprising, as manual segmen-tation (tracing) is held to be the “gold standard” of segmentationtechniques, against which others are compared (16). These find-ings support the assertions seen in the published literature that seg-mentation methods which involve manual input may be to acertain extent “observer-dependent” (14) and variable betweenexaminers when images contain regions of ambiguity (i.e., wherepixels could be seen as belonging to either the foreground or thebackground), as in the analysis of images of soils (12).It is worth emphasising that the images in experiment one
were intended to represent optimal conditions for successful seg-mentation; no efforts were made to deliberately complicate thetask of the examiners. The images were relatively small, takenwith adequate and even illumination, and were in focus. It mightbe suggested that if such variation is observed under these con-ditions, it is possible that variation might be equal or greater forlarger images taken under less standardised or less ideal lightingconditions or slightly out of focus. It also suggests that it maynot be appropriate to divide the segmentation task of tracing fora single data set between multiple examiners.
Despite the variance between examiners, the similarityindices suggested that the internal reliability for each examinerwas relatively good, with a minimum mean Dice coefficientvalue of 0.71 � 0.08 (for examiner 1; n = 9), and a maxi-mum mean Dice coefficient value of 0.95 � 0.02 (for exam-iner 3). The difference in the Dice coefficient values betweenexaminers suggests that some examiners may be more consis-tent when performing the task of manual segmentation thanothers. Given that, in the course of a larger experimentinvolving fluorescent particulates, it is likely that the segmen-tation would be carried out by a single examiner, it is there-fore possible that the examiner would be unaware how mucherror the process of manual segmentation (tracing) might beintroducing into the dataset.
Experiment Two: Evaluating the Accuracy, Reproducibility, andEfficiency of Segmentation by a Manually Defined ThresholdValue
In experiment two, it was seen that segmenting an imageusing a manually defined threshold level was far more
FIG. 8––Metrics of performance for the global algorithms in order of ascending median.
LEVIN ET AL. . THRESHOLDING IMAGES OF FLUORESCENT POWDER PROXIES 9
efficient than tracing (taking approximately one minute perimage, rather than one hour per image). Accordingly, while itwould not be feasible to trace every image in a large dataset,it might be possible to segment them by manually definingthreshold values.While manually defining a threshold level offered, on average,
a similar level of accuracy to manual segmentation (tracing), it
offered a far lower level of reproducibility. While the mean val-ues returned for the estimates of the foreground were within�1% of the mean traced estimates, large ranges of values wereseen for the estimates, and numerous outliers were observed(Fig. 7). Therefore, while it was far faster than manually seg-menting (tracing) the images, manually defining a threshold levelwas seen to introduce a larger amount of error into the dataset.
FIG. 9––Example outputs for one image (image 1), showing varying levels of accuracy.
10 JOURNAL OF FORENSIC SCIENCES
Since the experiments conducted here suggested that manuallydefining a threshold value yielded results that were highly vari-able (i.e., it is possible that the segmented output will accuratelyreflect the input, but it is plausible that it will not), it might besuggested that manually defining a threshold level might not bea reliable method of segmentation for this form of ultraviolet flu-orescence imagery. Since the quality of any quantitative outputis contingent upon the quality of the segmentation step, this maybe considered problematic.
Experiment Three: Evaluating the Performance of 16 GlobalThresholding Algorithms
The global algorithms tested here offered reproducible esti-mates for the extent of the foreground (always returning thesame output from the same input), with efficiency (taking lessthan 1-second to open, process, save, and close an image). Thedifferent algorithms performed with varying levels of accuracy(Fig. 8). The best-performing algorithms, which in these experi-ments were the Yen, MaxEntropy, and RenyiEntropy globalalgorithms, offered mean estimates of the extent of the fore-ground that were concordant with (i.e., within �1% of) the meantraced estimates (Fig. 8; Table 4).Accordingly, on the basis of maximising reproducibility (with-
out sacrificing accuracy), for a robust image processing work-flow which is capable of processing large numbers of ultravioletfluorescence images, these experiments suggest that it might beadvisable to employ an appropriate algorithm. For future work,using an appropriate algorithm may provide a fast method ofimage segmentation, which does not compromise on levels ofaccuracy or reliability. The results of these experiments suggestthat for ultraviolet fluorescence imagery of green powder fluo-rescing on a dark fabric background, the Yen, RenyiEntropy, orMaxEntropy algorithms may be appropriate. It should be noted,however, that since thresholding algorithms could perform withdifferent levels of accuracy on images with different amountsand distributions of fluorescent material, it would be advisablefor researchers to perform an evaluative study on the specificimages to be used before employing a particular algorithmwithin a transfer and persistence experiment.Future work could consider further testing of these algorithms
under less ideal conditions (e.g., with less homogeneous lighting,out of focus images, or where there is less contrast between theforeground and background of the image). It is worth stressingthat the algorithms tested here (i.e., global thresholding algo-rithms) are amongst the simplest methods of image segmenta-tion; future work may want to explore the performance of moresophisticated segmentation methods within this context.In summary, for images of fluorescent powder on dark fabric
under ultraviolet illumination, manual segmentation (tracing)offered high levels of accuracy when compared to the meanmanual segmentation and moderate reproducibility, but lackedefficiency, taking too long to be employed in a much largerstudy. Manual thresholding offered similar levels of accuracyand improved efficiency, but sacrificed reproducibility. A thresh-olding algorithm can offer improved reproducibility, superiorefficiency, and, if the algorithm is appropriate, it can do so with-out sacrificing accuracy.
Conclusions
Four main conclusions can be drawn from these experiments.
1 When manually segmenting (tracing) images of fluorescentpowder under ultraviolet illumination, different examinersmay arrive at different answers as to the extent of the fore-ground, and variation may be observed when the same exam-iner repeatedly segments an image.
2 While segmentation by manually applying a threshold canoffer a faster alternative to manual segmentation (tracing),this method also raises problems regarding the reproducibilityof results. While a mean value may approach an accurateanswer for quantitative analyses, a single segmentation mayproduce an inaccurate value (i.e., in these experiments arange of values and outliers were seen).
3 Using an algorithm to define a threshold value can over-come these issues around reproducibility while offeringincreased efficiency. In these experiments, it was suggestedthat many algorithms are inappropriate for use with ultravi-olet fluorescence imagery, but some offer results which arequantitatively similar to the outputs achieved by manualmethods.
4 In these experiments, the three algorithms which performedwith the greatest accuracy were Yen, MaxEntropy, andRenyiEntropy. All three of these global algorithms producedresults which mis-estimated the foreground by amounts com-parable to a human examiner conducting manual segmenta-tion, but at much faster speeds. It may be possible to employthese algorithms in future experiments as part of a rapid androbust image processing workflow.
Together, these findings suggest that persistence studieswhich employ fluorescent powder proxies for trace evidencecould harness the power of thresholding algorithms and macrosto accelerate data analysis without compromising on accuracy.Establishing a robust automated approach for segmentation hasthe potential to significantly expand the amount of data thatcan be collected regarding the transfer and persistence of traceparticles. Such data can provide a valuable empirical evidencebase to underpin the interpretation of forensic trace evidenceand to respond to calls for further experimentation within theseareas (6,41,42).
Acknowledgments
The authors wish to acknowledge the assistance of Joni Levin-kind for his help writing macros for use in ImageJ, to thank theparticipants in this study for their patience, and to thank the tworeviewers for their helpful and incisive comments.
References
1. Bull PA, Morgan RM, Sagovsky A, Hughes GJA. The transfer and per-sistence of trace particulates: experimental studies using clothing fabrics.Sci Justice 2006;46(3):185–95.
2. Morgan RM, French JC, O’Donnell L, Bull PA. The reincorporation andredistribution of trace geoforensic particulates on clothing: an introduc-tory study. Sci Justice 2010;50(4):195–9.
3. French JC, Morgan RM, Baxendell P, Bull PA. Multiple transfers of par-ticulates and their dissemination within contact networks. Sci Justice2012;52(1):33–41.
4. Morgan RM, Freudiger-Bonzon J, Nichols KH, Jellis T, Dunkerley S,Zelazowski P, et al. The forensic analysis of sediments recovered fromfootwear. In: Ritz K, Dawson L, Miller D, editors. Criminal and environ-mental soil forensics. Dordrecht, the Netherlands: Springer, 2009;253–69.
5. Morgan RM, Davies G, Balestri F, Bull PA. The recovery of pollen evi-dence from documents and its forensic implications. Sci Justice 2013;53(4):375–84.
LEVIN ET AL. . THRESHOLDING IMAGES OF FLUORESCENT POWDER PROXIES 11
6. Morgan RM. Conceptualising forensic science and forensic reconstruc-tion. Part I: a conceptual model. Sci Justice 2017;57(6):455–9.
7. Slot A, van der Weerd J, Roos M, Baiker M, Stoel RD, Zuidberg MC.Tracers as invisible evidence – the transfer and persistence of flock fibresduring a car exchange. Forensic Sci Int 2017;275:178–86.
8. Sezgin M, Sankur B. Survey over image thresholding techniques andquantitative performance evaluation. J Electron Imaging 2004;13(1):146–68.
9. Oberholzer M, €Ostreicher M, Christen H, Br€uhlmann M. Methods inquantitative image analysis. Histochem Cell Biol 1996;105(5):333–55.
10. Hoover A, Jean-Baptiste G, Jiang X, Flynn PJ, Bunke H, Goldgof DB,et al. An experimental comparison of range image segmentation algo-rithms. IEEE Trans Pattern Anal Mach Intell 1996;18(7):673–89.
11. Zaitoun NM, Aqel MJ. Survey on image segmentation techniques. Proce-dia Comput Sci 2015;65:797–806.
12. Yang X, Beyenal H, Harkin G, Lewandowski Z. Evaluation of biofilmimage thresholding methods. Water Res 2001;35(5):1149–58.
13. Baveye P. Comment on “evaluation of biofilm image thresholding meth-ods” [comment]. Water Res 2002;36(3):805–6. Comment on: Water Res2001;35(5):1149–58.
14. Baveye PC, Laba M, Otten W, Bouckaert L, Sterpaio PD, Goswami RR,et al. Observer-dependent variability of the thresholding step in the quan-titative analysis of soil images and X-ray microtomography data. Geo-derma 2010;157(1):51–63.
15. Udupa JK, LeBlanc VR, Zhuge Y, Imielinska C, Schmidt H, Currie LM,et al. A framework for evaluating image segmentation algorithms. Com-put Med Imaging Graph 2006;30(2):75–87.
16. Crum WR, Camara O, Hill DL. Generalized overlap measures for evalu-ation and validation in medical image analysis. IEEE Trans Med Imaging2006;25(11):1451–61.
17. Griffin LD, Elangovan P, Mundell A, Hezel DC. Improved segmentationof meteorite micro-CT images using local histograms. Comput Geosci2012;39:129–34.
18. Dror IE, Charlton D, P�eron AE. Contextual information renders expertsvulnerable to making erroneous identifications. Forensic Sci Int 2006;156(1):74–8.
19. Thompson MB, Tangen JM, McCarthy DJ. Expertise in fingerprint iden-tification. J Forensic Sci 2013;58(6):1519–30.
20. Du Buf H, Bayer MM. Introduction to ADIAC and this book. In: DuBuf H, Bayer MM, editors. Automatic diatom identification. River Edge,NJ: World Scientific, 2002;1–8.
21. Schneider CA, Rasband WS, Eliceiri KW. NIH Image to ImageJ:25 years of image analysis. Nat Methods 2012;9(7):671–5.
22. Arena ET, Rueden CT, Hiner MC, Wang S, Yuan M, Eliceiri KW.Quantitating the cell: turning images into numbers with ImageJ. WileyInterdiscip Rev Dev Biol 2017;6(2):e260.
23. Legland D, Arganda-Carreras I, Andrey P. MorphoLibJ: integratedlibrary and plugins for mathematical morphology with ImageJ. Bioinfor-matics 2016;32(22):3532–4.
24. Schulze K, Tillich UM, Dandekar T, Frohme M. PlanktoVision – anautomated analysis system for the identification of phytoplankton. BMCBioinformatics 2013;14(1):115.
25. ImageJ. Auto threshold; https://imagej.net/Auto_Threshold (accessedFebruary 2, 2017).
26. Huang LK, Wang MJJ. Image thresholding by minimizing the measuresof fuzziness. Pattern Recognit 1995;28(1):41–51.
27. Prewitt J, Mendelsohn ML. The analysis of cell images. Ann N Y AcadSci 1966;128(3):1035–53.
28. Ridler TW, Calvard S. Picture thresholding using an iterative selectionmethod. IEEE Trans Syst Man Cybern 1978;8(8):630–2.
29. Li CH, Tam PKS. An iterative algorithm for minimum cross entropythresholding. Pattern Recognit Lett 1998;19(8):771–6.
30. Kapur JN, Sahoo PK, Wong AKC. A new method for gray-level picturethresholding using the entropy of the histogram. Comput Graph ImageProcess 1985;29(3):273–85.
31. Glasbey CA. An analysis of histogram-based thresholding algorithms.CVGIP Graph Models Image Process 1993;55(6):532–7.
32. Kittler J, Illingworth J. Minimum error thresholding. Pattern Recognit1986;19(1):41–7.
33. Tsai W-H. Moment-preserving thresolding: a new approach. ComputGraph Image Process 1985;29(3):377–93.
34. Otsu N. A threshold selection method from gray-level histograms. IEEETrans Syst Man Cybern 1979;9(1):62–6.
35. Doyle W. Operations useful for similarity-invariant pattern recognition. JACM 1962;9(2):259–67.
36. Shanbhag AG. Utilization of information measure as a means of imagethresholding. CVGIP Graph Models Image Process 1994;56(5):414–9.
37. Zack GW, Rogers WE, Latt SA. Automatic measurement of sister chro-matid exchange frequency. J Histochem Cytochem 1977;25(7):741–53.
38. Yen J-C, Chang F-J, Chang S. A new criterion for automatic multilevelthresholding. IEEE Trans Image Process 1995;4(3):370–8.
39. GitHub. HGGM-LIM/limtools; https://github.com/HGGM-LIM/limtools(accessed February 2, 2017).
40. Mateos P�erez JM. Contributions to the quantitative analysis of dynamicPET studies using clustering approaches [doctoral thesis]. Madrid, Spain:Universidad Carlos III de Madrid, 2014.
41. Forensic Science Regulator, Tully G. Forensic science regulator annualreport, November 2014 – November 2015. Birmingham, U.K.: ForensicScience Regulator, 2015.
42. Committee on Identifying the Needs of the Forensic Sciences Commu-nity, National Research Council. Strengthening forensic science in theUnited States: a path forward. Washington, DC: National Academy ofSciences, 2009.
12 JOURNAL OF FORENSIC SCIENCES