Embed Size (px)
Citation preview
Paessler’s PRTG is a tool used tomonitor IT infrastructure. Thesolution is not only suited for usein local networks, but is designedto monitor WAN connections,websites, servers, URLS, etc.The product runs on a Windowssystem and collects usage datafrom the network components –that is, applications, computersand other network devices, likerouters – without using agents.The systems that should bemonitored are found and addedto the PRTG database eitherautomatically using a networkscan, or they can be set upmanually.The monitoring tool saves allcollected data for evaluation andanalysis for one year. This timeframe can, of course, be adjustedas needed.PRTG’s web GUI is the heart ofthe product. With this interface,administrators have constantaccess to the full service range ofthe monitoring solution,independent of the client system.They can manage their system,activate new monitoringcomponents, create reports andanalyze results, warnings andalarms.
Various network protocols areused to collect data, includingjFlow, NetFlow, sFlow, SNMP,WMI, etc. PRTG also uses packetsniffing to keep an eye on trafficdata. The monitoring itself isdone using socalled ‘sensors’ –data evaluation routines thatdeliver information regardingstatuses of specific services andsystems. In total, Paessler’sPRTG includes more than 180types of sensors, which cover allnormal network services. If anaspect cannot be covered by oneof the existing sensors, theproduct offers easytouseinterfaces – called customsensors – to expand themonitoring routines.Multiple sensors can work on asingle monitored component (aserver, for example), each ofwhich has a specific task.Dependencies can be definedbetween the sensors. Forexample, a ping sensor checkswhether the device in question isavailable, while other sensors(that only run when the pingsensor gives the OK) monitorparameters like the hard drive orRAM usage, CPU load, networktraffic volume, the status of theinstalled antivirus solution, or
the status of the HTTP servicerunning on the server. In thisway, PRTG determines that theadministrator isn’t swamped witherror messages from all sensors ifa system crashes; only the pingsensor will inform him that thesystem is not available. Thisimproves clarity and significantlyreduces the reaction time neededto solve the problem.Sensors can be arranged invarious ways to increase theclarity of the overview. These canbe organized according to theassociated device or according totype, day, category or priority.
Testing: Paessler PRTG Network Monitor 13.3
A completely revised monitoringDr. Götz Güttich
Paessler has outfitted their network monitoring tool ‘PRTG Network Monitor’ witha new web GUI and an impressive selection of new functions. In our test, welooked at how the current version of the software works in operation, andat the advantages of the changes and new features in the software.
1
solution for corporate environments
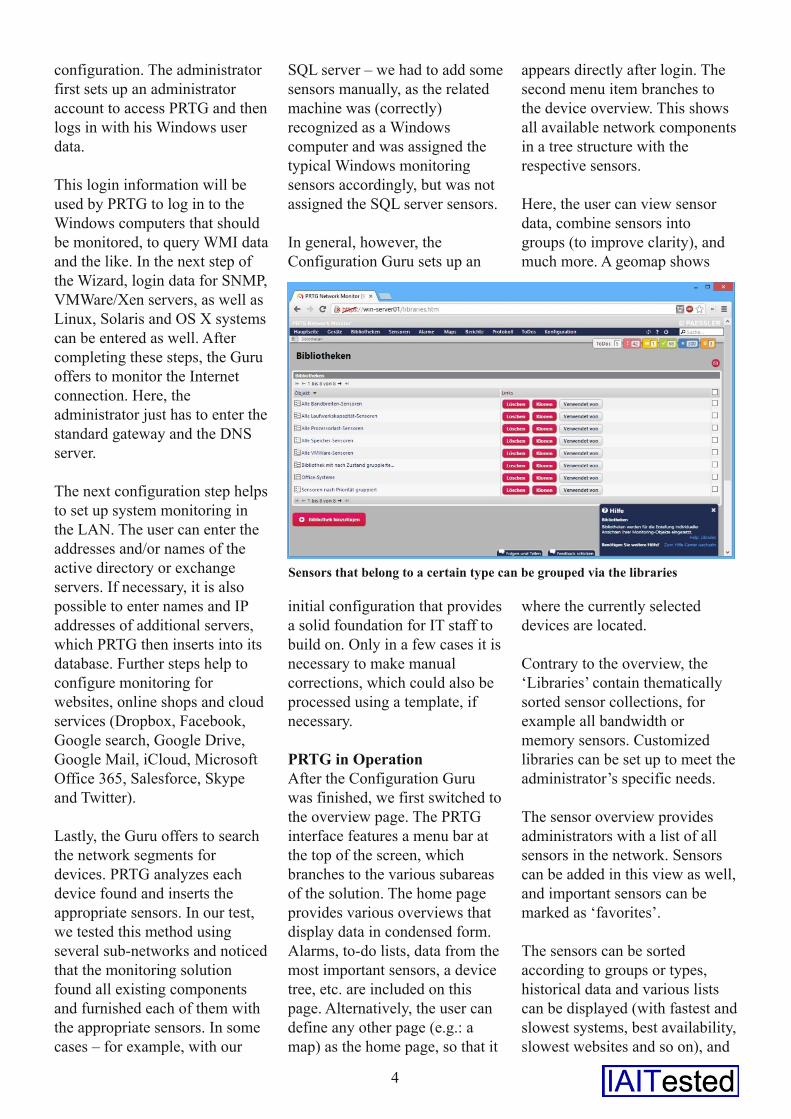
For example, all CPU sensors inthe network can be collected in alibrary, which allows staffcomfortable monitoring ofspecific problem areas.The sensors themselves containchannels, which provide detailed
information on the related sensor.For a CPU load sensor, thismight be the load of individualcores, for a network load sensor,this might be the outbound andinbound data traffic or thenumber of transferred packets.Comprehensive ‘maps’ and thereport, log and alarm functionsround out PRTG’s service range.The maps enable IT staff tocreate customized overviews oftheir network. The entire networkis displayed in a schemacontaining symbols and graphs,
which represent the individualcomponents. The maps can alsocontain background images thatdisplay, for example, where aspecific computer or printer islocated.PRTG is available in Chinese,German, English, French,
Japanese, Dutch, Spanish,Portuguese and Czech. Besidesthe web interface, a Windowsapplication – which can be usedto manage multiple PRTGinstallations – and apps – forAndroid and iOS – are alsoavailable for the product. Aspecial mobile web interface isavailable for other mobilesystems.A PRTG installation can bedistributed over multiplesystems. The data is gatheredusing ‘probes’, which can run in
diverse networks and cantherefore gather information fromremote servers as well as serverswithin the company headquarters.New FeaturesA new web interface andrevamped mobile web GUI aresome of the new features in thecurrent PRTG version. The newweb interface is a single pageapplication (SPA) and worksfaster than the previous version,loading all settings in layerpopups, so that users never losethe context of their work. Thenumber of views has beenincreased as well, and animproved overview of theindividual devices now containsan extra display for especiallyimportant sensors.The page containing theoverview of individual sensorshas been reworked. The sensordata is now portrayed in a graphwith a speedometerlike display.This not only shows the currentsensor values, but also displaysthe thresholds defined for eachentry. Even the dashboardsincluding an overview page(more on that later) and thedevice tree have been revamped.The page for comparing multiplesensor values has been expanded.Now, values from up to 32different sensors can becompared over a time period ofup to a year. This used to only bepossible with two sensors. ThePaessler Blog has been integratedin PRTG as well, and presents thenewest changes via an RSS feedon the login screen. The mobileweb GUI has been given a newlook and feel and is now easier toread.In addition to the improvementsmade in the interfaces, PRTG
2
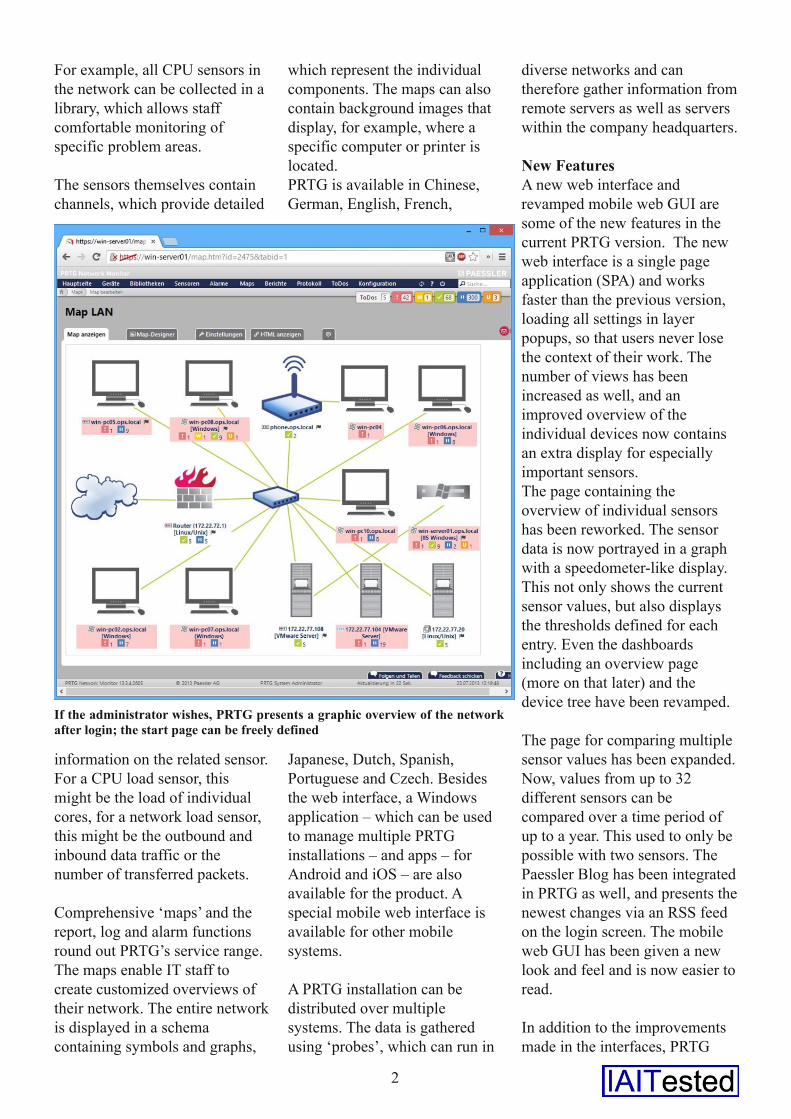
If the administrator wishes, PRTG presents a graphic overview of the networkafter login; the start page can be freely defined
now runs on a 64Bit operatingsystem as a native application.The 64bit PRTG version runs onservers with more than 6 GBRAM and eliminates the 3 GBbarrier common to 32bit
operating systems. This improvesstability and performance forlarge installations. On top of this,further functions for analyzingsimilar sensors are available.This enables the monitoringsolution to recognize similarsensor data automatically anddisplay any ‘hits’ in the sensoroverview. This feature worksindependent of the sensor typeand is based on heuristiccalculations. We’ll cover that inmore detail later. The newfeatures also include a newAndroid app.New SensorsThe current version of PRTGincludes several new sensors.
The first of these is the PassiveApplication Performance sensor.This sensor analyzes networkapplication performance usingpacket sniffing and measures thetiming between client queries and
the respective server’s responsetime.The new hybrid sensors useWindows Performance Countersto query data from the targetsystem and only use WMI as afallback. This should improveperformance and can be activatedin the device settings. Newsensors for hardware from Cisco,HP and Dell, as well as sensorsfor the Microsoft System CenterVirtual Machine Manager(MSCVMM), diverse protocols,etc. have been added as well.The TestWe installed PRTG on a 2012Windows server with a 2.8 GHz
quadcore, 4 GB RAM and 780GB hard drive capacity.According to the manufacturer,the system runs on any hardwarewith the performancecharacteristics of a regular PCfrom 2007 or later. PRTG workson operating systems with allWindows client and serverversions since Windows XP andthe manufacturers recommendGoogle Chrome, Firefox, Safarior Internet Explorer from version9 for the web browser.After installation, we executed anetwork search and added thesystems in our heterogeneous testsystem to PRTG. We then let thesolution collect data over aperiod of several weeks andintroduced the product as amonitoring tool for our network.We used the device overview, thelibraries, a variety of sensors, themaps and reports. We tested thealarm function and took a look atthe logs and ‘to do’ lists. In all ofthese areas, we paid specialattention to the new functions,giving them extra weight in thetest.InstallationInstalling PRTG is as easy asdownloading the setup file fromthe manufacturer’s website andexecuting it on the future PRTGserver. The installation runs usingan assistant and doesn’t presentany insurmountable difficulties.After completing the setup, abrowser window opensautomatically, displaying the socalled Configuration Guru. Thishelps the administrator to set upthe solution. The ConfigurationGuru presents a total of ten steps,which can be executedindividually or consecutively tocreate a functional initial
3
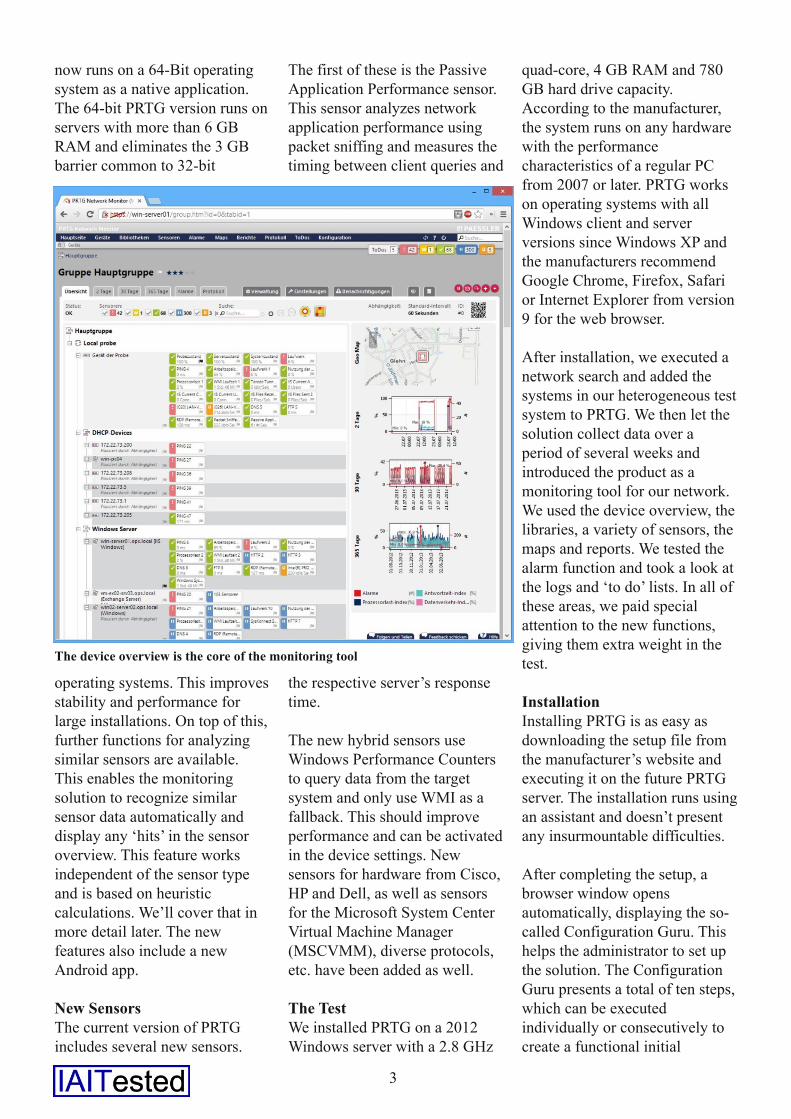
The device overview is the core of the monitoring tool
configuration. The administratorfirst sets up an administratoraccount to access PRTG and thenlogs in with his Windows userdata.This login information will beused by PRTG to log in to theWindows computers that shouldbe monitored, to query WMI dataand the like. In the next step ofthe Wizard, login data for SNMP,VMWare/Xen servers, as well asLinux, Solaris and OS X systemscan be entered as well. Aftercompleting these steps, the Guruoffers to monitor the Internetconnection. Here, theadministrator just has to enter thestandard gateway and the DNSserver.The next configuration step helpsto set up system monitoring inthe LAN. The user can enter theaddresses and/or names of theactive directory or exchangeservers. If necessary, it is alsopossible to enter names and IPaddresses of additional servers,which PRTG then inserts into itsdatabase. Further steps help toconfigure monitoring forwebsites, online shops and cloudservices (Dropbox, Facebook,Google search, Google Drive,Google Mail, iCloud, MicrosoftOffice 365, Salesforce, Skypeand Twitter).Lastly, the Guru offers to searchthe network segments fordevices. PRTG analyzes eachdevice found and inserts theappropriate sensors. In our test,we tested this method usingseveral subnetworks and noticedthat the monitoring solutionfound all existing componentsand furnished each of them withthe appropriate sensors. In somecases – for example, with our
SQL server – we had to add somesensors manually, as the relatedmachine was (correctly)recognized as a Windowscomputer and was assigned thetypical Windows monitoringsensors accordingly, but was notassigned the SQL server sensors.In general, however, theConfiguration Guru sets up an
initial configuration that providesa solid foundation for IT staff tobuild on. Only in a few cases it isnecessary to make manualcorrections, which could also beprocessed using a template, ifnecessary.PRTG in OperationAfter the Configuration Guruwas finished, we first switched tothe overview page. The PRTGinterface features a menu bar atthe top of the screen, whichbranches to the various subareasof the solution. The home pageprovides various overviews thatdisplay data in condensed form.Alarms, todo lists, data from themost important sensors, a devicetree, etc. are included on thispage. Alternatively, the user candefine any other page (e.g.: amap) as the home page, so that it
appears directly after login. Thesecond menu item branches tothe device overview. This showsall available network componentsin a tree structure with therespective sensors.Here, the user can view sensordata, combine sensors intogroups (to improve clarity), andmuch more. A geomap shows
where the currently selecteddevices are located.Contrary to the overview, the‘Libraries’ contain thematicallysorted sensor collections, forexample all bandwidth ormemory sensors. Customizedlibraries can be set up to meet theadministrator’s specific needs.The sensor overview providesadministrators with a list of allsensors in the network. Sensorscan be added in this view as well,and important sensors can bemarked as ‘favorites’.The sensors can be sortedaccording to groups or types,historical data and various listscan be displayed (with fastest andslowest systems, best availability,slowest websites and so on), and
4
Sensors that belong to a certain type can be grouped via the libraries
sensors can be compared witheach other, as mentioned above.The ‘Alarms’ menu item shows alist of all alarms that haveoccurred. Errors, warnings andunusual occurrences can beviewed here as well. The ‘Maps’,
on the other hand, present thegraphic display of the networkstructure and the ‘Reports’ enableadministrators to create or definereports. Paessler providesstandard, preconfigured reports,presenting the fastest and slowestHTTP and Ping connections, anavailability report and the like.Over the ‘Log’, the users seemessages from PRTG. These canbe filtered according to groupsand status events or changes. The‘ToDos’ contain systemmessages that must be confirmedby the administrators. Theseinclude todo lists, reports,automatic network searches and
errors. For instance, PRTG usesthis method to notify theadministrator that a new sensorwas created during an automaticnetwork search.Lastly, the ‘Configuration’encompasses all options
necessary for managing PRTGitself, such as software updates,schedules and a status page. Thelicense management and the‘Chrome Desktop Notifications’are found here as well, overwhich messages can be displayedon the user’s desktop (providedthere is an active connection) viathe Chrome browser. Thisfunctioned smoothly during ourtest.New Web Interface FeaturesAs previously mentioned, wepaid special attention to the newfunctions in PRTG for this test.In light of that, the updated web
interface was the most importantportion of the test. The webinterface is now a single pageapplication (SPA), which is thenewest generation of AJAXtechnology.When calling up new content onan SPA, the browser doesn’treload the entire page; only therequired section is loaded. Thisreduces unnecessary computingtime and accelerates workingwith the system. Because of theintroduction of SPA, PRTG nowdisplays all dialog fields forobject settings as popup layers.That way, users no longer losethe focus of their work whenperforming actions like changingtags or adding notificationtriggers. Instead, after performingone of these tasks, they areimmediately returned to theposition they started in.Paessler has also reworked theinterface so that moreinformation can be displayed in asmaller space. The majority ofthe changes are found in thesensor data display. Numbers andcurrent sensor values are nolonger presented in text form.Instead, graphical displays of thecurrent live data are shown in thepreviously mentionedspeedometer gauge. This makesit easier to differentiate betweenand manage the channelsbelonging to the sensors. The topof the sensor window nowfeatures a colored bar, whichshows the status of the sensor at aglance (green, yellow, red, etc.).The Netflow, sFlow, jFlow andpacket sniffing sensors now havetop lists. These provideinformation on the top ‘talkers’ inthe network, the top connectionsand top logs. The data collected
5
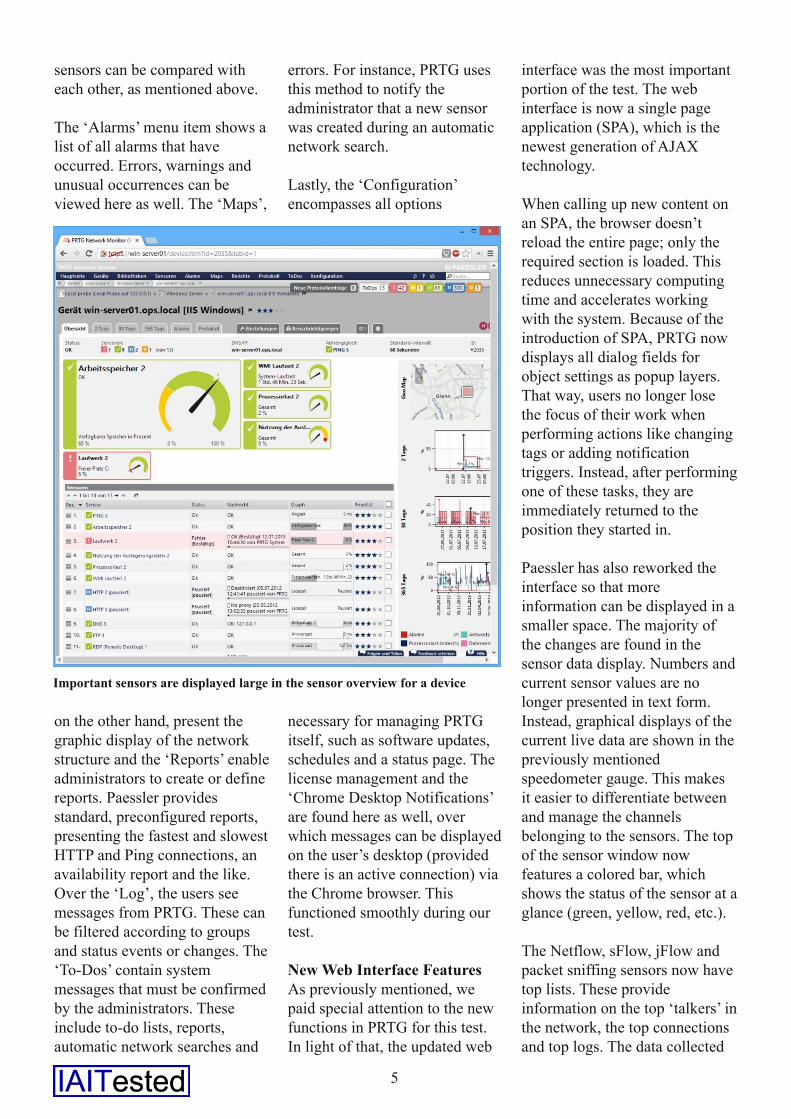
Important sensors are displayed large in the sensor overview for a device
by these sensors are – just likethe values of the other sensors –shown in a graphical display onthe sensors overview page. Theuser can create customized toplists as well, based on IP
addresses, ports, MAC addresses,logs, etc. The device overviewsshow the sensors belonging to adevice in various sizes. The mostimportant sensors are shownlarger than the others. Toimprove clarity, the colors of thegraphs have been modified aswell. The values displayed arenow easier to identify.Similar SensorsThe new heuristic sensorcomparison examines all sensordata collected over the last 30days and compares each sensorincluded in the system with everyother sensor. This makes it easy
to find correlations that aren’tobvious at first glance. Similarsensors and their channels appearon an overview page in thesensor menu and on the affectedsensor’s page as well, so that the
corresponding informationcatches the user’s eye. Forinstance, this information mayindicate that a high volume ofdata transfers always occurs on aswitch at the same time that aserver in another departmentdisplays a high processor load.These things aren’t noticeable indaily operations, but maycontribute important informationwhen solving network problems.The similar sensor tool also givesIT staff the chance to removeredundant monitoring measuresfrom their PRTG configuration inthe enterprise.
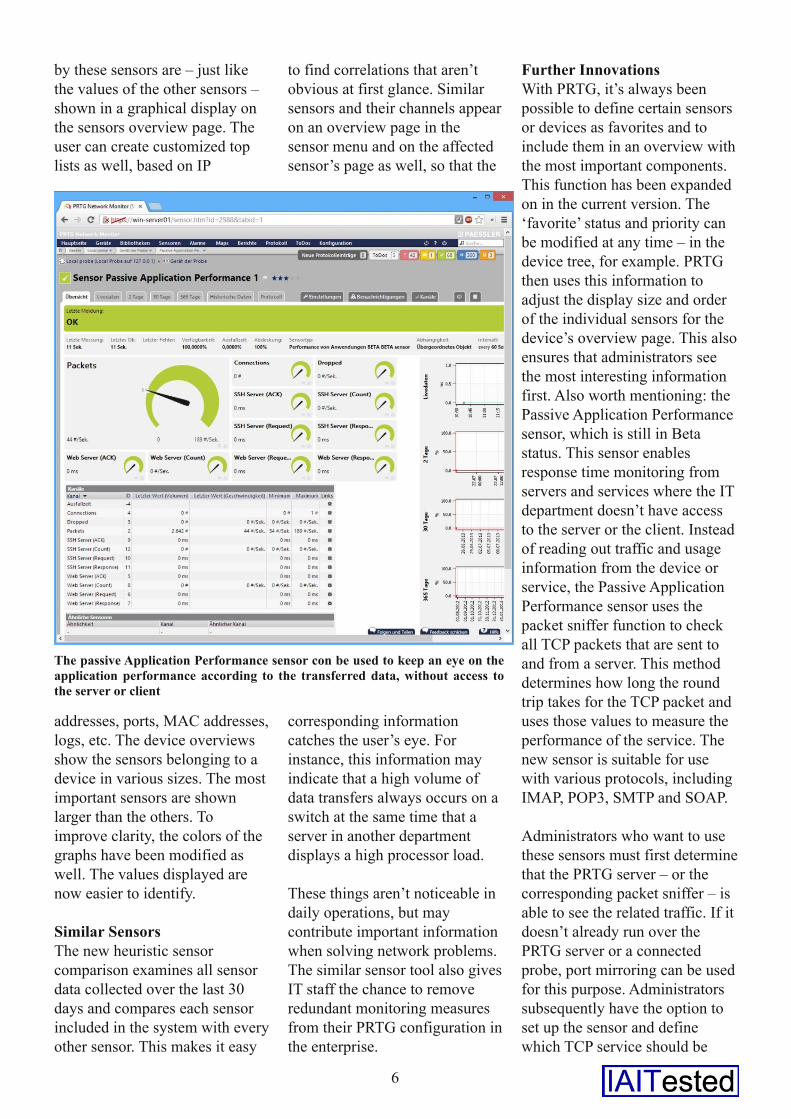
Further InnovationsWith PRTG, it’s always beenpossible to define certain sensorsor devices as favorites and toinclude them in an overview withthe most important components.This function has been expandedon in the current version. The‘favorite’ status and priority canbe modified at any time – in thedevice tree, for example. PRTGthen uses this information toadjust the display size and orderof the individual sensors for thedevice’s overview page. This alsoensures that administrators seethe most interesting informationfirst. Also worth mentioning: thePassive Application Performancesensor, which is still in Betastatus. This sensor enablesresponse time monitoring fromservers and services where the ITdepartment doesn’t have accessto the server or the client. Insteadof reading out traffic and usageinformation from the device orservice, the Passive ApplicationPerformance sensor uses thepacket sniffer function to checkall TCP packets that are sent toand from a server. This methoddetermines how long the roundtrip takes for the TCP packet anduses those values to measure theperformance of the service. Thenew sensor is suitable for usewith various protocols, includingIMAP, POP3, SMTP and SOAP.Administrators who want to usethese sensors must first determinethat the PRTG server – or thecorresponding packet sniffer – isable to see the related traffic. If itdoesn’t already run over thePRTG server or a connectedprobe, port mirroring can be usedfor this purpose. Administratorssubsequently have the option toset up the sensor and definewhich TCP service should be
6
The passive Application Performance sensor con be used to keep an eye on theapplication performance according to the transferred data, without access tothe server or client
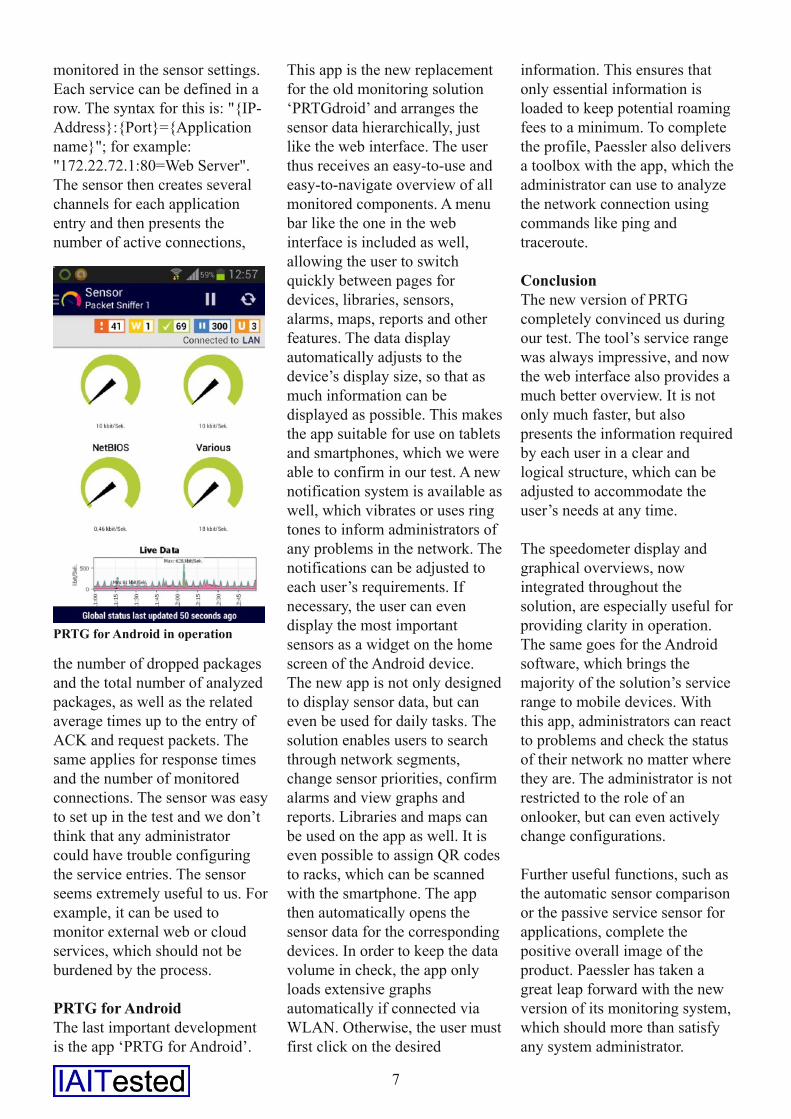
monitored in the sensor settings.Each service can be defined in arow. The syntax for this is: "IPAddress:Port=Applicationname"; for example:"172.22.72.1:80=Web Server".The sensor then creates severalchannels for each applicationentry and then presents thenumber of active connections,
the number of dropped packagesand the total number of analyzedpackages, as well as the relatedaverage times up to the entry ofACK and request packets. Thesame applies for response timesand the number of monitoredconnections. The sensor was easyto set up in the test and we don’tthink that any administratorcould have trouble configuringthe service entries. The sensorseems extremely useful to us. Forexample, it can be used tomonitor external web or cloudservices, which should not beburdened by the process.PRTG for AndroidThe last important developmentis the app ‘PRTG for Android’.
This app is the new replacementfor the old monitoring solution‘PRTGdroid’ and arranges thesensor data hierarchically, justlike the web interface. The userthus receives an easytouse andeasytonavigate overview of allmonitored components. A menubar like the one in the webinterface is included as well,allowing the user to switchquickly between pages fordevices, libraries, sensors,alarms, maps, reports and otherfeatures. The data displayautomatically adjusts to thedevice’s display size, so that asmuch information can bedisplayed as possible. This makesthe app suitable for use on tabletsand smartphones, which we wereable to confirm in our test. A newnotification system is available aswell, which vibrates or uses ringtones to inform administrators ofany problems in the network. Thenotifications can be adjusted toeach user’s requirements. Ifnecessary, the user can evendisplay the most importantsensors as a widget on the homescreen of the Android device.The new app is not only designedto display sensor data, but caneven be used for daily tasks. Thesolution enables users to searchthrough network segments,change sensor priorities, confirmalarms and view graphs andreports. Libraries and maps canbe used on the app as well. It iseven possible to assign QR codesto racks, which can be scannedwith the smartphone. The appthen automatically opens thesensor data for the correspondingdevices. In order to keep the datavolume in check, the app onlyloads extensive graphsautomatically if connected viaWLAN. Otherwise, the user mustfirst click on the desired
information. This ensures thatonly essential information isloaded to keep potential roamingfees to a minimum. To completethe profile, Paessler also deliversa toolbox with the app, which theadministrator can use to analyzethe network connection usingcommands like ping andtraceroute.ConclusionThe new version of PRTGcompletely convinced us duringour test. The tool’s service rangewas always impressive, and nowthe web interface also provides amuch better overview. It is notonly much faster, but alsopresents the information requiredby each user in a clear andlogical structure, which can beadjusted to accommodate theuser’s needs at any time.The speedometer display andgraphical overviews, nowintegrated throughout thesolution, are especially useful forproviding clarity in operation.The same goes for the Androidsoftware, which brings themajority of the solution’s servicerange to mobile devices. Withthis app, administrators can reactto problems and check the statusof their network no matter wherethey are. The administrator is notrestricted to the role of anonlooker, but can even activelychange configurations.Further useful functions, such asthe automatic sensor comparisonor the passive service sensor forapplications, complete thepositive overall image of theproduct. Paessler has taken agreat leap forward with the newversion of its monitoring system,which should more than satisfyany system administrator.
PRTG for Android in operation
7