Embed Size (px)
Citation preview

A COMPLEXITY INSPIRED APPROACH TO
CO-EVOLUTIONARY
HOSPITAL MANAGEMENT INFORMATION SYSTEMS
DEVELOPMENT
Case studies from the “South”
By
Vincent Shaw
Submitted as partial fulfillment of the
requirements for degree of
Philosophiae Doctor (Ph.D.)
at the Faculty of Mathematics and Natural Sciences
University of Oslo
Norway
21 September 2009

ii
© Vincent Shaw, 2009 Series of dissertations submitted to the Faculty of Mathematics and Natural Sciences, University of Oslo No. 905 ISSN 1501-7710 All rights reserved. No part of this publication may be reproduced or transmitted, in any form or by any means, without permission. Cover: Inger Sandved Anfinsen. Printed in Norway: AiT e-dit AS, Oslo, 2009. Produced in co-operation with Unipub AS. The thesis is produced by Unipub AS merely in connection with the thesis defence. Kindly direct all inquiries regarding the thesis to the copyright holder or the unit which grants the doctorate. Unipub AS is owned by The University Foundation for Student Life (SiO)

iii
Dedicated to
My father,
who always wanted to do this, but was never afforded the luxury of time.

iv

v
TABLE OF CONTENTS
Table of Contents ............................................................................................................................... v List of tables: ..................................................................................................................................... ix List of Figures: .................................................................................................................................... x Abbreviations and Acronyms: .......................................................................................................... xi Acknowledgements: ........................................................................................................................ xiii Abstract ............................................................................................................................................. xv Preface: ............................................................................................................................................ xix
Chapter 1. Introduction: .............................................................................................................. 1 1.1. Background: ........................................................................................................................ 1 1.2. Thesis aims and research questions: ................................................................................... 2
1.2.1. The Challenge in Designing Hospital Management Information Systems: ....................... 5 1.2.2. The Challenge of the Implementation Process ................................................................ 8
1.3. Research Motivation ............................................................................................................ 9 1.4. Theoretical Perspective ..................................................................................................... 10 1.5. Research setting and approach: ........................................................................................ 13 1.6. Positioning the research: ................................................................................................... 15 1.7. Expected contributions ...................................................................................................... 15 1.8. Structure of thesis .............................................................................................................. 16
Chapter 2. Theory and Related Research: ............................................................................... 19 2.1. Introduction: ....................................................................................................................... 19 2.2. An Overview of Complexity Theory: ................................................................................... 20
2.2.1. Defining Complexity Theory and related fields of study: ................................................ 20 2.2.2. A Brief History of Complexity Theory: ............................................................................ 23
2.3. Key Features of Complex Adaptive Systems: .................................................................... 25 2.3.1. The components of a CAS - Agents with schemata adapting to the environment: ......... 25 2.3.2. Non-linearity resulting in unpredictable long-term outcomes: ........................................ 26 2.3.3. Self-organising groups and networks displaying emergent behaviour: .......................... 27 2.3.4. Co-evolution at the edge of chaos: ................................................................................ 29 2.3.5. Summary: ...................................................................................................................... 31
2.4. The Elements of a Co-evolutionary Framework: ................................................................ 31 2.4.1. Introduction: ................................................................................................................... 32 2.4.2. Application of non-linearity to organisation science and information systems: ............... 33 2.4.3. Application of autogenesis to organisation science and information systems: ............... 35 2.4.4. Application of co-evolution to organisation science and information systems: ............... 37
2.5. Summary of Theoretical Perspective: A Co-evolutionary Framework ................................ 49 2.5.1. Applying the Co-evolutionary Framework to Hospital Information Systems Design, Development and Implementation:.............................................................................................. 49 2.5.2. Aspects of HospMIS Design, Development and Implementation that this thesis seeks to address: ...................................................................................................................................... 52
Chapter 3. Research Methods and Case Overview ................................................................. 55 3.1. Introduction: ....................................................................................................................... 55 3.2. Research approach: .......................................................................................................... 55
3.2.1. Ontological and Epistemological Basis for the Study ..................................................... 56 3.2.2. Action research approach: ............................................................................................. 57 3.2.3. Qualitative case study method: ...................................................................................... 59 3.2.4. Interpretive research approach: ..................................................................................... 60
3.3. Research setting: ............................................................................................................... 64 3.3.1. Fieldwork ....................................................................................................................... 64

vi
3.3.2. The Research Context 1: Eastern Cape Province: ........................................................ 67 3.3.3. The Research Context 2: Northern Nigeria: ................................................................... 72 3.3.4. The Research Context 3: Malawi Central Hospitals and Zambia: .................................. 76 3.3.5. The Research Context 4: HISP-SA:............................................................................... 78 3.3.6. My role as researcher .................................................................................................... 79 3.3.7. Data collection methods ................................................................................................ 81 3.3.8. Data analysis and the use of theory:.............................................................................. 83 3.3.9. Validity of data ............................................................................................................... 85
Chapter 4. Research Findings: ................................................................................................. 87 4.1. Introduction: ....................................................................................................................... 87 4.2. Summary of individual research papers: ............................................................................ 89
4.2.1. Paper 1: The Development of an Information System for District Hospitals. .................. 89 4.2.2. Paper 2: Health information system reform in South Africa: developing an essential data set. ...................................................................................................................................... 90 4.2.3. Paper 3: Standardization of Health Information Systems in South Africa: The Challenge of Local Sustainability. ................................................................................................................ 91 4.2.4. Paper 4: Developing Health Information Systems in Developing Countries - the flexible standards strategy: ..................................................................................................................... 93 4.2.5. Paper 5: Considering the Options for Hospital Management Information Systems. ....... 96 4.2.6. Paper 6: Scaling of health information systems in Nigeria and Ethiopia - Considering the options. ...................................................................................................................................... 98 4.2.7. Paper 7: “Developed in the South” – an evolutionary and prototyping approach to developing scalable and sustainable health information systems. ............................................ 101
4.3. A comparison across papers: .......................................................................................... 103 4.4. A synthesis of the findings: .............................................................................................. 107
4.4.1. The complexities of the context: .................................................................................. 107 4.4.2. Flexible Standards as central features in the design of hospital information systems .. 109 4.4.3. Five core implementation strategies for hospital information systems ......................... 112
4.5. Concluding remarks: ........................................................................................................ 114 4.5.1. Evolution of insights into HospMIS design, development and implementation: ............ 114 4.5.2. Balancing micro- and macro- level analyses:............................................................... 114 4.5.3. The co-evolutionary framework for managing the complexity of HospMIS development in resource constrained settings: .................................................................................................. 115 4.5.4. Critique of the co-evolutionary framework: .................................................................. 116
Chapter 5. Theoretical and Practical Contributions: ............................................................ 117 5.1. Introduction: ..................................................................................................................... 117 5.2. Understanding the Context 1: As Extreme Heterogeneity: ............................................... 118
5.2.1. Extreme heterogeneity manifested in hospitals: .......................................................... 118 5.2.2. Extreme heterogeneity creating nested effects: ........................................................... 120 5.2.3. Practical implications 1: Managing heterogeneity in resource constrained settings: .... 121 5.2.4. Summary – Expanding the Co-evolutionary approach: ................................................ 123
5.3. Understanding the Context 2: As Non-linear Effects ........................................................ 124 5.3.1. Conceptualizing Non-linearity: ..................................................................................... 124 5.3.2. Practical Implications 2: Managing Non-linearity: ........................................................ 126
5.4. Understanding the Context 3: Self-organising networks displaying emergent behaviour . 127 5.4.1. Self-organising groups in support of co-evolutionary HospMIS development: ............. 127 5.4.2. Self-organising groups pushing for change: ................................................................ 128 5.4.3. Practical Implications 3: Managing self-organizing groups: ......................................... 129 5.4.4. Conclusions: ................................................................................................................ 129
5.5. Sustainable IS Development: The Co-evolutionary Model: .............................................. 130 5.5.1. The challenge of sustainability ..................................................................................... 131 5.5.2. Sustainability and organizational absorptive capacity: ................................................. 133 5.5.3. Organizational learning as a co-evolutionary process: ................................................. 135 5.5.4. The co-evolutionary information systems development model: ................................... 137

vii
5.5.5. Practical Implications 4: Effecting co-evolutionary health information systems development: ............................................................................................................................ 141 5.5.6. Conclusion: .................................................................................................................. 142
5.6. Co-evolutionary Scaling of HIS: ....................................................................................... 143 5.6.1. The challenge of scaling: ............................................................................................. 143 5.6.2. Conceptualizing scaling as a complex adaptive system: ............................................. 144 5.6.3. Defining scaling along four dimensions: ...................................................................... 145 5.6.4. Effecting scaling using the co-evolutionary ISD model: ............................................... 146 5.6.5. Practical implications 5: Scaling as an escalation of complexity: ................................. 147 5.6.6. Practical implications 6: Scaling in Hospitals ............................................................... 148
5.7. Summary of Theoretical Contributions ............................................................................. 150 5.7.1. Research aim and objectives ....................................................................................... 150 5.7.2. Main theoretical contributions ...................................................................................... 151
5.8. Synthesis of practical contributions: ................................................................................. 154 5.9. Future research: .............................................................................................................. 156
Chapter 6. Conclusions ........................................................................................................... 159
References ...................................................................................................................................... 163 Appendices

viii
ix
LIST OF TABLES:
Table 1: Overview of Special Issues in Journals Featuring Aspects of Complexity Theory ................. 24 Table 2: Characteristics of Non-Linear Systems Applied to HIS ......................................................... 34 Table 3: Properties of Co-evolutionary Processes .............................................................................. 39 Table 4: Comparison of Perspectives on Organizational Change as a Result of Interaction with Technology ......................................................................................................................................... 40 Table 5: Principles of Co-evolutionary Adaptation of HospMIS ........................................................... 42 Table 6: Absorptive Capacity of a Typical Public Sector Hospital in a Resource Constrained Setting 48 Table 7: Application of Theoretical Framework to a Failed Hospital Implementation System in a Resource Constrained Setting ............................................................................................................ 51 Table 8: The Application of Action Research Characteristics to this Thesis ........................................ 58 Table 9: Application of Principles for Interpretive Field Research to this Thesis ................................. 60 Table 10: Distribution of time across project activities ......................................................................... 64 Table 11: Comparison of Key Indicators ............................................................................................. 69 Table 12: Access to Critical Resources for HIS Strengthening in Jigawa ............................................ 74 Table 13: Linking Papers to Research Objectives .............................................................................. 88 Table 14: Comparison across research papers ................................................................................ 104 Table 15: Changes in heterogeneities interacting with one another as nested effects ...................... 121 Table 16: Comparative Assessment of Absorptive Capacity between Public Sector and NGO Organizations ................................................................................................................................... 134 Table 17: Addressing the Research Objectives through this Thesis ................................................. 151 Table 18: Contribution of Rich insight ............................................................................................... 152 Table 19: Development of Concepts ................................................................................................. 152 Table 20: Generation of specific implications .................................................................................... 153 Table 21: Generation of Theory ........................................................................................................ 154 Table 22: Identified Research Priorities Addressed by this thesis ..................................................... 160

x
LIST OF FIGURES:
Figure 1: Information systems contributing to a HospMIS ..................................................................... 6 Figure 2: The origins of complexity science from a diverse range of fields (Source (Wikipedia 2009)) 21 Figure 3: The Zone of Complexity or Edge of Chaos .......................................................................... 30 Figure 4: Perrow's Framework of Complexity ( in Tan, Wen, et al (2005)) .......................................... 43 Figure 5: Contextualism as the Ontological Basis (adapted from (Pettigrew 1985) ............................. 56 Figure 6: Timeline of Research Activities and Publications ................................................................. 65 Figure 7: Restructuring Local Government in the ECP ....................................................................... 68 Figure 8: Organizational Structure of the District Health System in the ECP. ..................................... 70 Figure 9: Jigawa State, Nigeria ........................................................................................................... 73 Figure 10: The register in use at a dispensary .................................................................................... 75 Figure 11: Jigawa Reporting Rates for 2007 (source DHIS data as at Feb 2008) ............................... 76 Figure 12: Conceptualizing Action Research as Three Inter-Linked Practices .................................... 80 Figure 13: Page from my research diary ............................................................................................. 82 Figure 14: DHIS Dayta compared to NICS Survey.............................................................................. 85 Figure 15: Crafting Gateways to Link Heterogeneous Components ................................................... 97 Figure 16: Considering the Spheres of ISD when effecting Geographic Scaling ................................. 99 Figure 17: Using blank spaces to incorporate flexibility in register design ......................................... 110 Figure 18: Organizational Learning Framework as a Co-evolutionary Process ................................. 136 Figure 19: The Co-evolutionary Model for Hospital Management Information Systems Development ......................................................................................................................................................... 139 Figure 20: The Dimensions of Scaling Health Information Systems .................................................. 146

xi
ABBREVIATIONS AND ACRONYMS:
Abbreviation Decsription
CAS Complex Adaptive System DHIS District Health Information Software DoH Department of Health ECDoH Eastern Cape Department of Health ECP Eastern Cape Province EDS Essential data set EMR Electronic medical record EPR Electronic patient record FOSS Free and Open Source Software HIP Health Information Practitioner HIS Health information system/s HISD Health information systems design, development and implementation HISP Health Information Systems Program HISP-International The international network generally referred to as HISP HISP-SA Health Information Systems Program South Africa HIV/AIDS Human Immunodeficiency Virus/Acquired Immuno Deficiency Syndrome HMIS Health Management Information System (a term used mainly in Nigeria,
Zambia and Malawi for the national health information system) HospMIS Hospital management information system HospMISD Hospital management information systems design, development and
implementation ICT’s Information and communication technologies IFI Institute for Informatik IS Information system/s ISD Information systems development JBER practice Joint business change practice/empirical research practice (used in
Methods chapter) MDG’s Millenium Development Goals MoH Ministry of Health NDoH National Department of Health (usually refers to the South African NDoH) NGO Non-governmental organization PAH Provincially Aided Hospitals PCIS Patient care information system PHC Primary health care SA South Africa SWAp Sector Wide Approach

xii

xiii
ACKNOWLEDGEMENTS:
Someone once said to me that undertaking a PhD is a lonely and tough journey. While
undoubtedly it has demanded persistence and steadfastness, it has been anything but a
lonely journey. Rather I can say that it has been an extremely stimulating exercise during
which I have not only learnt about health and hospital management information systems, but
also a great deal about myself, and about the different people with whom I have interacted
along the way.
Firstly, I would like to express my gratitude to my two supervisors, who have always been
available to provide support and insight, even at short notice. Professor Jorn Braa has
shared freely his experience and practical insights into health information systems
development in resource constrained settings. These are the settings where he thrives, and
is able to identify practical solutions based on solid theoretical approaches. Jorn and his wife
Uni have made a special point of exposing me and my family to the Norwegian culture, and
have taken me to many special places in Norway, for which I am most grateful. I would like
also to thank Professor Sundeep Sahay for his quiet and caring support, and for his
assistance in helping to shape this thesis. I have also appreciated the many discussions we
have had around the health information systems development in Africa and India, comparing
the similarities and differences, and mechanisms to work across the continents to strengthen
information systems development efforts.
In Norway I have made many special friends. Special amongst these are Edoardo Jacucci
and Miria Grisot, who have always opened their home to me, even when it was less than
convenient. They have provided me with a “home away from home”, and cared after my
special needs. Many thanks to you for this Edo and Miria. A special mention also goes to
Edoardo with whom I spent many hours walking the beaches of the Eastern Cape Province,
discussing our experiences in the hospitals, thrashing out theories drawn in the sand, and
debating approaches while we prepared meals in the kitchen. Thank you too Miria for the
many useful discussions we have had, and your insights into the finer aspects of theory and
information systems research. Special too have been Jo Herstad and his wife Gro. Thank
you Jo for the runs through the snow and ice over lunch times, during which we shared our
experiences and discussed progress, and for the weekends in the cabin and the boat. Other
people who have gone out of their way to help me include Sisse Finken, Margunn Aanestad,
Shegaw Mengiste and his wife Sofia, Petter Nielsen and Kristin Braa.

xiv
A special mention goes to the South African HISP team, in particular Calle Hedberg and
Norah Stoops. Thank you for supporting me in this process, recognizing that it would place a
bigger load on your already heavy shoulders, and for taking on increased shares of the
management of HISP. The HISP team as a whole also needs to be thanked for their support
and care, and tolerance of my neglect of their needs especially in the last few months. I really
enjoy working with you all – thank you for the fun and sharing that has taken place, for the
ideas and arguments, and the different ways of working which have contributed to the ideas
in this thesis.
Through the years I have also gained hugely from my association with our HISP colleagues
in other countries. In Nigeria, special thanks for your hospitality and free sharing of ideas and
concerns go to Aluka Terpasse, Bill Agir, Jerome Shaguy, Lawrence Kwagga, and Ime
Asanganzi, and Dr’s Akin Oyemakinde and Bola Njoku. In Zambia a special word of thanks
to Simon Muyambo who has become a special friend, and Dr Chris Simoonga in the Ministry
of Health. Acknowledgement of the role played by colleagues, many of whom are associated
with our sister organization Health Partners International especially Rodion Kraus, Andrew
McKenzie and Brian Haddon. Its been a great partnership with you guys and your team
through the work in Nigeria and Zambia in particular, but also in the heady days of health
system restructuring in the Eastern Cape Province.
Then, mention is also needed of the HISP colleagues scattered around the world. Here I
think of Arthur Heywood, John Lewis, Jyostna Sahay, Ola Titlestad, Knut Starring, Johan
Saebo, Juma Lungo, Faraja Igira and Negussie Mengesha. My colleagues with whom I
shared a den, Honest Kimaro, Shegaw Megiste, Elies Ostmo, and Marissa D’Mello.
I extend my gratitude to Michele Nysæter from the International Students Office, and to the
staff in the Administrative Offices at IFI, especially Anne Cathrine Modahl and Lena Korsnes
for their patience and support through the years.
Last, but not least, a word for my family. My sons, Carey, Garth, and Neil, and their partners,
who have patiently accepted me taking time from them in order to pursue these studies -
maybe now I will come and be a nuisance in your homes for a change. And then to my wife
Stephanie, who from the beginning has only known me as “ABD”, but who has been ever
patient and supportive and caring in her encouragement of me. Thank you best WWW.
xv
ABSTRACT
This thesis develops conceptual models based on complexity science to understand the
design, development and implementation of sustainable and scalable hospital management
information systems in resource constrained settings. More specifically, drawing on empirical
data from the design and implementation of hospital management information systems in
South Africa, Malawi, Zambia, and Nigeria, it uses an interpretive methodology to understand
the nature of complexity in hospitals, and the implications of this complexity on the socio-
technological aspects of hospital management information system design and development,
and implementation. Hospital information systems are notorious for their failed installations,
complexity, and inability to deliver on promised functionalities in both well resourced and
resource constrained settings. The thesis contributes to the discourse on information
systems in developing countries research, and in particular to the social embeddedness
discourse. As such the research seeks to characterize local problems, and develop locally
appropriate solutions that involve technological and organizational change.
In this thesis, a hospital management information system is defined as an information system
that collates and integrates data from different sources (for example wards, out-patient
departments, pharmacy, accounting departments) so that reports can be produced for
clinicians, managers and administrators to enable them to manage the hospital, the services
it provides, and to allocate resources appropriately. The empirical focus is on hospitals in
resource constrained settings for three main reasons. Firstly, huge gains in efficiency and
equitable resource allocation can be made from the effective use of management information
Secondly, hospital information systems are notoriously difficult to design, develop and
implement and therefore it is important to explore approaches that overcome the challenges.
Thirdly, in resource constrained settings, hospitals are particularly vulnerable to unsuccessful
implementations because they face the challenge of increased complexity of interactions
between the political, financial, and infrastructural conditions in addition to the everyday
efforts of dealing with very high disease burdens, such as those related to HIV/AIDS.
The two primary research questions that guide the research are:
• Given the complex nature of the hospital environment, what are the socio-technical
considerations that contribute to the design of sustainable and scalable hospital
management information systems in resource constrained settings?

xvi
• How can the implementation process be designed to accommodate unexpected
contradictions that arise between the different realities of original intent and changing
needs in the implementation process?
A complexity science inspired theoretical framework is developed to analyze the empirical
data. Complexity science has been used to understand the processes of change in
organizations since the 1990’s, and since the 2000’s is increasingly being used also to guide
information systems implementation. Information systems development and implementation
are particularly appropriate to analyze using concepts from complexity science as they are
increasingly shaped by complex conditions such as the rapidly increasing rates of technical,
organizational and societal changes and their interconnectedness. Contributing to these
dynamics is the faster and different rates and modes of communication, which require
organizations to be more responsive. While complexity science concepts have not been
explicitly applied in the context of hospitals, they arguably provide a rich arena for such
analysis. Hospitals are comprised of a rich mixture of different types of health care providers
and managers, interacting with each other in complex ways in order to provide a multiplicity
of patient care. But they are also part of a larger organizational framework of other health
services provided locally, nationally, and globally. Three main features of complex adaptive
systems (CAS) are explored, namely non-linearity, self-organizing groups, and co-evolution.
These concepts are utilized to develop a co-evolutionary framework which represents an
analytical process for studying and also supporting the design, and ongoing development
and implementation of HospMIS.
The research reported in this thesis is based on a longitudinal case study analysis conducted
within the ongoing, large-scale, multi-country Health Information Systems Program (HISP)
research project. The research described in this thesis falls within the interpretive research
tradition described by Walsham (1993; 1995).
This thesis provides rich insight into the context in which hospital management information
systems design, development and implementation takes place in resource constrained
settings. The complexity of the context is described as “extreme” heterogeneity because not
only is the environment heterogeneous, but the heterogeneity spans a wide range of
possibilities, is rapid and ongoing and results in compounded effects, imbalances and non-
linearity.
The contributions can be briefly summarized as follows. The socio-technical design of
hospital management information systems needs to incorporate flexibility into all components

xvii
of the system, from the paper based data collection tools to the software. Modularization is
used to achieve this. The flexibility in the technical design of the system is mirrored by
flexibility built into the implementation process. A co-ordinating rhythm is described which
supports the establishment of self-organizing groups and networks to gather ideas from a
diverse range of stakeholders, in a framework of decentralized control. These groups should
transect traditional organizational hierarchies and functional groupings. The public sector in
resource constrained settings is characterized by skills shortages and a tendency to neglect
exploratory drives required to take advantage of new developments in the ICT sector. To
counter these shortcomings, a solution is to posit the public sector organization (such as a
hospital) and a non-governmental organization (such as HISP-SA) as synergistic partners in
support of hospital management information systems design, development and
implementation. This is potentially a useful partnership because the organizations have
complimentary exploitative/explorative drives, and organizational links with different domains
of influence. An important outcome of this arrangement is the development of capacity within
the public sector through health information practitioners.
A number of possibilities for future research are suggested by this study.

xviii

xix
PREFACE:
This thesis is submitted as a partial fulfillment of the requirements for the degree of
Philosophiae Doctor (Ph.D.) at the Faculty of Mathematics and Natural Sciences, University
of Oslo, Norway. The research topic relates to the design, development and implementation
of hospital management information systems in resource constrained settings. The research
has been conducted under the aegis of the Globally Scalable Information Infrastructures
Group at the Department of Informatics.
The thesis consists of an introductory essay and seven research papers. The introductory
essay presents the problem area and research question in Chapter 1. I then discuss the
relevant literature in Chapter 2, and present the context of the cases studies along with the
methodological approach in Chapter 3. In Chapter 4 the findings of the research are
presented followed by my theoretical and practical contributions in Chapter 5. Chapter 6
presents my concluding remarks. The seven papers listed below are included as appendices.
The papers from which the contributions are drawn are as follows (arranged according to
year of publication):
1. Shaw, V. (2003). The Development of an Information System for District Hospitals. In
S. Krishna & S. Madon (Eds.), The Digital Challenge: Information Technology in the
Development Context: Ashgate.
2. Shaw, V. (2005). Health information system reform in South Africa: developing an
essential data set. Bulletin of the World Health Organization, 2005(83), 632 - 639.
3. Jacucci, E., Shaw, V., & Braa, J. (2006). Standardization of Health Information
Systems in South Africa: The Challenge of Local Sustainability. Information
Technology for Development, 12( 3), 225-239.
4. Braa, J., O. Hanseth, et al. (2007). "Developing Health Information Systems in
Developing Countries - the flexible standards strategy." MIS Quarterly 31(2): 381-402.
5. Shaw, V. (2007, 9 - 12 January 2007). Considering the Options for Hospital
Management Information Systems. Paper presented at the Helena 12th E-Health
Conference, 2007, Bamako, Mali.
6. Shaw, V., Mengiste, S., & Braa, J. (2007). Scaling of health information systems in
Nigeria and Ethiopia - Considering the options. Paper presented at the IFIP 9.4, Sao
Paulo, Brazil.

xx
7. Shaw, V. and J. Braa (Forthcoming). "Developed in the South" - an evolutionary and
prototyping approach to developing scalable and sustainable health information
systems. Development Informatics and Regional Information Technologies: Theory,
Practice and the Digital Divide. J. Steyn, IGI Global. Vol 3: ICT's for Development in
Africa: Theory, Practice and the Digital Divide.
1
Chapter 1. INTRODUCTION:
1.1. Background:
As a result of globalization, and complex interactions between political, technical, economic
and cultural forces, there is an increasing rate and scale of changes taking place globally
with significant implications on local processes. These effects have elicited comments that
“many of us feel in the grip of forces over which we have no control” (Giddens 1999, p. 6).
However, organizational theorists are suggesting that by changing the way in which we view
the world and our institutions, we can try to manage our “runaway world” (Anderson 1999;
Lewin, Long et al. 1999). The shift in thinking on how organizations and society are viewed,
from an ordered reductionist view to one which acknowledges the all pervasive complexity of
life and existence (Urry 2005a; Urry 2005b) has strengthened since the 1990’s. Complexity
science provides an understanding to the balance that exists between order and disorder,
especially within social phenomena, and how being at “the edge of chaos” can potentially
also stimulate creativity and innovation (Eoyang 1996).
While concepts from complexity science concepts have not been explicitly applied in the
analysis of health information systems (HIS) in the context of hospitals, they potentially
provide a rich avenue to do this. Hospitals are comprised of a rich mixture of different types
of health care providers and managers, interacting with each other in complex ways in order
to provide a multiplicity of patient care. But they are also part of a larger organizational
framework of other health services provided locally, nationally, and globally. They are thus
connected and inter-connected in many ways, reflecting political, cultural and organizational
and technological influences. As hospitals respond to these dynamics, they arguably reflect
strong characteristics of self-organizing complex networked organizations.
A specific arena of such self-organizing tendencies, we argue, are reflected in hospital IS
which extends beyond the hospital itself. For instance, since the post-apartheid period in
South Africa, equitable resource allocation has been a prominent component of the health
reform agenda. Not only do resources need to be equitably distributed between former
homeland and “white areas”, but the hospicentric health services of the apartheid era have to
be transformed and oriented towards a the primary health care (PHC) approach (Health
Systems Trust 1996; Wamukuo and Ntutela 2002). Similarly, in other developing country
contexts, hospitals may consume up to 80% of the health services budgets (Wamukuo and

2
Ntutela 2002; Vander Plaetse, Hlatiwayo et al. 2005). Improving efficiency, and saving even
10% of the hospital expenditure can increase the allocation of funds available to PHC
services by 50% (Newbrander, Barnum et al. 1993; Montoya-Aguilar 1994; Burn and
Shongwe 2003). However, bringing about such transformations is a radical exercise, and
requires addressing various interconnected influences, both within the hospital and external
to it within the district and larger health system.
Designing, developing and implementing hospital information systems are invariably also
influenced by deeply rooted political and technical networks. For instance, the factors that
complicate design of hospital information systems relate to the organizational complexities of
the hospital context (Lundberg and Tellioglu 1999; Hanseth and Lundberg 2001), the inability
to agree on common standards for communication between sub-systems (Hanseth, Jacucci
et al. 2006), and the difficulty of achieving a balance between loose and tight integration of
sub-systems (Monteiro 2003). Implementation is complicated by the politics involved in the
negotiation process around hospital information systems, including the pressure to “go big”
and adopt global solutions (Ellingsen and Monteiro 2003). In addition, in developing
countries, infrastructural problems such as inadequate power supply and inappropriate
environments for computers contribute to failures in information system (IS) implementations
(Littlejohns, Wyatt et al. 2003),.
Given this context, in the next section I explore the aims of the research, and the rationale for
the research questions. In this section I define a number of terms that are used frequently in
this thesis to help, explore my conceptualization of hospital management information
systems (HospMIS) in greater detail. Section three presents the motivation for undertaking
this research, and section four presents the theoretical perspective. Section five describes
the research setting and approach, and section six the positioning of the research in the IS
research domain. In section seven I discuss the expected contributions from this research,
and section eight presents the structure of the remainder of the thesis.
1.2. Thesis aims and research questions:
This thesis aims to develop complexity inspired conceptual models to understand the design,
development and implementation of sustainable and scalable hospital management IS in
resource constrained contexts, and which take into consideration the

3
complexities of the hospital environment. In order to address the research aim, two research
questions have been posed (see Text Box 1).
In order to address the research questions, five research objectives have been identified:
1. Describe the complexities of the environment which influence hospital management
information systems design, development and implementation in resource
constrained settings1;
2. Given the complexities of the hospital environment, conduct research and develop
theoretical and practical insights related to the design of hospital management
information systems that takes into account the socio-technical resource levels that
exist in developing countries;
1 I use the term resource constrained settings in preference to “developing countries” for two reasons. Firstly,
both “developing countries” and “developed countries” are terms that are all-encompassing and which suggest a
homogeneity that seldom exists in reality. For instance, some developing countries have areas within them that
resemble closely “developed country” contexts, and similarly, many developed countries have areas within their
boundaries that resemble “developing country” contexts. For this reason, I prefer to use the term “resource
constrained settings” to describe environments which are similar to the typical of “developing country” contexts in
that the challenges relate particularly to uneven access to infrastructure, staff and other resource shortages (for
example financial constraints), as well as the “typical” organizational and bureaucratic patterns found in so-called
“developing countries”. Secondly, as highlighted by Dr Hans Rosling during his presentation at the Global Health
Council Conference in Washington on 28 May 2009 (see
http://www.globalhealth.org/conference/view_top.php3?id=965 ), many world wide initiatives (e.g. MDG’s) are
setting targets for “developing countries” that have not ever been achieved in “developed countries” despite
access to significant resources. In many cases, so-called “developing countries” are making improvements at a
more rapid pace than any “developed country” has ever achieved. The allocation of countries to a pool of
“developed” versus developing is thus somewhat arbitrary.
Text Box 1: Research Questions 1. Given the complex nature of the hospital environment, what are the socio-technical
considerations that contribute to the design of sustainable and scalable hospital management information systems in resource constrained settings?
2. How can the implementation process be designed to accommodate unexpected
contradictions that arise between the different realities of original intent and changing needs in the implementation process?

4
3. Develop theoretical and practical insights into the successful implementation of
hospital management information systems that accommodate unexpected
contradictions that arise between the different realities of original intent and changing
needs in the implementation process;
4. Conduct research into the scaling of hospital management information systems,
especially which aspects of IS development are universally scalable, and which
require local customization; and
5. Suggest ways in which the design and implementation strategies described will
contribute to sustainable HIS development in resource constrained contexts;
Before exploring the rationale behind the research questions and HospMIS in greater detail,
the use of a number of terms need to be clarified in the context of the research aim of the
“design, development, and implementation” of HospMIS. “Design” is used in the sense that it
represents an “intentional future” (Heeks 2006, p. 128) and is used in its broadest sense to
refer to not only the design of software or hardware dimensions of a HIS, but also other
dimensions such as the implementation processes, the objectives and values embedded in
the system, the staffing and skills required to manage the system, management structures
and other support systems and other resources that the IS requires (Heeks 2006). The term
“development” is used in the manner suggested by (ibid) whereby as a system is
implemented and used, it requires ongoing “accommodation and adaptation” (ibid, p. 133) in
response to the difference between the design of the system, and the (often messy) reality
on the ground. Development of the IS impacts on all the dimensions of the HIS mentioned
above. “Implementation” is used to suggest the processes associated with the installation,
and use of the IS, and by its nature then implies ongoing design and development processes
as well. I use the term “HIS” to include all types of HIS such as, PHC information systems,
and hospital information systems including electronic patient record systems and HospMIS
(HospMIS are defined in the next section). Where I use the term hospital information system
it is used as a generic term for a variety of IS used in hospitals (see below) including
HospMIS. While the focus of this thesis is on HospMIS, I draw on my experience in working
with PHC based IS in a variety of contexts to develop concepts that are then applied to the
hospital setting, and vice versa.
In the next two sub-sections, I explore the rationale behind the research questions.

5
1.2.1. The Challenge in Designing Hospital Management Information Systems:
Hospital information systems have been described from various viewpoints. For instance,
one description suggests that hospital information systems must fit together three pieces of a
puzzle, namely clinical work, the organization that supports the clinical work, and the
information and communication technologies (ICT’s) that are used to manage information
(Aarts, Peel et al. 1998). This is a useful description because it immediately identifies three
important aspects of a hospital information system, and implies intricate linkages between
thee aspects. But, the puzzle is seldom as simple as this. In any hospital, multiple IS exist
often independently of one another, including financial, human resources, patient
administration and billing, and electronic patient IS (see Figure 1), and each has its own set
of components and stakeholders. The process of designing, developing and implementing
HospMIS must take these systems, and their associated networks into consideration.
Before exploring the design challenges in greater detail, HospMIS are defined. In this thesis,
a HospMIS is defined as a socio-technical system that collates and integrates data from
different sources (wards, out-patients, pharmacy, accounting departments, etc), so that
reports can be produced for clinicians, managers and administrators to enable them to
manage the hospital, the services it provides, and to allocate resources appropriately. The
HospMIS is conceptually a data warehouse that integrates data from multiple sources, and
also reflects and supports the various practices around the registration, processing, analysis
and use of data. For example, the HospMIS should indicate which departments are
experiencing busy workloads, and whether sufficient staff have been allocated to these
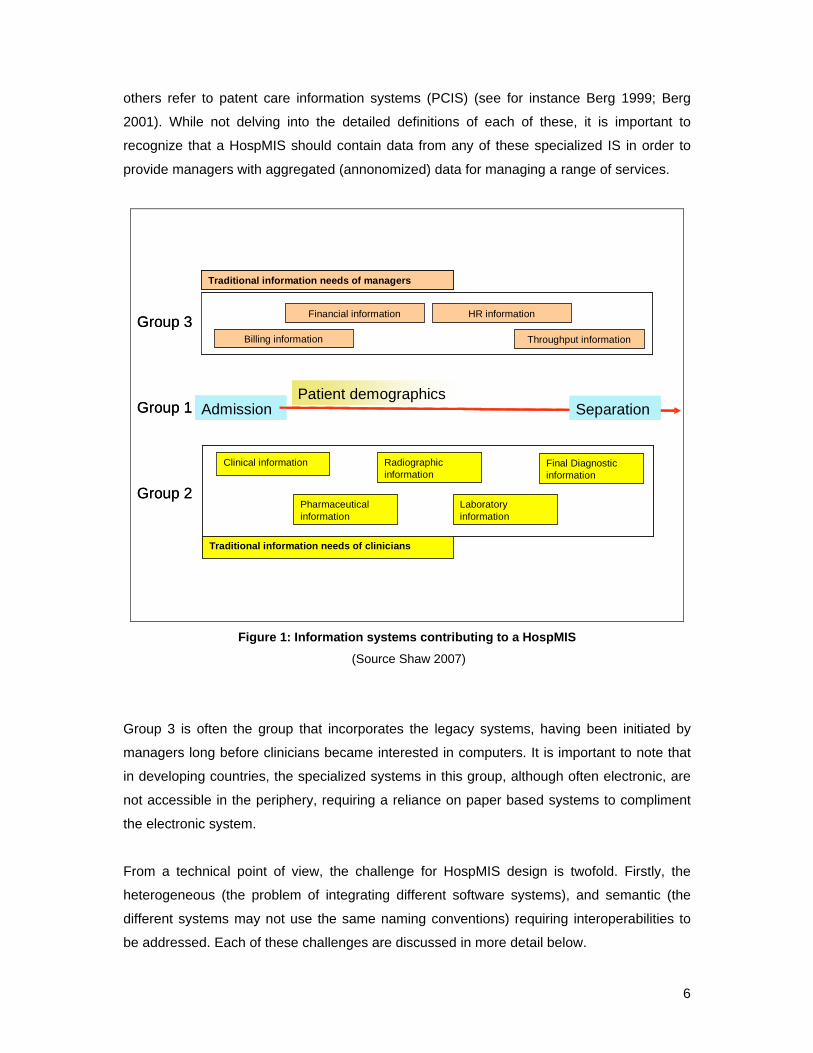
departments. Figure 1 provides a visualization of the roles different groups of IS play in a
HospMIS. Group 1 refers to the information that is linked to a patient, and includes
demographic data. This data is usually captured during the course of a patient attending the
hospital (either as an in-patient or an out-patient) and at the time of registration. They include
diagnostic and procedural details, as well as outcome (admission, discharge, death, etc) of
the interaction/s. This group is what has been referred to as “throughput information” and
typically is the basic data that is needed to manage a hospital. This is the minimum essential
data that is needed by management.
Group 2 includes the types of systems that are used in clinical departments, and those of the
support services (radiography), etc. They are usually more specialized systems, and capture
detailed data related to the clinical care process. Some authors refer to these systems as
electronic patient records (EPR’s) (see for instance Ellingsen and Monteiro 2003), or
electronic medical record (EMR) (see for instance Seebregts, Mamlin et al. 2009) while
6
others refer to patent care information systems (PCIS) (see for instance Berg 1999; Berg
2001). While not delving into the detailed definitions of each of these, it is important to
recognize that a HospMIS should contain data from any of these specialized IS in order to
provide managers with aggregated (annonomized) data for managing a range of services.
Clinical information Radiographic information
Laboratory information
Traditional information needs of clinicians
Final Diagnostic information
Pharmaceutical information
Admission SeparationPatient demographics
Billing information Throughput information
Traditional information needs of managers
Financial information HR information
Group 1
Group 3
Group 2
Figure 1: Information systems contributing to a HospMIS
(Source Shaw 2007)
Group 3 is often the group that incorporates the legacy systems, having been initiated by
managers long before clinicians became interested in computers. It is important to note that
in developing countries, the specialized systems in this group, although often electronic, are
not accessible in the periphery, requiring a reliance on paper based systems to compliment
the electronic system.
From a technical point of view, the challenge for HospMIS design is twofold. Firstly, the
heterogeneous (the problem of integrating different software systems), and semantic (the
different systems may not use the same naming conventions) requiring interoperabilities to
be addressed. Each of these challenges are discussed in more detail below.

7
Addressing semantic interoperabilities is not a simple task, especially given the use of
different systems in different hospitals (for instance, in South Africa there are at least three
different financial IS that should feed into a HospMIS, and none of these use the same facility
codes as those used by the human resource IS). This means that there is no single solution
that can be used for all hospitals. Given the differences between hospitals, the implication is
that some interfaces will need to be effected on-site, and will have to develop locally
appropriate solutions for the local systems in use.
Transferring data between heterogeneous systems, even if semantic interoperabilities are
addressed is equally challenging (see for instance Berndt, Hevner et al. 2003). In resource
constrained settings, effecting the transfer of data between systems is complicated further by
the shortage of skilled staff, the difficulty in accessing existing legacy systems that are
centralized and not always accessible on the internet, and infrastructural difficulties such as
unreliable power supplies and infrequent access to transport (for an example of these
difficulties see Text Box 2). A review of various reports from developing countries (Montoya-
Aguilar 1994; Wamukuo and Ntutela 2002; Bossert, Chitah et al. 2003; Vander Plaetse,
Hlatiwayo et al. 2005) show that when specific information is needed, for example cost of
care provision in hospitals, a variety of databases, at different levels within the health
hierarchy need to be accessed, and the data from these sources manually integrated.
But the challenges are not restricted to these interoperabilities alone. Interoperabilities are
exacerbated by frequent changes in one system that connects with others. Thus for instance,
during the intense reform that characterized the post-apartheid period in South Africa, health
facilities were re-allocated to different local government authorities numerous times as new
Text box 2: Interoperabilities as a frequent reality
“…because the interface between Oasis and Nootrooclin either does not exist, or staff do not know
how to use it, or it is not working, patient demographic data has to be entered twice – on Oasis for
ward management and on Nootrooclin for billing... This result in the Northern Cape Department of
Health’s Information system comprising of two separate non-interfaced software pieces instead of
one solution with sub-modules. This is totally contrary to the National standard.” (Hunter, De Jongh
et al. 2002, Page 7).
8
boundaries were formed, disputed and re-adjusted. This caused disruptions to the structure
of organizational hierarchies, and with these changes, staffing and budgetary adjustments
had to be mirrored in parallel human resource and financial IS. In addition to these structural
changes, changes in health care provision have been precipitated by the advancing
HIV/AIDS pandemic and accordingly, IS have had to be adjusted to accommodate new
reporting requirements. Because hospital information systems have traditionally been
designed as rigid, encoded systems, they have been unable to accommodate these kinds of
changes. Driven by the need to justify expenditures, and defend service targets, donors and
other agencies have then developed additional IS that operate in parallel to established
systems, resulting in duplication of efforts and fragmentation of information (Monteiro 2003;
Chilundo 2004).
The challenge for the design of HospMIS in resource constrained settings is to identify
appropriate solutions to address both semantic and heterogeneous interoperabilities, as well
as to design and develop systems that are flexible so as to be able to accommodate the
frequent changes that characterize these environments. These are the challenges that are at
the core of the first research question, namely to identify the socio-technical considerations
that would contribute to the design of sustainable and scalable HospMIS in resource
constrained settings. In this thesis, I define sustainability as “…an information system [that]
work[s], in practice, over time, in a local setting. This involves shaping and adapting the
systems to a given context, cultivating local learning processes, and institutionalizing routines
of use that persist over time (as well as when the researchers leave and external funding is
over)…” (Braa, Monteiro et al. 2004, p. 338). Scalability is defined as “…make[ing] one
working solution spread to other sites, and be successfully adapted there. Beyond merely the
technical aspects of scalability, our concerns lie in how to reproduce and translate the
necessary learning processes alongside the spreading of artifacts, funding, and people.”
(Braa, Monteiro et al. 2004, p. 338)
1.2.2. The Challenge of the Implementation Process But even if appropriate technical solutions are identified, these cannot be implemented and
institutionalized without an appropriate processes that involves stakeholders and takes into
consideration the networks and alliances that both complicate and support hospital
information systems development. The second research question is focused on these issues,
namely the implementation process. While the design is challenging, the implementation is
even more so given the shortage of staff in resource constrained settings, the absence of
sophisticated information implementation skills, and the broad range of implementation

9
problems. Typically, many design-reality gaps exist across all dimensions of the IS (Heeks
2006). For example, technical problems such the difficulties associated with the negotiating
standards (Berg and Goorman 1999; Hanseth, Jacucci et al. 2006) are not confined to well
resourced settings. While most descriptions focus on the rigidity of standards, and the
difficulty in achieving agreement on them, the reality is that securing agreement on common
standards is a time consuming process (see for instance Berg and Goorman 1999), and
must often be negotiated at a local level. The process of negotiating agreement is
complicated, and requires a mix of skills that are often not readily available in resource
constrained settings. The challenge of implementation is therefore firstly to access a team of
people experienced enough to overcome the broad range of implementation problems
described, and failing this, implementation must also seek ways in which skills transfer can
be effected so that appropriate capacity can be developed in support of the system. A double
agenda must therefore be pursued, to not only support the implementation process, but also
a training and learning process must be superimposed on the implementation process. The
aim in this thesis is to explore innovative ways in which these challenges can be addressed.
1.3. Research Motivation
Motivation for this research comes from numerous quarters. From a professional perspective
as a clinician, hospitals are important role providers of key services (such as caesarian
sections for instance) within the district health system. The HospMIS plays a central role not
only in documenting the workload and resource allocations to hospitals, but also in improving
the quality of care (Williams 1999; Committee on Quality Health Care in America 2001;
AbouZahr and Boerma 2005; Shibuya, Scheele et al. 2005). Yet, hospital information
systems are notorious in their inability to provide managers with reliable information (Herbst,
Littlejohns et al. 1999; Heeks 2002; Littlejohns, Wyatt et al. 2003). While the literature points
out the need for efficient hospital information systems (Hospital Advisory Group 1994;
Montoya-Aguilar 1994; Wyatt 1995; Herbst, Littlejohns et al. 1999), there are very few
articles describing design and implementation strategies for HospMIS in resource
constrained countries. Rather, the literature emphasizes the development of electronic
patient records, with scant attention being paid to the extraction of data from these systems
for the use by managers at all levels.
A second motivation is related to the debate around balancing health service delivery and
resource allocation within the health district between hospitals and PHC facilities (Van
10
Lerberghe and Lafort 1990; Vander Plaetse, Hlatiwayo et al. 2005). In 1978 the Alma Ata
Declaration recognized the disparities in health status between the developed and
developing worlds, and advocated greater community involvement in the development of
health programs as a mechanism to improve access to health services (Alma Ata
Conference 1978). One of the results of the Alma Ata Declaration was a shift in the emphasis
of health services from hospi-centric care to a PHC approach through the district health
system (Gorgen, Kirsch-Wolk et al. 2004). The role of the hospital in the district health
system was redefined as a partner within the PHC team (Van Lerberghe and Lafort 1990;
Montoya-Aguilar 1994). Despite the shift in emphasis, in many developing countries hospitals
continue to consume inappropriately large proportions of district budgets. Shifts in resource
allocations can only be effected if HIS are able to provide reliable information on who needs
resources most and for what purpose.
A third motivation concerns the notions of decentralization of health services whose aim is to
also devolve decision making power and authority. As a (former) manager of health services,
I needed information to be an effective manager, and to be able to exercise my power and
authority judiciously, yet, found that the systems I had access to did not address my needs.
Lastly, there is increasing recognition internationally that HIS in developing countries provide
unreliable data (Godlee, Pakenham-Walsh et al. 2004; Boerma, Bos et al. 2008), and this
hampers efforts not only for sector wide approaches (SWAp) to funding health systems, but
also for monitoring progress towards Millennium Development Goals (MDG’s), and health
system performance (Cassels and Janovsky 1998; GAVI Alliance 2005). As a result, there is
significant focus of efforts to improve HIS in resource constrained settings (World Health
Organisation 2003; AbouZahr and Boerma 2005; Boerma 2005; Boerma, Bos et al. 2008).
1.4. Theoretical Perspective
Both the organizational science and IS literature have argued that traditional views of the
world are insufficient to accommodate a rapidly changing environment that characterises the
“network” society (Castells 2000; Walsham 2001; Avgerou 2002). In particular,
characteristics like rapid change, non-linear effects and unpredictable long-term
requirements require approaches that are different to ones that assume stability and order
(Anderson 1999; Merali and McKelvey 2006). Complexity science has been used to
understand more broadly the processes of change in organizations since the 1990’s (Dooley
1997; Anderson, Meyer et al. 1999; Urry 2005a), and since the 2000s is increasingly being
used also to guide IS implementation (Jacucci, Hanseth et al. 2006).

11
Information systems design, development and implementation are particularly appropriate to
analyze using concepts from complexity science as they are increasingly shaped by complex
conditions such as the rapidly increasing rates of technical, organizational and societal
changes and their interconnectedness. Contributing to these dynamics is the faster and
different rates and modes of communication, which require organizations to be more
responsive by “learning quickly and reconfiguring flexibly” (Jacucci, Hanseth et al. 2006,
page 5). Communication and societal networks span countries and continents, contributing to
standardization, referred to as the McDonaldization of products and practices, yet they
maintain their diversity and lead to new practices (Urry 2005) due to processes of local
adaptation. Even within standardized networks, communication occurs in unexpected ways
and through unpredictable passages. These can be described as the dynamics within self-
organizing networks where change evolves, and adaptation to the environment occurs
through positive and negative feedback loops (Urry 2005).
Although complexity based research “is not yet prominent in the IS field” (Jacucci, Hanseth et
al. 2006, page 6), it is increasingly important from a number of perspectives. From a
technical perspective, complexity has increased due to the increased power in computing,
the increased number of systems and applications, and the increased inter-connectivity over
large distances, all of which have an impact on the scale of systems. From an organizational
perspective, organizations are having to rethink their structural and operational systems in
order to respond to rapidly changing markets and workforce skills, and their ability to “learn
quickly and reconfigure flexibly” (ibid, page 5) ). From a societal perspective, complexity has
increased due to increased globalization and networking that have resulted in the breakdown
of boundaries and “local actions (that) propagate to a global level with unintended side-
effects” (ibid, page 6).
There is increasing evidence of attempts to address various aspects of complexity in IS
design and development (Eoyang 1996; Xia and Lee 2004). For instance, Alaa and
Fitzgerald (2004) suggest that rigid software development methods should be replaced by
methods that are able to respond to the rapidly changing needs of users in a timely fashion
through self-organization and local control. Highsmith III (2000) suggests that rather than the
traditional software development processes (like the waterfall technique), “adaptive
development” techniques allow software developers to create expertise in complex and
challenging environments through iterative cycles of learning and implementation. Co-
evolutionary processes are advocated for aligning business and information strategies
precisely because information needs change rapidly, and as a result, alignment is never a

12
steady state – it emerges as business needs change and as opportunities for ISD become
apparent (Benbya and McKelvey 2006b)
Recognising the close association between IS and organizational processes (Avgerou 2008),
it is no surprise to find that the organizational science literature too has been calling for
different approaches to understanding organizational change (McKelvey 1997; Lewin 1999;
Volberda and Lewin 2003). Companies are facing significant environmental changes as the
result of “discontinuities created by an interdependent global economy, heightened volatility,
hyper-competition, demographic changes, knowledge based competition and demassification
of some sectors accompanied by enormous growth in others” (Daft and Lewin 1993, p. i). In
an attempt to theoretically understand such change processes, chaos and complexity theory
are being applied to the study of organizations (Stacey 1995; Dooley 1997; Lewin 1999; Seel
1999). McKelvey (1997) argues for a quasi-natural based alternative epistemology which
operates at the intersection between intentionality and naturally occurring behaviour, and it is
argued that perspectives grounded in complex adaptive system (CAS) are better positioned
to explain organizational dynamics that are neither regular nor constant (Dooley 1997). For
instance, concepts from complexity theory help explain non-linear interactions within and
between organizations (Anderson 1999), and feedback loops and innovation can be used to
manage software development processes for IS characterised by frequent change and
unexpected requirements (Eoyang 1996).
The CAS perspective also resonates with my medical background wherein the focus is often
on understanding the relationship of the body with its environment, often using rules from
nature and science (Gell-Mann 1995; Capra 2005). Positive and negative feedback loops are
responsible for continually effecting adjustments to change, and explain actions and
reactions to stimuli. In medicine, as in CAS, there is limited control over complex situations
(Dooley 1997). CAS emphasise the value of decentralised control (which is a fundamental
principle in district health systems) (Simon 1962; Waldrop 1992), and most interestingly, it
moves from the concept of static to dynamic equilibrium (Waldrop 1992). In particular, CAS
theory provides insights into two important challenges that characterise IS development in
resource constrained settings. Firstly, CAS provide an understanding as to why situations
might change rapidly and as a result of what are often considered insignificant factors or
stimuli, representing “non-linear effects” of small changes (Gleick 1993, pp 23-24). Secondly,
the CAS literature provides some insights into reasons for the lack of central control over IS
development, and the associated indeterminism that accompanies the lack of control and
non-linearity of interactions.

13
In summary, complexity based science provides an alternative perspective with which to
explore environments characterised by rapid change, non-linear effects and uncertain
futures. Increased access to ICT’s has improved communication and networks and
globalisation, and as a result complexity has increased technically, organizationally, and from
societal perspectives. These changes demand different perspectives for viewing
organizational change and IS development.
1.5. Research setting and approach:
The research reported in this thesis is based on a longitudinal case study analysis conducted
within the ongoing, large-scale, multi-country Health Information Systems Program (HISP)
research project. The empirical data has been gathered over a 10 year period from my
research in South Africa, Malawi, Nigeria, and Zambia in the design, development and
implementation of hospital and PHC information systems in the public health sector of these
countries. The research described in this thesis falls within the interpretive research tradition
described by Walsham (1993; 1995).
The core of the research is an action research project conducted by the Health Information
Systems Program in South Africa (HISP-SA), in 13 hospitals in the Eastern Cape Province
(ECP) of South Africa. The research spanned a range of hospitals of different sizes (from
100 beds to 1500 beds), different service types (tertiary level super-specialist services to
district level services and psychiatric care), and in rural and urban locations. The ECP has a
population of 7.1 million with 65% living in rural areas. The conditions are similar to those
found in other “developing country” contexts. The unemployment rate for the province is 55%
(but in some areas it is as high as 77%), and 8% of people live in informal housing “…,
reflecting traditional unserviced sites. Only 7% of households have potable water on site and
47% have a flush toilet or pit latrine, reflecting major social backlogs” (Eastern Cape
Development Corporation 2005). Hospitals in this province reflect the infrastructural
backlogs, and the disparities that are found in many other resource constrained settings.
Access to computers and internet are uneven2.
The first part of the research was conducted while I was still employed in the Eastern Cape
Department of Health (ECDoH), and working in Queenstown as a clinician (from 1992), and
2 Uneven is used in the sense that the diffusion of a technology often does not happen uniformly and
according to priority needs, but is often a haphazard and unequal distribution reflecting the active
social and political networks.

14
later in Bisho (the administrative capital of the province) as a Manager of Hospitals for the
ECP (from 1998). The balance of the research has been conducted through my association
with HISP-SA in a number of countries. In Northern Nigeria the focus has been on
strengthening HIS in both PHC and hospitals settings and where I have been involved since
2003. In Malawi the research has been focused on the design, development, and
implementation of a HospMIS for the two biggest hospitals in the country located in Lilongwe
and Blantyre. This research spanned a 2 year period from December 2003 onwards. In
Zambia the focus has been the revision of the national PHC information system to address
DART principles (namely a HIS that is Decentralized, Action Orientated, Responsive, and
Transparent) and my involvement has been since 2007.
Being involved in the global HISP research program has provided an exposure that is unique
in many respects. Firstly, because of the network that this organization represents,
participants are exposed to a wide range of ideas related to HISD in a wide variety of
contexts (see for instance (Braa, Monteiro et al. 2004)). Secondly, particularly because of its
association with academia, students, and teaching, and writing, concepts related to ISD are
constantly being challenged and tested, new ideas introduced, while others are adjusted and
evolved as the network gains experience and exposure in different settings. Thirdly, the
focus of the network on HISD in resource constrained settings has gradually emerged into a
niche resource. The network is valuable in the effect it is having on improving the lives of
underprivileged people in resource constrained settings, and exciting in that the ICT world is
evolving rapidly and thereby constantly providing new opportunities to be explored. Fourthly,
the network has pioneered the dispersed development of free and open source software
(FOSS) for use in HIS and has provided many different examples of ways in which the
software is developed, and appropriated in different countries.
While membership within the HISP network provides unique opportunities, the network itself
has evolved over the period of this research from being a pilot project in South Africa (Braa
and Hedberg 2002) to an association of independent organizations (such as HISP-SA, HISP-
India and University of Oslo Institute for Informatics) that together seek to strengthen country
health services through two main strategies. Firstly, through capacity building for health staff
at all levels of the health system through informal training programs and formalized
professional masters and doctoral programs in HIS. Secondly, through sharing of HIS best
practices across countries and continents. Being part of this process, and reflecting on the
changing role of the network has provided unique insights into sustainable health information
systems design, development and implementation (HISD).

15
1.6. Positioning the research:
This thesis is located within the field of research into IS, and the social, organizational and
technical implications of the use of technology. It contributes to IS research in developing
country contexts and specifically to IS development in the health sector. Drawing on
Avgerou’s (2008) analysis of the discourses existing in the domain of IS implementation in
developing countries, I would argue that this research contributes to two discourses of
socially embedded action and the transformative techno-organization. The former is
characterised by the construction of new techno-organizational structures within local
contexts and understanding local meanings and appropriate approaches. The research
contributes to this discourse in that it seeks to identify locally appropriate practices and
models, rather than the adoption and local application of “western” models. The latter is
associated with opportunities to improve socio-economic conditions locally as well as the use
of IS innovation to leverage on large scale socio-economic change. The contribution of this
research to this discourse arises from the history of large scale socio-economic change that
has characterised the post-apartheid era in South Africa, and the strong desire to not adopt
Western practices unquestioningly but to rather be circumspect about developing locally
appropriate solutions (Mandela 2003). This research also explores the use of FOSS
developed in the “south” and its use in the health sector as a tool for empowering health
workers at the “local level”3. This research is a contribution to the “dissensus” discourse
(Avgerou 2008) in the sense that the focus is on resource constrained settings in the “south”,
utilises FOSS which is locally developed (and rivalled by Western alternatives) and seeks to
empower those who in the health sector are traditionally at the bottom of the hierarchy.
1.7. Expected contributions
In this thesis, my empirical and theoretical focus is on HospMIS. However, I expect that
some of the theoretical concepts and practical insights will be able to be generalised to their
application in HIS and IS in general.
3 The HISP-SA vision is articulated as the “Development and implementation of sustainable and
integrated health information systems that empower communities, health workers and decision makers
to improve the coverage, quality and efficiency of health services” (see http://www.hisp.org/ ).

16
Besides making a theoretical contribution through the use of complexity science as a lens
with which to view HospMIS design, development and implementation (HospMISD), I expect
that this thesis will provide complexity inspired theoretical insights into the design,
development and implementation of HospMIS in resource constrained settings that are
characterised by rapid changes, non-linear effects and unpredictable long term requirements.
I anticipate insights into sustainable HospMIS development, and by implication, systems that
will be scalable as well. In particular, insights should be provided for sustainable
development of human resource capacity in contexts where staff shortages exist and skills
levels are basic.
The research has the potential to provide rich insights into the context of HospMIS and
health IS in DC, and as such to make a contribution to the ISDC discourse. The research
also aims to utilise a multi-level analysis to address a number of other research priorities
related to ISDC discourse. For instance, by virtue of having conducted research across many
countries within the HISP network, opportunities are provided to explore cross-cultural IS
implementation (Walsham, Symons et al. 1988; Walsham and Sahay 2006), not only
between different cultures in different countries, but also between different professional
groupings that represent different cultures (for instance health workers like doctors and
nurses and professional software developers), and between different cultures represented by
different organizations (for example HISP-SA and government bureaucracies).
Because the research spans a ten year period it potentially provides insights into the
development of sustainable and scalable HIS in resource constrained settings. The thesis
seeks to explore ways in which the “digital divide” can be reduced through sustainable
approaches which see health IS development as a gradual developmental process.
1.8. Structure of thesis
The remainder of this thesis is structured as follows. Chapter two provides a review of the
relevant literature, and following this a theoretical framework is suggested. Chapter three
provides an overview of the research approach and method and a detailed description of the
fieldwork. The chapter concludes with a reflection on data analysis, the use of theory, and
validity of my findings. In chapter four I present my findings by summarizing each of the
seven papers that contribute to this thesis, and then synthesize the findings. Chapter five

17
presents the theoretical and practical contributions developed in this thesis. The final chapter
presents concluding remarks, and future research directions.

18

19
Chapter 2. THEORY AND RELATED RESEARCH:
2.1. Introduction:
The aim of this thesis is to provide theoretical and practical insights into the design of
sustainable and scalable HospMIS in resource constrained contexts that take into
consideration the complexities of the hospital environment. In particular, the challenge in
these contexts is to accommodate the unexpected contradictions that arise between the
different realities of original intent and changing needs of the IS design, development and
implementation process. To address this I develop a theoretical framework with which to
understand the design and implementation processes of HospMIS. I do this by drawing on
three main concepts from CAS theory. They are firstly the non-linear effects that characterize
CAS (Gleick 1987; Anderson 1999), secondly the ability of CAS to create self-organizing
networks that display emergent behavior (Dooley 1997; Merali and McKelvey 2006), and
thirdly the ability of CAS to co-evolve at a state “far from equilibrium” (Stacey 1995; Plsek
and Greenhalgh 2001). These lay the foundations for interpreting the empirical component of
this thesis, and the development of theoretical and practical contributions.
This chapter is structured as follows. In the next section, I review the literature to provide an
overview of complexity theory as it relates to organizational science and the IS literature.
Section three describes four features of CAS’s, and in section four I use these concepts to
develop a theoretical framework with which to understand HospMISD. In section five I
summarise my theoretical perspective, and apply the framework to a failed hospital
implementation in a resource constrained setting. I use this to highlight areas requiring
further research, and which will be addressed in this thesis.
“The central task of natural science is to make the wonderful commonplace: to show that
complexity, correctly viewed, is only a mask for simplicity; to find pattern hidden in
apparent chaos.” (Simon 1969)
20
2.2. An Overview of Complexity Theory:
Complexity theory is a highly multi- and inter-disciplinary field, having emerged from a
number of different fields of study (for example cybernetics and systems theory, and as
shown in Figure 2). Definitions of complexity theory therefore differ, and usually reflect the
field from which complexity is explored. In the next section, some definitions of complexity
theory and CAS’s are provided, drawing largely from the organizational science body of
literature. Chaos theory is also briefly discussed because it is an important field within
complexity theory and helps to analyze more deeply the concepts of non-linearity and
“attractors”.
2.2.1. Defining Complexity Theory and related fields of study: A complex system as one that is made up of a large number of parts that have many
interactions (Simon 1969). Daft (1992) describes three dimensions of complexity in
organizations. The vertical dimension consisting of the number of activities or subsystems
within the organization (hierarchies), the horizontal dimension reflecting the number of job
titles, or departments in the organization, and the spatial dimension or the number of
geographical locations in which the organization operates. These dimensions are relevant in
a hospital environment where the hierarchy is significant even in small hospitals. Besides a
general hierarchy consisting of senior management, departmental heads, and workers within
each unit, there is a professional hierarchy such as between the doctors and nurses. Across
the horizontal axis are a wide variety of departments such as maternity, paediatrics, surgery,
but also financial, administrative, pharmaceutical, and transport, and each with their own
hierarchies.
Fontana (1999) suggests that complex systems “are typically organizations made of many
heterogeneous parts interacting locally in the absence of a centralised pacemaker and
control” (pg 14). This is also a useful definition for viewing hospitals and health services
which typically have decentralised control, and where for instance in a casualty department
or a theatre, the team will act locally in response to individual observations of critical patient
parameters, the actions of others, and in accordance with prescribed roles, behaviours and
procedures. While hospitals may be decentralized in terms of performing their professional

21
Figure 2: The origins of complexity science from a diverse range of fields (Source Wikipedia 2009)
22
roles, in the public sector they are generally not administratively decentralized, and this limits
their ability to act independently.
Within the broad range of organizational theorists, there is a group that suggest that
complexity theory is the study of CAS’s (McKelvey 1997; McKelvey 1999b; Begun,
Zimmerman et al. 2003). CAS’s are defined by Axelrod and Cohen (1999) as systems
populated by agents that seek to adapt to their environment. They highlight that the
adaptation process does not only result in improvements, and that it may be only a part of
the system that adapts, not necessarily the whole system. The notion of CAS has its origins
in the study of biological systems (Gell-Mann 1995), and on their ability to self-organize and
co-evolve (Dooley 1997; Benbya and McKelvey 2006a). CAS theory allows a holistic
assessment of an organization that is both self-organizing and learning through a process of
interaction with their environment. These systems demonstrate ‘emergent’ properties, as
adaptations result in the emergence of new phenomena, although in unpredictable and non-
linear ways (Holland 1995; Urry 2005b). Axelrod and Cohen (1999) describe emergent
properties as those in the system that separate parts do not have – thus for instance a
neuron does not have consciousness, yet the brain does have consciousness. Begun (2003),
who describes health systems as CAS, suggests that complexity science is about
“indeterminism rather than determinism, variation rather than averages, and local control
rather than global control” (page 259).
Complexity science thus deals with systems composed of many interacting agents, in which
behaviour may be hard to predict, but which can still have some structure (Axelrod and
Cohen 1999). Within the broad field of CAS there is also a field of study related to systems
that display turbulence, and which become rapidly disorderly and unmanageable. This is the
filed of chaos theory. The existence of this field is highlighted because within what appears to
be chaos, patterns begin to emerge around “attractors”. The nature of the patterns vary
depending on the initial conditions, and thus “unpredictable yet patterned results can be
generated, with small causes on occasions producing large effects and vice versa…” (Urry
2005b). Importantly, while two similar systems may start off with very similar conditions,
small changes can produce very different effects, highlighting the indeterminacy of outcomes
– an aspect that is explored more deeply in relation to the empirical data. Thus, while all
chaotic systems are CAS’s, not all CAS’s are chaotic (Eoyang and Berkas 1998).

23
2.2.2. A Brief History of Complexity Theory: A brief summary of the history of complexity theory is presented because complexity theory
is an emerging field within IS research it is therefore useful to understand how thinking about
complexity and CAS’s originated (Anderson 1999; Begun, Zimmerman et al. 2003).
Complexity theory emerged from physics and chemistry around 1984 from the work of
Prigogene and Stengers (1984). They described self-organizing systems based on their work
on thermodynamics (Waldrop 1992). Chaos theory, and the “butterfly” effect (based on the
work of Lorenz who was a meteorologist studying weather patterns), was popularised around
1987 by the work of Gleick (1987). Soon thereafter, popular books on complexity theory were
published (Lewin 1992; Waldrop 1992; Kauffman 1993; Kauffman 1995a) and the “adaptive”
component of complex systems was applied to economics. Around the turn of the century,
artificial intelligence and agent-based modelling emerged (Axelrod and Cohen 1999).
Interestingly, special issues of journals on “complexity” began to appear from 1998 onwards,
and covered a range of topics (see Table 1 for details) representing the increased attention
paid to this academic field.
In the field of organization science, complexity theory is applied to the study of organizational
processes like change and innovation (Van de Ven and Poole 1995) and more recently to
networks (Urry 2005a; Urry 2005b) and emergent global organizations (Knorr Cetina 2005).
Co-evolutionary theory has emerged in the organizational science literature as a field within
CAS theory, and has been applied to the study of emergence of new organizational forms
(Lewin, Long et al. 1999), competition between organizations (McKelvey 1999a), and
organizational absorptive capacity (Van den Bosch, Volberda et al. 1999).
In the IS literature, CAS’s theory has been used to describe co-evolutionary software
development processes (Highsmith III 2000; Kim and Kaplan 2005; Benbya and McKelvey
2006a), and the co-evolutionary development of strategic alliances (Koza and Lewin 1998;
Benbya and McKelvey 2006b). The value of the co-evolutionary approach is that it provides
the tools and concepts with which to understand, and document the changes that are
effected through diverse groups (individuals) participating in a joint process.

24
Table 1: Overview of Special Issues in Journals Featuring Aspects of Complexity Theory
Journal Topic related to complexity Publication
Complexity Complexity and Business 1998 Vol 3 Issue 4
Complex Adaptive Systems part 1 2002 Vol 8 Issue 2
Networks and Complexity 2002 Vol 8 Issue 1
Complex Adaptive Systems part 2 2002 Vol 8 Issue 4
Understanding Complex Systems 2005 Vol 10 Issue 4
Organization science Jazz Improvisation and Organization Science 1998 Vol 9, Issue 5
Application of Complexity Theory to Organization Science
1999 Vol 10, Issue 3
Co-evolution of Strategy and New Organizational Forms
1999 Vol 10, Issue 5
Emergence Theory, culture and society 2005 Vol 22, Issue 5
Communications of the ACM Adaptive Complex Enterprises 2005 Vol 48, Issue 5
Journal of Information Technology
Special issue on Complexity Science 2006 Vol 21 Issue 4
Information Technology and People
Complexity in IS research 2006 Vol 19 Issue 1
Complexity science began to appear in the health care organizational theory from the mid
1990’s (Begun, Zimmerman et al. 2003). Quality Management in Health Care journal carried
numerous articles, particularly to describing clinical pathways as non-linear, evolving
systems (Priesmeyer and Sharp 1995; Priesmeyer, Sharp et al. 1996). Health care
organizations also came to be described as CAS when three eldercare organizations were
analysed from a complexity science perspective (Marion and Bacon 1999).
Complexity theory is used to explain health care management and leadership (Zimmerman,
Lindberg et al. 1998; Arndt and Bigelow 2000), to develop recommendations on health sector
reform in the United States in 2001(2001), and recently, to discuss issues of management
and leadership of the British Health Services (Fraser and Greenhalgh 2001; Plsek and
Greenhalgh 2001; Plsek and Wilson 2001; Wilson and Holt 2001)
This brief overview of the use of complexity science in the organizational science, IS and
health systems literature is presented to highlight the recent emergence of the field over the
last ten years, and to provide a brief overview of the ways in which complexity science has
been used. The overview helps to frame my use of CAS as an analytical framework in this
thesis.

25
2.3. Key Features of Complex Adaptive Systems:
In this section, a CAS is defined in terms of its parts, the behaviour of the parts, and the
emergent behaviour of the whole system. Following this, three key phenomena related to the
features of a CAS to adapt in response to changes in their environment are discussed,
namely non-linearity, emergent behaviour through self-organizing networks and the co-
evolutionary nature of a CAS adaptation to the environment. Each of these phenomena is
also discussed in section five in relation to their application to IS and organizational science.
2.3.1. The components of a CAS - Agents with schemata adapting to the environment:
CAS are made up of active elements called agents, or “adaptive agents”, and they could be
individuals, groups or coalitions of groups. These, can be grouped, or aggregated into meta-
agents which represent the hierarchical arrangement of levels of agents. The ability of CAS
to arrange themselves in hierarchical patterns is important from the point of view of
adaptation and evolution for two reasons. One, due to the hierarchical structure of systems
and their sub-systems, each operates both independently and interdependently of one
another (Simon 1969). Two, because of their relative independence, hierarchical “systems
evolve to a level of organization through self-adaptation, rather than control” (Tan, Wen et al.
2005) implying a quicker evolution.
An agents’ behaviour is dictated by a schema (a set of rules) representing a cognitive
structure that will determine what action the agent takes in response to an evaluation of the
environment. Schema can evolve over time, and different agents may or may not behave
according to the same schema over time. Schemata may be composed of one rule from a
set of possible rules, or a combination of rules, or may in fact be similar to a neural network
where a set of stimuli will evoke a set of rules, and different combinations of stimuli will evoke
different rules (Anderson 1999). Schemata are rationally bounded (Simon 1991) and are
sometimes called “interpretive schemata” (Dooley 1997), but can undergo change through
single loop and double loop learning (Argyris and Schon 1996).
Because schemata can be more sophisticated than a simple set of rules, agents are able to
attribute meaning to a set of circumstances. Schemata can compete against one another
internally, and this explains organizational adaptation (Gell-Mann 1995). Schemata can
evolve more rapidly than agents can, and so competition amongst schemata allows those
that are more efficient to receive positive feedback at the expense of less efficient schemata,
and adapt accordingly. Organizational outcomes are influenced by the action of agents, their

26
networks and their “fitness” levels (this is described in more detail in section 2.3.3) (Lewin,
Long et al. 1999) Order is emergent based on lower-level behaviours. Before expanding on
self-organizing groups as a characteristic of CAS, I now explore the notion of non-linearity.
2.3.2. Non-linearity resulting in unpredictable long-term outcomes: Non-linear effects are a characteristic of CAS where small changes in behaviour can effect
small, medium or large changes on the system according to a “power law”. The power law is
typically described by the avalanche example – dribbling new sand onto an existing sand pile
will allow the sand pile to grow up to a certain point, after which an additional grain of sand
will set off an avalanche, representing a non-linear effect. Small avalanches are more
frequent than large avalanches, and they occur at a frequency which is inversely proportional
to their size, or power. The same principle exists for earth quakes and fluctuations in the
stock market prices. The result is that CAS’s operate within a dynamic equilibrium (Waldrop
1992; Stacey 1995). This is also called “self-organizing criticality”, and refers to the fact that
CAS are in a continual state of flux at the edge of chaos (discussed in more detail in Section
2.3.4), and small adjustments will sometimes result in large scale changes (Waldrop 1992, p.
304-306).
A slightly different view of non-linearity suggests that non-linear systems express
relationships that are not proportional (Gleick 1993). Non-linear systems don’t add up and
they cannot be solved. The result is that minor changes in the past can have surprisingly
large effects in the present because small events are not forgotten, and adding two
elementary actions together can have surprising effects.
Non-linearity and indeterminate outcomes evolve as a result of both negative and positive
feedback (Stacey 1995). If negative feedback dominated (as in a situation where control is
centralised and rules dominate), then inertia and stability would result. Alternatively, if only
positive feedback was provided, then instability would result. In a situation where agents are
free to choose whether or not to act according to a set of rules, then the rules and schemas
which govern their behaviour can change. This creates a situation which is paradoxically
both stable and unstable – it is stable in the sense that short-term outcomes are predictable
(the weather for today and tomorrow can be predicted with reasonable accuracy), but there is
instability in the sense that the long-term outcomes are unpredictable. This is also termed the
“sensitive dependency on initial conditions”, meaning that slight changes at the initiation of a
process may lead to very different long-term outcomes (Stacey 1995; Dooley 1997). Systems
behaving in this way are termed deterministic and non-linear. They are deterministic in the

27
sense that agents operate within the system in a certain pattern, but the systems are non-
linear in that the agents cannot control the effects of positive and negative feedback, nor the
way in which individual agents may adjust the rules and which result in unpredictable
consequences.
2.3.3. Self-organizing groups and networks displaying emergent behaviour:
Autogenesis (the ability to self organize) is a characteristic of systems where independent
agents behave according to a set of rules and not due to external control. Feedback loops,
both positive and negative modify the behaviours of agents, and history serves to provide a
trajectory for the future, as the system evolves (Anderson 1999).
Autogenesis occurs in open systems that import energy from the outside (Anderson 1999).
Energy is imported in a variety of ways – through ingestion of food (as in living systems),
through creation of energy through photosynthetic processes, or through the inclusion of new
agents within the network of agents and meta-agents. These organisms are called
dissipative structures (because of their ability to absorb energy, and dissipate it as they
change and develop). The inflow of energy creates an instable state, and it is at this stage
that new life forms and structures emerge (hence the term “emergence”). Within an
organization, those with influence can inject energy (by bringing in new members, new
suppliers and partners) setting new challenges and/or shaking up the organization (Anderson
1999).
Self-organizing groups and networks are important from an IS point of view for two reasons.
First, it is the extent of inter-connections between networks within an organization that create
opportunities for innovation. For instance, rather than view informal networks as unwanted
structures within an organization, they should be recognized as the source of disorderly and
unstable dynamics which can potentially result in evolutionary and transformational
processes (Stacey 1995). Traditionally, organizations try to limit the creation of these
informal networks through the formalization of hierarchical structures and rules by which
employees are expected to behave. Stacey (1995) describes how the formal organizational
structures that provide “stability, certainty and conformity” (page 484) are counter-forced
through the presence of the informal organizations, that pulls the organization towards
instability, fragmentation and division. The balance between these forces is what allows an
organization to be both stable, while also allowing change to be enabled within the state of
“bounded instability”. The stability within an organization will also vary depending on the

28
connections between agents – instability results when the agents are very loosely connected,
as well as when each agent is connected to each other. The greater the number of
connections, and the more random they are, the greater the degree of instability. Where
there are few and strong connections, greater stability will ensue (Stacey 1995). Most
effective change happens when agents are loosely connected with one another, in naturally
evolving networks allowing evolution to take place in neighbourhood networks (Dooley 1997;
Anderson 1999). The degree of order within the networks depends on the degree of
interconnectedness, and when order emerges it is a surprise, because there is nothing in the
random behaviour of the individual agents that suggests that order will result.
Secondly, the alteration of networks and bonds between networks allows CAS to evolve. It is
recognised that the constituent elements (agents, their rules and schemata, and the nature
and strength of connections between agents, and networks, and their fitness) of a CAS are
able to evolve and change. But it is the alteration of their networks, and recombination of
agents into different networks that allows CAS to adapt on rugged fitness landscapes4
(Kauffman 1995b; Lewin, Long et al. 1999; McKelvey 1999a). Technological innovations
allow different types of connections to be formed (see for instance the effect of the internet,
or of skype in changing networks and relationships) between networks, which allow
organizations to evolve in different ways. Similarly, mergers and task forces allow
organizations to better adapt to changing global markets (Anderson 1999).
CAS can have what appears to be chaotic phases in their evolution, displaying random
patterns, or “strangely stable” behavior that has a highly complex order. The patterns
exhibited during change are described as “attractors”, which have the ability to concentrate
activity around them, for example the sun. A smaller planet that is attracted by two suns
would have a more erratic path, being attracted at different stages of its orbit to each of the
two suns. Different types of attractors are described. A “fixed-point attractor” results in a
4 The fitness landscape is a tool to understand biological evolution. It is a space which depicts
qualitative values geometrically. The vertical axis displays “fitness” to the environment, and on the
horizontal a specific location will for instance represent a genetic element. The height of the peak at
that location will represent the relative fitness contribution of that element for the organism as a whole.
Landscapes are “rugged” where one attribute has implications for other attributes. Evolution on
“rugged landscapes” is focussed on finding the high ground. The fitness landscape is a constantly
changing landscape as other agents and meta-agents adjust their fitness.
29
system gravitating to a single state, or set of states, where it remains. Other attractors are
“limit-cycle attractors” which would create a steady pattern of events whereby the cycle is
repeated over and over and stability results. “Strange attractors” result in apparently random
patterns that are non-linear in nature, and have a complicated set of rules that govern their
behavior and the apparent chaos that results. All attractors operate within a set of fixed
parameters or boundaries, but within these the system is unpredictable. Attractors in general
are useful as they can help describe the stage of a system’s evolution (Butz 1997).
2.3.4. Co-evolution at the edge of chaos: Co-evolution is the process whereby agents change with one another as they adapt to
improve their fitness to the environment. Co-evolution results in a “critical state” at the edge
of chaos described as “perpetual novelty” (Axelrod and Cohen 1999, p.10), where small
changes can have marked effects leading to the “avalanche effect”.
The adaptation of a system to the environment is the result of the adaptive efforts of
individual agents improving their fitness to the landscape. The fitness landscape that has to
be attended to by a CAS is a multi-dimensional landscape with frontiers in a number of
different areas, which need to be managed at the same time, and over time (Anderson 1999;
Fontana and Ballati 1999). As discussed above, it is not only that fitness is achieved, but also
the process (the history) that is important in defining the overall degree of fitness (Anderson
1999). The focus on both system and process, is probably the single most important
difference between complexity theory and reductionist approaches to organizational theory
(Fontana and Ballati 1999; Urry 2005b).
Complex systems operate at a position “far from equilibrium”, or at the “edge of chaos” (see
Figure 3 below) (Waldrop 1992) representing the state between stability and chaos (Stacey
1995; Wilson and Holt 2001), or the balance between forces of order and disorder (Waldrop
1992). Waldrop describes this state as the difference between a solid state (where there is
order, and little change), and a liquid, where the atoms tumble over one another. In between
these two states is the “edge of chaos” where complexity is found. The further a complex
system is from a state of equilibrium, the more complex it is, and the higher the degree of
non-linearity. It is at this “far from equilibrium” position that order emerges out of the instable
state.

30
Stability
Chaos
High
High
Degree of certainty
Low
Low
Degree of agreement
Environment familiar
Environment unfamiliar
Task familiar Task unfamiliarZone of
complexity
Figure 3: The Zone of Complexity or Edge of Chaos
(Modified from Wilson and Holt 2001)
Anderson (1999) presents two explanations why CAS evolve to this “critical state” at the
“edge of chaos”. One is because the co-evolutionary processes over time have eliminated
the “least fit” element of the system. The weakest link in the organization (or in the
landscape) is replaced by another that fits better, and so the CAS evolves to a state where
the remaining elements are able to adapt and change to the environment – at the edge of
chaos.
The second view suggested by Kauffman (1995b) is that CAS evolve to the edge of chaos
because that gives them a competitive advantage. If small changes result only in small co-
evolutionary changes, then the species is unlikely to survive because it would not change
significantly. On the other hand, in chaotic systems, small changes may result in radically
different fitness levels which are a better fit with the landscape, but which are difficult to
maintain because of their chaotic state. As a result, they crash to lower levels of fitness with
the next injection of energy, and so do not survive. However, CAS that are able to maintain a
31
state at the “edge of chaos” where they are experiencing sufficient change to allow co-
evolution to occur, yet not so much that sends them into a chaotic state are the ones that are
most likely to evolve to the best fitness to the landscape. This is a balance between flexibility
and stability (Stacey 1995). Effective organizations should strive to evolve a strategy that
maintains them at the edge of chaos where frequent small evolutionary adjustments are
made from time to time, and punctuated by occasional large changes representing radical
innovations.
2.3.5. Summary: I wish to highlight four key messages from the analysis in the preceding sub-sections. First,
CAS are able to evolve independently and interdependently of one another and free of
central control. Their ability to evolve free of central control is the result of their behaviour
according to schema which can change over time through first and second order learning
processes. Secondly, non-linear effects are to be expected when studying organizations
characterised as CAS’s. While the non-linear effects cannot be avoided, careful attention
needs to be paid to opportunities to create non-linear effects. Non-linearity is a paradoxical
situation which is described as a state of dynamic equilibrium where short term outcomes are
predictable, but long term outcomes are not. Thirdly, within an organization, the formal
structures, rules and systems provide stability and order, but these are counterbalanced by
the existence of self organising groups which represent the counter balance of disorder and
dissent. Balancing these forces allows an organization to achieve “bounded instability” which
is an optimum state in which innovation can occur, and which can be achieved by changing
the number of interconnections between networks and agents, and the strength of the
connections. Fourthly, co-evolution is the process of adaptation of the system in the zone of
complexity.
2.4. The Elements of a Co-evolutionary Framework:
In this section I explore the elements for a complexity inspired theoretical framework with
which to analyze HospMISD. In the next sub-section I provide an overview of the application
of basic principles from CAS’s theory to hospitals and HospMIS. The three sub-sections
thereafter explore non-linearity, self-organizing networks, and co-evolution as applied to
organization science and IS. In the last sub-section (that is the application of co-evolution to
organizational science and IS), I elaborate on three main ideas, namely that adaptive
tensions play an important role in CAS to identify potential areas for co-evolution and

32
innovation, that organizational change and technological change are co-evolutionary
processes in support of one another, and that the co-evolutionary process is an
organizational learning process. In the next section (Section 2.5) I use these concepts to
develop a theoretical framework which is then applied to a failed hospital information system
implementation to demonstrate the potential of the framework in suggesting alternative
strategies for effecting HospMISD.
2.4.1. Introduction: The health care sector can be conceptualized as a CAS, and described using concepts of
adaptive agents and meta-agents to develop a framework for understanding the functional
units in hospitals, including hospital information systems (Begun, Zimmerman et al. 2003;
Tan, Wen et al. 2005). In the case of hospitals, the agents, or “adaptive agents,” are the
health care workers like doctors and nurses, or managers, or patients. These, can be
grouped, or aggregated into meta-agents (wards, clinics, or departments or other teams),
which represent the hierarchical arrangement of levels of agents. As with other CAS, the
hierarchical arrangement of health systems allows them to operate both independently and
interdependently of one another (Simon 1969). For example, a paediatrics ward operates
relatively independently of other units, yet it is influenced by events in other wards (for
example it sometimes has to respond to a new delivery of a sick neonate in the maternity
ward). Secondly, they are able to evolve more quickly: “to a level of organization through
self-adaptation, rather than control” (Tan, Wen et al. 2005, p.39) in accordance with accepted
rules. For example, nurses and doctors know how to respond to an emergency without
having to follow written rules. In a medical emergency, agents adapt roles automatically and
synergistically in response to actions and reactions of colleagues and linked networks.
Adaptation happens at a relatively rapid pace at the “edge of chaos” as the agents and
teams respond to the emergency. Slowly a new equilibrium is established, and adaptation
takes place as the agent fits into the changing environment and learns through experience.
Adaptation may take place over different time scales (for example in an accident related
emergency the response is immediate, while the response to the HIV/AIDS pandemic takes
place over years). The processes of adaptation are mediated by feedback loops (both
positive and negative) through interactions with other agents of the complex system.
The value of the CAS perspective is that it provides a mechanism for understanding the
multiplicity of interactions and forces that can influence “agents and meta-agents” involved in
the development of hospital information systems. In addition, it provides a mechanism to
analyse and understand hospital information systems development at multiple layers of the

33
hierarchy as well as horizontally across the hierarchical layers, a research priority highlighted
by Walsham and Sahay (2006). In particular, it provides concepts to explore the dynamics of
individuals (as agents and meta-agents) in relation to their interactions with others and with
technology (see for instance Kim and Kaplan 2005).
2.4.2. Application of non-linearity to organization science and information systems:
In his recommendations for the redesign of the American Health System, Plsek (2001)
describes the health care system as being non-linear, and “not predictable in detail” (p. 313).
He suggests that forecasting is an “inexact, yet bounded art”. Unlike machines, whose
behaviour is predictable, the behaviour of CAS is creative and emergent, and therefore the
only way to know what a CAS will do is to observe it. From an organizational dynamics
perspective, non-linear effects mean that small actions taken by an individual, or a network of
individuals, acting at a micro level, may have major organizational impacts at the macro
level. However, the consequences of specific actions are unknowable and unpredictable.
The links between cause and effect become blurred, and so rather than look for these, we
should focus on “patterns and their systemic implications” (Stacey 1995, p 493). Yet,
paradoxically, there is an “inherent order” that is evident, a result of self-organization, and
free of central control. The challenge though is how to manage such a system and enable a
balance between the convergent and divergent forces. The following strategies are
suggested (Dooley 1997; Zimmerman, Lindberg et al. 1998; Plsek 2001):
• Establish a good enough vision and create space for creativity to emerge from local
actions;
• Provide simple rules and minimum specifications, especially as they relate to
structural and behavioural issues;
• Create linkages and networks, and encourage diversity;
• Cultivate enquiry, experimentation and divergent thinking;
• Create conditions in which the system can evolve over time; and,
• Establishing rapid feedback cycles to support self-reference and self-control.
Drawing on the work of Dooley (2002), who identifies eight characteristics to contrast linear
and non-linear systems, I have used Table 2 to highlight characteristics of non-linear
systems that can be influenced to enhance or mitigate non-linear effects. The challenge is to

34
Table 2: Characteristics of Non-Linear Systems Applied to HIS
(Source Dooley 2002)
Characteristic Linear systems
Non-linear systems
Application to Health Information Systems
Connectivity Dedicated lines of connectivity
Common-mode connections with two-way traffic
Traditionally HIS are vertical and with little cross-communication. However, there is a need for increased connectivity and communication across programs because there is a great deal of common data to be communicated. Changes in “connectivity” can be brought about through meetings, fora, and establishing a unifying vision. Where integration is too tight, mechanisms to delink units should be sought, through for instance creating different types of functional groupings and shifting the emphasis to other focal areas.
Sub-systems Segregated sub-systems
Interconnected sub-systems
Many sub-systems within the HS and HIS, each demanding their own information system (e.g. transport, finance, service delivery – if fragmented even these will be multiple systems). Changes in “connectivity” between sub-systems can be brought about through similar mechanisms to those discussed above.
Feedback loops Few feedback loops
Many feedback loops
Multiple feedback loops exist in the health system because of multiple units each belonging to separate systems, multiple connections, and multiple controls. The effect of feedback loops can be ameliorated or enhanced through adjusting the number of inter-connections between groups and units (Stacey 1995).
Controls Single control
Multiple controls, or no clear control centre
Controls are located in multiple sites, including in local manager, managers of sub-systems, politicians, and patients. Structure can be balanced with self-organizing networks – where the situation begins to spin out of control, structural adjustment can be effected (this may require either an increase or a decrease in structural support, depending on the circumstances).
Information Directly communicated and available
Indirectly communicated and not always available
Multiple sources of information, including managers, patients, and politicians. As indicated above, an observant manager will adjust the amount of information, or the mechanisms for circulating information, in response to the context and events. Crises may be precipitated by either too much information or a lack of information, and each situation will need to be judged accordingly.
Understanding context
Context is clearly understood, and is extensive and complete
Context can never be fully understood due to the complexity of networks
Understanding of the context is limited, given the multiple connections and mechanisms of communication and multiple systems interacting with each other. Yet, an awareness that this is the case will spur the careful manager to explore connections, networks and seek out alliances even with opponents

35
manage the non-linear effects in such a way that the system is maintained in the zone of
complexity, balanced on the edge between stability and chaos.
Stacey (1995) suggests that organizations that wish to be innovative and creative need to
create an “internal property” (p 489) of changeability. Organizational changeability can be
achieved by establishing three important features within an organization. First, enable the
creation of sufficient self-organising networks which cross internal and external boundaries
and which create sufficient internal instability “far-from-equilibrium” so as to be the “engines
of enquiry”. Secondly, organizations should allow open-ended choices to their members
which are constrained by the organizations feedback structure. He suggests a balance
between structure (which should be deterministic) and the outcome of open-ended informal
networks. Thirdly, focus on short-term emergent processes rather than long term intentional
outcomes.
At this stage I wish to highlight three concepts of non-linear systems, namely connectivity,
controls, and feedback and information (Dooley 2002). These three concepts are key to
managing CAS, and are discussed in more detail in the sub-sections that follow. The notions
of connectivity and control are key characteristics of self-organizing groups (and are
discussed further in Section 2.4.3). Connectivity between agents and meta-agents is central
in enabling feedback, and supporting the flow of information. Decentralized control is effected
through establishing self organizing groups and utilizing the hierarchical arrangements within
CAS. These structures (the self-organizing groups and hierarchical structures) within CAS
are networked and interconnected, and therefore are the mechanisms whereby
communication (including feedback and provision of information) is effected.
I now explore the application of autogenesis to organizational science and IS.
2.4.3. Application of autogenesis to organization science and information systems:
While the term “self-organizing” groups has been used to describe independent agents that
behave according to a set of rules and free of external control, this does not imply that self
organizing groups are not amenable to external influence. Self-organizing groups need to be
seen as agents or meta-agents within the larger CAS, and therefore co-evolving with other
agents in the system to obtain the best fit for the whole. It is within this context that I describe
how self-organizing groups can be managed as part of the co-evolutionary process.
36
Alaa and Ftzgerald (2004) apply the concept of self-organising groups to the concept of the
“Practice” which is defined as a “discourse [between developers and other stakeholders,
including users] during which requirements for software development activities and
responses evolve” (p. 16 (my emphasis between square brackets)). This approach allows
developers to establish the context in which they can be creative and innovative driven by
opportunity and events, rather than being constrained by a detailed specifications and
requirement analysis. Similarly, in discussing the dynamics between software developers
and users, Eoyang (1996) suggests that teams of diverse members can be left to work
together, recognising that diversity brings with it opportunities for innovation.
Co-evolution is discussed in more detail in the next sub-section, but two concepts related to
the role of self-organising groups in the co-evolutionary process require specific mention
here. First, the size of self-organizing groups warrants consideration. Self-organizing groups
are suggested for achieving business and IS alignment (Benbya and McKelvey 2006b). The
co-evolutionary process must span multiple levels of the organization (namely the individual,
the operational, and the strategic), and must effect communication between the levels and
between units at each level. Effective communication between the three levels of the firm
and the units is a function of the size of the self-organizing groups. If the size of groups are
too big, then they cannot organise easily and quickly, and cannot respond to changes in the
business strategy and effect changes in the IS strategy. On the other hand, if the units are
too small, and function independently of one another, then disjuncture results between units
at each level, and between levels, resulting in a misalignment between the units and their
individual business/information strategies. Identifying the “appropriate size” for self-
organising units, is critical, and modularity is an important consideration in expanding or
shrinking group size in order to increase or decrease group responsiveness.
Secondly, feedback processes are an important aspect of co-evolutionary processes
(Anderson 1999; Benbya and McKelvey 2006a) . Eoyang (1996) describes how the length
and breadth of feedback cycles can be adjusted to manage the co-evolutionary design
process for software. The length of a feedback cycle is the time between feedback
processes, and the breadth of a feedback cycle is the amount of information provided during
the feedback process. Both the length and breadth of feedback cycles can be adjusted to
maintain the co-evolutionary processes in the zone of complexity. For instance, with respect
to the length of feedback cycles, during periods of turbulence (usually at the start of a project
and near the end), short feedback cycles can introduce stability, while long feedback cycles
can result in instability. Similarly, with respect to the breadth of feedback cycles, early on in a
project, the feedback is focussed on the vision and conceptual aspects of the project, while

37
later on the detail. Providing the wrong type of information can result in confusion and
instability.
Before exploring co-evolutionary processes, I summarize the development of the theoretical
framework so far. The theoretical framework seeks to manage non-linear effects and
highlights the importance of connectivity, feedback and information, and control between
sub-systems in a CAS (Dooley 2002). Sub-systems can be units, or self organizing groups.
Self-organizing groups are important in that if they are composed of a diverse range of
actors, then they can potentially become sites of innovation. Connectivity has been briefly
explored in terms of efficiency of communication as influenced by the size of groups, and the
nature of feedback cycle length and breadth. Decentralized control is an inherent property of
self-organizing groups, and of the hierarchical arrangement of sub-systems.
2.4.4. Application of co-evolution to organization science and information systems:
In the preceding sections, I have discussed the application of two main concepts from CAS
theory to IS and organizational science, namely the role of non-linear effects and self-
organizing groups. This has mirrored the discussion on the characteristics of CAS. In this
section I further expand the theoretical framework developed in the preceding sections by
exploring co-evolution as a process in support of HospMIS development. In this section I
develop three main ideas:
a) Adaptive tensions are important to identify potential areas for co-evolution and
innovation;
b) Organizational change and technological change as co-evolutionary processes in
support of one another;
c) Characterizing technological change as an organizational learning process
a) Adaptive Tensions as Opportunities for Co-evolution and Innovation The forces between order and disorder, stasis and chaos described in section 2.3.3 are
frequently referred to as adaptive tensions in descriptions of health systems as CAS (Plsek
and Greenhalgh 2001; Wilson, Holt et al. 2001). Adaptive tensions represent the variation
between different parts of the system, and the object is to use them “…to generate a creative
tension that acknowledges the special benefits of all the systems’ components” (Eoyang
1996, pg 34). They provide the potential for innovation and learning (Plsek and Wilson 2001).
Adaptive tensions present in hospitals in various ways, namely:

38
• They might appear as the variation between independence and inter-dependence
where for instance departments work independently of one another yet are also inter-
dependent on others for services and assistance in patient management; or
• As the variation between homogeneity and heterogeneity as agents work in teams
which sometimes have similar skills (doctors in a paediatrics department), and at
other times different skills that complement one another (for example software
developers and health workers who are the users); or
• The balance between accommodating innovation and divergence with uniformity and
conformity. For example, in an emergency, doctors and nurses need to be innovative
within the confines of acceptable treatment regimes, sometimes in the theatre as well.
Similarly, while hospital departments are granted a certain degree of autonomy to be
innovative and individualistic, they are also expected to act in the best interests of the
hospital as a whole and in consultation with other departments; and
• Adaptive tensions also arise between the hospital and forces external to hospitals.
For example, adaptive tensions frequently arise through the interactions and
responses of a hospital to the global (for example, new ICTs) and local (for example,
patient diseases) forces of change.
Being aware of the existence of adaptive tensions, and examining them in greater detail can
provide practical insights on how to develop HospMIS. Innovation takes place at the interface
between the adaptive tensions – through contact and exposure to alternate viewpoints. This
is where “adaptive tensions” surface, and which give rise to change.
As indicated above, adaptive tensions frequently arise between global forces of change in
the ICT sector and local organizational processes (see for example (Barley 1986)). The
notion of integration between organizational and technological change processes is
important to understand, especially given the global demands for organizations to adapt to
changing ICT (Castells 1998; Castells 2000; Walsham 2001). For instance, IS research
demands a deeper understanding of both the IT artefact, and the organization in which it is
deployed and used (Kling 1980; Orlikowski and Iacono 2001). If both of these components
are changing at disproportionate rates, and in response to different and similar pressures,
then the challenge is how organizations can accommodate these changes. In the next two
sections I explore the unfolding interaction between organizational and technological change
in more detail.

39
b) Co-evolution of Organizational and Technological Change The concept of co-evolution has been extensively explored in the organizational science
literature (Koza and Lewin 1998; Koza and Lewin 1999; Lewin, Long et al. 1999; McKelvey
1999a; Van den Bosch, Volberda et al. 1999). Properties of co-evolutionary processes have
been defined by Lewin and Volberda (1999) (see Table 3). The value of these properties are
that they highlight the value of CAS as a theoretical lens, and co-evolution specifically, with
which to understand HospMIS development. In Table 3 I highlight the four main properties
that I wish to draw on in developing my theoretical framework for analysis of HospMIS
development.
Table 3: Properties of Co-evolutionary Processes
(Source Lewin and Volberda 1999)Property Description
Multi-levelness and embeddedness
Co-evolution takes place within and between organizations, and between or at micro and macro levels.
Multidirectional causalities
Co-evolution takes place within and between organization parts and their environment. Changes in the environment affect other organizations as well (at both micro and macro levels), and changes in these can create feedback effects in other firms.
Non-linearity Co-evolution can take quite surprising paths as a result of indeterminate feedback paths between agents. These may be the result of lagged and nested effects which are often not anticipated.
Path and history dependence
Variation in adaptation in firms in a population may be the result of heterogeneity in the population at an earlier point in time.
It is only recently that the concept of co-evolution (between organizational and technological
change) has been drawn up in the IS literature to study change (see for instance Jansen and
Nielsen 2005; Kim and Kaplan 2005; Allen and Varga 2006; Benbya and McKelvey 2006b).
While the IS literature has explored organizational change as a result of the interaction with
technology in different ways (see Table 4 for a brief overview), other than the co-evolutionary
view, none explain the type of change we expect to see in CAS. As discussed in section
2.3.4, if an organization is effective at maintaining itself within the zone of complexity, we can
expect to see small evolutionary adjustments being made from time to time, and punctuated
by occasional large changes representing radical innovations.

40
The situated change perspective (Orlikowski 1996) is useful for studying micro-level
organizational change through the interaction with technology. However, it does not account
Table 4: Comparison of Perspectives on Organizational Change as a Result of Interaction with Technology
Perspective on Organizational
Change as a result of interaction with
technology
Main perspective Comment
Planned change (Dunphy and Stace 1988)
Managers are primary source of organizational change. Change is deliberately initiated.
Change is seen as a discrete event and removed from daily organizing practices; Undue importance given to managers role
Technological imperative (for example (Huber 1990)(and technological determinism (Perrow 1967))
Technology drives predictable change
Agency is discounted as a mechanism for introducing change; Too rigid in the current global context of agility, flexibility and innovation; Cannot accommodate “radically tailorable tools” (refer Malone, Lai et al. 1992))
Punctuated equilibrium (Loch and Huberman 1999; Silva and Hirschheim 2007)
Suggest that change does not need to be slow and technology driven; Change happens rapidly, radically and in an episodic manner; Long periods of equilibrium are interrupted by radical change
Regard organizations as stable; A steady state (equilibrium) is regarded as the preferred status
Situated change perspective (Orlikowski 1996) (also called continuous change (Weick 2001))
A micro-level perspective that change is grounded in every-day practices of actors and emerges out of their actions with the environment. This view is presented as a challenge to concepts that: Organizational change must be planned; Technology is the primary cause of technology-based organizational change; Radical changes always occur rapidly and discontinuously.
A useful perspective for understanding gradual change within an organization, and in particular applicable to the health sector. However, it does not explain radical change that is evident in organizational dynamics.
Co-evolutionary theory (Lewin, Long et al. 1999; Lewin and Volberda 1999) and its use in studying information systems (Kim and Kaplan 2005)
Organizations, their populations and their environment as an inter-dependent outcome of managerial actions, institutional influences, and extra-institutional changes (including technological, socio-political, and other phenomena)
They use concepts from CAS to describe macro- and micro-level influences to evolution and adaptation which provide a different understanding of organizational dynamics as a dynamic equilibrium punctuated by periods of radical change.

41
for the observation that gradual change occurs over time, and is punctuated by radical
change occurring unpredictably as a result of “multidirectional causalities” and “nonlinear
feedback” paths (Lewin and Volberda 1999). Co-evolutionary theory accommodates and
explains these patterns. The question that requires more intense discussion though is how is
the co-evolution of technology and organizational change effected in relation to each other?
A partial answer to this question is provided by Benbya and McKelvey (2006a) who describe
seven principles to support “co-evolutionary adaptations of information systems” through a
combination of top-down and bottom-up process (ibid, page 13). While the authors admit that
these principles are still conceptual in nature, and require further testing, they suggest that
they represent a more beneficial approach to ISD than the traditional engineering
perspective. Together they constitute a “co-evolutionary stance” that accommodates frequent
change and non-linear effects of the environment and their impact on software development.
The seven principles are summarized below (Table 5). However, given the
conceptualisations of HospMIS development as a CAS, I would suggest that the principles
do not adequately distinguish between characteristics of the system and characteristics of
the co-evolutionary process. Thus for instance, I would suggest the 7 principles represent
three distinct sets of characteristics of the co-evolutionary software development process,
namely characteristics of the environment (such as adaptive tensions, frequent change rate
and causal intricacy – which manifests as non-linearity), of the software or system that is
developed (namely requisite complexity and modular design – both of which enable a system
to accommodate the characteristics of the environment), and of the process (namely positive
feedback and a co-ordinating rhythm). Table 5 expands on this analysis of the co-
evolutionary stance.
I wish to draw specific attention to one principle of the co-evolutionary stance, namely that of
modularisation as a mechanism to achieve flexibility. While the need for flexibility in HIS has
been described by a few authors (for example (Ramanathan 2005)), its application to
hospital information systems remains limited. Given the difficulties of developing effective
hospital information systems, and understanding the divergent information needs of the
different hospital sub-systems, loose coupling between for example the clinical and
reimbursement systems is advantageous, and allows the independent development of
systems in a decentralized manner (Monteiro 2003). A further view supporting “loose
integration” is presented by Tan, Wen et al. (2005) who draw on the work of Perrow (1999) to
describe the balancing process to maintain IS in the zone of complexity (see Figure 4). By
adjusting the coupling between components of a system, the tension between simplicity and

42
Table 5: Principles of Co-evolutionary Adaptation of HospMIS
(Source Benbya and McKelvey 2006a)
Principle Brief description Critique
Characteristics of the environment:
Adaptive tension The “pressure to change” as a result of contradictions that
arise between the different realities of original intent and changing needs in a complex environment. The system will demonstrate adaptive tensions, and has to be able to accommodate the new realities if it is to remain relevant to organizational needs. The “expansion of diverse requirements” will result in several development spirals. (Benbya and McKelvey 2006, pg 21).
This is a characteristic of the environment in which IS get deployed. The system and process must be able to accommodate adaptive tensions as a design –reality gap (Heeks 2006)
Change rate
This principle is based on the work of Davis (Davis 1982), and suggests that in organizations with a high rate of change, and in which there is a high degree of uncertainty, unexpected issues arise which require “interpretation, articulation and resolution” in real time. IS need to be able to reflect the changing context. In order to achieve this, users and designers need to accommodate one another in an iterative cycle of discovery and adaptation. Rapid development and implementation cycles are suggested, with frequent releases of new versions.
This is a characteristic of the environment, and needs to be accommodated in the information system development and implementation. Changes present as adaptive tensions.
Causal intricacy
Technological, organizational and institutional forces interact to create unexpected effects. These effects influence the system at many levels in unpredictable ways, and provide non-linear forces of change. Benbya and McKelvey (2006) suggest that a “co-evolutionary” stance is needed to recognize that ISD is a “dynamic interplay of co-evolving interactions, relationships and effects.”
This is a characteristic of the environment, and needs to be accommodated by the information system and the implementation process.
Characteristics of the system/software:
Requisite complexity
A system must be able to respond to the changes in the environment – the internal complexity of the system must reflect the external complexity of the environment. Systems need to evolve in order to maintain their ‘fit’ with the changing context in which they are located.
This is a characteristic of the information system or product that is developed
Modular design
After Simon’s (Simon 1969) description of hierarchical systems ability to evolve faster and independently of top-down control, designers develop modular systems which because of decreased interdependencies, improves flexibility and reduces development time.
This is a characteristic of the information system or product that is developed, and is seen as a solution to adaptive tensions.

43
Complex
Simple
Loosely coupled Tightly coupledZone of
complexity
Chaos
Stasis
complexity can be balanced. Tight coupling occurs when the “spatial, temporal, or other
patterns of buffering among components” are lacking, and potentially increases complexity
because flexibility is reduced, and accordingly, the ability to respond to change. Effecting a
looser coupling between components can decrease the complexity and improve flexibility
and ability to accommodate change.
Figure 4: Perrow's Framework of Complexity ( in Tan, Wen, et al (2005))
Principle Brief description Critique
Characteristics of the process:
Positive feedback
Through the process of generating positive feedback developmental spirals are initiated through a bottom-up process. Based on the understanding that “self-organizing agents can create significant new structures and processes apt to create better functioning IS” (Benbya and McKelvey 2006, pg 25).
This is a characteristic of the implementation process. Negative feedback also occurs, and needs to be considered.
Co-ordination rhythm
The dynamic balance between a number of adaptive tensions such as users needs and developers ability to respond to them, top-down control and bottom-up autonomy, and the more unpredictable influences generated by the organization and environment on the technology.
This is a characteristic of the implementation process, and could be viewed as a characteristic of the “co-evolutionary stance”.
44
The “co-evolutionary stance” is therefore seen as a useful framework for understanding the
co-evolution of IS, although it does not adequately explain the nature of the relationship
between organizational and technological change. In particular, the challenge is how to
achieve co-evolution between organizational and technological change within the relatively
rigid bureaucratic structures that health departments and hospitals represent.
In summary, the conceptual framework for understanding the co-evolutionary development of
HospMIS which initially focused on connectivity, feedback and information, and control, has
been expanded with concepts from the co-evolutionary stance (Benbya and McKelvey
2006a). I suggest that a co-evolutionary process is required where HospMIS are being
designed, developed and implemented in situations characterized by adaptive tensions
(some of which, for example, are manifested by a rapid change in information needs, or
access to technology), and non-linearity. These characteristics are a result of causal
intricacies and multi-directional causalities. The design of the HospMIS must reflect the
(requisite) complexity of the context in which it will operate (including the ability to
accommodate rapid change and non-linear effects), and modularization should be employed
to achieve this. The co-evolutionary process must demonstrate a co-ordination rhythm, be
sensitive to the positive (and negative) feedback loops that will emerge, and demonstrate an
ability to respond to the adaptive tensions that arise, and which demand frequent changes.
The co-evolutionary process should utilize self-organizing groups to support decentralized
control, and to manage flow of information between and across structures within the
organization. Maintaining the co-evolutionary process in the zone of complexity can be
achieved by modularization (for example of software components, or self-organizing groups),
and by managing the length and breadth of feedback cycles.
I now explore technological change as an organizational learning process.
c) Characterizing Technological Change as Organizational Learning Conceptualizing organizational change as a co-evolutionary and learning process within the
organization and between the organization and the external environment has recently
received a lot of attention in the organizational science literature (Brown and Duguid 1991;
March 1991; Crossan, Lane et al. 1995; Lewis and Madon 2004). While the body of literature
on organizational learning is extremely large, in this thesis I focus on two main themes of
organizational learning, namely the balance between exploitative and explorative drives in
organizational change (March 1991; Koza and Lewin 1998; Lewin, Long et al. 1999), and the
ability of organizations to absorb new knowledge (Van den Bosch, Volberda et al. 1999). I

45
believe that these provide useful insights with which to explore the co-evolutionary approach
as a partnership between a rigid bureaucratic organization (such as a hospital, or a public
health facility, district, regional or national structure) and an external agency providing
support for HospMIS development.
Balancing exploration and exploitation drives in organizational change: Exploration is the extent to which organizations engage in experimentation and identification
of alternate approaches (March 1991). An organization that engages in exploration activities
undertakes risky behavior, experiments, explores diversity and flexibility and seeks
innovation. On the other hand, exploitation is associated with the refinement of
competencies, technologies and processes in order to increase efficiency. The returns from
exploration are significantly less certain than those from exploitation, are more remote in
time, and efficiency is often compromised (ibid).
Exploitation offers increased returns which are more proximal in nature and fairly predictable,
and therefore are usually more attractive to firms. Adaptive processes usually drive
exploitation because the feedback is immediate and positive, and closely aligned to the part
of the organization which effects the exploitation strategy. Yet, this trend is potentially self-
destructive in that if exploitation is neglected, an organization may become efficient at
performing inferior activities, and never move onto embracing superior activities with which it
has little experience (ibid).
March (1991) models the development and use of knowledge in an organization that exhibits
“mutual learning” between its members and the organizational code, and uses this to suggest
mechanisms for organizations to balance exploitation and exploration drives. I summarize
these findings below. In any organization, individuals modify their beliefs as a result of their
socialization into the organization, and their adoption of its code of beliefs. Similarly, the
organizational code adapts to the beliefs of organizational members whose beliefs
correspond more closely to reality than that of the organizational code. Over time, the
adjustment in beliefs on the part of organizational members, and the organizational code,
results in members beliefs and the code converging. The rate of socialization of
organizational members to the organizational code is usually faster than the rate of
adaptation of the organizational code to the members’ beliefs. Higher rates of learning result
in equilibrium being reached more quickly. Slower socialization of organizational members,
or a turnover of members, maintains diversity, and allows exploration to occur, which
ensures that the knowledge pool within the organization improves. The organizational code
learns from members who deviate from the organizational code, and so equilibrium between
46
the organizational code and members beliefs is reached at a higher knowledge point than
would occur if socialization of members was rapid. Rapid socialization of members results in
less opportunity for the organizational code to learn from members. New organizational
members may have less knowledge on average, but what they know is less redundant than
that in the organizational code, and occasionally better, and they are thus more likely to
contribute to the improving the code. The old-timers in the organization may know more on
average, but their knowledge corresponds closely to the organizational code, and so is
redundant in terms of contributing to the organizational code evolution. Rapid turnover of a
high percentage of staff can result in loss of knowledge from the organizational code, with
resultant loss of exploitation and exploration capabilities.
Turbulent environments (defined as a situation characterized by rapidly changing
environmental reality) make learning from experience difficult. In the absence of turnover,
degeneracy results because the individuals knowledge and the organizational code rapidly
reach equilibrium, and once attained, re-inforce one another and have difficulty in changing
regardless of changes in reality. But even with mild turnover, degeneracy is avoided, and the
code continues to evolve in relation to changing realities.
This review provides a useful framework with which to understand the factors influencing an
organizations ability to absorb knowledge and pursue exploratory or exploitative drives.
Hospitals are organizations with a complex organizational code. Not only does it address
medical practices, but from our point of view must also address hospital information systems.
The above analysis supports the assertion that diversity in teams serves to expand the
organizational code. Importantly, it exposes the factors that contribute to or detract from
knowledge absorption process within organizations. The analysis raises two key issues for
HospMIS implementation in a sustainable manner in resource constrained settings. First,
how does one achieve a balance between exploratory and exploitative drives, especially
given the pressures within the public sector to focus on efficiency rather than innovation?
Secondly, understanding that the organizational code is influenced by the pace of
socialization, and turnover rates, how can knowledge absorption be effected in organizations
that are characterized by high staff turnover, significant staff shortages and lack of IT skills
(Kimaro 2006; Padarath, Chamberlain et al. 2007)? In the next sub-section, I expand the
understanding of organizational capacity to absorb knowledge from the environment by
exploring the concept of organizational absorptive capacity.
47
Organizational Absorptive Capacity: An organizations absorptive capability is defined as the ability of an organization to
assimilate knowledge from the environment (Cohen and Levinthal 1989). Absorptive capacity
is related to both micro- and macro co-evolutionary effects, within the firm and between the
firm and the external environment (Van den Bosch, Volberda et al. 1999). Absorptive
capacity is not only a function of prior related knowledge, but also influenced by the
organizations forms and combinative capabilities (Van den Bosch, Volberda et al. 1999).
Combinative capabilities are described as the ability of a firm to establish links across
individuals’ capabilities within an organization and are assessed in terms of three
dimensions, namely efficiency, scope and flexibility. Efficiency of knowledge absorption is the
ability to identify, assimilate and exploit knowledge from a cost and economy of scale
perspective. Scope of knowledge absorption is the breadth of knowledge that is utilized, and
flexibility of knowledge absorption is the ability to access additional and reconfigure existing
knowledge. Exploitation ability is associated with efficiency of knowledge absorption, while
exploration with scope and flexibility of knowledge absorption.
Three types of combinative capabilities are described. Systems capabilities are the policies,
procedures, and manuals that are used to integrate explicit knowledge. They ensure that
“behaviors are programmed in advance of their execution” (ibid, p 556). They are efficient in
supporting knowledge absorption, but tend to be limited in scope and flexibility, and so their
overall effect on absorptive capacity is regarded as negative. Co-ordination capabilities refer
to the ability to communicate between members of a group, and between groups. They are
effected through natural liaison mechanisms, such as self-organizing groups which cut
across layers of authority (hierarchy) and functional groupings. They are less efficient in
effecting knowledge absorption, but have an ability to be flexible and cover a broad scope of
knowledge absorption, and are therefore considered to have a positive effect on absorptive
capacity. Socializing capabilities reflect the ability of the organization to create a corporate
identity as well as a collective interpretation of reality. Socialization capabilities are path
dependent and shaped by the history of the organization, and tend to foster isolationism. As
a result, organizations with strong socialization capabilities tend to reject outside knowledge
that is different to their organizational code. Socialization capabilities have a negative effect
on absorptive capacity because while they have a high potential for efficiency, they have a
narrow scope and are inflexible.
Table 6 suggests a framework with which to assess organizational absorptive capacity, and
applies this framework to my understanding of a typical public sector hospital in a resource
constrained setting. The analysis suggests that overall, the public sector hospital has a low

48
absorptive capacity. This implies that its ability to accommodate new knowledge related to
expanding the organizational code on ICT is low. This suggestion implies that successful
HospMIS development in resource constrained settings will require specific innovations to
address the low absorptive capacity. This has not received any significant attention in the
ISDC literature.
Table 6: Absorptive Capacity of a Typical Public Sector Hospital in a Resource Constrained Setting
Combinative Capability Hospital as an organization
Explanation Effect on absorptive capability
Organizational form Functional form, or perhaps divisional form depending on size (low scope and low flexibility of knowledge absorption)
Negative
Systems capabilities Bureaucracy with strong and very formalized systems capabilities (low scope and low flexibility of knowledge absorption)
Negative
Co-ordination capabilities
Strong relationships within and across functional groupings in hospitals (high scope and high flexibility of knowledge absorption)
Positive
Socializing capabilities Reasonably strong corporate identity, tending to be insular (low scope and low flexibility of knowledge absorption)
Mostly negative
Overall Combinative Capability Assessment
Mainly negative
Staff turnover Reasonably high with low levels of institutional memory Mainly negative
In this section I have conceptualized the health sector as a CAS. I then highlighted the
application of three characteristics of CAS, namely non-linearity, self-organizing groups and
networks, and co-evolution in the organization science and IS research literature. This
analysis highlighted key elements that have been used to develop a co-evolutionary
framework, which is first detailed below, and then applied to an empirical setting. The chapter
ends with an analysis of the gaps in the literature related to HospMISD in resource
constrained settings that this thesis seeks to address.

49
2.5. Summary of Theoretical Perspective: A Co-evolutionary Framework
The theoretical perspective that I propose is a co-evolutionary framework which provides
insights into the design, development and implementation of HospMIS in contexts that are
characterized by frequent change, non-linearity, and adaptive tensions which are often the
result of causal intricacies and multi-directional causalities. The design of the information
system should reflect the complexity of the context, and should utilize modularization to
maintain flexibility. The co-evolutionary approach represents an analytical process for
studying and also supporting the design, and ongoing development and implementation of
HospMIS. The co-evolutionary approach lays emphasis on the need to demonstrate a co-
ordination rhythm which should include supporting the establishment of self-organizing
groups and networks to gather ideas from a diverse range of stakeholders, in a framework of
decentralized control while maintaining a clear understanding of their roles and
responsibilities. These groups should transect traditional organizational hierarchies and
functional groupings, and should be managed to ensure they communicate effectively, and
are innovative by operating in the zone of complexity. This can be achieved by adjusting the
size of groups, the frequency of feedback sessions and the breadth of information provided
at feedback sessions. Because the design, development and implementation of HospMIS
takes place in public sector hospitals which are characterized as having low absorptive
capacities, innovative approaches will be required to develop sustainable solutions.
I now illustrate my co-evolutionary framework by analyzing the story of a failed hospital
information system installation in a resource constrained setting in South Africa. This
illustration helps to elaborate the potential of the proposed theoretical perspective and also to
describe some of the contours of the concepts I am drawing upon in the analysis of the
hospital information system design, development and implementation..
2.5.1. Applying the Co-evolutionary Framework to HospMISD: Littlejohns, Wyatt et al. (2003) and Mbananga, Madale et al. (2002) provide some insights
into the nature of complexity of HospMISD in resource constrained settings. In describing a
£14million hospital information system project in Limpopo Province of South Africa as a
failure, attributing this to multiple interconnected factors, including:
• infrastructural problems (such as unreliable power supply including surges when the
local bakery switched on its ovens, air conditioning problems and networking
problems),
50
• application problems (such as too many different modules all being implemented at
the same time, some modules not created in time, and aspects of the application
were not reliable and had not been tested)
• organizational problems (poor organization of the implementation left users unhappy,
and the focus on getting the system working rather than on providing quick wins (e.g.
management reports),
• computer malfunctions left unattended for up to 6 weeks. They describe the system
as a failure, and describe reasons for failure as arising from multiple causalities.
In the table below (Table 7), I analyze the case from the complexity perspective, and suggest
how a co-evolutionary approach may have helped to develop alternative strategies.
Strategies are grouped in three main areas, namely the context, the information system
design, and the co-evolutionary approach. The complexities are analyzed at three levels,
related to the external environment, the internal environment, and the hospital information
system.
While it can be argued that the analysis of a failed implementation in a resource constrained
setting is a simplistic way of identifying what should have been done, it is interesting in that it
highlights the value of the co-evolutionary approach and the role of complexity in IS research
(Bada 2002; Silva and Hirschheim 2007). It is also interesting to note that none of the issues
identified in the case were seen to be related to the problem of skills transfer and local
adoption of the new system by the hospital “IT department”. While mechanisms for the
sustainable development and implementation of locally appropriate IS in resource
constrained settings has been identified as an issue that warrants further research (Sahay
2001; Walsham, Robey et al. 2007; Avgerou 2008), this issue has attracted limited attention
(Braa, Monteiro et al. 2004; Lewis and Madon 2004; Madon, Reinhard et al. 2007).

51
Table 7: Application of Theoretical Framework to a Failed Hospital Implementation System in a Resource Constrained Setting
Complexity Strategy to address the complexity
Complexities associated with the external environment
Unanticipated power surges in electricity supply
Context: This is a tricky and unanticipated problem, but not uncommon in resource constrained settings. Co-evolutionary approach: Through adoption of an adaptive process the implementation team should be able to accommodate this eventuality through use of alternate power supplies or other strategies.
Complexities associated with the health system
Differing health cultures between managers and health workers, and different expectations between these levels
Context: This is to be expected in these settings, and can be an asset to the process if the value of diverse opinions is recognized and harnessed by the process. Co-evolutionary approach: Establishment of self-organizing groups within each of the hospitals, clarifying a unifying vision for the system, and clarification of micro- and macro-level priorities.
Complexity Strategy to address the complexity
Health workers reluctant to utilize a system that increased their workload, and which shifted their priorities from patient care to information reporting.
Context: This is a classic problem that is well documented in the literature. Information system design: Design process based on self-organising groups in a participatory and co-evolutionary process as described by (Highsmith III 2000; Alaa and Fitzgerald 2004). Co-evolutionary approach: Through the use of self-organizing groups, clarify expectations and needs of users at different levels of the system. Identify areas of most pressing need, and prioritise implementation there first, using approaches that do not impact on workload, but which would encourage buy-in from users.
Rapid changeover of staff
Context: This is a classic problem that is well documented in the literature. Co-evolutionary approach: Projects of this magnitude should be able to accommodate these unanticipated effects, and address the challenge through adaptation of the implementation process.
Complexities associated with the health information system
Fully integrated software system developed “off-site” and “deposited” in the hospitals for implementation.
Information system design: Modular development, with local customization, and implementation of modules according to local priorities.
Delays in development of modules of system
Co-evolutionary approach: Adapting the implementation plan to bring forward implementation of other modules, or effect implementation in other sites while addressing the delays.

52
Complexity Strategy to address the complexity
Modules not tested prior to implementation
Co-evolutionary approach: Innovation is closely linked to experimentation and testing. Through the use of self-organizing groups, opportunities are created for experimentation and testing prior to full scale implementation.
Too many modules implemented at the same time
Co-evolutionary approach: Recognition of increased complexity and impending chaos, countered by slowing down the process, and reducing the number of modules being implemented at the same time.
Air conditioning problems in server rooms
Co-evolutionary approach: Creating experimentation sites prior to full scale implementation.
Networking problems
Co-evolutionary approach: Creating experimentation sites prior to full scale implementation.
After providing this illustration, I focus on the specifics of my research problem.
2.5.2. Aspects of HospMISD that this thesis seeks to address: Three important issues this research seeks to address are now introduced..
First, is the process of skills transfer and capacity building for IS design, development and
implementation within organizations. In the literature from well resourced settings,
assumptions are generally made that the “IT department” within organizations will drive the
organizational and technological change processes (see for instance Barley 1986; Berg
2001), or will interact with external organizations contracted to support implementation of a
product within the organization (see for instance Ellingsen 2004; Hanseth, Jacucci et al.
2006). In resource constrained settings, the absence of expertise within the IT department is
highlighted (see for instance Kimaro and Nhampossa 2005; Kimaro 2006; Sahay and
Walsham 2006; Sahay, Monteiro et al. 2009), often requiring partnerships to be forged
between the public sector organization and an external support agency. In particular, the
challenge here is to effect knowledge absorption in organizations that are characterized by
high staff turnover, significant staff shortages, lack of IT skills, and having a low absorptive
capacity for new knowledge. How this skill transfer can be carried out in the face of adverse
conditions is an important research issue which has not received the research attention it
deserves.
Secondly, this concern is sharpened by the recognition that the public sector faces a
significant challenge in balancing exploratory and exploitative drives. While strategic choice

53
to pursue exploratory or exploitative drives is important in private sector organizations, I
argue that it is also an important (even if neglected) issue for IS development in the public
sector. Given the relative rigidity of public sector organizations in resource constrained
settings, and their focus on improving efficiency, the evidence suggests that they will be less
effective at pursuing exploratory agendas. This suggests that public sector organizations,
such as hospitals, will be reliant on innovations that are pursued by organizations external to
the public sector. If that is the case, how will this be effected, and what is the nature of the
partnership to enable the skills transfer? These are important questions that require answers
if hospital information systems development is to be sustainable.
A third area that warrants further research is the use of complexity theory to understand
HISD. Despite the recognition by numerous authors of the complex nature of hospital
information systems development (Berg and Goorman 1999; Berg 2001; Ellingsen and
Monteiro 2003; Littlejohns, Wyatt et al. 2003; Ellingsen and Monteiro 2005), few authors
have explicitly used complexity theory to explore IS design and ongoing development. Berg
for instance describes the implementation of patient care information systems (PCIS) as
extremely uncertain and unpredictable, and suggests that these are inherent characteristics
of the process, fed by the complexities of the health care context, the information system
itself, and the number of parties involved in the PCIS implementation. He argues against the
application of business process re-engineering principles to the health sector in a “top-down”
manner because it ignores the complex and unpredictable nature of health care work which
is “knowledge-intensive, professional work typified by a complexity that defies the
predictability and standardisation required for simple re-engineering” (Berg 2001, p 150).

54

55
Chapter 3. RESEARCH METHODS AND CASE OVERVIEW
3.1. Introduction:
This chapter describes the research approach and methods utilized to effect the research
presented in this thesis. It also provides an overview of the case setting. The chapter is
structured as follows: In the next section I first discuss in detail the research approach. In
clarifying my research approach I highlight four key areas – the ontological and
epistemological basis for the study, the use of an action research approach, the qualitative
case study method, and the use of interpretive methods for data analysis. The second main
section details the case setting.
3.2. Research approach:
This thesis draws on an in-depth case study analysis of data gathered since 1992 when I
began working in the Queenstown district in the ECP and first began to be involved in PHC
IS development. It spans research that has been conducted in 4 countries (South Africa,
Malawi, Nigeria, and Zambia) while being a member of the HISP-SA organization as well as
a member of the broader HISP network (Braa, Monteiro et al. 2004; see also www.hisp.info ).
My experience has been influenced by the action research approach adopted by the HISP
network and by the Scandinavian action research tradition in IS development where user
participation, evolutionary approaches, and prototyping are emphasized (Greenbaum and
Kyng 1991). Action research aims at generating new knowledge through taking part in the full
cycle of action, reflection and learning (Wood-Harper 1984; Baskerville and Wood-Harper
1996). While action research is the major modus operandi in generating the empirical data
presented in this thesis, contextualism is the ontological basis for the research.

56
Process
Implementation of a project to strengthen hospital information systems
Context
Need for change imposed on the hospital by a Nationally driven policy
Content
Development of a dataset and installation of a computer programme for data capture and presentation, with accompanying training of staff
Outer context:
The hospital as an “isolated”organisation within the larger ECDoH
Inner context:
The hospital with a fragmented management team and unco-ordinatedenvironment
Figure 5: Contextualism as the Ontological Basis (adapted from Pettigrew 1985)
3.2.1. Ontological and Epistemological Basis for the Study Contextualism emphasizes the importance of the context–content–process axis (Pettigrew
1985; Pettigrew 1987). This model resonates with my understanding of the process of
change that characterized the South African health sector in the post-apartheid era. During
that period, the issues we were trying to address through health sector reform were heavily
influenced by our history, and yet the reform was heavily influenced by the context of the
“new” South Africa. The context-content-process model (depicted in Figure 5 above) allows
an exploration of horizontal influences (historical events) as well as the vertical influences
(policy implementation, reporting requirements) that have contributed to the HIS. The
analysis of change within the organization requires analysis at multiple levels, across time,
and needs to incorporate cross-sectional categories.
These characteristics of contextualism resonate with the use of complexity theory as the
theoretical basis for my research, in that complexity theory provides a mechanism to analyze
actions and interactions at multiple levels of the organization, including networking and self-

57
organizing groups that transect hierarchical and formal groupings over time. Complexity
theory recognizes the multifactoral nature of interactions in complex environments, and their
origin from within and outside the organization. In addition, a key aspect of complexity theory
is the focus on both system and process.
As a researcher, I ascribe to an interpretivist epistemology, which suggests that “our
knowledge of reality is gained only through social constructions such as language,
consciousness, shared meanings, documents, tools and other artifacts.”(McKinney 2002).
Writing about grounded theory, Piantanda, Tananis et al. describe their understanding of the
interpretivist epistemology as “probe(ing) contextual nuances as interpreted by ourselves in
concert with others. ………..through discursive exchanges within the inquiry process we
come to challenge our own self-understandings by bringing our tacit knowledge to light,
recognizing our taken-for-granted assumptions, and examining our preconceptions (and
perhaps misconceptions). In the process, we strive to understand and portray the range of
meanings that we and others might bring to our discursive exchanges, thereby expanding
our capacity to respond wisely within “discursive moments” of practice” (2002, p. 3).
My assumptions about human nature are that actors construct their reality through interaction
with others and their environment (Wood-Harper 1984). The study draws on hermeneutics as
the philosophical stance for understanding the actions and decisions of the health workers
and managers involved in the study. Lee (1994) describes this approach succinctly. He
explains that while the hermeneutic tradition originated in the study of texts, it “has evolved to
address the general problem of how we give meaning to what is unfamiliar and alien” (Lee
1994, pg 148). He explains further that hermeneutic scholars have included “human actions,
group behaviours, and even social institutions…as text analogues”.
3.2.2. Action research approach: Action research has been used as a research approach in IS research since the early 1980’s
(Wood-Harper 1984; Baskerville and Wood-Harper 1998). Its value lies in providing a
mechanism for understanding complex social events in the real world. It allows us to analyze
a “multidimensional world in which it is very difficult to analyze cause and effect” (Wood-
Harper 1984, p. 180). The characteristics of the action research approach are defined and
highlighted below (see Table 8) to provide a basis for explaining my choice of action
research method (Baskerville and Wood-Harper 1998):

58
Table 8: The Application of Action Research Characteristics to this Thesis
Characteristic of action research
Application to the research in this thesis
Action research aims at an increased understanding of an immediate social action
Reasons for certain behaviours (processes, or patterns, or choices) need to be understood from the perspective of the individual involved
Action research simultaneously assists in problem solving and expanding scientific knowledge
This is a key reason for the choice of action research as a research approach. Intervention in IS research need to be effected and evaluated for their appropriateness. This cannot be done through observation or non-interventionist studies alone(Baskerville and Wood-Harper 1996).
Action research is performed collaboratively and aims to be an empowering process.
Contained in this statement are two main reasons why I appreciate the action research approach. First, in many of the resource constrained settings where I have worked, participants in the process have feelings of inferiority, and a sense that their knowledge is insufficient or inferior to that available in the “developed world”. The HISP approach is to emphasize the value of local knowledge developed in the “South” as being of equal value to that from the “North” and often more relevant. Secondly, where there is a constant struggle to increase understanding and address inequities, the action research approach provides a vehicle for joint learning and empowerment. As a “researcher5” I do not assume to have superior knowledge to other participants – rather my experiences and knowledge is different, but has an equivalent value.
Action research is primarily applicable for understanding change processes in social systems
While this is an important aspect of action research, it is secondary to my aim of empowering participants.
Action research uses feedback in a cyclical approach
I use a simplified approach to action research which suggests iterative cycles of action, reflection, and learning. Feedback is inherent in this process. Cycles can be short or long, depending on the aspect under investigation.
There is a strong emphasis in my approach to empowerment and emancipation. This
approach is aligned with the philosophical underpinnings of the FOSS District Health
Information Software (DHIS) which, by design, seeks to empower users in health facilities to
use information for improving the health system. It is also aligned with the HISP vision and
mission statements (see www.hisp.org ). I would not go so far as to suggest that I see myself
as an “emancipator” or “social therapist” (Hirschheim and Klein 1989), but would
acknowledge that my approach and that of HISP fall into the neohumanism paradigm (ibid),
because our iterative, developmental and action research approach utilizing FOSS to support
HISD goes against many of the established mainstream approaches to ISD. Our approach,
5 This is a false term as in an action research cycle, all participants are “researchers”

59
as indicated earlier, fits into the “dissensus” research approach which disrupts and
challenges the dominant structurings of knowledge and social relations (Avgerou 2008).
In summary, the action research methodology provides an extremely useful approach for
exploring, understanding, and learning about the design, development, implementation and
use of IS in the health sector. It provides a mechanism to explore jointly the opportunities for
improvement, while also empowering us. The approach seeks to develop locally appropriate
solutions using available resources.
3.2.3. Qualitative case study method: The use of qualitative research methods is an obvious approach given my research aim to
understand the relationship between technology and its use in a social and cultural context.
An in-depth and longitudinal multi-site case study method has been selected. I have had a
wide range of exposure through opportunities afforded through my association with HISP-SA
and the HISP international network, and related to my doctoral studies. As longitudinal action
research case-studies related to FOSS are an identified research priority in the health sector
of resource constrained settings (Walsham 2001; Walsham and Sahay 2006; Walsham,
Robey et al. 2007; Avgerou 2008), I am aware of the “privilege” I have of working and living
in this context.
In this research, the object of study are the individuals (including myself) working within the
health sector to develop appropriate HIS. The focal level of analysis has varied from the
micro (individuals in health facilities such as clinics, and wards of hospitals, including
managers at various levels of the health system hierarchy), to the macro level (for example
organizational policies and procedures). I am privileged to have been exposed to multiple
sites over extended periods of time, thus affording the opportunity to not only study multiple
sites, but also compare sites, and explore application of concepts between sites within the
action research framework.
The selection of sites for my research has not always been purposeful (Benbasat, Goldstein
et al. 1987), but has been influenced by requests for support (e.g. as in the case of the work
in Zambia), project activities related to HISP-SA (for example the work in hospitals in the
ECP and in Nigeria), and opportunities related to my doctoral studies (for example
contributions made in Zanzibar). However, I differentiate between my exposure to action
research through my professional work as a health information practitioner (HIP) working in
the HISP network, and my prerogative as a researcher to select specific data for analytical

60
purposes. In this thesis I choose to report on my experiences in selected sites based on two
main criteria. First, given that my aim is to focus on the design, development and
implementation of IS in hospitals, these are my primary case study sites. Secondly, I
incorporate experiences from sites where I have a longitudinal exposure, as that affords me
opportunities to explore issues related to sustainability and scaling of HIS. Thirdly, I include
sites where ideas developed in one site have been used and adapted, successfully or
otherwise in other sites, thus testing the generalizability of concepts, theories, or implications
(Walsham 1995).
3.2.4. Interpretive research approach: In conducting the research I use a broadly hermeneutic interpretive approach (Klein and
Myers 1999; Webb and Pollard 2006) in line with my epistemological position, namely to
“enrich people’s understanding of the meanings of their actions, thus increasing the
possibility of mutual communication and influence. By showing what people are doing, it
makes it possible for us to apprehend a new language and form of life.” (Chua 1986).
A framework for guiding interpretive research, and assessing its quality is defined by Klein
and Myers (1999). I use this as a framework to structure my research approach, and to
demonstrate that I meet the criteria for interpretive research (see Table 9 below).
Table 9: Application of Principles for Interpretive Field Research to this Thesis
Principle Brief description Application in this thesis
The fundamental principle of the hermeneutic circle
Fundamental to all other principles, this principle suggests that understanding is achieved by iterating between the interdependent parts and the whole
In the thesis I move between the micro and macro level, and describe steps and processes which impact the whole. This concept is fundamental to the complexity theory, while recognizing that not all individual parts of a large whole are apparent all the time
The principle of contextualization
Provides reflection of the social and historical background of the research setting so that readers understand how the situation under investigation emerged
This principle is particularly relevant to the context of HIS research in the post-apartheid period in South Africa, but also to understand the context in a country like Nigeria. My case studies describe the context using nuances to highlight certain issues (such as “Jigawa … is the sixth Nigerian state to introduce Sharia Law” (Shaw, Mengiste et al. 2007, p. 5)

61
Principle Brief description Application in this thesis
The principle of interaction between researchers and subjects
Provides for critical reflection on how the research data was socially constructed through the interaction between the researcher and participants
This is elaborated upon in section 3.3.8 of this chapter dealing with data analysis
The principle of abstraction and generalization
The mechanism whereby data is interpreted through the above principles to derive theoretical concepts describing the nature of human action
This is elaborated upon in section 5.7 of this thesis
The principle of dialogical reasoning
Requires a sensitivity to the contradictions between the theoretical preconceptions and the actual findings
I address this below in a more detailed discussion.
The principle of multiple interventions
Requires a sensitivity to possible differences in interpretations among participants
I address this below in a more detailed discussion.
The principle of suspicion
Requires sensitivity to possible biases and systematic distortions in the narratives collected from participants
I address this below in a more detailed discussion.
Three of the principles warrant further elaboration here. The principle of dialogical reasoning
requires the researcher to declare the type of interpretivism s/he prefers, declare its roots
and relate the strengths and weaknesses of the approach to the purpose of the research.
This principle has manifested itself in at least two ways in my experience to date. First, I have
indicated my preference for hermeneutic interpretivism, and my support for emancipatory
approaches and the neohumanism paradigm. The strength of these approaches are that they
are closely aligned to the use of complexity theory and co-evolutionary approaches to IS
development which support learning processes through interactions with others and the
environment. However, the weakness that this philosophical approach brings is that in my
enthusiasm to see the “right thing done” I may take the lead and use my “authority” to exert
influence which goes beyond that expected in an action research approach. Secondly, in the
early days of my enrolment as a doctoral student, I was deeply attached to the outcome of
the hospital project in the ECP, so much that it was difficult for me to distance myself from
the project and reflect objectively about the success or otherwise of the project. Similarly a
few years ago I was deeply attached to the DHIS as the “be all and end all” of systems for
use in the South African HIS sector. Over the course of these studies, I have come to realize
for instance that there are roles for other systems to play, and in fact it is advantageous to
have diversity in the sector, and that there are advantages to fluctuating relationships

62
Original Message Sent: 02 July 2009 01:15 PM Hi Vincent I do however have a few comments on your presentation of HISP and DHIS in a timeline, and your use of this in your argumentation later related to scaling and sustainability; HISP here presented as being an external and third partner in hospital system development that would account for sustainability. I find it problematic to find HISP and DHIS described as if it is still deployed and used in the whole WC province. You do not say this explicitly, only that this is what happened in the beginning of the HISP history, but you also do not tell that DHIS is actually not in use in the provincial/city health facilities (or hospitals for that matter). HISP is not an active third partner in WC province - as far as I could find out during my stay recently. On the contrary, both the Provincial health department and the CT City Health have developed their own patient based information systems, where the Province's Primary Health Care Information system (PHCIS)- developed by MSF, UCT and the PGWC in cooperation, with a number of modules - and linked to the hospital system Clinicom (replaces Delta 9), seem to be very comprehensive and promising. Response 1: I forwarded this email to some of the HISP-SA team members, saying “ I find these comments interesting – an [sic] perhaps reflecting a view that we are less open to - namely that the DHIS has essentially "failed" in the Western Cape. Could I ask you to read her comments, and comment from your understanding of the situation whether she is in fact correct?” One of our team forwarded the email on to a colleague who works more closely with the Western Cape DoH than we do, requesting her opinion. This was her reply: Response 2: Sent: 06 July 2009 02:02 PM With regard to Vincent's message - I am not aware that the DHIS has essentially "failed" in the Western Cape. They use Sinjani by choice. They still use DHIS 1.3 to send the data to NDoH. They received an installation CD from Calle for 1.4, but with several outstanding issues and they don't want to use it unless DHIS 1.4 is 100% what it should be. It appears that Calle don't have time to do the corrections (not a good marketing of DHIS). The only message that I get nowadays from them is that they battle with DHIS to export data to data mart to update pivot tables. The IT people then informed them that the data become too much for Access to deal with.
Text Box 3: The Principle of Multiple Interpretations in Practice
between seeking alliances and partnerships sometimes and positioning ourselves as
opponents at other times.
While I have always tried to be aware of the principle of multiple interpretations, it has
recently been presented to me as an issue. In response to my trial defense presentation in
June I received an email from a fellow student who very politely questioned my statement
that the DHIS was in use in all of South Africa, highlighting that as far as she was aware, it
was no longer in use in the Western Cape, and that this raised questions about my statement
that the DHIS has been a sustainable system in South Africa (see Text Box 3 below). My
response to this was to check this with my colleagues who are more familiar with the

63
situation in the Western Cape. The email exchange is transcribed in the text box below to
illustrate the principle in practice, and to highlight that vigilance is constantly required to the
possibility of different interpretations. It is interesting too to observe that the study of CAS
suggests that diversity should be welcomed as it is at the point of interchange between
divergent views that new ideas arise. This principle therefore is closely aligned with those
espoused under CAS theory.
In examining the principle of suspicion, I must admit that this is an issue that I am aware of,
and about which I have reflected critically. For instance, I have been troubled by the fact that
colleagues have written quite extensively about the power-play involved in ISD (see for
instance Puri and Sahay 2004; Sahay, Monteiro et al. 2007; Sahay, Monteiro et al. 2009), yet
I have only raised this issue in passing. Am I ignoring the issue, or choosing to focus on
other priorities? Am I being unfair to my co-researchers by not raising these issues more
openly? I do not as yet have the answers to these questions, but I can suggest that there
may be two reasons behind this apparent discrepancy. First, it may be that these issues are
more prominent in other contexts (such as that in India, which is comparable to half the
African continent for example) where the stakeholders are many more, and the politics play a
more prominent role than in the contexts in which I work. Secondly, perhaps I do raise these
issues but in a more subtle manner (for instance I criticize the National Department of Health
(NDoH) for their stance on hospital datasets (Shaw 2003, p. 8)). When writing about action
research projects, I have always been wary of being overly critical in my approach given that
this may offend colleagues, and jeopardize not only my, but also other research team
members’ ability to gain access to people or data should I be seen to be biased in my
criticism. To this end, I have always tried to be constructively critical, so as to ensure that
doors are not closed on our access.
I conclude this section suggesting that adherence to the principles for interpretive field
studies requires constant vigilance and rigor in the research approach. Perfecting the
technique does not happen overnight but rather as a process of learning and reflection over
time. How we respond to the principles can change from day to day, depending on the
context, and what at that time is seen to be the correct approach. I now provide insight into
the selected research sites.

64
3.3. Research setting:
In this section I describe the fieldwork that was conducted as an introduction to the research
context. Next, the context is described with respect to the ECP of South Africa, Northern
Nigeria, Malawi and Zambia, and then in relation to the HISP-SA organization. I then
describe my role as researcher, the data collection methods, data analysis and use of theory,
and lastly data validation.
3.3.1. Fieldwork Data presented in this thesis is drawn from four research sites. The table below provides an
overview of the amount of time spent on site for each research project, and the total amount
of time allocated to that project. This data is drawn from my diary and timesheets. Figure 6
provides a timeline which demonstrates my employment position or role played, the research
projects relevant to this thesis, and the time period and publication date that the seven
papers that constitute this thesis cover.
Table 10: Distribution of time across project activities
Country Period Total days On site (Notes 1 and 2)
ECP Hospitals April 2004 - March 2005 100 60
Malawi December 2003 - August 2005 161 72
Nigeria Oct 2003 21 20
Feb 2006 - present 200 185
Zambia Feb 2007 – Dec 2008 159 140
Zanzibar 2005 10 10
Total 651 487 Note 1: On-site means working with health care workers or in training sessions with workers, or
attending meetings and discussions, either with team members, or with managers in the health service
at departmental, hospital, provincial/national level
Note 2: The balance of the time (that is difference between on-site and of-site work) was spent on
administrative issues, emails, project management issues and office support (this includes the
production of reports, documents and policies).

65
12
3
4
5
67
Publication date
1997 2000 2003 20061998 1999 2001 2002 2004 2005 2007 2008 2009
Paper 1
1992-97
Paper 2
Paper 3
Paper 4
Paper 5
Paper 6
Paper 7
Med officer Queenstown Act Director Hospitals - Province HISP-SA Manager and team member
Formal Doctoral studies
PHC Info systems ECP Hosp Information systems ECP ECPHospMalawi Hosp
Nigeria PHCZambia PHC
Research / period covered in paperResearch related to thesisEmployment / RoleLegend
Figure 6: Timeline of Research Activities and Publications

66
Most of the publication/development of papers presented in the figure above took place over
a 5-6 year period, but the experiences they describe are drawn from a much longer time
span. Each paper reflects a distinct phase of my professional life and doctoral program. They
also depict the development of my ideas and thinking across a number of areas. For
example, the first papers are far more practice based, and focused on specific technical
issues, while the last papers contain more theoretical insights and pay closer attention to the
close interdependencies between the social and technical aspects of ISD.
The first paper was written just at the time when I was thinking about embarking on the
doctoral program, and still working for the Eastern Cape Provincial Department of Health.
The second paper describes experiences of developing a standardized dataset in a remote
Queenstown region of the ECP from 1992 to 1999, at a time when the health systems were
being reformed with a view to a post-apartheid health system. The third paper is special in
the sense that it is a product of an extremely important phase of my PHD life which was
influenced by Eduardo Jacucci’s field visit to South Africa for his PhD studies and during
which we had many opportunities to discuss experiences in the field, theorise, and develop
ideas. The hospital described in this paper is one of the Provincially Aided Hospitals (PAH)
that were particularly important in my professional life as we were able to develop innovative
programs with them, partly due to the fact that they were legally constituted independently
from government (and could therefore do things differently). The fourth paper is probably the
most significant in the collection seeing that it was published in MIS Quarterly, but it is also
special because I was brought into the writing team just at a time when I discovered CAS
theory as a possible lens through which to view HIS. Being part of a “high-powered team”
involved in developing the paper was a new experience for me, and I enjoyed seeing how the
paper emerged out of the contributions of a wide variety of people. The fifth paper marks an
important milestone as it draws on my experience with the HISP-SA team in 2004/2005
during which we worked in 13 hospitals in the ECP to strengthen their HospMIS – the first
significant project we effected as an independent NGO. The sixth paper is an important piece
for me because the concept of balancing human resource development, access to
technology, and information processing capacity was one which emerged in the HISP-SA
team reflections on challenges in ISD in the Nigerian context. This model still resonates with
me and other practitioners, and should probably be developed further for publication. The
last paper is interesting in that it provides some reflection on 10 years of HISD in Africa
supported by the HISP-SA team. Particularly interesting to me are the approaches to scaling
of HIS that are being considered in Nigeria, and the development of regional networks of
HIPs.

67
3.3.2. The Research Context 1: Eastern Cape Province6:
a) Introduction: Overall indicators for the province: A large portion of the empirical data on which this thesis is based comes from the
development of HospMIS in the ECP. At the time of the project, the post-apartheid reform
process (10 years post 1994) was still ongoing. In this section I provide some insight into the
research context in this province.
Prior to 1994, the ECP consisted of three independent administrations (two of which were
homeland administrations) which had to be merged with one another into a single
administrative unit in the post-apartheid era (see Figure 7). This process was extremely
complicated, and took much longer than initially planned (Engelbrecht and McCoy 1999). Not
only did staff have to change employers and have conditions of service standardised, but
administrative and financial routines had to be homogenised and standardised. At the same
time, at the national level, political processes were recreating boundaries of provinces and
local government areas (which affected the health district boundaries and the hospital
catchment areas), and standards for patient care, drug supplies, and financial allocations
were being determined. Multiple change processes were being enacted at different levels
within and outside of the health care sector.
The ECP has a surface area of 169,580 km2, (that is just less than ¾ the size of the United
Kingdom). It has a population of 7.1 million people, with 65% living in rural areas. The
Province is one of extreme diversity and inequity, and can be described as consisting of two
worlds. It consists of a very well developed western section, around Port Elizabeth, which
falls within the area of the former South Africa; and a more underdeveloped area in the East
which falls into the area known formerly as the Transkei. The indicators differ remarkably
across these two areas, as shown in Table 11, with the Eastern area tending to reflect health
status of a developed country, and the Western area reflecting that of a developing country.
The ECP has an overall unemployment rate 48.5% (but in some areas it is as high as 77% -
this compares with 20.1% in the Western Cape Province and 28.2% in Gauteng Province
(Mahlalela, Rohde et al. 2000)), and 98% of people live in informal housing “… reflecting
traditional unserviced sites. In 2005, only 7% of households have potable water on site and
47% have a flush toilet or pit latrine, reflecting major social backlogs” (Eastern Cape
Development Corporation 2005)
6 A large portion of this section has been published in Shaw, V. (2003).
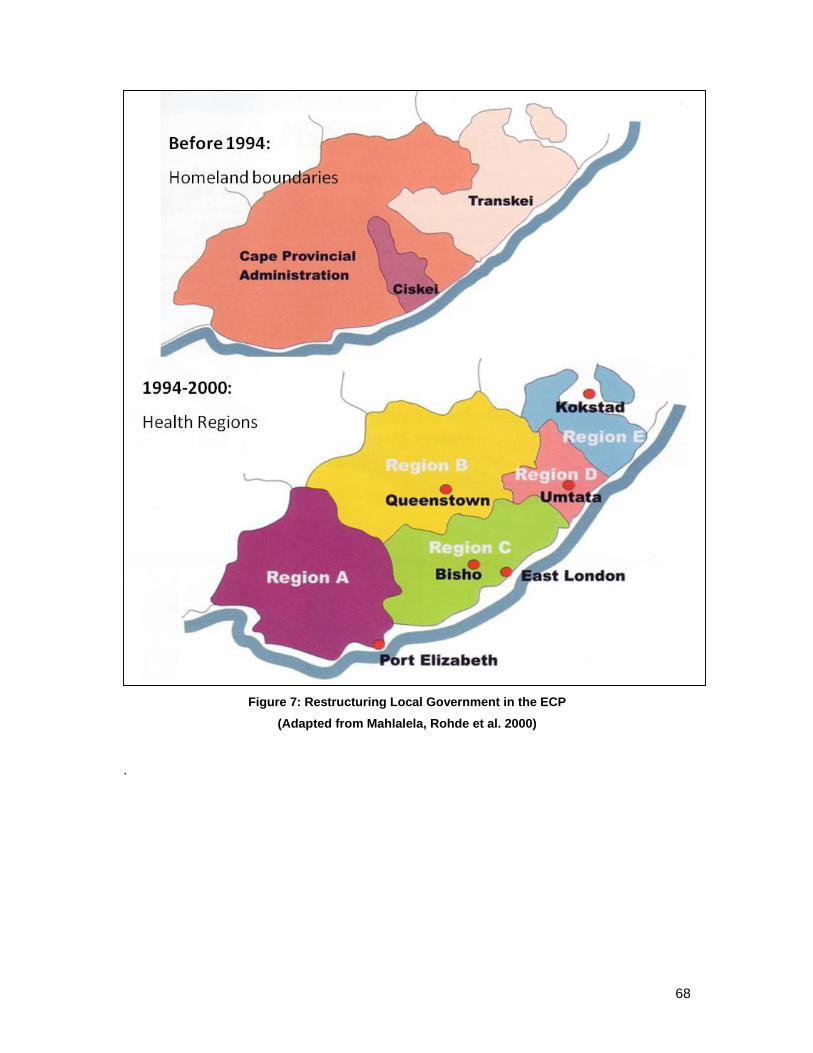
68
Figure 7: Restructuring Local Government in the ECP
(Adapted from Mahlalela, Rohde et al. 2000)
.

69
Table 11: Comparison of Key Indicators
(Source Eastern Cape Development Corporation 2005)
Indicator Eastern Cape
Province
Port Elizabeth Region
Kokstad Region
South Africa
Average
Infant Mortality (1998) (Deaths per 1000 live births)
61.2 35 99 45.4
Under-5 Mortality rate (1998) (Deaths per 1000 live births)
80.5 35 108 59.4
% Clinics with piped water (1999) 61 100 19
% Clinics with water-borne toilets (1998)
72 100 65 100
Percentage children fully immunised
52.6 65 37
% clinics with access to grid electricity (1998)
82.4 100 66
The former Transkei area also has a very poor road infrastructure, with many roads to
hospitals being impassible in the summer rainy months. Vehicles quickly rattle to pieces in
the bad conditions, leaving hospitals with little or no transport to transfer critically ill patients.
In the Western half of the province the road infrastructure is much better developed.
b) Restructuring the health services: Post 1994, the need to re-organize services was highlighted during the development of the
“District Health System” which had to incorporate, within a single structure three homeland
governments (see Figures 7 and 8), and numerous other service providers, both local
government and the fragmented departmental systems. The District Health System that has
emerged consists of clinics providing PHC services and grouped into geographic areas
called sub-districts. Clinics generally refer patients that require more sophisticated care to
district hospitals, or community health centres. The district hospitals in turn refer their
patients to regional hospitals. Each district is managed by a district management team, and
the team is made up of supervisors who work at the sub-district, or district hospital level.
District Managers report directly to the Provincial Management.
The hospitals in the province reflect the same diversity that is reflected in the population
indicators. Infra-structural backlogs need to be addressed, particularly in those hospitals in
the former Transkei area. Inequities exist between staffing ratios in the Western areas,
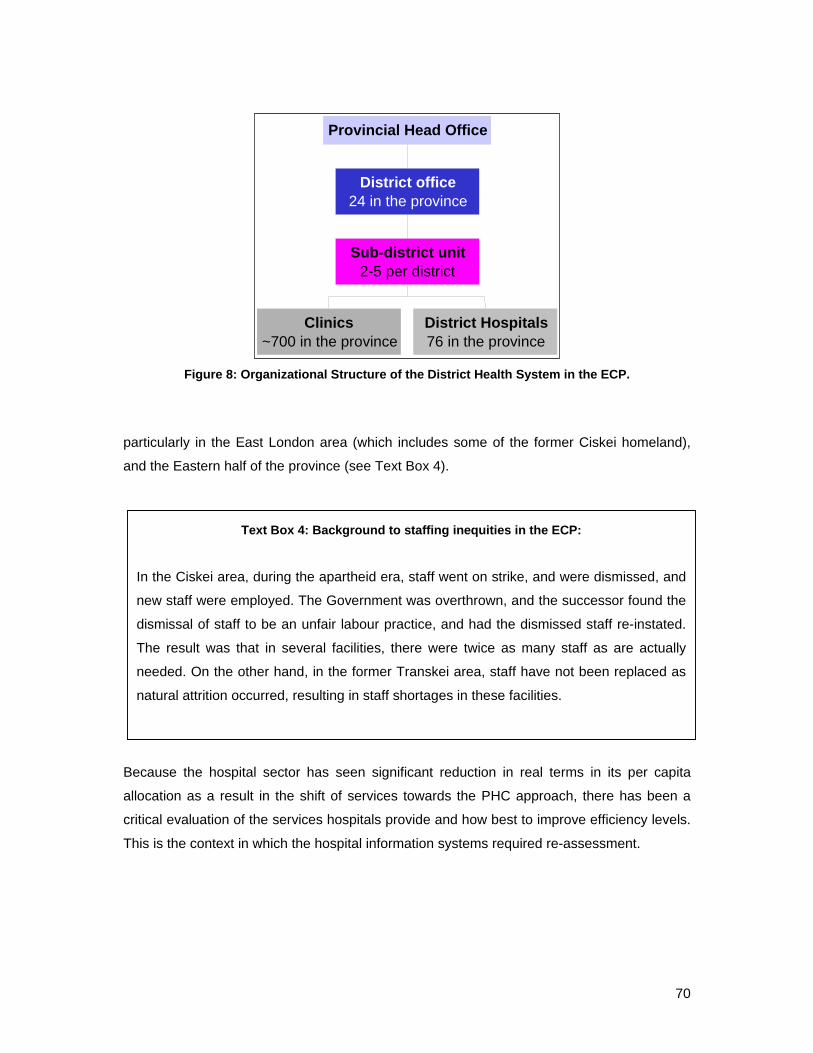
70
Figure 8: Organizational Structure of the District Health System in the ECP.
particularly in the East London area (which includes some of the former Ciskei homeland),
and the Eastern half of the province (see Text Box 4).
Because the hospital sector has seen significant reduction in real terms in its per capita
allocation as a result in the shift of services towards the PHC approach, there has been a
critical evaluation of the services hospitals provide and how best to improve efficiency levels.
This is the context in which the hospital information systems required re-assessment.
Clinics~700 in the province
District Hospitals76 in the province
Sub-district unit2-5 per district
District office24 in the province
Provincial Head Office
Text Box 4: Background to staffing inequities in the ECP:
In the Ciskei area, during the apartheid era, staff went on strike, and were dismissed, and
new staff were employed. The Government was overthrown, and the successor found the
dismissal of staff to be an unfair labour practice, and had the dismissed staff re-instated.
The result was that in several facilities, there were twice as many staff as are actually
needed. On the other hand, in the former Transkei area, staff have not been replaced as
natural attrition occurred, resulting in staff shortages in these facilities.

71
c) Restructuring the health information system: Even today, access to computers and internet are uneven7, as demonstrated by the fact that
some hospitals have access to internet, but this is not universal. Within hospitals, computers
are also not evenly distributed – often the administrative departments are the first to gain
access to computers, reflecting the priorities of those that control the budgets.
The data set for the hospitals in the ECP was determined shortly after the new government
was elected in 1994. It consisted of 13 data elements, and was largely inherited from the
former Cape Provincial Administration dataset. Of these, 5 related to financial data, and were
seldom completed, as many facilities did not have access to the (legacy) computerised
Financial Management System (FMS) that was operational in the former “Cape Provincial
Administration” part of the province, and as a result the collection of these elements were
meaningless. In addition, although clear definitions were provided, data was not collected in
a uniform manner. The result was that the data submitted for a single data element, often
meant different things, depending on the nature of the facility and how the data was
collected. The result was that the data could not be used to compare across facilities. An
example of this was the data element “casualty” visits. In some facilities, casualty patients
and out-patients were seen at the same place, and recorded in a single register. However,
no distinction between these groups was made, and as a result in some instances data
submitted reflected all patients seen in that venue, while in others, it reflected only the
casualty patients.
Data from hospitals was supposed to be submitted regularly to the provincial office.
However, in the provincial office there was no system for collection of this data, its recording,
evaluation, and no feedback to facilities was ever given. A spiral developed whereby facilities
lost interest in the data collected, submission became haphazard, and the data was not used
by anyone at the provincial level.
During 1999, an assessment of information use in various hospitals in the province was
undertaken. The resultant report indicated that:
Data is collected “at all levels in hospitals, but most of it is never used”
Indicators are submitted to the district offices, but give a “very bland picture of
administrative activities, and no feeling of what goes on inside hospitals”
7 Uneven is used in the sense that the diffusion of a technology often does not happen uniformly and
according to priority needs, but is often a haphazard and unequal distribution reflecting the active
social and political networks.
72
“Registers are non-standardised, and tend to be anarchic, and hand written”, and
often on an assortment of different types of paper and books
“analysis of data is minimal at all levels”.
d) Conclusion: This brief analysis provides an understanding of the context in which a large part of the
research takes place (papers 1, 2, 3, 4 and 5 draw on data collected in this province). It
reflects the typical context in resource constrained settings, although the context was
exaggerated by the post-apartheid reform processes. In the next sub-section I provide a brief
overview of the Nigerian context, and thereafter I elaborate briefly on the situation in Malawi
and Zambia.
3.3.3. The Research Context 2: Northern Nigeria8:
a) Introduction: Overall indicators for the province: I have spent most of my time in Nigeria between Jigawa and Kano, two states located in the
north of Nigeria. In this description I focus on the situation in Jigawa as representative of the
area as a whole (see Figure 9).
Jigawa is a relatively new state, having been created out of the Kano state in 1991. Sharia
Law was introduced to the state in August 2000, making it the sixth Nigerian state (out of 37)
to adopt Islamic Law. The state is divided into 27 local government authorities, and state and
local government councillors are democratically elected. The state of basic infrastructure is
weak in Jigawa, as is evidenced by poor electricity supplies, and the absence of a fixed
landline telephone network. Cellphone reception is available in most major centres, although
8 An abridged version of this description was published in Shaw, V., S. Mengiste, et al. (2007)
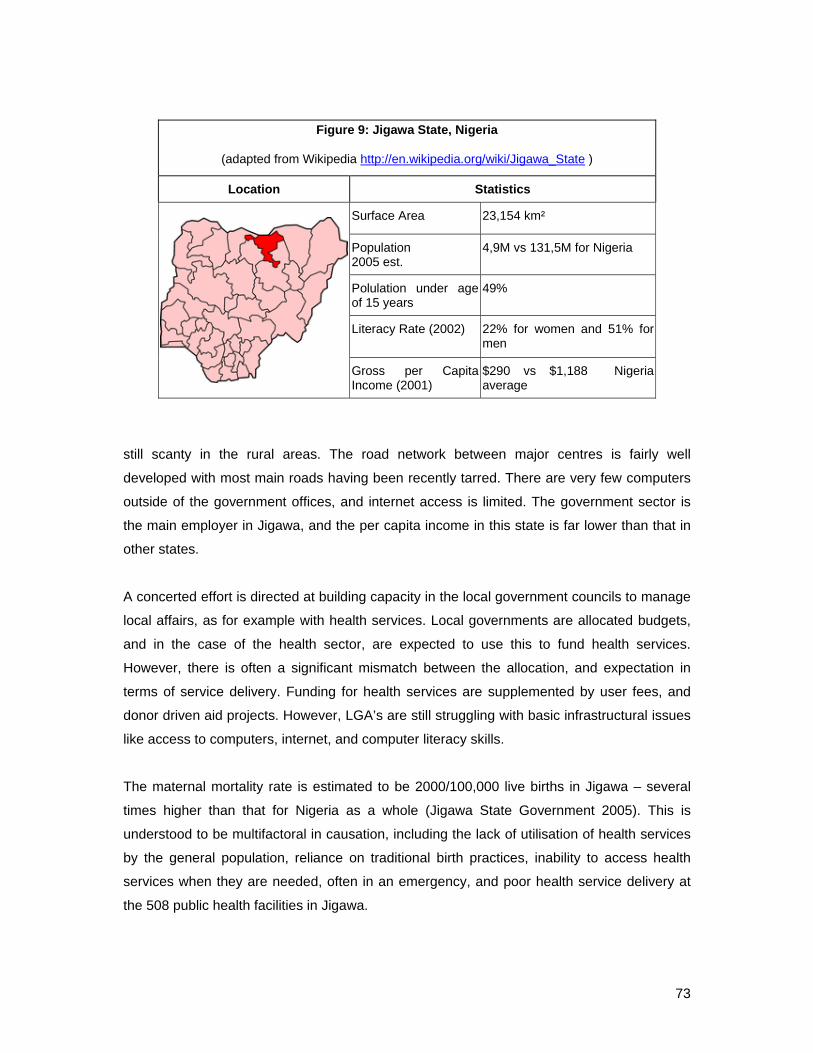
73
still scanty in the rural areas. The road network between major centres is fairly well
developed with most main roads having been recently tarred. There are very few computers
outside of the government offices, and internet access is limited. The government sector is
the main employer in Jigawa, and the per capita income in this state is far lower than that in
other states.
A concerted effort is directed at building capacity in the local government councils to manage
local affairs, as for example with health services. Local governments are allocated budgets,
and in the case of the health sector, are expected to use this to fund health services.
However, there is often a significant mismatch between the allocation, and expectation in
terms of service delivery. Funding for health services are supplemented by user fees, and
donor driven aid projects. However, LGA’s are still struggling with basic infrastructural issues
like access to computers, internet, and computer literacy skills.
The maternal mortality rate is estimated to be 2000/100,000 live births in Jigawa – several
times higher than that for Nigeria as a whole (Jigawa State Government 2005). This is
understood to be multifactoral in causation, including the lack of utilisation of health services
by the general population, reliance on traditional birth practices, inability to access health
services when they are needed, often in an emergency, and poor health service delivery at
the 508 public health facilities in Jigawa.
Figure 9: Jigawa State, Nigeria
(adapted from Wikipedia http://en.wikipedia.org/wiki/Jigawa_State )
Location Statistics
Surface Area 23,154 km²
Population 2005 est.
4,9M vs 131,5M for Nigeria
Polulation under age of 15 years
49%
Literacy Rate (2002) 22% for women and 51% for men
Gross per Capita Income (2001)
$290 vs $1,188 Nigeria average

74
b) Strengthening Health Information Systems: The PATHS project, is a 5 year GBP39 million DFID funded project, which has been
supporting health systems development in 5 states in Nigeria (Jigawa, Kano, Benue, Ekiti,
Enugu) through targeted programme support, particularly to maternal (safe motherhood and
delivery services) and child health programmes, malaria and tuberculosis and sexually
transmitted infections. Supporting the HMIS has been integral to these, and has involved the
development of an essential data set (EDS), the introduction of the DHIS, and the
development of data collection tools. The process of information flow from facility to state
level, and the provision of feedback has been strengthened through numerous training
initiatives, and the development of a data flow policy.
The health system is arranged in a hierarchical fashion, as depicted in Table 12. In this table
we attempt to provide an understanding of the access to electricity and computers. Clearly, in
this context, reliance is made on paper-based HIS for data collection and onward
transmission, from facility, through local government authority level, and up to state level.
However, resources are so limited, even the submission of monthly reports is often delayed
because staff do not have money to transport the forms from the LGA level to the State
HMIS offices.
Table 12: Access to Critical Resources for HIS Strengthening in Jigawa
Hierarchical level
Numbers of staff
Staff involved in the HMIS
Access to computers and electricty
Facilities 508 At least one person in each facility participated in training on use of information
Seldom have access to grid electricity. May have solar panels, which often are non-functional. Rely n paper based data collection, but paper itself is in short supply (see photo of register).
Local government
27 One PHC Co-ordinator (political level) and an Monitoring and Evaluation Officer9
Grid electricity is unreliable. Almost no computers at this level.
State Ministry of Health
1 State HMIS Officer, and 3 data entry clerks
Grid electricity is unreliable, and more often than not reliance is on a generator which usually only runs ”when certain senior officials are in the office”. Three computers and one laptop
9 In reality, there are more people involved at this level, as many of the vertical programmes have their
own “M+E officers” – reflecting the constant battle between integration and verticalization
(fragmentation) of services, especially in an environment which has a large donor driven component

75
Training initiatives have focussed on three main areas – initially all facility staff, local
government PHC co-odinators and M+E officers, and state HMIS officers received training on
the importance of information in health service planning and assessment, and on the use of
indicators for monitoring and evaluation of services. At local government level, the PHC co-
odinators and M+E officers have participated in two three-day workshops during which they
were presented with raw data that had been submitted, and indicators calculated from the
raw data – a very practically orientated training programme aimed at using available
information to assess and improve service delivery. At the state level training on the use of
the DHIS has been provided to the HMIS unit, as this was the only level at which data
capture was possible.
Figure 10: The register in use at a dispensary
Resources like paper, pens, pharmaceuticals, and equipment are scarce. For instance, the
register highlighted above (Figure 10) had three patients names meticulously recorded on a
line that was meant to take one patient’s details – this in an effort to save paper. While it is a
magnificent effort on behalf of the health worker, it is not very easy to determine usage data
from this type of register.

76
c) Conclusion: This brief analysis attempts to show the extremely limited access to electricity and
computers, and low levels of staff computer literacy in a state with a relatively large
population and desperate need for improved health services. Despite these limitations over
the last 5 years, a HIS has been developed and implemented, and at present regular data is
received from approximately 50% of expected facilities (see Figure 11). This is one of the
best HIS in all of Nigeria. The activities reported on here have been described in papers 6
and 7.
Jigawa Reporting Rates 2007
0
50
100
150
200
250
300
350
400
450
500
07-Jan 07-Feb
07-Mar
07-Apr 07-May
07-Jun 07-Jul 07-Aug
07-Sep
07-Oct
07-Nov
07-Dec
Out
stan
ding
repo
rts
(No)
0
10
20
30
40
50
60
70
80
Repo
rting
rate
(%)
Outstanding Reporting rate (%)
Average
Figure 11: Jigawa Reporting Rates for 2007 (source DHIS data as at Feb 2008)
3.3.4. The Research Context 3: Malawi Central Hospitals and Zambia:
a) Malawi Central Hospitals: Compared to the ongoing activities in Nigeria and the ECP Hospitals project, the activities in
Malawi were relatively well circumscribed and concise to effect in that the locations were in
large cities in Malawi, and reasonably reliable access to computers and power supply was
available at least in the HMIS units in each hospitals. The aim of the project was to

77
strengthen the data processing from wards and out-patient units to the HMIS units, so as to
provide data to managers at all levels of the system. These efforts were part of a larger
“Hospital Autonomy Programme”. The key interventions in this project were to enable data to
be disaggregated down to reporting unit level, and the data set was clearly defined and
reduced to a manageable number of data elements. As is reported in the thesis, one of the
main problems in this project was to overcome the heterogeneity in terms of access to
computers in different departments in the hospital, and to gain buy-in from various
departmental heads – many of whom were only interested in clinical service provision and
who viewed any administrative or managerial interventions as an invasion of their
independence.
b) Zambia: The Zambian Ministry of Health (MoH) identified a need to revise their national health
management information system (called the HMIS) because the database in use was not
able to be adjusted to accommodate new reporting requirements. While this database had
been in use since 1996, it was a hard coded access database, and because of its inflexibility,
a multitude of parallel IS were in use in the country to report for instance on HIV/AIDS
indicators, TB data and malaria. We were asked to appraise the system in use, and utilize
the DHIS to integrate the different systems, while ensuring that existing functionality and
reporting abilities were maintained.
The project was EU funded, and five terms of reference were issued related to different
pieces of the HMIS revision. Of these HISP-SA was contracted to work on three of them.
Two interesting aspects about this project require mention. First was that we found that the
envisioned sequence of events (that is, develop and implement the database) would not
work well because it did not make sense to insert a dataset that had not been redefined to
incorporate a comprehensive set of data elements and indicators. Because of our
involvement in a number of consultancies, we were able to effect this re-organization despite
the relative rigidity of the EU contracting mechanism. The result was that we first redefined
the National Indicator Dataset, and then incorporated this into the DHIS database. Secondly,
because of numerous delays on the project, we were placed under pressure by the MoH to
collapse what had been planned as two sequential activities into concurrent activities –
namely gaining consensus on the use of the system and the training materials, and building
capacity in a team of trainers to use the training materials in the roll-out of the revised HMIS
across Zambia. Because HISP-SA was involved in both activities, we decided to structure it
in such a way that we could utilize the trainees to provide input into the draft training

78
materials, and pilot the training materials as part of the capacity building program. A three
phased approach was therefore adopted:
• Expose a group of “potential trainers” to a draft version of the training materials – as
part of their first round of exposure to the materials, allow them to give input into the
local customization of the materials;
• Allow the trainees to use the revised draft to effect a round of “pilot training” to build
their skill as trainers, and to expose the training materials to a second round of
exposure and modification;
• Revise the materials into a final format after these initial rounds of exposure, and then
support the trainees in utilizing the materials to provide another round of training as
part of the final step in their capacity building process.
This description provides another insight into the nature of HospMISD in resource
constrained contexts, namely the frequent need to adjust the implementation strategy to
accommodate deviation from original intent.
3.3.5. The Research Context 4: HISP-SA: Over the period mid 2002 to mid 2009, HISP-SA has grown from a small 6 person
consultancy firm to a 20 person team working in numerous countries on a regular basis. The
way in which we function has had to undergo significant changes, and the organizational
structure has changed as well, such that we now have an middle manager team emerging
between senior management and more junior staff. We continue to have a diversified staff
compliment composed of professional software programmers and staff with IT technical
skills, health personnel (one doctor, several professional nurses, an environmental officer),
educationalists, and administrative staff. There are many interesting facets to HISP-SA. For
instance,
• we operate as a “virtual organization” with our team scattered across 6 centres
(Windhoek, Durban, Cape Town, East London, Pretoria and Johannesburg, Maseru)
and three countries (South Africa, Namibia and Lesotho). This creates opportunities
in that we can utilize staff close to home for projects in and around these centres, but
it also creates challenges in terms of maintaining a coherent team and effecting
regular communication and sharing of experiences;
• despite very little marketing of our skills and products, the use of the DHIS, and our
strategies for supporting HISD continue to be in demand and the demand appears to
be escalating. Yet, what is the optimum size for our organizations and should we
continue to expand in response to demand;

79
• how do we balance the apparent conflicting drives to maintain our organizational
flexibility and informal ethos while also growing and establishing more formal
structure to provides sufficient security to our team members;
• what are the implications of the apparent contradiction between freely sharing our
software and training materials in accordance with the FOSS philosophy, while also
attempting to maintain our position within what is potentially a competitive market;
I raise these issues because they reflect tensions that over the last 4 years have become
increasingly important to explore and manage. These tensions are closely related to the
research described in this thesis, in that a central theme that emerges from this thesis is that
HospMISD requires a team approach to support it. As is discussed below, over the course of
my doctoral studies, I have become increasingly aware of the important role that an
organization like HISP-SA plays in supporting HospMISD in resource constrained settings.
3.3.6. My role as researcher It has been suggested that action research is sometimes branded as “consulting
masquerading as research” (Baskerville and Wood-Harper 1996). To differentiate between
consulting and action research, four factors are identified (ibid, p. 241):
• Researchers require more rigorous documentation than do consultants;
• Researchers require theoretical justifications and consultants require empirical
justifications;
• Consultants operate under tighter time frames and budgetary constraints;
• Consultancies are usually linear (engage, analyze, action, disengage), while the
action research process is cyclical.
A useful framework that builds on this assessment, and which I found useful for my particular
context is presented below (Figure 12) (Cronholm and Goldkuhl 2004)

80
Figure 12: Conceptualizing Action Research as Three Inter-Linked Practices
(Source Cronholm and Goldkuhl 2004, p. 54)
This suggests that the process of conducting action research with respect to effecting a
business change can be viewed as three interacting practices, namely the regular business
practice, the theoretical research practice, and the joint business change practice/empirical
research practice (called JBER practice from now on). This analysis supports my
understanding of the process that I have followed through my career. Using this framework, I
can suggest that the location of the action research that I report on has been in the JBER
practice. It is at this site that I have engaged with colleagues to explore options and
possibilities, and it is at this level that first-order concepts are generated (Van Maanen 1983).
These are the “facts” of the situation and are “the understandings held by the observed
people themselves” (Lee and Baskerville 2003). In the case of an action research cycle, the
“observed people” would include the researcher as a member of the action research team,
who plays two roles, of researcher and change actor (Cronholm and Goldkuhl 2004).
However, when the researcher steps back from the JBER practice, and develops theory,
then second-level constructs are generated. These are the interpretations of interpretations.
I would say that during my specialization as a family practitioner I became aware of the
importance of being a reflective practitioner, but that during my exposure to the doctoral
studies program this aspect has become a more intense part of my professional life. The

81
research process has therefore been an iterative one whereby experiences and new
methods of working have been able to be shared, and tested between research sites – a new
prototype in one site thus came to be tested in another. In this way, prototypes have been
developed and tested, adjusted and then implemented again.
3.3.7. Data collection methods Primary data for this research has been drawn from a number of sources: Most useful has
been a personal diary. I used A4 sized notebooks during the various research projects to
record interaction with people, meeting notes, and decisions. I also used these to record
reflections, most often at the end of the day, or while flying home from an assignment (see
Figure 13). As these diaries are sequential records of daily activities, I have found it easy to
go back to them to re-assess my notes related to a particular event.
In addition I used a camera to document interesting artifacts, flipchart sheets of important
decisions or flow patterns, and meetings and training sessions. At times I recorded meetings
or interviews. If I had recorded a particularly important interaction, I sometimes would listen
to it again in the evenings, and then make notes on my reflections related to the recording.
Sometimes, if I felt I had been party to a particularly interesting process during the day, I
would rather than write my reflections in my diary, dictate my reflections into my recorder.
The luxury of being involved in the research sites, if not the projects themselves, over an
extended period of time, has improved the data quality from two perspectives. Firstly, it has
provided the opportunity to reflect on the changes and progress in the research sites over
time, thus providing insights into the sustainability of certain interventions, and secondly, has
enabled me to develop strong relationships with health workers at all levels of the hierarchy,
which has allowed me to be privy to many “inside” discussions and reflections that I might not
have been exposed to as an external unknown researcher. For instance, in some sites, trust
was not always as deep as it was in the ECP. I recall an instance in Malawi when I was
meeting with the Director of the MoH HMIS unit, to discuss our approach in the central
hospitals, and I asked whether I could record the interview. There was an uncomfortable
pause, and then he responded to say that there was no need to record the discussions as we
would have minutes to summarize the important decisions. I of course agreed to this, but
recount it here to indicate that it is not always appropriate to utilize recording materials, and
in fact, my experience is that the presence of recording materials may detract from
interviewees’ feelings of trust and comfort.
I have on occasion used in-depth interviews with key informants, but this has not been

82
Figure 13: Page from my research diary
Notes re the diary: a) the green marking top left corner – that was inserted later when I was organizing my
field data so that I could reference specific pages when working on themes;
b) the reflections on the previous days activities

83
utilized on a regular basis. On the other hand, focus group discussions, and informal
discussions have been more frequently utilized.
Field visits and direct observation of staff at work have always been a favoured activity for
me. This has been a major source of information and usually extremely stimulating form of
research. It has provided insight into what actually works and what does not, and has been a
useful method to triangulate data. For instance, when the provincial staff had suggested that
“we should not use a certain data collection tool because “it would not work”", we decided to
check this opinion with facility staff who told us while the tool was different to what they were
used to, they were prepared to try it, and in fact subsequently they demanded it because it
improved the way they worked in the facility (Shaw, Simoonga et al. 2008).
In many instances, smaller action research projects within the bigger projects have been
effected, and data sources from these are useful micro-representations of the context. For
example, in trying to understand why data capture processes were slow in Nigeria compared
to other countries in which I have worked, we (my HISP-Nigeria colleagues, the HMIS staff in
the State MoH) delved in depth into the amount of data captured by data capturers on a daily
basis, the hours of electricity available, and the hours worked by the staff. In these processes
reports were drawn up and submitted to the authorities in order to document our findings.
The findings from these assessments informed the action research process, but also
provided useful sources of data for this research.
Secondary data sources such as official documents, reports, policies, guidelines, published
and unpublished materials and other independent evaluation materials have been useful to
provide additional insights, or to triangulate findings. For example, secondary data is utilized
to compare data in the DHIS data base with survey data such as that related to the
demographic and health surveys, and National Immunizations Surveys (see for instance
NICS 2006 Group 2007). This provides another mechanism of triangulating our data and
understanding of the context (see below in relation to data validity).
3.3.8. Data analysis and the use of theory: Interpretive research methods (Walsham 1993) are used to analyze the data. As indicated
earlier, I discern a first-level and second-level data analysis. Second-order constructs feed
back to co-researchers in various ways, either in the same or in other research projects. This
serves to confirm the constructs, or modify them to have them fit better. Through this
process, there is a process of first and second order analysis related to individual

84
components of the whole, and later to a different and more holistic analysis of the whole. In
this way there is a movement from the micro to the macro level and back again, and with
each iterative cycle, my understanding is deepened and evolves. For instance, in the early
days of my doctoral studies, my focus was on the technical aspects of the design of
HospMIS, and then I began to realize that while that was important, it was in fact much more
difficult to deal with the socio-political and organizational issues related to HospMIS
development and implementation, and my understanding related to the intermingling of the
two deepened, particularly related to the identification of the role of the HIP. Later still I
began to realize that none of this would happen without an external support organization like
HISP-SA playing the role that we have played, and so I began to test ideas related to this
both within the team and with people external to the team. To some extent these are macro
level concepts, and rather general and “parsimonious”, as suggested by Langley (1999). But
they are built from the micro level concepts and constructs and behaviours of individuals. I
would suggest therefore that my journey has follows a similar path to the co-evolutionary
organizational learning framework presented in section 5.5.3 of this thesis, with feedback
cycles which serve to refine the concepts and feed forward processes which enable the
exploration of additional or new concepts.
Interpretive analysis of the data has been enhanced by various doctoral activities. These
include PhD Days held at the University of Oslo where students are afforded opportunities to
discuss progress, problems, and draft papers. The process of writing papers, and attending
group seminars has provided opportunities for further reflection and exploration of concepts
and theories.
As I embarked on my doctoral studies, and became exposed to various theories related to IS
research, I tested and played with the theories and my interpretation of the challenges we
faced. Some provided valuable insights, others were less relevant. It was during this period
of exploration that I became aware of complexity science, and in particular CAS, and the
concepts embodied in these theories made a lot of sense for me. I began to interpret my
understanding of reality in terms of theoretical concepts from CAS, and this provided
interesting insights. In this way I moved ideas from the “theoretical research practice”, into
the JBER practice, to test them out and see how they worked. This was thus a process of
deductive reasoning, but the exposure also enabled me to feel more confident in exploring
inductive reasoning processes which were fed by my empirical experiences. Thus, while
initially theory was not prominent in my understanding of the problems on the ground, it
gradually came to be a more prominent feature in my analysis of data. I therefore use theory
as part of the data analysis process, and also as a final product of my research (Walsham

85
1995). The penultimate sub-section of Chapter 5 (that is section 5.7) provides an analysis of
my theoretical contributions and explores how I have generalized from the case study data.
3.3.9. Validity of data Data and interpretations have been triangulated by moving between the micro- and macro
levels to test opinions and claims with workers, managers, and senior managers at different
levels of the health system. Being able to move between these levels has provided
interesting insights and enriched the data. Statistical data in the DHIS has on occasion been
triangulated with national surveys (see for instance Figure 14 below).
DHIS and NCIS Immunisation Coverage Compared
0
20
40
60
80
BC
G <
1
DP
T1 <
1
Hep
B1
<1
OP
V <
1
DP
T3 <
1
Hep
B3
<1
OP
V3
<1
Mea
sles
Fully
imm
. <1
Per
cent
age
DHIS 2005PATHS States NICSNational NICS
Figure 14: DHIS Dayta compared to NICS Survey (Source: 2007 Nigeria Cross-State Data Analysis)
In addition, in order to ensure my interpretations are valid, my approach has been as follows:
• To attempt to adhere to the seven principles for interpretive studies, especially the
interdependencies between them (Klein and Myers 1999);
• To explore my interpretations with colleagues and adjust them where appropriate
based on comments and feedback;
• Attempt to apply the concepts in other sites, and thereby assess their generalizability
beyond the case were they were developed.
My understanding is that those interpretations that are valid will stand the test of time, and
those that aren’t, will be modified and adjusted and replaced by better interpretations.

86

87
Chapter 4. RESEARCH FINDINGS:
4.1. Introduction:
In this chapter, the findings of my research are summarized. Seven papers form the basis of
my contribution. These are listed below. While this thesis focuses on the design and
implementation of sustainable and scalable HospMIS, my theoretical and practical insights
are drawn from research I have conducted in both the PHC and hospital sectors. In section
two I briefly highlight the research question and the key implications that each paper
addresses. In section three I summarise the findings from the papers in a tabular format. This
step demonstrates the progression in the development of concepts across the papers,
highlights the contributions that the papers make, and draws attention to the levels of
analysis used in the papers. Thereafter the findings are synthesized with respect to the first
three research objectives. The chapter concludes with a section in which the specific findings
are linked to my co-evolutionary framework. The overall theoretical and practical contribution
builds on this synthesis in the next chapter.
The papers from which the contributions are drawn are as follows (arranged according to
year of publication):
1. Shaw, V. (2003). The Development of an Information System for District Hospitals. In
S. Krishna & S. Madon (Eds.), The Digital Challenge: Information Technology in the
Development Context: Ashgate.
2. Shaw, V. (2005). Health information system reform in South Africa: developing an
essential data set. Bulletin of the World Health Organization, 2005(83), 632 - 639.
3. Jacucci, E., Shaw, V., & Braa, J. (2006). Standardization of Health Information
Systems in South Africa: The Challenge of Local Sustainability. Information
Technology for Development, 12( 3), 225-239.
4. Braa, J., O. Hanseth, et al. (2007). "Developing Health Information Systems in
Developing Countries - the flexible standards strategy." MIS Quarterly 31(2): 381-402.
5. Shaw, V. (2007, 9 - 12 January 2007). Considering the Options for Hospital
Management Information Systems. Paper presented at the Helena 12th E-Health
Conference, 2007, Bamako, Mali.

88
6. Shaw, V., Mengiste, S., & Braa, J. (2007). Scaling of health information systems in
Nigeria and Ethiopia - Considering the options. Paper presented at the IFIP 9.4, Sao
Paulo, Brazil.
7. Shaw, V. and J. Braa (Forthcoming). "Developed in the South" - an evolutionary and
prototyping approach to developing scalable and sustainable health informatin
systems. Development Informatics and Regional Information Technologies: Theory,
Practice and the Digital Divide. J. Steyn, IGI Global. Vol 3: ICT's for Development in
Africa: Theory, Practice and the Digital Divide.
The way in which papers have contributed to the research objectives as tabulated below:
Table 13: Linking Papers to Research Objectives
Research Objective Paper contributing to this objective
1. Describe the complexities of the environment which influence HospMISD in resource constrained settings
Paper 1 Paper 3 Paper 4 Paper 5
2. Given the complexities of the hospital environment, conduct research and develop theoretical and practical insights related to the design of HospMIS that takes into account the socio-technical resource levels that exist in developing countries
Paper 2 Paper 3 Paper 4 Paper 5
3. Develop theoretical and practical insights into the successful implementation of HospMIS that accommodate unexpected contradictions that arise between the different realities of original intent and changing needs in the implementation process
Paper 1 Paper 3 Paper 4 Paper 5 Paper 6
4. Conduct research into the scaling of HospMIS, especially which aspects of information systems development are universally scalable, and which require local customization
Paper 2 Paper 4 Paper 6 Paper 7
5. Suggest ways in which the design and implementation strategies described will contribute to sustainable health information systems development in developing country contexts
Paper 3 Paper 4 Paper 6 Paper 7
Addressing these research objectives help answer the two research questions that I pose,
namely:
1. Given the complex nature of the hospital environment, what are the socio-technical
considerations that contribute to the design of sustainable and scalable hospital
management information systems in resource constrained settings?

89
2. How can the implementation process be designed to accommodate unexpected
contradictions that arise between the different realities of original intent and changing
needs in the implementation process?
4.2. Summary of individual research papers:
The following sub-sections describe each paper individually, and how they contribute
towards the research objectives. Note that each paper has its own research question which
should not be confused with the research questions posed in this thesis. Rather these
research questions should be seen as contributing towards addressing the research
objectives.
4.2.1. Paper 1: The Development of an Information System for District Hospitals.
This paper (Shaw 2003) describes the processes for defining an EDS and data collection
tools for hospitals in the ECP of South Africa. The central research question that this paper
addresses is as follows:
Given that a hospital can be viewed as living, political and cultural system, what is an
appropriate approach to HospMISD in these organizations?
The case description firstly describes the context in which most of my research into HospMIS
has been conducted, and secondly, the process to develop data collection tools through a
consultative and participatory process. This paper is especially important given the need to
merge three different administrative systems (a heritage from the apartheid government) into
a single common approach.
The key implications from this paper are the following:
• Utilization of a hermeneutic approach (in the sense that the goal of the information
system is to enable users to analyze and interpret information so as to apply it locally
to improve services) is important even if difficult to implement in bureaucracies which
tend to be top-down and linear in nature (define the data set and expect facilities to
submit accurate data). Through an interpretive and exploratory approach HospMIS
can be potentially designed in a way that can contribute to improved data quality and
use of information;

90
• The adoption of this approach is appropriate from the point of view of hospitals being
living, political and cultural systems that are transforming over time. HospMIS must
accordingly be developed in an evolutionary way that encourages participation and
mutual learning in support of these tranformations.
4.2.2. Paper 2: Health information system reform in South Africa: developing an essential data set.
This paper (Shaw 2005) describes the process of defining an EDS in the post-apartheid
period in South Africa, and is a contribution to the debate around developing appropriate IS
for the health sector. The research question that this paper addresses is as follows:
How can health information systems be developed in a way that enables them to be
flexible and adaptive over time?
The case description highlights the importance of integration of health program information
systems (for example an immunization program, or a family planning program). Yet
integration is an approach that is foreign to most managers who are required to report on
their narrow field of work. Many donor programs (for example USG/PEPFAR) and even
multi-lateral organizations (for example the WHO) are also only concerned with a narrow
program focus, and so the process of integrating information is one that requires extensive
consultation and negotiation. Given that it is often a single nurse in the health facility that is
required to report on all the “program” services that s/he delivers, it makes sense that these
are integrated at that level even if they are dis-integrated at higher levels. The case
describes the bottom-up process that began with the development of an EDS (defined as a
set of data elements which “sensitively reflect health service provision” (Braa, Hanseth et al.
2007b, pg 7) and which are clearly defined. This enables data reported from a variety of
health facilities to be aggregated up the health system hierarchy) that integrates program
data in one district and gradually spread to include a regional area, later the province, and
even later all of South Africa.
The key implications of this paper are the following:
• Development of a simple, common data set can help to integrate different vertical
services as an EDS, which provides the foundation to develop a coherent information
system;
• A top-down consultative process provides a forum for reviewing the experiences of
local experimentation;

91
• A small data set (which does not impose onerous reporting requirements on health
facility staff) should be balanced by collection of survey data;
• The use of the information hierarchy allows a flexible system which can
accommodate changes over time;
Published as a “Round-table” discussion, one of the critiques is that the “bottom-up” process
described can lead to chaos and result in incompatible systems (Cibulskis 2005). While this
critique could be justified, in reality we have not seen that happening because it is invariably
at some stage counter-balanced by a top-down negotiation process.
Additional round table responses suggest that the data set is too small (and should include
data related to non-health sector programs). The argument presented is that the EDS should
be driven by the need to have useful information to assist in planning and monitoring all
levels of the health system, including the community level, an aspect that is not discussed in
my paper (Cibulskis 2005). Another respondent suggests that the data set is too large (when
compared to that developed in Ghana)(Adjei 2005). The varying opinions highlight the
intensity of the debate that discussions around a ‘limited’ dataset evoke, and are not
dissimilar to those that were experienced amongst managers in South Africa.
Braa (2005) highlights two issues in his response. Firstly, the EDS is depicted as a hierarchy
of information needs and is a “flexible standard” that balances local experimentation with top-
down national reporting needs. Secondly, the capacity of HIS software (in our case the
DHIS) to store both routine data and survey data is a feature that is still not common in
health information software today, but which allows the EDS to be kept small. The software
should also accommodate changes in the EDS as health information needs change and
expand over time.
4.2.3. Paper 3: Standardization of Health Information Systems in South Africa: The Challenge of Local Sustainability.
This case study (Jacucci, Shaw et al. 2006) provides a useful insight into the context in the
ECP at the time I was involved in developing the HospMIS. The research question that this
paper addresses is as follows:
What factors contribute to the achievement of sustainable health information system
standards?
92
The paper is a contribution to the discussion around creating sustainable HIS, and in
particular, the creation of sustainable standards that support the HIS. The main argument
presented in the paper is that global standards can only be sustainable if they are locally
appropriated and re-invented. The case describes the EDS that had been established for
hospitals in the ECP, and the tools developed to support the data collection process. The
data collection tools can be regarded as a standard, that supports data gathering for the EDS
standard. The case describes how a small rural hospital adopted the EDS standard but,
rather than also adopting the data collection and processing standards, they developed their
own system for collecting and reporting on the EDS standard.
The key observations from this case are:
• that hospital staff are able to differentiate between the goal of the EDS standard
(which must be maintained at all costs), and the mechanism by which data is
collected to meet the EDS standard (and which can be changed to suite local
circumstances);
• by linking different IS together (in this case the financial information system has a
number of indicators that are drawn from the in-patient information system) an
additional incentive is provided to ensure data is of a high quality (if the underlying
information is inaccurate, the financial information will be inaccurate). This is termed
the “layering” of IS on each other; and
• in the face of marginalization of small, rural hospitals, networking between user
groups helps to create sustainable systems (including IS) which can potentially help
to counter the marginalization process.
The implications drawn from this paper are that sustainable HIS are ensured when local
organizations “proactively appropriate what is imposed by the global standard in order to
follow local vision and entrepreneurship” (pg 227). Sustainability is improved through:
• Participatory approaches that encourage local ownership and innovation (in this case,
the appropriation and adaptation of the data collection tools to improve compliance
with the EDS standard;
• Networking amongst individuals and organizations which serve as an institutional
amplifier of the individuals voice; and
• Layering of IS to provide incentives to improve data quality.

93
4.2.4. Paper 4: Developing Health Information Systems in Developing Countries - the flexible standards strategy:
This paper (Braa, Hanseth et al. 2007a) proposes a strategy for the development of IS for the
health sector. The research question that this paper addresses is as follows:
In the face of increasing fragmentation of health services, especially in the face of the
HIV/AIDS epidemic, how can integrated, scalable, and flexible health information
systems be developed?
The paper draws on the HISP experience of development of PHC information systems in
South Africa and Ethiopia mainly, but also highlights issues from Mozambique, Vietnam, and
Botswana, and compares this to the development of the HIS in Thailand (a country where
HISP has not been involved in HISD).
The main findings from the cases are that:
• An attractor is a component of the information system that serves to focus resources
around a new innovation or approach to HIS development;
• The creation of an attractor is an important step in the process of gaining buy-in from
stakeholders for the adoption of the information system. In South Africa the attractor
consists of two flexible, and linked components, which creates a flexible information
system that accommodates the rapidly changing context of a post-apartheid South
Africa. The two attractors are an EDS, and the DHIS that enables the data to be
easily aggregated and analyzed by program managers. Similar to the EDS in South
Africa, data standards are attractors in other countries as well. In Vietnam, the
attractor is the data standards to effect reporting for the MDG’s. In Botswana the
attractor is the agreement to capture all program data in the DHIS, while in Ethiopia it
is the use of an ART software system.
• While the creation of the attractor is seen as an initial step to the solution of a specific
problem, once the initial problem is addressed, the IS naturally moves forward to
address the next problem, and so it slowly develops, enrolling new actors as the
attractor shifts focus.
• Gateways are another flexible standard that support the flow of data. Three types of
gateways are defined, namely paper-paper, paper-computer, and computer-computer
gateways. The Ethiopian case is used to demonstrate the use of a variety of types of
gateways at different levels of the hierarchy to address the uneven access to
technology.
• Gateways are important to allow the seamless scaling of HIS as access to technology
increases and as computers and internet access become available in the periphery

94
and gradually replace the paper-based systems – they are thus a standard that
supports the development of a robust and scalable information system in the typical
context of a developing country setting where there is extreme heterogeneity
regarding access to technology.
The key implication from this paper is the recognition that HISD takes place in a complex
environment, and that the HIS’s need to be able to respond to these complexities. Two
strategies are proposed based on two principles.
The strategies are to create attractors (which may be standards) and to ensure that they are
flexible and therefore adaptive to changes in the environment in which they operate. This is
based on two interlinked principles. One principle is the principle of flexible standards, which
suggests that standards should be developed in such a way that they are able to change
over time. The second principle is the principle of integrated independence, which allows
innovation and experimentation to occur while pursuing the goal of the standard.
The principle of flexible standards:
• Standards should be simple and small by clearly defining their use domains and
geographical areas, and by limiting their functional scope. By adhering to this
principle, the complexity of a standard is reduced because the constituting actor
network is also kept small and simple and therefore manageable. This decreases
the technical complexity of the standard, as well as the organizational complexity
of the role-players that are involved in the use of the standard.
• Use flexibility (the ability to use a standard in a number of different environments
or for different purposes) and change flexibility (the ability to effect a change
without disrupting the system) are important characteristics of flexible standards.
• Change flexibility is achieved through modularization. The standards described
(the EDS, and the DHIS) can easily be changed without disrupting the whole
system because they are composed of smaller units or modules (a data collection
form, data elements, or indicators) which can easily be changed. Standards are
modularized vertically or horizontally.
o Vertical modularization refers to the traditional layering of software where one
layer offers services to the layer above. In the HISP experience, the data layer
has been separated from the data communication layer, allowing the data to
be transmitted by whatever system is appropriate (paper, electronic or internet
based).
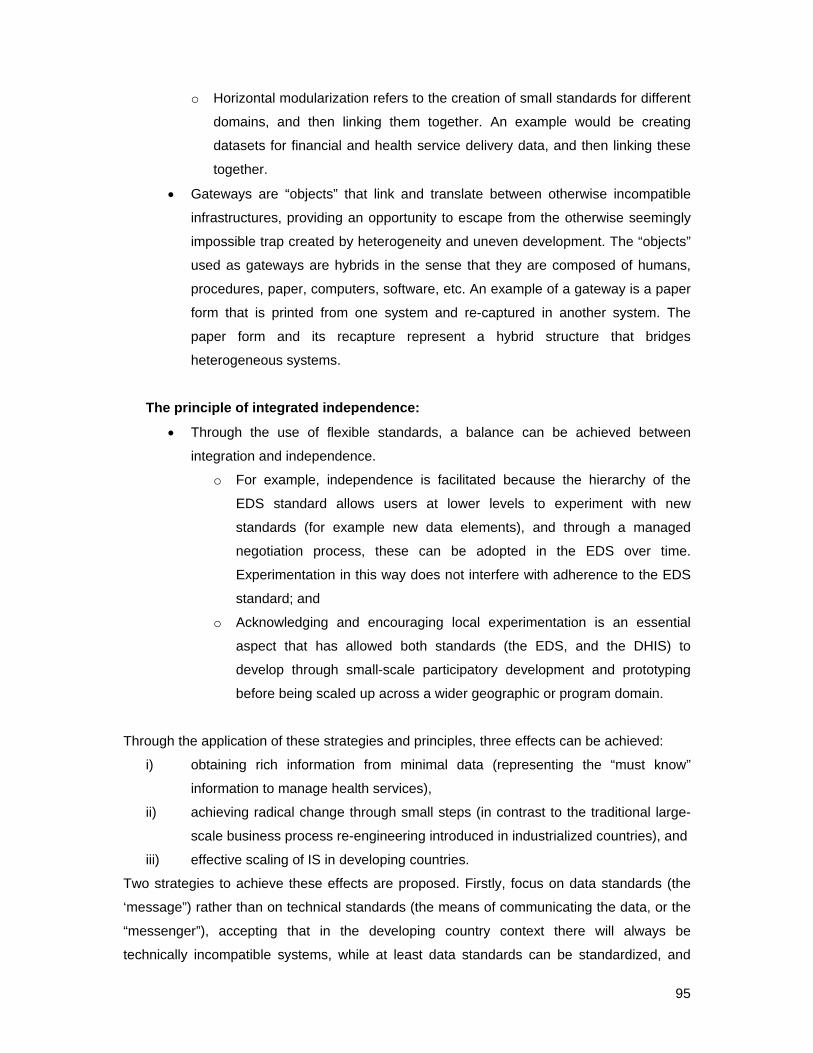
95
o Horizontal modularization refers to the creation of small standards for different
domains, and then linking them together. An example would be creating
datasets for financial and health service delivery data, and then linking these
together.
• Gateways are “objects” that link and translate between otherwise incompatible
infrastructures, providing an opportunity to escape from the otherwise seemingly
impossible trap created by heterogeneity and uneven development. The “objects”
used as gateways are hybrids in the sense that they are composed of humans,
procedures, paper, computers, software, etc. An example of a gateway is a paper
form that is printed from one system and re-captured in another system. The
paper form and its recapture represent a hybrid structure that bridges
heterogeneous systems.
The principle of integrated independence:
• Through the use of flexible standards, a balance can be achieved between
integration and independence.
o For example, independence is facilitated because the hierarchy of the
EDS standard allows users at lower levels to experiment with new
standards (for example new data elements), and through a managed
negotiation process, these can be adopted in the EDS over time.
Experimentation in this way does not interfere with adherence to the EDS
standard; and
o Acknowledging and encouraging local experimentation is an essential
aspect that has allowed both standards (the EDS, and the DHIS) to
develop through small-scale participatory development and prototyping
before being scaled up across a wider geographic or program domain.
Through the application of these strategies and principles, three effects can be achieved:
i) obtaining rich information from minimal data (representing the “must know”
information to manage health services),
ii) achieving radical change through small steps (in contrast to the traditional large-
scale business process re-engineering introduced in industrialized countries), and
iii) effective scaling of IS in developing countries.
Two strategies to achieve these effects are proposed. Firstly, focus on data standards (the
‘message”) rather than on technical standards (the means of communicating the data, or the
“messenger”), accepting that in the developing country context there will always be
technically incompatible systems, while at least data standards can be standardized, and

96
scaled across geographic and program domains. Secondly, gateways can effect seamless
flows between incompatible systems.
4.2.5. Paper 5: Considering the Options for Hospital Management Information Systems.
This paper (Shaw 2007) contributes to the discussion on the development of sustainable
hospital information systems development in developing country contexts. The research
question that this paper addresses is as follows:
What are the key design and implementation approaches for hospital management
information systems?
The paper begins by identifying the factors that complicate IS development in hospitals,
namely the organizational complexities of the hospital context, the heterogeneous
interoperability (the problem of integrating different software systems), and semantic
interoperability (the different systems may not use the same naming conventions) that exist
in different systems used in hospitals. These create difficulties in achieving a balance
between loose and tight integration of sub-systems. Implementation is further complicated by
the politics around expensive hospital information systems and the invariable desire of
decision makers to “go big”. The environment also complicates the development of HospMIS,
especially where power supply is irregular and where computers cannot be housed in secure
and dust free environments.
An example from the ECP HospMIS strengthening project is used, where gateways integrate
financial information from the legacy system with health service data in the DHIS (refer
Figure 15 below). Three strategies are suggested to overcome some of the difficulties listed
above. The first strategy is to use gateways of different kinds (paper-paper, paper-computer,
and database-database) are used to successfully overcome heterogeneous and semantic
interoperability. The second strategy is to “craft the gateway on the spot”. The resultant
gateway is influenced by
o the skills available in the team working on the system (as no programmer was
directly available, a “non-electronic” solution had to be crafted);
o the access to technology – in this case internet access was limited, and so too
access to the centrally managed financial information system;
97
o defining the degree of data granularity that is appropriate. As is depicted in the
figure below, we merge data from two accounts into a single account (a
simplification of the original situation, which results in coarser data granularity
of aggregated data). The merged data is captured in an aggregated form at
the hospital level (rather than disaggregated to cost centres within the
hospital). This is the result of an assessment of the level of available effort to
effect the data capture (more staff would have been needed to capture data at
each cost centre within the hospital), and also influenced by the availability of
computers, and staff skills.
FMS database
Paper printout of financial
data from two accounts
Accounts combined into single values for hospital
Data physically captured in
DHIS
(Fin database)
Exported to stiffy disk, flash, or
emailed as comma
delimited file
Imported into DHIS (Hospital database) and
included in integrated
management report
Figure 15: Crafting Gateways to Link Heterogeneous Components
The third strategy is to support the development of a new cadre of HIP through transfer of
skills between the HISP facilitator and hospital staff. Initially information officers in the
hospitals had only basic computer skills, but gradually they developed their skills through the
process of developing the HospIS. Skills development takes place between two ends of a
spectrum, from the highly developed skills of a programmer, to the highly developed skills of
a health worker, and gradually the two develop skills from each other as the HospIS is
developed through an evolutionary and developmental approach.
The implications for HospMIS development are that given the difficulties experienced,
gateways should be used to bridge heterogeneous systems. The type of gateway that is

98
crafted on the spot is dependent on three issues, namely the level of sophistication of the
technology that is available, the skills levels of the users (and their ability to manage the
changes), and the volume of data (granularity) that can be processed.
4.2.6. Paper 6: Scaling of health information systems in Nigeria and Ethiopia - Considering the options.
This paper (Shaw, Mengiste et al. 2007) addresses the research question posed by Sahay
(2005) namely which aspects of an IS can be scaled “unproblematically” and which require
local customization? Two cases are presented describing the development of PHC
information systems in Jigawa State in Northern Nigeria and Amhara Regional State in
Ethiopia. The two states are specifically selected because their different resource levels
demanded distinctly different approaches to the development of the HIS. In Amhara Region,
access to ICT has increased dramatically in the region as part of a governmental initiative,
while in Jigawa outside of the main centers, ICT infrastructure is extremely weak. However,
in Jigawa the staffing levels are higher (even if skills are low), while in Amhara the staffing
levels are extremely poor.
The effect of these differences is that in Jigawa, the EDS is limited to 74 data elements, and
reliance is placed on paper-based reporting from facility level to state level where data is
captured. While plans exist for initiating decentralized data capture, these are limited given
the lack of access to computers, reliable power supplies and a secure environment for
placement of computers. In contrast, in Amhara, with the introduction of the DHIS, and
provision of ICT infrastructure at the zonal and even the level below this, the “Woreda” level,
the data flow changed and it was possible to capture data that was disaggregated to the
facility level. This resulted in a tenfold increase in the volume of data to be captured because,
in the past, data had been aggregated at the woreda level. A training program was initiated
but on review a few months later, none of the trainees had successfully installed the DHIS on
their computers. The reasons for this failure are ascribed to the low level of computer literacy
amongst the staff, and unfamiliar procedures that they had to undertake to install the system.
The cases are used to highlight the following:
• The interplay between three dimensions of IS, relating to data (or information needs),
technology, and human resources. Each of these dimensions represent a spectrum of
possibilities, from simple and undeveloped (at the narrow end of the spectrum), to
sophisticated and advanced (at the broad end of the spectrum). The interplay

99
between the dimensions are presented below as a Process for Accommodating Non-
linearity (PAN Model) (Figure 16). Development (or scaling) of
Figure 16: Considering the Spheres of ISD when effecting Geographic Scaling
the system occurs in iterative cycles which balance access to human resources and
technology as demand for data and use of information changes.
• The three dimensions are interlinked with one another in complex ways, requiring a
sensitive approach to addressing data demands. In Jigawa data volume was kept low
because of poor access to technology. In Amhara, the volume of data could be
increased (in other words more finely grained data could be captured) because of
access to technology, although this was tempered by the lack of computer literacy
among staff.
Data Management
spectrum
High volume/ highly granular
Highly skilledstaff and adequate numbers
Staff skills low and/or low staff numbers
Human resources spectrum
Technical resourcesspectrum
Poor access to
technology
Well developedinfrastructure with access to computers and
internet
Use of information
Low volume/ low
granularity

100
• An approach to ISD is advocated based on the concept of “mindful innovation”
(Swanson and Ramiller 2004). Mindful innovation was originally suggested as an
approach to avoid failures in high-reliability organizations that are faced with
vulnerability, complex processes and complex technology (Weick, Sutcliffe et al.
1999). The concept of mindful innovation used in this research focuses on three
characteristics of mindfulness, namely pre-occupation with the possibility of failure,
commitment to resilience, and sensitivity to operations. We suggest that these are
useful characteristics to bear in mind as scaling of IS occurs since changes in one
dimension impacts on the others requiring sensitive and ongoing adjustments.
The implications for scaling HIS are as follows:
• There are three dimensions that need to be considered when scaling HIS, namely
human resources, technical resources and data management. These three
dimensions interact with one another in complex ways, and changes in one
dimension influence the others;
• There are two standards that are important to effect scaling in developing country
contexts, namely the creation of data standards, such as the EDS, and the use of
gateways to effect seamless flow between heterogeneous systems. These standards
are a necessary pre-requisite to accommodate the scaling of HIS that often occurs in
an uneven manner (whether the scaling takes place across the geographic scope, or
expansion of program data, or the expansion in access to technology);
• A strategy of mindful innovation should be adopted to balance changes in the three
dimensions as scaling occurs.
In addressing the research question, two main conclusions are drawn. First, scaling
processes can use standards and must accommodate the interplay between the three
dimensions described above. These principles can be applied universally. Secondly, the
application of these principles must be balanced by adaptation and adjustment processes
that are uncultured in the mindful innovation approach to ensure the HIS is responsive to the
local context. The research question is therefore answered as follows: “flexible standards”
are strategies that can be scaled on a global level, but for the successful scaling of HIS, it
has to be accompanied by a local cultivation process that balances the dimensions of volume
of data, access to technology, and human capacity.
101
4.2.7. Paper 7: “Developed in the South” – an evolutionary and prototyping approach to developing scalable and sustainable health information systems.
This paper (Shaw and Braa Forthcoming) provides an overview of the HISP-SA experience
in HISD in Africa over a 10 year period, particularly focusing on efforts towards scaling HIS
and sustainable HISD. The research question that this paper addresses is:
What are the design and implementation strategies that have contributed towards
sustainable and scalable health information systems in resource constrained
contexts?
The paper presents the challenges associated with ISD in Africa, highlighting the uneven
access to technology, low level of resources including paper, power supply, and especially
human resources. These conditions are influenced by social and political practices which
reflect vested interests and inappropriate decision making processes. Consequently, the
HISP approach adopts a multi-dimensional perspective acknowledging the complex interplay
between individuals, technology and organizations making the information system beyond
the control of any single individual. The challenge in many developing countries is to not only
develop an appropriate HIS, but also to be able to scale and sustain it in a context which is
rapidly changing, not only in terms of health sector demands, but also in terms of access to
technology.
The paper presents a brief background to the HISP network, followed by a rationale for
participatory and evolutionary design. Recent literature on scaling of HIS is discussed. The
paper then describes three main areas of HISP’s experience, namely the incremental
approach to software development, the development of HR capacity through development of
a cadre of “HIPs”, and lastly the approach to HIS scaling. The key points from the case study
are as follows:
• Regarding software development:
o The DHIS is FOSS that requires ongoing and local configuration;
o As evidenced over a 10 year period, software development happens as an
iterative process influenced by user demands as the geographic and
functionality scope increased. Scaling thus occurs across three domains of
geography, software functionality, and user needs;
o While most of the software development is managed by the HISP-SA team,
there are notable examples where developers in widely dispersed locations
contribute to software development;

102
o The impetus for the use of the system comes from surprising quarters, and
unexpected effects. For example, the requirement by the NDoH that the DHIS
be used for quarterly reporting system. This helps establish the DHIS as an
“attractor” for submission of these reports, and has as a result forced a re-
alignment of reporting from other systems with the DHIS standards);
o As the system develops, it becomes more sophisticated, and users as a result
also become more sophisticated in their understanding of the system and in
its use. This forces the HISP-SA team to carefully consider its own team
composition, and team development strategies;
• Regarding human capacity development for sustainable HISD:
o There is a great deal of variety in terms of people’s ability to use computers
and understand HIS. The HISP-SA team have to be prepared to begin the
process of capacity development at whatever point in the spectrum from basic
user to advanced developer the user is placed. As a result, the HISP-SA team
must be multi-skilled, and have a range of tools at their disposal;
o Development of capacity in the HISP-SA team requires a conscious process
over a long period of time, ensuring a balance between health professionals
and developers, doctors and nurses and other allied professions, and
recruitment from the public sector and sources outside the public sector. The
balance within the HISP team is always challenged by changing demands for
information and changes within the public sector;
o Identification of the new cadre of HIP is an important step in recognizing HIS
as a new and emerging field in the health sector;
o The original concept of “networks of action” expands with the establishment of
regional networks of HIPs between teams located in South Africa, Zambia,
and Nigeria;
• With regards to sustainable HISD
o Innovative approaches to scaling HIS are being considered – the traditional
pattern of scaling uniformly across a country has been applied in Zambia
(following the South African approach), whereas in Nigeria, in response to
slow progress with the “standard approach”, two alternative approaches are
being piloted – the “prioritized sample” approach (where the busiest facilities
across a state are selected for focused HISD support, and the “hierarchical
cluster” approach where a cluster of facilities linked by referral patterns are
selected for integrated support, not only for HISD but also for other maternal
and child health support programs; and

103
o These approaches paradoxically increase the unevenness of the landscape,
yet it is hoped that they will suggest a more appropriate response to resource
availability
The analysis and discussion section first explores the scaling of HIS as an iterative approach
across the three domains described above. Secondly, the analysis and discussion section
summarizes the requirements for sustainable HISD in Africa. This last section draws on the
flexible standards concept to overcome heterogeneity and effect seamless scaling. FOSS is
regarded as an appropriate approach in Africa where there is already a widespread culture of
“ubuntu” and sharing, and continued innovation in support of small-scale bottom-up
development processes that are complimented by top-down strategies. The paper also
suggests that future research is needed into the different scaling approaches, and the
emergence of regional networks of HIS practitioners, complemented by links to academia
and non-governmental organizations.
4.3. A comparison across papers:
In this section I summarize the findings from the papers in a table format. The first column
indicates the paper, while the second column highlights the facets of the complexity which
the paper addresses – either complexity related to the context, or related to HISD. The third
column identifies the level of analysis of each paper, and the significance of the paper or of
the findings. The last column summarizes the product and process that is described in the
paper. The product is often related to the design of a component of the HIS while the process
is related to the process associated with the product design, development or implementation.
Viewed from a CAS perspective, product and process are emphasized as they are closely
intertwined in their interactions, and this is a key difference between viewing ISD as a CAS
compared to standard reductionist approaches.
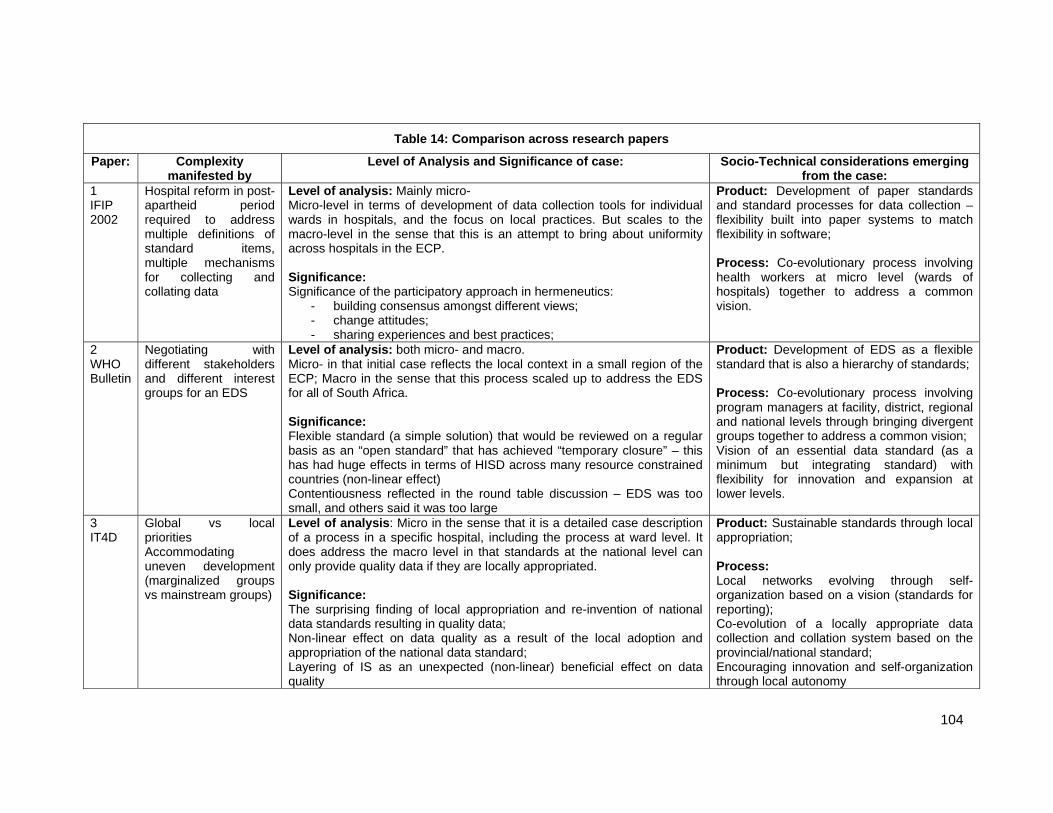
104
Table 14: Comparison across research papers
Paper: Complexity manifested by
Level of Analysis and Significance of case: Socio-Technical considerations emerging from the case:
1 IFIP 2002
Hospital reform in post-apartheid period required to address multiple definitions of standard items, multiple mechanisms for collecting and collating data
Level of analysis: Mainly micro- Micro-level in terms of development of data collection tools for individual wards in hospitals, and the focus on local practices. But scales to the macro-level in the sense that this is an attempt to bring about uniformity across hospitals in the ECP. Significance: Significance of the participatory approach in hermeneutics:
- building consensus amongst different views; - change attitudes; - sharing experiences and best practices;
Product: Development of paper standards and standard processes for data collection – flexibility built into paper systems to match flexibility in software; Process: Co-evolutionary process involving health workers at micro level (wards of hospitals) together to address a common vision.
2 WHO Bulletin
Negotiating with different stakeholders and different interest groups for an EDS
Level of analysis: both micro- and macro. Micro- in that initial case reflects the local context in a small region of the ECP; Macro in the sense that this process scaled up to address the EDS for all of South Africa. Significance: Flexible standard (a simple solution) that would be reviewed on a regular basis as an “open standard” that has achieved “temporary closure” – this has had huge effects in terms of HISD across many resource constrained countries (non-linear effect) Contentiousness reflected in the round table discussion – EDS was too small, and others said it was too large
Product: Development of EDS as a flexible standard that is also a hierarchy of standards; Process: Co-evolutionary process involving program managers at facility, district, regional and national levels through bringing divergent groups together to address a common vision; Vision of an essential data standard (as a minimum but integrating standard) with flexibility for innovation and expansion at lower levels.
3 IT4D
Global vs local priorities Accommodating uneven development (marginalized groups vs mainstream groups)
Level of analysis: Micro in the sense that it is a detailed case description of a process in a specific hospital, including the process at ward level. It does address the macro level in that standards at the national level can only provide quality data if they are locally appropriated. Significance: The surprising finding of local appropriation and re-invention of national data standards resulting in quality data; Non-linear effect on data quality as a result of the local adoption and appropriation of the national data standard; Layering of IS as an unexpected (non-linear) beneficial effect on data quality
Product: Sustainable standards through local appropriation; Process: Local networks evolving through self-organization based on a vision (standards for reporting); Co-evolution of a locally appropriate data collection and collation system based on the provincial/national standard; Encouraging innovation and self-organization through local autonomy
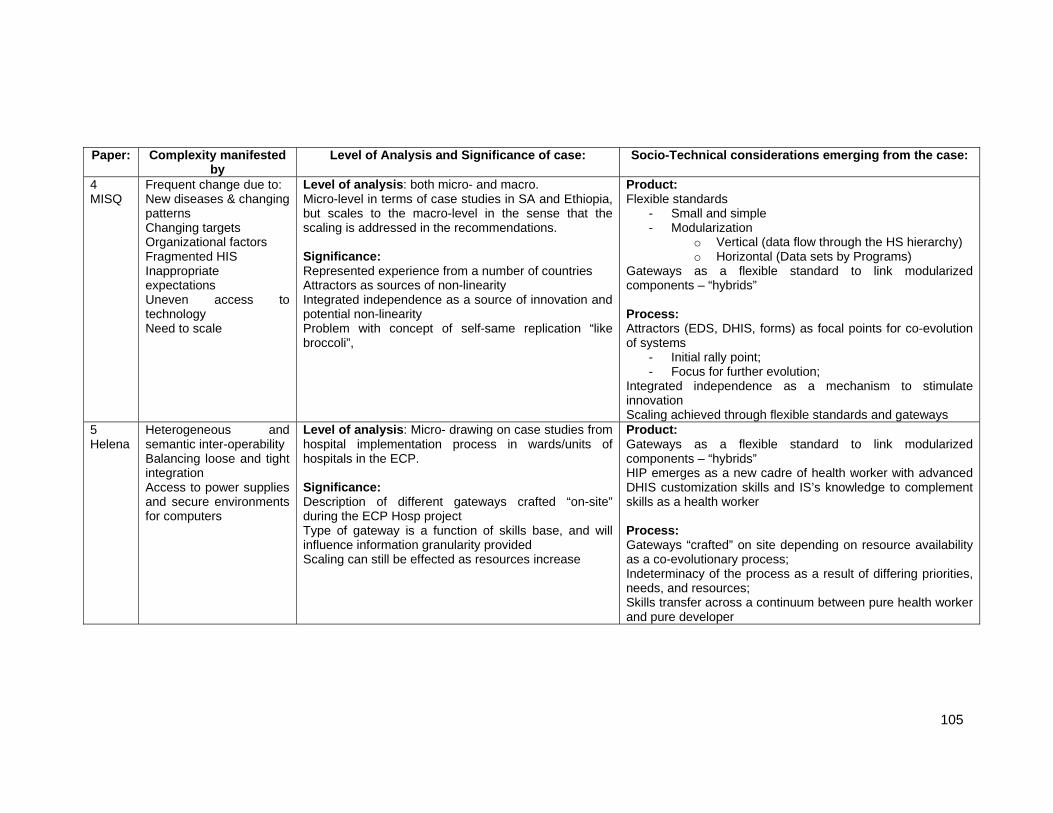
105
Paper: Complexity manifested by
Level of Analysis and Significance of case: Socio-Technical considerations emerging from the case:
4 MISQ
Frequent change due to: New diseases & changing patterns Changing targets Organizational factors Fragmented HIS Inappropriate expectations Uneven access to technology Need to scale
Level of analysis: both micro- and macro. Micro-level in terms of case studies in SA and Ethiopia, but scales to the macro-level in the sense that the scaling is addressed in the recommendations. Significance: Represented experience from a number of countries Attractors as sources of non-linearity Integrated independence as a source of innovation and potential non-linearity Problem with concept of self-same replication “like broccoli”,
Product:Flexible standards
- Small and simple - Modularization
o Vertical (data flow through the HS hierarchy) o Horizontal (Data sets by Programs)
Gateways as a flexible standard to link modularized components – “hybrids” Process: Attractors (EDS, DHIS, forms) as focal points for co-evolution of systems
- Initial rally point; - Focus for further evolution;
Integrated independence as a mechanism to stimulate innovation Scaling achieved through flexible standards and gateways
5 Helena
Heterogeneous and semantic inter-operability Balancing loose and tight integration Access to power supplies and secure environments for computers
Level of analysis: Micro- drawing on case studies from hospital implementation process in wards/units of hospitals in the ECP. Significance: Description of different gateways crafted “on-site” during the ECP Hosp project Type of gateway is a function of skills base, and will influence information granularity provided Scaling can still be effected as resources increase
Product:Gateways as a flexible standard to link modularized components – “hybrids” HIP emerges as a new cadre of health worker with advanced DHIS customization skills and IS’s knowledge to complement skills as a health worker Process: Gateways “crafted” on site depending on resource availability as a co-evolutionary process; Indeterminacy of the process as a result of differing priorities, needs, and resources; Skills transfer across a continuum between pure health worker and pure developer

106
Paper: Complexity manifested by
Level of Analysis and Significance of case: Socio-Technical considerations emerging from the case:
6 IFIP 2007
Unevenness in terms of access to HR and technology
Level of analysis: both micro- and macro. Micro-level in terms of case studies in Nigeria and Ethiopia, but scales to the macro-level in the sense that the scaling is addressed in the recommendations. Significance: Model for balancing HISD in an c--evolutionary manner (as a developmental process) and clarified that it was “OK” to allow uneven development to take place
Product:PAN Model for accommodating non-linearity between access to health workers, technology and data (information) requirements that characterizes HISD in RESOURCE CONSTRAINED SETTINGS Standard requirements for scaling
- identify data standards, - adopt gateways to bridge unevenness - local customization based on resource availability
(and mindful innovation) Process: Mindful innovation Approaches to scaling Non-linearity manifests between different processes; Indeterminacy of the process.
7 Book chapter
As above Level of analysis: both micro- and macro. Micro-level in terms of some of the case studies, but scales to the macro-level in the sense that the scaling is addressed in the recommendations. Significance: Longitudinal view on HISD in Africa as an evolutionary process across three domains of software development, geographic scaling, and expanded functionality.
Product:FOSS in the DHIS as a sustainable solution HISP as a network/flexible organization responding to changing needs HIP Process: Skills transfer through development of new cadre of HIP Innovation as contributing to uneven development; HISP as an actor in the scaling process Scaling as an inevitable outcome of successful implementation Indeterminacy of the process; Non-linearity between different components, and between different sites

107
4.4. A synthesis of the findings:
In this section I synthesize the findings from the papers in order to address the first three
research objectives. The remainder of the research objectives are addressed in the following
chapter.
4.4.1. The complexities of the context: This sub-section synthesizes the complexity of the health sector, and by implication also the
hospital environment. Where the complexities are specific to the health sector, this will be
specifically mentioned. Complexity is described using five different perspectives. While some
of these perspectives are unique to resource constrained settings, many are also found in
well resourced contexts. The difference is that the heterogeneity experienced is far greater in
resource constrained settings, and it is all pervasive (this is discussed in the next chapter in
greater detail). Because of this, and the nested effects of the different types of complexity,
the environment in which HospMISD takes place is extremely unpredictable.
a) Complexity as heterogeneity: Complexity of the hospital environment is reflected in the heterogeneity described in the
papers. The obvious manifestations of heterogeneity are the disparities in access to basic
infrastructure (e.g. in terms of access to tarred roads, electricity supply, cell phone
connectivity or internet access). However the extreme heterogeneity also manifests itself
through less obvious disparities in for instance educational and skills levels amongst health
workers. This results in different abilities to process information and access and use
technology. These disparities are a result of the organizational and bureaucratic
inefficiencies reported elsewhere (Jayasuriya 1999; Gladwin, Dixon et al. 2003) and uneven
development that is so prevalent between rich and poor areas, urban and rural sites (Sen
1999).
HISD must accommodate the rapid rate at which changes in access to infrastructure takes
place. The rate of change does not unroll evenly across all areas. Changes create their own
complexities through compounded effects because they interact with heterogeneities and
complexities in other areas of the health system (this is described below). The result is
unexpected changes, imbalances and non-linear effects. For instance, a decision to capture
facility level data in Amhara Region in Ethiopia resulted in an explosion of the volume of data
to be captured, despite the lack of staff to do the data capture (Shaw, Mengiste et al. 2007).

108
b) Complexity as manifested by a broad range of challenges: The range of tasks that have to be effected in HospMIS development in resource constrained
settings are hugely varied. Because of the heterogeneity described above, and the lack of
access to skilled personnel, not only are HIPs required to deal with the obvious infrastructural
problems, but they also have to address sophisticated technical problems. For instance
issues related to heterogeneous and semantic interoperabilities have to be addressed
without access to sophisticated programmers, and decisions have to be made on the spot
between loose and tight integration of systems.
c) Complexity as limited control over activities: In a factory, shift managers oversee the workers inputting raw materials that are combined to
create a product. But the production of quality data by a HIS is not a linear, controllable
process (Garrib, Stoops et al. 2008; Mate, Bennett et al. 2009). Rather it is the outcome of a
series of small, individually successful tasks from the point of interaction with the patient (e.g.
correct recording of a diagnosis on a paper record), through to the point of data capture (e.g.
correct aggregation of diagnoses from multiple care providers onto a monthly report, timely
submission of the report to point of capture, correct capture of represented data, etc). Quality
data is a result of complex interactions between a number of initiatives, not only technical in
nature (for example data quality checks in the software at the time of data capture) but also
procedural and individual, many aspects of which are beyond the direct control of the
systems developer or HIP. HISD efforts therefore need to be able to not only design tangible
products such as the software, but also set the broad parameters within which different
stakeholders are encouraged to play their role optimally, far from the control of the centre.
HISD (and by implication HospMISD) must effect products and processes at the micro- and
at the macro-levels of the health system.
d) Complexity impinging on Hospital Management Information Systems Development:
The complexity associated with HospMIS is not related only to that of the HIS, but is
compounded by complexities and changes in other areas which impact on the HospMIS. For
instance, HospMISD is frequently effected during periods of health sector reform. This
means that not only is the HIS changing, but organizational structures are undergoing
change as well, and changes in the organizational structure impact on the HIS.

109
Fragmented health services are the result of historical factors (for instance the three different
administrations created in an apartheid South Africa), and vested interests of program
managers and other role players. Overcoming this type of fragmentation in order to develop
an integrated HIS is not a simple task, and demands a careful negotiation process.
New diseases and changing patterns of disease (for example HIV/AIDS), demand changes
in reporting requirements and frequent change in reporting requirements require flexible data
management processes.
e) Complexity as non-linear effects: HospMISD must accommodate non-linear effects which are common in this environment.
They are precipitated by the complexities described above, and by the interactions between
these complexities. They may be precipitated by the rapid pace with which infrastructural
change is effected and by the multiple types of change that take place at the same time (for
instance effecting HIS changes whilst undertaking health sector reform as discussed in paper
1). They result from the combined effect of decisions made by different people and of self-
evolving groups which effect significant change without central control (paper 3).
f) Summary – Complexity as extreme heterogeneity: In summary, I suggest that the complexity of the context is characterized by “extreme”
heterogeneity. I use this term because not only is the environment heterogeneous, but the
heterogeneity spans a wide range of possibilities, change is rapid and ongoing and results in
compounded effects, imbalances and non-linearity. Because HospMISD often takes place in
the context of other reforms, compound effects are created which contribute to non-linear
interactions. The demands for support are hugely varied, and therefore practitioners must be
multi-skilled or must draw on a team with a wide range of skills to not only address basic
infrastructural issues, but also to be able to provide sophisticated technical solutions. In
addition, strategies must accommodate the lack of direct control over nested actions, and
therefore attention needs to be addressed towards processes that support HIS at the micro
and macro-level.
4.4.2. Flexible Standards as central features in the design of hospital management information systems
The second objective focuses on the design of HospMIS as distinct to the implementation
process. A core theme that emerges as a result of the complex environment is the ability to
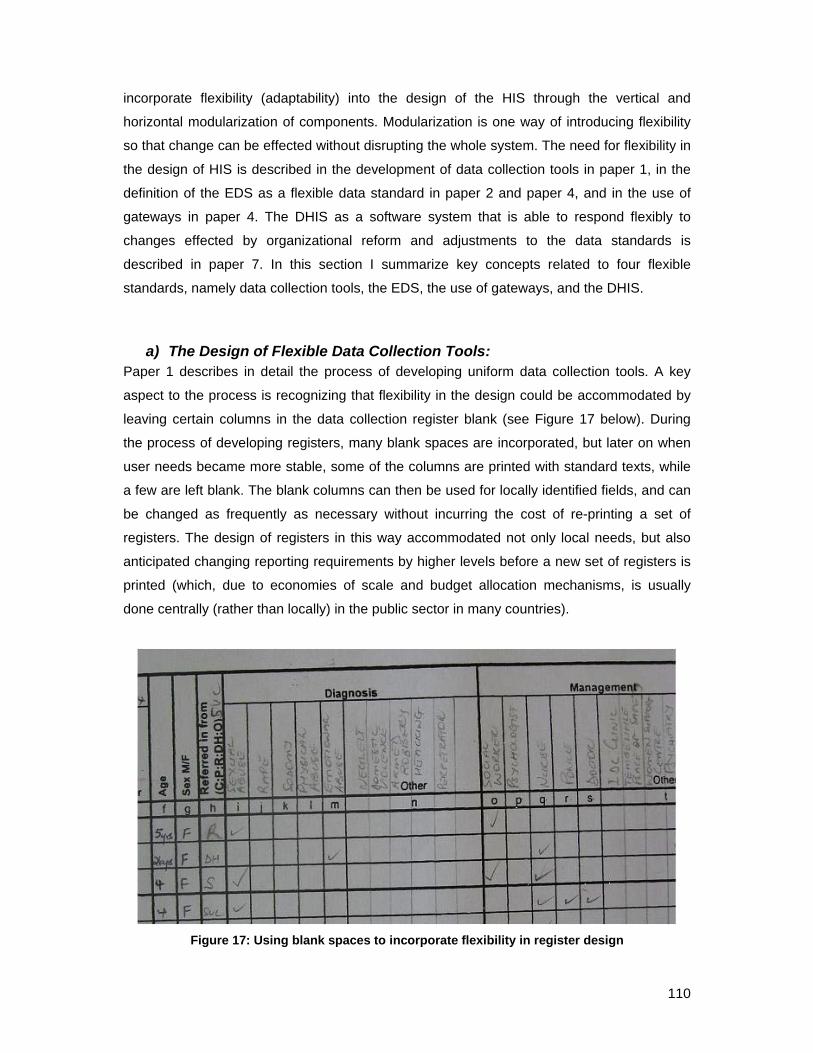
110
incorporate flexibility (adaptability) into the design of the HIS through the vertical and
horizontal modularization of components. Modularization is one way of introducing flexibility
so that change can be effected without disrupting the whole system. The need for flexibility in
the design of HIS is described in the development of data collection tools in paper 1, in the
definition of the EDS as a flexible data standard in paper 2 and paper 4, and in the use of
gateways in paper 4. The DHIS as a software system that is able to respond flexibly to
changes effected by organizational reform and adjustments to the data standards is
described in paper 7. In this section I summarize key concepts related to four flexible
standards, namely data collection tools, the EDS, the use of gateways, and the DHIS.
a) The Design of Flexible Data Collection Tools: Paper 1 describes in detail the process of developing uniform data collection tools. A key
aspect to the process is recognizing that flexibility in the design could be accommodated by
leaving certain columns in the data collection register blank (see Figure 17 below). During
the process of developing registers, many blank spaces are incorporated, but later on when
user needs became more stable, some of the columns are printed with standard texts, while
a few are left blank. The blank columns can then be used for locally identified fields, and can
be changed as frequently as necessary without incurring the cost of re-printing a set of
registers. The design of registers in this way accommodated not only local needs, but also
anticipated changing reporting requirements by higher levels before a new set of registers is
printed (which, due to economies of scale and budget allocation mechanisms, is usually
done centrally (rather than locally) in the public sector in many countries).
Figure 17: Using blank spaces to incorporate flexibility in register design

111
b) The Essential Data Set as a flexible standard: The EDS is a flexible standard that accommodates a hierarchy of information needs,
“dynamically combining flexibility as a right and adherence to the standards of the level
above as a duty” (Jacucci et al. 2006). It is a tool for negotiating a common approach, which
tolerates individuality within a common framework. It demands continuous review and is an
open standard which never reaches closure, and it can change in response to changing
demands over time, thus allowing it to evolve and adapt. The process of developing the data
standards requires a careful negotiation between different stakeholders in a participatory
process. This is a necessary pre-requisite for the adoption of standards and their local
appropriation, as is discussed below. It also requires a combination of a bottom-up and top-
down approaches, balancing experience from local level innovation with information needs
determined at the national and inter-national levels.
c) Gateways as flexible standards: Gateways are flexible standards because they can be locally crafted, and can change over
time (a paper gateway can be replaced by an electronic file). They are ‘objects” that link and
translate between heterogeneous systems. The “objects” used as gateways are hybrids,
being composed of humans, procedures, paper, computers, software, etc. Gateways provide
the means to communicate the data in contexts where heterogeneity and uneven
development are common because they bridge heterogeneous systems. They allow
seamless scaling to be effected between different levels of the HIS.
d) The DHIS as a flexible software: Paper 7 describes the DHIS as flexible software in that it requires local customization of the
organizational hierarchy, the data elements and the indicators, and through the multi-
language enabling functionality allows further customization to the local language of use
(Nielsen and Nhampossa 2005). The DHIS can therefore adapt not only in accordance with
changes in its locations of use, but can also accommodate changes in reporting
requirements and organizational hierarchy. For example, the ability to accommodate multiple
organizational hierarchies, and frequent changes in these was a powerful feature of the
software developed during the radical health sector reform process in South Africa as local
government and provinces were democratized in the post-apartheid period.

112
4.4.3. Five core implementation strategies for hospital management information systems
In this sub-section I highlight six key implementation strategies from the case material. These
strategies are used to manage the complex environment characterized in particular by
extreme heterogeneity and non-linearity.
a) The Principle of Integrated Independence : The principle of integrated independence together with flexible standards accommodates
experimentation and local level innovation without disrupting the overall system (described in
paper 4). Particularly in environments where change happens frequently, and in a non-linear
fashion, the ability to innovate provides opportunity to identify new solutions through small-
scale initiatives. Innovations which allow the HIS to evolve in response to the complex
environment are presented as examples, for instance gateways are created to effect an
interface between the financial IS with the DHIS in a hospital (paper 5) and data capture is
effected at different levels of the health system hierarchy in response to the availability of
human resource skills and access to technology (paper 6).
b) The Process for Accommodating Non-linearity (PAN Model): The PAN model provides an approach to balancing three dimensions of an IS, namely the
demand for data with access to ICT and available human resource skills. The model provides
a basis for an iterative approach to HISD that accommodates changes in these dimensions.
The process of balancing the interaction between these dimensions requires mindful
innovation (see below). The PAN model also provides an approach for scaling of HIS.
c) Using mindful innovation to accommodate the non-linear development of IT and human resource capacity:
Mindful innovation focuses on three characteristics of mindfulness, namely pre-occupation
with the possibility of failure, commitment to resilience, and sensitivity to operations. It
suggests a process of careful sensing and accommodating the bottom-up and top-down
processes that influence the local context.
Mindful innovation is applied to the scaling of HIS in Nigeria and Ethiopia (paper 6), where
scaling is allowed to happen at an uneven pace (which may mimic the expansion of
technology and infrastructure) even though this is counter-intuitive to the philosophy that
inequities should be reduced rather than increased. In paper 7 we describe different
approaches to scaling of HIS in Nigeria, namely the “standard approach” (uniform and

113
comprehensive scaling across provinces and a country), the “prioritized sample approach”
(the busiest facilities are targeted for HISD support), and the “hierarchical cluster approach”
(a group of facilities linked through the hierarchical referral network for maternal and child
health services are selected for HISD support). Determining which type of approach to utilize
and follow through while carefully evaluating strategies is an example of mindful innovation.
d) Attractors as growth points for sustainable systems : Attractors serve as points around which the HIS can develop (paper 4). Attractors are objects
or processes that provide a strong impetus for focusing HISD activities. They bind potential
users together in a common purpose. Identifying attractors is closely linked to the concept of
“mindful innovation” because an implementer who does not sense the presence of an
“attractor” misses opportunities to gain critical mass to support the HISD process. Layering of
IS (paper 3) is an example of an attractor which creates dependencies between different IS
thereby reinforcing the value of the individual systems.
e) Creation of networks and interdependancies as a mechanism to support sustainability:
Sustainable IS development relies on local appropriation of standards, and the creation of
networks to support the processes and approaches (paper 3 and 7). In the face of
marginalization, sustainability is improved through the creation of networks amongst users,
and the layering of IS on one another. The creation of regional networks of HIPs amongst the
HISP teams in South Africa, Nigeria and Zambia (paper 7) suggests a maturing of the
“networks of action” approach to HISD (Braa, Monteiro et al. 2004).
f) Development of a new cadre of health worker – the health information practitioner:
The development of skills to “manage” HIS is described as a process of transferring
knowledge and skills between health workers and programmers so that the two gradually
move from their skills base at opposite ends of a spectrum towards the common centre
(papers 5 and 7). A cadre called the HIP is emerging within the South African public health
sector. In addition, and in support of the HIPs, regional networks of HIPs are being
established, with links to academia and other NGO’s.

114
4.5. Concluding remarks:
In this section I draw attention to two insights from the findings presented so far, and
thereafter I compare the findings to the co-evolutionary framework developed in Chapter 3.
The last subsection highlights aspects of HospMISD that have not been adequately
addressed by the theoretical framework. In the next chapter I draw on this analysis to further
expand the theoretical framework.
4.5.1. Evolution of insights into HospMIS design, development and implementation:
The first insight provided by the synthesis is how my thinking has progressed over the years
that I have been involved in the PhD program. Four central themes emerge over this period.
Firstly, the role played in developing the HIP gradually became apparent. The new cadre of
health worker plays an extremely important role as a mediator in HISD. Secondly, it has
became increasing apparent that co-evolutionary processes are central to many of our HISD
efforts. These have been described in different ways in the papers (for example as a
hermeneutic approach in paper 1, as a negotiation process in paper 2, and as mindful
innovation in paper 6). Thirdly, it has gradually dawned on me that scaling of the information
system is an inevitable outcome of successful implementations, and therefore makes
demands on the design, development and implementation of HIS. Fourthly, the gradual
recognition that HISP-SA as an organization is an important mediator and role-player for
sustainable HISD.
4.5.2. Balancing micro- and macro- level analyzes: The second insight provided by the synthesis is how the data is drawn from both the micro-
and macro-levels of the health system. For instance, paper 1 focuses at the micro level, as
do papers 3 (detailed description of data collection practices in one hospital) and 5
(implementation processes in wards and reporting units of hospitals in the ECP). But other
papers balance the micro-level experiences with macro-level implications, for instance
papers 2 (an EDS that balances the local and national information needs), 3 (appropriation of
national standards at a local level), 4 (local practices that contribute to scalable IS), 6 (draws
on local experiences at the micro- level to suggest approaches for scaling at the macro
level), and 7 (local practices that contribute to sustainable IS).

115
4.5.3. The co-evolutionary framework for managing the complexity of HospMIS development in resource constrained settings:
In this subsection I summarise the research findings in relation to the first three research
objectives and the proposed co-evolutionary framework for HospMIS development. While
some concepts, such as that of integrated independence, attractors, and mindful innovation
have been developed through research conducted in PHC settings, I believe that they are
principles that can be appropriately generalized to the HospMIS environment in similar
settings.
The complexity of the environment has been characterised as extreme heterogeneity (this
notion is expanded in the next chapter), and subject to frequent change and non-linear
effects. Because it is impossible to control change that occurs at multiple levels of the health
system, the HospMISD must suggest strategies that support decentralised control at micro-
and macro-levels of the system. Strategies related to the design and implementation are
processes are discussed next.
With respect to the technical design of HospMIS, the research highlights the importance of
incorporating flexibility into all components of the system, from the paper based data
collection tools to the software. Flexibility is built into the data flow process as well, so that as
access to technology increases, portions of the data flow can be replaced by technological
processes without disrupting the whole. In this respect, modularization and flexibility are two
sides of the same coin, and go hand in hand. The co-evolutionary framework is expanded by
the design concept of ensuring the HIS has access to a wide range of tools (resources) that
can be drawn upon as the situation demands. For example there are flexible paper based
tools, flexible datasets, flexible databases, and a variety of gateways. These enable HIPs to
balance supply of staff, skills, and the demand for data, with the available technology. In this
way the information system develops around locally appropriated solutions, and can (usually)
be adjusted by the users to accommodate unexpected changes in the environment.
The flexibility in the technical design of the system is mirrored by flexibility built into the
implementation process. The co-evolutionary framework developed in Chapter 3 can now be
expanded with a number of insights. Firstly, the co-ordinating rhythm is complemented by the
concept of mindful innovation. While mindful innovation was conceptualized for use in high
reliability organizations, its application in contexts characterized as CAS is not inappropriate
given the nature of surprise that characterizes non-linear effects, and the need for
watchfulness to manage and counter non-linear effects. Secondly, the use of integrated
independence, attractors, networks and interdependancies are examples of ways to

116
strengthen, and potentially create non-linear effects in support of HospMIS (this is discussed
further in the next chapter).
In terms of balancing human resource development with HospMIS implementation, two
solutions have emerged. The first is the emergence of the HIP as a change agent within the
public sector. This is a new cadre with skills which are a mixture of health worker skills, and
IT sector skills. The secondly is the use of the PAN model as a means by which to not only
assess what is feasible in terms of data processing capacity, but also to manage the
unanticipated changes in access to resources.
4.5.4. Critique of the co-evolutionary framework: The preceding subsection expands the design and implementation components of the co-
evolutionary framework, and provides initial insights into how capacity can be gradually
developed within the public sector, despite staff shortages. However, two aspects are not
addressed adequately by the co-evolutionary framework. Firstly, the process of building
capacity in the public sector is not adequately described. Secondly, and related to the first,
there is a need to identify mechanisms whereby the public sector can counter its tendency to
neglect exploration processes. As suggested in the final section of Chapter 3, these issues
warrant further exploration, and as they are key factors contributing to sustainable and
scalable HospMISD, will be the focus of the next chapter.

117
Chapter 5. THEORETICAL AND PRACTICAL CONTRIBUTIONS:
5.1. Introduction:
In this chapter, drawing on the findings from the empirical data presented in Chapter 4, I
develop the theoretical and practical contributions for the design, development and
implementation of sustainable and scalable HospMIS. Three main contributions are
presented in this chapter.
The first is to extend the understanding of the complexity of the context in resource
constrained settings with the notion of extreme heterogeneity. This contribution builds on the
description of complexity presented earlier, and introduces the concept of nested effects
which complicate the environment, and create non-linear effects. Our understanding of the
complexity of the environment is also expanded by drawing attention to two other concepts
from CAS, namely non-linearity and self-organizing groups. Each is examined in terms of its
significance to HospMIS development and implementation.
Given the environment characterised by extreme heterogeneity, non-linear effects and
frequent and unexpected change, the challenge is to develop sustainable approaches to
HISD. This is addressed by the second contribution which articulates a model called the co-
evolutionary IS development model, which posits a NGO (like HISP-SA10) partnered with a
public sector organization in a synergistic relationship. This partnership is arguably effective
because the two organizations have different absorptive capacities, and complement one
another not only in technical expertise, but also in that the public sector is less inclined to
pursue exploratory drives compared to a networked and flexible NGO. Not only does this
model ensure the survival of both organizations, it allows a gradual, and sustainable transfer
of skills between the two organizations as a parallel process to the co-evolutionary IS
development process. This transfer involves a process of co-evolutionary organizational
10 In this chapter, where I refer to HISP-SA I do so because I have an intimate knowledge of how this
organization has worked, and developed. However, I would presume that where I use HISP-SA as an
example, it could equally apply to HISP-India, HISP International (a term used to describe the Oslo
node of the network with or without members from the other HISP nodes), or the HISP-Nigeria teams.
Where I use the term HISP it refers to the network as a whole.

118
learning that takes place through a four staged process of intuiting, interpreting, integrating,
and institutionalizing.
The third contribution is to conceptualize scaling as an “inevitable” co-evolutionary process,
being a natural consequence of successful IS development. Scaling is conceptualized as a
CAS, taking place along four dimensions, namely the geographic depth and breadth, and
depth and width of scope.
This chapter is structured into six sections. Sections two, three and four describe the three
characteristics of the environment which are inherent properties of CAS. Section five
addresses HospMIS development as a co-evolutionary process, and section six examines
scaling of HIS using the co-evolutionary learning model. Practical contributions are
highlighted within each section, and therefore section seven summarizes the theoretical
contributions only, while section eight identifies future research directions.
5.2. Understanding the Context 1: As Extreme Heterogeneity:
While heterogeneity can be expected to be an issue in hospital information systems
development (Hanseth and Lundberg 2001; Ellingsen 2004), the extreme heterogeneity
identified and the impacts of it on the process of HospMISD are surprising. In this section, I
first expand on the nature of the extreme heterogeneity as discussed in Chapter 4, and then
discuss the implications for health and HospMISD.
Heterogeneity features prominently in the IS literature with respect to large scale information
infrastructures. In this context, heterogeneity is usually related to its constituent components
(Hanseth and Lyytinen 2004), its developers and users (see for instance related to mobile
communication platforms (Jansen and Nielsen 2005)), and the use and applications of
information infrastructures (Monteiro 2003; Silva 2007). However, while these forms of
heterogeneity also exist in the empirical settings described in this thesis, the “extreme
heterogeneity” that I refer to has additional dimensions associated with it. These are
elaborated in the next section.
5.2.1. Extreme heterogeneity manifested in hospitals: Typically, in the context of IS development in hospitals, heterogeneity has been discussed in
terms of heterogeneous and semantic interoperabilities (Ellingsen and Monteiro 2003;

119
Hanseth, Jacucci et al. 2006; Lopez and Blobel 2009), a diverse range of users (Berg 2001),
and legacy software systems (Ciccarese, Caffi et al. 2005). The heterogeneity found in
hospitals is closely linked to the autonomy and relative independence afforded hospital
departments (or specialties), allowing them to behave relatively independently of other
departments/units (Glouberman and Mintzberg 2001b; Glouberman and Mintzberg 2001a).
This means for example that they might secure funding for, or develop their own IS and ICTs
independently of those present or envisaged in other departments (Aanestad, Jensen et al.
2009). A good example of this is demonstrated by the extreme heterogeneity in one of the
academic hospitals in Malawi where the paediatrics department staff use touch screen
computers to capture patient related data, and bar-code scanners are used in the patient
registration department to record patient attendance, while the anaesthesia department uses
a hand-me-down computer and enters data by typing (Douglas, Deula et al. 2003; Shaw and
Braa Forthcoming). In these contexts then, not only does one deal with the more
sophisticated forms of heterogeneity such as system (non) interoperabilities, but also more
basic conflicts between the computer capacity (as determined by its operating system and
processor) and the software programs that demand advanced operating systems. The
varying institutional arrangements that are required to manage these different technologies
further magnify the nature of heterogeneity that has to be addressed while developing an
integrated HospMIS.
While the finding of differences between units in a hospital may be expected, finding that
there are dramatic differences in access to resources between hospitals within a region or
province is surprising. Hospitals of a similar size can differ significantly in their access to
resources like computers, staff, paper, or internet access. The reasons for the differences
are a complex interaction of factors associated with, amongst others, the local environment
and the history of that institution. An example of this is described in the paper by (Jacucci,
Shaw et al. 2006) where PAH are “different” to other public sector hospitals because they
generate 10% of their own revenues, and this allows them greater autonomy than other
public sector hospitals. This autonomy allows them to pursue initiatives sometimes
independent of public sector policy.
Heterogeneity also manifests in surprising ways in relation to professional and support staff.
With respect to the types of professional staff found in hospitals, heterogeneity ranges across
health workers, specialists and administrative staff. In resource constrained settings the
heterogeneity is multiplied by disparities in terms of staff skills (Bhatnagar 1992; Kimaro and
Nhampossa 2005), staffing levels (Kimaro 2006), and staff performance (unpublished reports
from Nigeria and Eastern Cape).

120
No computer
Basic computer
Computer with dial-up
email access
Computer with high
speed internet access
Web-based data storage and analysis
No computer
Basic computer
Computer with dial-up
email access
Computer with high
speed internet access
Web-based data storage and analysis
5.2.2. Extreme heterogeneity creating nested effects: The various forms of heterogeneity described (for instance related to staffing, hardware,
software, and infrastructure, but also along other dimensions11) interact with one another in
unexpected ways. Interactions arise from any of a variety of sources, and can change rapidly
from one period to the next changing the context dramatically (Akpan-Obong 2007; Owei,
Maumbe et al. 2007). Changes in one dimension are not always visible, but they create
effects in other dimensions that then become visible as non-linear effects. These interactions
leading to non-linear effects I call “nested effects” since they are small changes that are
effected across a spectrum of possibilities, as depicted below.
In an attempt to analyze the nested effects in more detail, I have depicted some
heterogeneities as positions across a spectrum. Thus for instance access to technology can
be viewed as a functionality spectrum depicted below.
For example, in resource constrained contexts, the computer will not function without
electricity, and electricity supply may not be reliable. Even if there is electricity, and the
computer is available, there may be insufficient staff to operate the computer, and if there are
sufficient staff, there is no guarantee that the available staff will be computer literate. These
nested effects have a compounding effect on the ability to implement health IS. To have a
fully functional system, each component of the system (and its sub-components) must be
functioning in one way or another (ref Table 15), and in relation to each other.
11 For instance Heeks (2006) refers to the dimensions of an IS as ITPOSMO being information,
technology, processes, objectives and values, staffing and skills, management systems and
structures, and other resources of the IS.

121
Table 15: Changes in heterogeneities interacting with one another as nested effects
System Component
Subcomponent Scale of functionality from nil/basic to sophisticated
Reliable Power Supply
Access to grid electricity
None Intermittent Reasonably regular
Reliable
Alternate power sources - generator
None Stand-by generator available on ad-hoc basis
Sophisticated generator kicks in automatically when power fails
Alternate power sources - UPS
No UPS UPS partially functional
UPS fully functional
Access to computers and technology
Computer/internet None Basic computer
Computer with dial-up email access
Web-based data storage and analysis
Environment for computer
Not acceptable
Secure but not dust free
Secure and dust free
Mobile reception/coverage
None Intermittent Reasonably regular
Reliable
Mobile technology None Basic functionality
Sophisticated functionality
Staffing issues
Staffing levels No staff Relatively few staff
Reasonable number
Adequate staffing level
Staff skills Not computer literate
Basic computer functions
Reasonably skilled
Advance skills
In conclusion, I use of the term “extreme heterogeneity” to emphasise the heterogeneity that
spans a wide range of possibilities, and the rapid and ongoing nature of changes which result
in nested effects, imbalances and non-linearity.
5.2.3. Practical implications 1: Managing heterogeneity in resource constrained settings:
In this section I highlight three approaches that are used to address the extreme
heterogeneity found in resource constrained settings. A fourth approach is identified for
building capacity within the public sector. Thereafter I discuss the implications of this analysis
for the co-evolutionary framework (developed in Chapter 3) to help manage the
technological, organizational and institutional forces that interact to create unexpected
effects.

122
a) The PAN Model: A good example of an “approach” to manage heterogeneities across multiple aspects of the
HIS (for instance access to technology and staff shortages) is the PAN model which
focusses on the need for flexibility to deal with an uncertain environment (see Figure 15).
The model emerged out of an analysis of the dilemmas we faced in the field in relation to
changing scenarios between access to technology (either rapid or static technological
change) and staffing issues. It regards the process of building capacity as a set of activities
that need to be enacted over time, requiring mindful innovation as a strategy to manage the
process. In addition, given that changes occur on an uneven basis, and in unpredictable
ways, we suggest that “fast advancers” (sites where new changes have been effected) can
provide opportunities for testing new methods and approaches, which can be later modified
and scaled across other areas. This approach resonates with the co-evolutionary concept of
“rugged landscapes”, where the CAS presents many frontiers that need to be managed at
the same time. These frontiers provide the stimulus for development and competition at the
“edge of chaos”. The principle of integrated independence conceptualizes the explicit
adoption of an approach to support the development of rugged landscapes. Local innovation
is then allowed to occur within a bigger framework of a common vision, with accompanying
feedback to the vision itself (Braa, Hanseth et al. 2007b).
b) Modularize to reduce complexity In order to manage heterogeneities related to both staff shortages and inexperience, we12
identify at least two strategies. One relates to training programs, and the other to the number
of people trained. Initially, training programs were comprehensive and extended over a
number of days, but this meant staff were away from their posts for extended periods and
opportunity costs associated with the training were significant. Over the years, the training
programs have been curtailed, and scaled back to small simple modules which can be
implemented as a series of modules as skills improve and as funds become available.
Modularisation does not negate the ability and need for more comprehensive training, but
seeks to have a specific focus based on needs such as a basic training module for first time
computer users. The current thinking is to link participation in further training to performance
measures, and to register the modules as accredited academic programs. These actions are
12 I use “we” in the sense that these initiatives were not my idea, nor necessarily my initiative, but have
emerged as a strategy through working with colleagues in the HISP-SA and HISP-Nigeria teams and
ministries of health.

123
an attempt to retain and motivate users and ensure that training is translated into productivity
gains and help to cultivate a sense of empowerment.
c) Introduce redundancy to counter uncertainty: Because most public sectors experience high rates of staff turnover, we adopt a maximalist
approach to the selection of trainees in the sense that we will often request two or three
people (rather than just one) per unit to undergo training. The effect is to introduce
redundancy into the system in order to cope with losses. It also provides opportunities for a
team to work together and support one another in the post-training period, and lastly, it
expands the pool of people exposed to the system. For instance, often additional training
slots are given to senior managers in an effort to increase their exposure to the system which
invariably supports ongoing HospMISD efforts, which is especially useful when their authority
is needed. The increased pool of people exposed to the system has implications for creating
self-evolving networks of support.
d) Identify a set of resources for coping with heterogeneity: Tools are concrete solutions to common problems, and can be regarded as essential
resources for survival in heterogeneous environments. Examples of these “tools” include
ensuring that facilitators have a range of DHIS installations that can function on older
versions of the Windows OS as well as older versions of MS Office, and ensuring that data
capture takes place on a local machine rather than relying on web-based access to the
database. Facilitators carry with them freeware versions of anti-virus software to install and
clean user computers that often do not have virus protection. These kinds of solutions are
relatively simple to effect, and contingent on local needs. Yet they are important, and often
neglected as part of the HIPs toolkit.
5.2.4. Summary – Expanding the Co-evolutionary approach: In this section I briefly highlight how aspects of the co-evolutionary framework have been
used to address extreme heterogeneity and non-linearity that results from nested effects, and
I expand the co-evolutionary framework with one concept, namely the introduction of
redundancy. The co-evolutionary framework has been used as follows:
• Firstly, modularization is effected in at least two areas. The modularization of the
training materials results in greater use and change flexibility in order to
accommodate the complexities of the environment. And nested heterogeneities are
124
unpacked into their constituting components (for instance access to internet is
effected (or avoided) based on access to resources) and managed as smaller units.
• Secondly, use of mindful innovation is integral to the successful application of the
PAN model.
• Thirdly, integrated independence is encouraged amongst “fast advancers”,
harnessing unevenness to potentially identify innovations.
• Fourthly, redundancy is introduced in various ways. For instance, HIPs carry a variety
of tools with them, “in case” they are needed, and excess staff are trained to
accommodate staff losses. Training excess staff may seem inefficient, but it serves
the purpose of providing a pool of staff “in reserve” who can be used to fill gaps when
needed.
5.3. Understanding the Context 2: As Non-linear Effects
While the organizational science literature has described the phenomenon of non-linearity
(Stacey 1995; Anderson 1999) and approaches to managing it (Anderson 1999), the IS
research literature has not specifically addressed non-linearity in any detail. However, some
authors have described “unexpected effects” in health and hospital information systems
development, even if the have not labeled the effects as “non-linear” (see for instance (Silva
2002; Littlejohns, Wyatt et al. 2003; Sahay, Monteiro et al. 2009). The empirical data in this
thesis shows that non-linearity is the result of complexities of the environment, and in
particular the rapid pace of small-scale changes in many parts of the health system. It is the
result of changes occurring simultaneously (or not), and across multiple levels of the health
system hierarchy and which defy control and anticipation. In this section, I first examine two
interesting conceptualizations of non-linearity which are provoked by Urry (2003). Thereafter
I explore our approach to coping with non-linearity.
5.3.1. Conceptualizing Non-linearity: Non-linearity has been characterized by a lack of equivalence between the individual, and
the statistical (Urry 2003). This suggests that when analyzing patterns, what may be
statistically correct at the system level, may bear little resemblance to the individual within
the system. In addition, the statistical or system effects are not the result of adding together
all the individual components – there is something else involved called emergence. This
definition of non-linearity is interesting when viewed from the perspective of performance

125
within the public health hierarchy, where the range of performance is measured across the
hierarchy. In this case, the individual level would be the patient or community member, or
health facility, and the statistical level would be a few levels above this, such as the regional,
country level. The analogy can be interpreted in at least two ways.
a) Non-linearity from the public health perspective: First, an interpretation from a public health perspective, data viewed at the statistical level is
an average, and usually appears uniformly uninteresting. As the data is disaggregated to the
individual level it becomes much more interesting as differences become more evident. It is
the differences between reporting units which depict success or struggle. Typically in the
public health sector, data analysis and intervention is about identifying the deviation from the
norm rather than the normative values (where is HIV/AIDS incidence highest and why, or
where is it lowest and why?), and so it is more about the individual than the statistical.
Effecting a change in disease patterns (whether enhancing the spread of successful
practices, or curtailment of outbreaks), is about focusing resources on the “deviants” (which
are usually a small number of few critical areas), and carefully testing ideas before scaling
them beyond the critical areas.
b) Non-linearity as a dimension of hidden organizational turbulance: The second interpretation is that what is seen from the organizational level (or statistical
level) does not reflect accurately what is happening at the individual level. For instance, the
individual level may be chaotic, and uneven, and filled with currents and eddies like the
seabed, while the surface appears calm and smooth.
The importance of both these interpretations is that they emphasise the relevance of the
individual. Tipping points (which are non-linear effects) in effecting widespread change are
brought about by focusing resources in a few key areas (Gladwell 2000). Any non-linear
effects resulting in improvement at the national level would be the result of improvements in
the individual level (see for instance (Garrib, Stoops et al. 2008; Mate, Bennett et al. 2009).
This phenomenon raises two questions – first, what gave rise to these improvements? We
know the answer to this question is that these effects are the result of multiple complex
interactions resulting in nested effects which are beyond the control of any single individual.
But more importantly, the question is how do we create similar non-linear effects? This is a
question that is not usually asked when HIS strengthening interventions are designed,
developed and implemented. Because non-linear effects are neither under the direct control
of any single person, nor are they predictable, they cannot be guaranteed. Rather, the

126
challenge is to create the environment in which non-linear effects in support of HospMIS
efforts can happen, or where the effect of adverse non-linear effects can be countered.
Despite increasing literature in the IS research field on CAS, managing non-linearity is an
issue that has not received much attention to date (see for example articles related to co-
evolutionary theory, many of which hardly address non-linearity in any detail such as (Dooley
1997; McKelvey 1997; Anderson 1999; McKelvey 1999b; Benbya and McKelvey 2006a;
Merali 2006). One of practical contributions of this thesis is to expand the range of
approaches to manage non-linearity.
5.3.2. Practical Implications 2: Managing Non-linearity: I suggest three approaches in support of creating non-linear effects. First, focus resources in
a few key areas (Gladwell 2000). An application of this approach is suggested in the
“hierarchical cluster approach” to HISD (Shaw and Braa Forthcoming) which focuses not only
HMIS resources, but also other resources on facilities identified to be priority target facilities.
Secondly, encourage the creation of self-organizing groups. This is discussed in more detail
below. Thirdly, establish processes to ensure the key contributing factors to non-linear
systems are supported and developed. The key contributing factors to non-linearity are an
efficient communication network that links levels and sub-systems within the organization,
mechanisms establishing close links between sub-systems, frequent feedback, and
decentralized power and control within a framework that encourages self-organization and
innovation (Dooley 2002).
While these approaches have been suggested to create non-linear effects, they can also be
used to mitigate or counter the unwanted effects of non-linearity. In other words, non-linearity
cannot be countered with linear deterministic approaches, rather, non-linearity should be
managed with non-linearity. If unwanted non-linear effects are predominating, they can be
countered by increasing or decreasing feedback width or breadth, increasing or decreasing
size of groups, and increasing or decreasing integration. For instance, linkages between
HospMIS and sub-systems will always require careful consideration whether to increase
fragmentation, or to decrease it, and whether to link systems tightly or loosely. The answer to
this will usually be apparent from the context, and the availability of skills and resources, and
may change from time to time, depending on changes in other areas of the CAS as a whole.

127
5.4. Understanding the Context 3: Self-organizing networks displaying emergent behaviour
The notion of “networks of action” have been used to effect sustainable HISD in resource
constrained contexts (Braa, Monteiro et al. 2004). In this conceptualization, not only are the
networks local groupings constituted by a diverse range of actors (academics, students,
health workers, developers, HIPs), but they are also interconnected networks across
countries and regions. They are loci of action and learning. At times the networks are
“marginal, alternative…opposing the …dominant network” (p. 342). In a similar vein, (Mosse
and Sahay 2005) develop the notion of “counter networks” in support of Castells’ (2000)
assertion that despite advances in technology and networks, there remain islands of people
who cannot join the networks and take advantage of increased interconnectedness and
globalization afforded by increased access to ICT’s. They use the term counter networks to
emphasise the need to avoid technologically deterministic assumptions. For example the
assumption that by providing access to ICT, people will automatically be able to take
advantage of them. Rather, because of contextual peculiarities, a variety of approaches, over
time, and at multiple levels of the system are required to optimize the use of ICT. They
identify the numerous networks that health workers belong to, not only professional but also
social and familial, and recognize that efforts at strengthening the HIS do not take into
account these sometimes conflicting alliances. Complexity science helps us understand that
individuals belonging to professional networks can utilize their membership of other networks
(such as the social and familial) to not only expand their knowledge and experience, but also
spread their knowledge and experience, thereby creating non-linear effects in support of
HISD.
5.4.1. Self-organizing groups in support of co-evolutionary HospMIS development:
In this thesis, I seek to advance the understanding of self-organizing groups as contributing
to the co-evolutionary stance. The self-organizing groups described in the cases in this thesis
are “networks of action” focused on achieving specific objectives. For example, in Zambia,
the groups were established to effect the roll-out of training across the country, and in the
anesthesia department in Malawi to develop the departmental IS. New Hope Hospital in the
Eastern Cape (Jacucci, Shaw et al. 2006) is an example of a network of action for PAH to
improve their management and financial reporting. The development of the self-organizing
group is an outcome of a process of bringing diverse people together and providing a vision
that they can buy into, and then helping to create the circumstances that allow further sub-
128
groupings to develop. Similar to the “Practice”, in each of these cases an attractor focuses
the groups action (Alaa and Fitzgerald 2004).
Creating “attractors” is not an insignificant task, and does not happen overnight. Attractors
emerge as a balance between a bottom-up and a top-down process of negotiation between
stakeholders with divergent views. By incorporating people with diverse skills, experience
and from different levels of the hierarchy in the process, turbulence arises through the
expression of different views. These are the areas which provide opportunities for
constructive engagement, adaptation and learning (Eoyang 1996; Dooley 1997). The
attractors not only focus resources, but also are the sources of instability and innovation in
that they unsettle the established status quo. The self-organizing networks serves not only to
adopt the attractors locally, but also to debate the validity and expand the application of the
attractors through other networks. Rather than having the end result as a trade-off between
the parties involved which does not engender support for the system or its use (Silva and
Hirschheim 2007), a win-win solution should be sought. The nature of attractors described
(namely a flexible EDS and a customisable software program that can adapt to changing
circumstances) provide solutions that accommodate different perspectives and thereby
generate support and commitment to the product (Braa, Hanseth et al. 2007b).
5.4.2. Self-organizing groups pushing for change: An implicit purpose is to use the group to stimulate the expansion of the network of
supporters (on the assumption that participants would be “converted” at best, or even if they
remain “agnostics” at least they will talk about their experience) and self-organizing groups.
In the case of the PAH group this happened by the creation of committees to help one
another, and to look into financial issues. In the Zambian case, the MoH specifically asked
‘tutors” from the nursing colleges to attend the training so that they could grow into important
roleplayers in the undergraduate training process by becoming aware of the training
materials, and adopting the content in their courses. An attestation to the effect of this is the
fact that subsequent to the “training of trainers” course, one of the schools contacted my
Zambian counterpart to ask for his assistance in effecting a training course that they wished
to offer. This example demonstrates how both the network was expanded and potentially a
new self-organizing group could emerge.
The expansion of the network has a purpose in that it helps create a critical mass pushing for
change. This is a very different approach to the “revolution” suggested by Silva and
Hirschheim (2007). Instead, the focus is on creating networks of support which gradually

129
increase the critical mass supporting change. Not only do these networks effect the change
required, but potentially they become agents of continuous change, underpinned by
empowerment processes that allow the participants to grow, learn, and adapt to changes in
their local environments. Through this process the pace of change fluctuates – at times it is
rapid, but at times is slow. The landscape is thus constituted by an upward gradient
(improvement) with small peaks representing punctuated revolutions of small change. This is
the nature of the co-evolutionary process we strive for, and which is discussed in more detail
below.
5.4.3. Practical Implications 3: Managing self-organizing groups: The self-organizing groups are thus also learning networks, and networks of innovation. This
is in some instances an explicitly stated purpose. In all these groups I try to establish them in
a way which draws heavily on participatory action research (PAR) approaches of action,
reflection and learning (Crabtree and Miller 1992; De Koning and Martin 1996). This
approach not only helps to empower participants (for instance on the attractor and its use),
but also establishes an informal authority in the group to moderate behaviour. The expected
standard for performance (akin to the formal structure referred to by Stacey (1995)) is set
through formal documents (memos, circulars, training guidelines), but the group inevitably
takes on the responsibility to critique deviants, and emulate best practice. No “policeman” is
needed in this environment as it is established as a “learning environment”. Through the
process of learning and empowerment, the self-organizing groups are a means of diffusing
the power and control located in the centre. They become a mechanism for enabling local
action that can adapt to local changes within the confines of the rules and regulations of the
rigid bureaucracy of the health system, the source of bounded instability (Stacey 1995).
The challenge then, having enabled the creation of these self-organizing groups and
networks, is to keep abreast of the emergence of new self-organizing networks, and to
encourage them to share their experiences with others, especially given the expectation that
these networks will come up with innovative solutions to local problems. The very forum that
legitimized the establishment of self-organizing groups can then become a forum for
feedback and further development of innovations arising from these processes.
5.4.4. Conclusions: In concluding this section, I suggest that the role of self-organizing groups is not only to
address a specific set of tasks, but also to stimulate learning and change in a “learning
environment”. At least three other useful roles are discerned. One is to stimulate the

130
expansion of the network of supporters through including “connectors” (after Gladwell (2000))
explicitly in the groups so that they can “spread the gospel”. Second, support the creation of
other self-organizing groups. Third, expand the critical mass of supporters pushing for
continuous change.
5.5. Sustainable IS13 Development: The Co-evolutionary Model:
The aim of this section is to provide a conceptual framework for the sustainable development
of HIS. The conceptual framework for sustainable HospMISD is drawn from two main
literature streams. Organizational sustainability has been conceptualized as the outcome of
successfully balancing exploration and exploitation drives (March 1991; Koza and Lewin
1998; Lewin, Long et al. 1999). The challenge within the public sector with respect to IS
development in resource constrained settings is to achieve a balance between these
approaches, especially given the staff shortages, shortage of skills and lack of flexibility.
Organizational learning and absorptive capacity have been prominent themes in the
organizational science literature (Crossan, Lane et al. 1999; Van den Bosch, Volberda et al.
1999; Zahra and George 2002), and organizational learning is central to the process of
balancing the explorative and exploitative drives (March 1991; Crossan, Lane et al. 1999). I
bring these streams together (organizational learning and balancing exploratory and
exploitative drives) by building on the work of Crossan, Lane et al. (1999). Using the notion of
combinative capabilities as a measure of organizational absorptive capacity, I compare the
public sector organizations with HISP-SA (as an example of a NGO organization working in
partnership with the public sector). This analysis suggests that public sector organizations
are less likely to pursue explorative drives, while an NGO like HISP-SA is more inclined to do
so. This suggests that a co-evolutionary partnership between the two organizations might be
synergistic. A useful framework with which to view sustainable HISD is presented. I then
expand this theoretical framework to account for the HISP-SA experience in evolutionary
software development in Africa as a co-evolutionary process which is effected across three
13 In this section and the next, I refer mainly to IS development since the insights I present here are
based on my longitudinal involvement in health IS development with the HISP-SA organization in
particular. I do this recognizing that my experience in hospital information system development is
shorter. However, I suspect that the principles suggested here will apply equally to hospital information
system development.

131
areas of practice, namely within HISP-SA, within the public sector organization, and between
the two organizations.
The remainder of this section is structured as follows. In the next sub-section, I examine the
challenge of sustainability. Drawing on the case studies from this thesis, and other literature,
the possibility that a dynamic partnership can potentially exist between the public sector and
an implementing agency (such as an NGO like HISP-SA) is presented. Thereafter, in an
effort to further asses the complimentary skills between an NGO and the public sector, the
absorptive capacities of the two organizations are compared. In the next subsection, I
explore organizational learning as a co-evolutionary process, and suggest a model for co-
evolutionary HISD. A summary is provided in the last sub-section.
5.5.1. The challenge of sustainability Sustainability is “…the challenge to make an information system work, in practice, over time,
in a local setting. This involves shaping and adapting the systems to a given context,
cultivating local learning processes, and institutionalizing routines of use that persist over
time (as well as when the researchers leave and external funding is over).” (Braa, Monteiro
et al. 2004) (p. 338). In addressing the challenge of sustainability in HISD in resource
constrained settings, the importance of establishing networks of sites engaged in learning
processes around working prototypes of HIS is stressed (Braa, Monteiro et al. 2004).
Interventions are aligned with “existing institutions, competing projects and efforts as well as
every day practices.” (p 359). They suggest mechanisms for the vertical and horizontal flows
of software training and expertise based on an action research approach called “networks of
action”. These are characterized by a network of sites (organizations located in different
countries) linked together in a framework to encourage vertical and horizontal flows of
information and experiences between the sites. The network is comprised “neighbourhood
networks” (Dooley 2002) of a diverse range of actors who are aligned around a sufficiently
uniform agenda, and who also pursue local interests and innovations linked to local practices
and every-day actions of existing institutions.
This description of the HISP network provides some insight into the ongoing development of
the network, and the circulation of ideas and approaches within the network. But what this
conceptualization does not elaborate on is the differences between the HISP actors and the
MoH officials, nor does it elaborate on the nature of the partnership between the HISP
network and the respective MoH. They (the HISP network and the MoH) are not a uniform
group, and are not a single close-knit organization. Rather, they are individuals who establish

132
links across the networks within each of the organizations. In the remainder of this sub-
section I explore the differences between these organizations in an attempt to identify
insights that might strengthen the partnerships and alliances.
A complimentary view to that of (Braa, Monteiro et al. 2004) is presented by Shaw and Braa
(Forthcoming) who, drawing on 10 years of experience in HISD in Africa, suggest that the
development of sustainable HIS is a “continuously evolving balance between ISD, human
capacity development and scaling approaches” (p.18). The approach depicted in this
description is supportive of strategies suggested by (Kimaro and Nhampossa 2005) to
increase the sustainability of HISD initiatives. In exploring reasons for “unsustainable” HISD
projects, they identify two partnerships that are problematic. First, the partnership between
the MoH and donor organizations is weak because of the inadequate institutional and
technical capacity of the MoH, the tendency to allocate short-term contracts to (often foreign)
agencies for software development, and the inappropriate balance exerted by donors over
the MoH. It is interesting to contrast these problems with the approach described by Shaw
and Braa (Forthcoming), where HISP-SA is seen as a partner to government. As such HISP-
SA complements the lack of technical HIS capacity in the public sector, both at a micro level
(for instance the interactions between the HISP team practitioners and the emerging cadre of
HIP) and at the macro level (where for instance the HISP team is appointed to support and
advise government in the re-design of their HIS (as occurred in Zambia)). Short term
contracts remain a problem because they generally reflect a linear approach to HISD, and
often the contracted organizations approach the problem with a purely technical solution. The
third area, namely the inappropriate balance exerted by donors, is increasingly being
challenged because of the availability of FOSS solutions such as the DHIS (see for instance
http://dhis2.com/), Care2X (see for instance http://www.openclinical.org/prj_care2x.html ) and
OpenMRS (See for instance http://openmrs.org/wiki/OpenMRS, and Seebregts, Mamlin et al.
2009) all of which have a significant track record of successful implementations in resource
constrained settings. The availability of these solutions is shifting the power of control over
software development projects from private, for-profit-orientated software developers, into
networks composed of public sector institutions, academia, NGO’s, and some private sector
organizations.
The second partnership that is identified is that between the MoH and software development
agencies. Three problem areas are identified, namely the lack of co-ordination of software
development efforts, the poor and inadequate understanding of user requirements, and
rigidity in design efforts. While the first remains a problem, there are significant efforts
directed towards addressing the fragmentation of HIS (see for instance Evans and Stansfield

133
2003; Boerma 2005; Boerma, Bos et al. 2008; Health Metrics Network 2008). User
requirements are increasingly being addressed through the availability of a range of FOSS
products (as described above) which has a certain inherent flexibility. Given these efforts, the
possibility of a long term relationship between a NGO, and the public sector, to support
ongoing development of the HIS becomes increasingly attractive.
In summary, in response to the suggestion that HISD are unsustainable because of
predominant organizational and institutional arrangements, two views on sustainable HISD
from the body of literature on the HISP network are presented. The one describes the
“networks of action” approach, but is critiqued for not detailing explicitly the mechanism by
which skills are transferred to the public sector. The other views HISD as a continuously
evolving balance between ISD, human capacity development and scaling approaches, which
provides resources that counter the factors resulting in unsustainable systems. These
resources are the availability of FOSS, and the establishment of partnerships between the
public sector and an implementing agency, such as an NGO. The partnership allows the
NGO to complement the public sector organization with HISD skills, and to support HISD at
both the micro and macro levels. In the next sub-section I examine organizational absorptive
capacity in relation to sustainability.
5.5.2. Sustainability and organizational absorptive capacity: In order to further develop the complementary nature of the relationship between an NGO
like HISP-SA and a public sector organization, I expand the framework developed in Chapter
2 on absorptive capacity (Van den Bosch, Volberda et al. 1999) (see Table 16). The analysis
shows that an organization like HISP has the characteristics to have a high absorptive
capacity and can potentially complement the relatively slow absorptive capacity that is
evident in the public sector. The question is how can such a partnership be established?
Before addressing this question, the question of staff turnover warrants some discussion.

134
Table 16: Comparative Assessment of Absorptive Capacity between Public Sector and NGO Organizations
Combinative Capability
Hospital14 as an organization HISP-SA15
Explanation Effect on absorptive capability
Explanation Effect on absorptive capability
Organizational form
Functional form, or perhaps divisional form depending on size
Negative Matrix form with extensive networks and self-organizing groups and local autonomy
Positive
Systems capabilities
Bureaucracy with strong and very formalized systems capabilities
Negative Weak, rules and procedures based on oral
Mostly positive
Co-ordination capabilities
Strong relationships within and across functional groupings in hospitals
Positive Strong relationships within the organization and between the organization and many external partners
Very positive
Socializing capabilities
Reasonably strong corporate identity, tending to be insular.
Mostly negative
Reasonably strong corporate identity but not so strong as to prevent external knowledge from being assimilated
Positive
Overall assessment
Mainly negative
Mainly positive
Staff turnover Reasonably high with low levels of institutional memory
Mainly negative
Reasonably stable, with high levels of institutional memory and sufficient injection of new ideas
Mainly positive
The rapid turnover of staff within the public sector is an issue that has been described in the
literature (Schneider, Blaauw et al. 2006; Padarath, Chamberlain et al. 2007), and which is
frequently experienced in the health information sector of public sector organizations in
14 I have used a hospital as an example of a public sector organization because it provides a more
focused unit of analysis. However, the same pattern for absorptive capacity is likely to be found for the
health department as a whole, or a district office as a whole. It is therefore legitimate to generalize this
finding to the case of HISD within the health sector as a whole. 15 I use HISP-SA as an example of an external support agency for two main reasons. First, my
empirical research was largely conducted within this organization. Secondly, as is indicated in the
thesis, the HISP-SA team provides a broad range of skills across the spectrum from professional
software developers to medical professionals. It would not be appropriate at this stage of our
understanding to generalize the role/influence of this team to other NGO’s, or to other HISP teams.

135
resource constrained settings. For instance, a survey amongst health information officers
done in South Africa in late 2006 indicated that only 20% of information staff had been in
their positions for more than 5 years, and 30-40% less than one year (Loveday, Smith et al.
2006). The impact of the staff turnover is advantageous in the sense that new staff bring new
ideas into the team, and in many cases information officers have been promoted up the
hierarchy, thus increasing the organizational knowledge about HISD. However it is
disadvantageous in that the leaving staff are often not available to act as a resource for the
incoming person, positions that are vacated remain unfilled for long periods of time, and
investment in temporary appointments may not support long term sustainability. For
example, in one instance, the team had to train 4 different people as a hospital information
officer over a 6 month period16. The net result is a decrease in institutional knowledge on HIS
at the local (micro) level. In contrast to this, the HISP team have had a reasonably stable
team. While too much stability can be disadvantageous, there has been sufficient turnover to
inject new ideas into the team. In addition, new ideas have come through team members
undertaking further studies, and links with other nodes in the HISP network (Braa, Monteiro
et al. 2004; Shaw, Simoonga et al. 2008).
The assessment tabled above suggests that overall, an NGO like HISP-SA would be more
inclined to pursue exploration drives than would the public sector hospital, and therefore
there is a complementarity which helps to improve the hospital organization’s absorptive
capacity. This understanding provides insights into the meaning of co-evolution in the domain
HISD in resource constrained settings.
5.5.3. Organizational learning as a co-evolutionary process: Organizational learning is based on four premises (see Text Box 5) (Crossan, Lane et al.
1999). The key aspects of these premises are the balance between new learning and using
existing learning, the multilevel nature of the learning process, and the social and
psychological learning processes. The latter warrants some discussion.
16 Project report for the Eastern Cape Hospitals project, 2005.
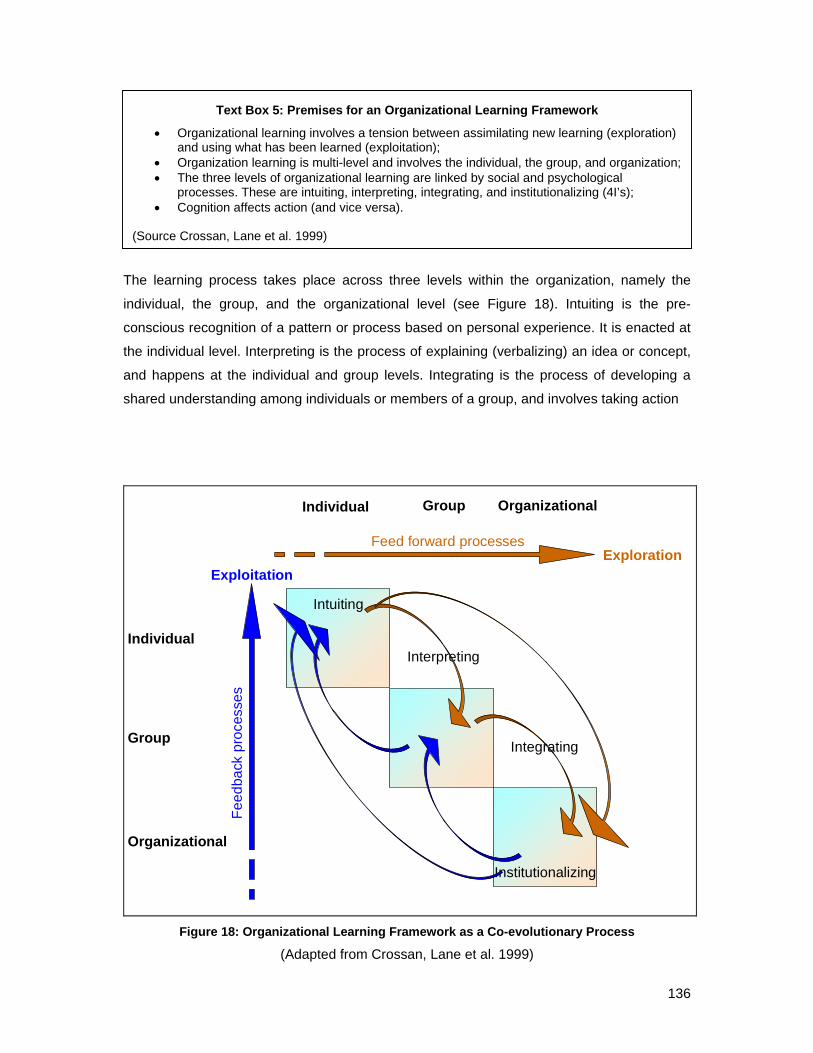
136
Text Box 5: Premises for an Organizational Learning Framework • Organizational learning involves a tension between assimilating new learning (exploration)
and using what has been learned (exploitation); • Organization learning is multi-level and involves the individual, the group, and organization; • The three levels of organizational learning are linked by social and psychological
processes. These are intuiting, interpreting, integrating, and institutionalizing (4I’s); • Cognition affects action (and vice versa).
(Source Crossan, Lane et al. 1999)
The learning process takes place across three levels within the organization, namely the
individual, the group, and the organizational level (see Figure 18). Intuiting is the pre-
conscious recognition of a pattern or process based on personal experience. It is enacted at
the individual level. Interpreting is the process of explaining (verbalizing) an idea or concept,
and happens at the individual and group levels. Integrating is the process of developing a
shared understanding among individuals or members of a group, and involves taking action
Organizational
Organizational
Group
Group
Individual
Individual
Feed
back
pro
cess
es
ExploitationExploration
Feed forward processes
Intuiting
Institutionalizing
Interpreting
Integrating
Figure 18: Organizational Learning Framework as a Co-evolutionary Process
(Adapted from Crossan, Lane et al. 1999)

137
through mutual adjustment, or adaptation of existing processes and procedures. This may be
an ad hoc process initially, but gradually becomes more formalized, and if it begins recurring
on a regular basis, then it becomes institutionalized. It takes place at the group and
organizational levels. Institutionalisation is the routinization of actions, processes, procedures
or systems (Crossan, Lane et al. 1999). It is the process of embedding learning that has
taken place at the individual and group level into the organization.
The processes depicted in the organizational learning framework (OLF) meet the criteria of
co-evolutionary processes in that they are subject to multilevelness and embeddedness,
multidirectional causalities, non-linearity, and path and history dependence (Lewin and
Volberda 1999). The OLF suggests concurrent processes that are fed by positive and
negative feedback processes.
To illustrate the co-evolution process between the two organizations, I first, draw on the
description provided earlier of the identification of an attractor (see section 5.4.1). Our
experience demonstrates that the identification of a solution to a problem is not immediately
recognizable as an “attractor”. The identification of the attractor has emerged through co-
evolutionary processes taking place at and between at least three areas of practice, namely
networks within HISP-SA and between HISP-SA and other networks (for instance with the
HISP international network), between HISP-SA and the public sector hospital, and within the
public sector hospital networks and between these networks and their external environment.
Once an “attractor” becomes obvious, its subsequent utilization as a point around which to
rally stakeholders becomes part of an ongoing co-evolutionary process. The attractors can
then be offered for use in other contexts, but “attractors” cannot be guaranteed to have the
same effects in the new sites. Rather their acceptance needs to be the modified and
adjusted through feedback loops between the macro and micro levels as the co-evolutionary
processes unfold and move through the phases of interpreting, integrating, and
institutionalization. These processes continue to occur as co-evolutionary processes
between the respective organizations, and their environments. The net result is that the co-
evolutionary process is a dynamic equilibrium as the organizations undergo change in
response to changes in their immediate environments.
5.5.4. The co-evolutionary information systems development model: In conceptualizing the organizational learning framework as a co-evolutionary process for
learning about HospMISD, two aspects of the model are developed. First, a co-evolutionary
process between an NGO and a public sector organization is potentially a relationship which

138
allows the strengths of each organization to complement one another. Secondly, co-
evolutionary processes do not happen only between the two organizations, but also within
each organization, and between each organization and other organizations with which it
interacts. These two aspects are explored in detail in order to define a co-evolutionary ISD
model.
Given the analysis of absorptive capacity provided above, it is clear that a public sector
hospital (and likely public sector organizations in resource constrained settings) will be more
likely to pursue exploitative processes than explorative processes, and this is also our
experience. In fact, most public sector organizations in South Africa are focused on
exploitative activities. In contrast to this, it would appear as if the ability of the HISP-SA
network to balance explorative and exploitative activities is well developed. While this is an
issue that warrants further research, for now I will focus on the HISP-SA teams’ ability to
pursue the exploration drive, and assume that the exploitation drive is sufficiently developed
to not result in the organizations’ downfall. The exploitative activities are driven internally
through its team support structures and by its need to compete with similar organizations for
work. Because HISP-SA has access to a diverse range of markets, end-users, and
researchers (through its own networks and project activities in Nigeria, Liberia, Zambia, and
South Africa for instance, and linkages with the HISP international network in sites such as
India and Vietnam), potentially it should be able to maintain the explorative drive while also
balancing the exploitative drive. This suggests that the HISP-SA team is well placed to
manage both legacy systems (such as the DHIS) and disruptive technologies that may
threaten the legacy systems (Dosi 1982; Christensen 2000), and to facilitate public sector
access to these technologies through the co-evolutionary relationship.
As is suggested above, the co-evolutionary processes occurs in at least three areas of
practice (see Figure 19), and in relation to changes in the health and ICT sectors.
• First, intra-organizational co-evolution takes place in the public sector hospital in
response to its internal dynamics, and in relation to the environment. The co-
evolutionary process within the hospital is strongly influenced by the close link
between the hospital and the health sector as a domain of influence. For instance, as
the health sector understands more about the HIV/AIDS pandemic, this knowledge is
influencing the way patients are treated and managed, and the kinds of information
that are important (see for instance (Rugg, Carael et al. 2004; Wolf, Bicego et al.
2004). Similarly for the more recent H1N1 pandemic. Unlike the strong links between
the health sector and the hospital, the links between the hospital and the ICT sector

139
Feed
back
pro
cess
esExploitation
ExplorationFeed forward processes
Hospital co-evolving in response to
changes in the health sector and in response to
interaction with HISP
HISP co-evolving in response to
changes in the ICT sector and in response to
interaction with hospital
Hospital management information system co-evolving in response to
inputs from both partners
Figure 19: The Co-evolutionary Model for Hospital Management Information Systems Development
are much weaker, and often non-existent (Kimaro and Nhampossa 2005; Bada
2006).
• Secondly, intra-organizational co-evolution takes place in the HISP-SA team, and
between the HISP-SA team and its networks. This is strongly influenced by
developments in the ICT sector (as an important domain of influence), and to some
extent, by developments in the health sector (as another domain of influence). For
instance, intuiting around a new concept might originate in the HISP-India part of the
HISP network, be interpreted within the HISP-International network, integrated within
the HISP-SA team, and then be introduced as a concept to the hospital (Braa,
Monteiro et al. 2004; Shaw and Braa Forthcoming). The complimentarity between the
public sector hospital and HISP-SA is that HISP-SA as an external support team
provides strong links to the application of ICT’s in the health sector, and therefore
mediates between the health sectors need for information related to changing health
care practices, and the most appropriate solution available from the ICT domain. This
is the third sphere of influence, namely between HISP-SA and the hospital

140
• Inter-organizational co-evolution takes place between the hospital and HISP-SA
team, at numerous levels between the micro and macro levels, as the hospital
management IS evolves through the co-evolutionary processes, and as each
organization changes in response to its co-evolution with its own networks of
influence. The interactions that take place at these three levels are a complicated
web of intuiting, interpreting, integrating and institutionalization since newly developed
concepts introduced by any of the organizations may require some time to be re-
interpreted, and integrated before becoming institutionalized. In this process, it may
also be modified, and changed, which then allows feedback to the respective
organizations as an improvement (exploitative effect) or even as a new development
(exploratory effect). However, from the preceding discussion on absorptive capacity,
we can assume that the nature of new developments from the HISP-SA side of the
partnership are likely to be exploratory in nature, while the public sector side will likely
drive the exploitative component.
Crosson, Lane et al. (1999) suggest that there are two particularly problematic relationships,
namely the interpreting-integrating (feed forward process) and the institutionalizing-intuiting
(feedback) process. The former is a challenge because it requires not only changing a
shared reality, but also the ability to vocalize and express an idea in a way that can shift the
existing group code. Experiential learning and action research provide a mechanism to
overcome this challenge through joint action (such as described in the section on self-
organzing groups) which can then create a shared understanding (Crossan, Lane et al. 1995;
Braa, Monteiro et al. 2004). For instance, focusing on an attractor provides the opportunity
for shared experiences that can potentially support integration processes.
The second challenging relationship is that between institutionalizing and intuiting, and is the
feedback process. This relationship is problematic because institutionalization can easily
drive out intuiting. Intuiting tends to go against the drives towards exploitation because it
upsets the status quo. Organizations overcome this by establishing research and
development units and specifically allocating resources to ensure that exploration persists.
However, as is pointed out by Christensen, many organizations that did have effective
research and development units were still not able to maintain their competitive advantage,
largely due to the challenge to match new innovations to a market, given that customers of
today seldom appreciate the products of tomorrow (Christensen 2000). The HISP
international network is potentially an interesting model to overcome this challenge, being
chatacterized by intra-organizational diversity comprising different professionals (doctors,
nurses, programmers, information technologists, and environmental health workers), different

141
professional areas of interest (academics, HIPs, use of information, data quality issues), self-
organizing groups ensuring cross fertilization across a range of diverse markets and
contexts, and with a range of technologies and approaches.
5.5.5. Practical Implications 4: Effecting co-evolutionary health information systems development:
The co-evolutionary model potentially becomes a vehicle within which the co-evolutionary
framework for ISD can be applied. For instance, as indicated earlier, “attractors” and the
principle of integrated independence can be usefully utilised within this model to stimulate
intuiting, interpreting, integrating, and institutionalizing products and processes. The co-
evolutionary model can potentially maintain many rugged landscapes on various fronts which
can balance exploitative and exploratory processes, and address the extreme heterogeneity
that characterizes the environment. HISP-SA is already engaged in this type of co-
evolutionary model, and my understanding is that HISP-India has a potentially long-term
arrangement with the National Rural Health Mission which can be conceptualized as a co-
evolutionary model. However, viewing sustainable HISD through this model opens a whole
vista of approaches for sustainable HISD from the perspective of the public health sector,
and for the HISP international network.
The way in which I have described the public sector hospital can be critiqued for being too
“all encompassing” because within any large organization, there are likely to be “fast
advancers” as well those who are slow on the uptake. This reflects the challenge between
developing macro level concepts and their micro level application. I recognize this, and as
will be seen in the next section, suggest that any co-evolutionary process should identify the
fast advancers, and involve them in the processes. In this way, micro level initiatives can
drive the macro level processes. The more “fast advancers” there are, the greater the
likelihood that the system will be driven from within.
The co-evolutionary model for sustainable HISD warrants further scrutiny through application
of the model in different environments to those described, and through more detailed
analysis at micro and macro levels. The application of the model should be further evaluated
with respect to the optimum length and the specific focus of the partnership. For instance, the
partnership for strengthening the hospital IS in the Eastern Cape was only one year long,
and had a very specific focus, yet HISP-SA has maintained contact with the ECDoH through
a variety of other mechanisms, such as other (short term) projects, through providing support
funded from organizational overheads, and by virtue of joint participation in networks and
142
forums. The partnership is therefore in reality a long term one (even if informal in nature)
characterized by shorter periods of more intense partnerships secured by formal contracts.
Should HISP-SA and the MoH strive for formal partnerships of longer duration, or do short
term partnerships help to maintain the competitiveness between HISP-SA and other external
support agencies?
Understanding HISP-SA as a networked organization dependent and contributing to
innovations and developments in the health information sector suggests that the links within
the HISP international community, and with HISP nodes in other countries should be
strengthened. But, these linkages can only be strengthened if HISP nodes have a similar
understanding, and so this model has implications for the HISP international network as well.
Lastly, the model brings to the forefront questions about the breadth of scope that the HISP
exploratory drive should pursue in the health information sector. For instance, to date HISP-
SA has focused on strengthening systems for aggregated annonomised data, but is
increasingly being pressured to pursue work in the field of EPR systems. The model needs to
be researched further to consider how this drive should be addressed. For instance, should
HISP-SA develop the internal capacity to strengthen EPR systems, or should this be done
through partnerships between HISP-SA and other external agencies that have experience in
this area, or perhaps left unattended so that the public sector pursues its own solution
possibly through the private sector, or through a separate external support agency?
5.5.6. Conclusion: In conclusion, I have used the example of HISP-SA and a public sector hospital to suggest
that HospMISD in resource constrained settings can potentially benefit from a co-
evolutionary process that is effected between organizations with complimentary
exploitative/explorative drives. This model also applies to HISD with the public health sector.
At the same time, and in parallel to the co-evolutionary HISD between the two organizations,
each organization undergoes intra-organizational co-evolutionary processes and inter-
organizational co-evolution with its specific domain of influence. To this end I conceptualize
HISP-SA as an organization that is co-evolving with the public health system on one hand
and development in information technology and IS research on the other. I suggest that this
is an appropriate way to envision future health systems development given the dynamic
nature of technological advancement, and the relative limited ability of government to keep
abreast of developments in the ICT domain. I further suggest that the HISP-SA team (and
potentially the HISP international network) is different to that of private sector companies

143
because of its academic and non-profit motives, and that these enable it to maintain a
position within the zone of complexity that reflects the cutting edge of HISD. The co-
evolutionary process is a delicate process of initiating organizational change through mutual
learning processes that will eventually be institutionalized.
The model accommodates the concepts and approaches detailed under the co-evolutionary
framework very well, although the application of the model raises a number of questions
related to the long term nature of the relationship and the breadth of scope of the exploratory
drive should pursue. These are issues that will be explored in the next section where I
examine the impact this understanding has on the scaling of HIS. In this next section I first
use the district health system as my unit of analysis, and then generalize the findings to the
hospital sector.
5.6. Co-evolutionary Scaling of HIS:
In this section I first explore the current conceptualization of scaling of HIS, and then
conceptualize scaling as a CAS in order to provide some useful insights. This
conceptualization is then further developed by examining the scaling process along four
dimensions. A CAS inspired theoretical understanding of scaling of HIS is presented, using
key concepts from co-evolutionary theory.
5.6.1. The challenge of scaling: The challenge of scaling has been described as “…the problem of how to make one, working
solution spread to other sites, and be successfully adapted there. Beyond merely the
technical aspects of scalability, our concerns lie in how to reproduce and translate the
necessary learning processes alongside the spreading of artifacts, funding, and people.”
(Braa, Monteiro et al. 2004, p. 338)
Scaling of HIS has received substantial attention over the last few years, particularly in
relation to the HISP network and its use of the DHIS (Sahay and Walsham 2006; Saebo
2008; Shaw and Braa Forthcoming), but also in relation to the costs of scaling health
services (Johns, Torres et al. 2005), and in particular in relation to the scaling of HIV/AIDS
programs (Hanson, Ranson et al. 2003; McCoy, Chopra et al. 2005). Scaling has been
likened to a cultivation process (Bergqvist, Dahlberg et al. 2002) with the emphasis on
growing of the system from the bottom-up. This builds on the existing base. It assumes that

144
the process of change should not “upset, an organization more than what is absolutely
necessary to accomplish the task at hand” (ibid). Rather, weaker parts of the system should
be pruned away, allowing the stronger parts to persist. The focus here is on the users being
cultivated to perform their tasks differently in response to changes in the IT infrastructure. In
contrast to this, Hanseth (Hanseth 2002) describes the cultivation of the information
infrastructure using a bootstrapping approach to bring about change without disrupting the
installed base. In resource constrained contexts however, the heterogeneity of the context
presents a range of additional issues that need to be considered during scaling operations.
For instance, the implementing team’s skills need to be expanded, so that they can “seize
opportunities” from unplanned events, and use them to their advantage (Sahay and
Walsham 2006). In scaling HIS in Nigeria and Ethiopia, scaling is described as a balancing
act between access to human resources, technology, and data transmission (Shaw,
Mengiste et al. 2007). In addition, scaling requires mindful innovation to support the process
given that scaling typically proceeds in an uneven manner and “fast advancers” can then be
used to support the slower areas. Uneven development results in heterogeneity, which
increases the complexity of scaling processes (Shaw, Mengiste et al. 2007). In India, the
scaling of HIS is about “the escalation of complexity” characterized by the scaling of
institutional issues, politics and growing the implementing team itself (Sahay and Walsham
2006).
5.6.2. Conceptualizing scaling as a complex adaptive system: A number of aspects of the scaling processes described above suggest that CAS may
provide meaningful insights into the process. First, scaling is a multi-level process that is
enacted across multiple levels of the health system hierarchy from national to community
levels. Understanding the hierarchy, and its tendency to evolve quickly free of central control
is a useful conceptualization allowing scaling to be modularized into manageable
components. Secondly, within this hierarchy, groups and networks interact with one another
in ways that are not always visible, nor controllable. Scaling must therefore take into account
that it is a multi-dimensional process influenced by staffing issues, access to technology, and
escalating political complexity. Thirdly, scaling is likely to occur at an unequal pace, resulting
in heterogeneity, and increasing complexity, but also providing opportunities for innovation.
Fourthly, scaling is described as a developmental process that gradually builds on earlier
iterations of the system (Shaw and Braa Forthcoming). This suggests that scaling can be
conceptualized as a co-evolutionary process similar to that described in the preceding
section. Fifthly, co-evolutionary processes are characterized as “perpetual novelty” (Axelrod
and Cohen 1999) (p. 10). Similarly, the imperative to achieve coverage of “all or none”,

145
suggests that HISD is an inevitable scaling process that will never end. Scaling of HIS can
thus clearly be conceptualized as a CAS that is likely to experience non-linearity and
frequent change in response to an environment characterized by uncertainty and nested
effects.
5.6.3. Defining scaling along four dimensions: Before applying CAS principles to the scaling processes, I would like to explore how scaling
is currently defined. (Sahay and Walsham 2006) define scaling as “the expansion of this
system in scope and size (for example, making the system accessible to more users or
increasing its functionalities)” (p. 185). Scaling often includes the extension of the existing
system down the health system hierarchy, within the same geographic area (when for
instance the data hierarchy is expanded by adding data from community health workers and
related to a parent health facility) (see Figure 20). This we17 term “deepening” the geographic
scale (Saebo 2008) The geographic scope is widened when new geographic areas are
included in the system. Scope is used to describe the functionality (for example represented
by system modules) of the system in use, or the range of health programs (e.g.
immunization, maternal health, financial information, hospital services, etc) that are
incorporated in the system. The scope is “widened” when new functionality is brought into
use in the system, or when additional datasets are added. But the scope is “deepened” when
the existing functionality or existing program data is used for more sophisticated purposes,
for instance when user maturity increases and the existing information is used to inform
advanced health planning.
17 I am grateful to Johan Saebo for sharing his insights with me into the deepening of the geographic
and scope dimensions. These are based on his PhD research and experiences in scaling the DHIS in
Sierra Leone.

146
Deepening of geographic scale
to new levels in the HS hierarchy
Widening of geographic scale
across new geographic areas
Deepening of scope as
evidenced by increased user
maturity
Widening of scope by adopting new functionality
Scaling the scope of the
system in use
Geographic scaling
Figure 20: The Dimensions of Scaling Health Information Systems
5.6.4. Effecting scaling using the co-evolutionary ISD model: While the above conceptualization allows the different dimensions of scaling to be examined
individually, in reality the scaling processes usually happen in parallel to the evolution of the
software and other components of the HIS (Shaw, Mengiste et al. 2007). Widening the
geographic scale is usually the first dimension to be effected as this serves to satisfy the “all
or nothing” imperative (Braa, Monteiro et al. 2004, p. 340). While the scaling of one
component is being effected, software development, or development of other components
continues and new functionalities are added, or existing components improved – as a result
of the processes taking place within HISP-SA and its interactions with other networks
described in the co-evolutionary ISD model. But as the new pool of users come to
understand the system, and its application to their context, they invariably identify additional
functionalities (the demand for expanded scope) to address their specific contextual needs.
Gradually the system is expanded with the new users’ requirements, and additional
requirements of other users. So the system co-evolves in relation to scaling efforts. The re-
introduction of the new components of the system can then happen as a conscious effort of
“updating” the existing pool of users with the new functionality, or it can happen through a

147
gradual diffusion process of self-exploration as pool of users install updated versions of the
system at their own pace.
Whatever the process, the existing pool of users are exposed to not only the functionality
(scope) they required, but also different functionalities that potentially expand their use of the
system. I suggest therefore that scaling can be conceptualized as an inevitable scaling
process (Shaw and Braa Forthcoming) as geographic scaling is succeeded by co-
evolutionary waves of deepening the scale, and/or expansion of the scope, and/or increase
in user maturity
Viewing scaling as a co-evolutionary process within a CAS potentially provides useful
insights into the management of the process. For instance, applying the organizational
learning model to the scaling process suggests that “fast advancers” might be pockets of
organizational capacity that demonstrate explorative tendencies, and could be harnessed to
support processes in other sections of a large bureaucracy. They can also become sites of
innovation, especially if allowed to pursue their interests within a bigger organizational
framework as suggested by the principle of integrated independence. The model recognizes
the difference between the three levels of the organization, and reminds us that scaling is
about the individual, and that the key to scaling is in fact the dynamic that Crossan, Lane et
al. (1999) identified as problematic, namely the interpreting – integrating process. Identifying
activities (such as attractors) that can bind potential users in this process would be important
for a successful scaling operation.
5.6.5. Practical implications 5: Scaling as an escalation of complexity:
Scaling in any dimension can be conceptualized as a process that increases the complexity
of the system (Sahay and Walsham 2006). This is because scaling in any of the four
dimensions expands the pool of users and the networks in which they operate. For instance,
it is obvious that geographic scaling (whether widening or deepening) expands the pool of
users. But each user is part of a network, for instance PHC facilities belong to a network that
is usually distinct to that of the hospital network. Widening the scope brings in another set of
networks associated with additional functionalities, or different programs. And deepening the
scope expands the complexity because not only does it bring in another set of users, it also
escalates the technical complexity by creating interdependencies between different datasets
(see for instance Jacucci, Shaw et al. 2006) and demands sophisticated information
processing. Each of these networks and groups belong to various self-organizing groups and

148
networks that transects formal hierarchical structures of the health system. Understanding
scaling processes along these dimensions helps to explain how HISD is susceptible to non-
linear effects and indeterminacy. This understanding re-inforces the value of restricting the
dimensions of the system that are to be scaled so as to reduce the complexity to
manageable proportions. It also provides a conceptual framework for understanding how to
manage non-linear effects when scaling is being effected.
The experiences of scaling PHC systems in the HISP network suggest that not all
dimensions can be scaled at the same time. In Zambia the focus was on scaling the
geographic dimension, while the other dimensions were held static (Shaw and Braa
Forthcoming). In Botswana, before scaling up, a “scaling down” process took place (Saebo
2008). This decision was the result of the restricted capacity of the implementing team to
manage the increased complexity that scaling across a wide range of programs would entail.
We see in these examples the decision on what to scale being informed by resource
availability. In effect, the geographic scaling was deemed more likely to be successful if the
volume of data to be collected was reduced. Drawing on the PAN model, I would therefore
suggest that widening the geographic scale is the most complex process because as the first
scaling effort it has to balance the human resource capacity, the technical and infrastructural
resources available, and the volume of data that the system can process. Once a system is
scaled to cover a certain geographic area, adjustments in the other dimensions of scaling
can be “piggy-backed” on the existing system. Thus, widening the scope of the system by
adding new functionality, or expanding the range of data sets used, does not necessarily
require establishing new data collection procedures, or training a new pool of users. Rather,
existing processes and systems can be used to accommodate the new components, or
existing users can be taught to apply similar routines to different datasets. The nature of this
process is different to that of geographic scaling, and requires different types of inputs. This
is an aspect that is seldom taken into consideration in the literature on scaling.
5.6.6. Practical implications 6: Scaling in Hospitals The processes described above suggest an inevitability in the scaling process – the pressure
of user demands fuels the scaling across the different dimensions, and success in these
areas fuels further technical demands of the software. But does this framework of scaling
also apply to hospital IS?
In the case of HospMIS development, the geographic scaling takes place in two dimensions.
The first is within the hospital, as additional units (wards) are incorporated into the IS. This
149
scaling corresponds to the widening of the scope of PHC programs because the data needs
of different hospitals wards, or departments are similar to the different data needs of
programs. The difference is that the scaling across all the different departments and
reporting units in one hospital is intense, and takes time (Berg 2004; Aanestad, Jensen et al.
2009). Unlike the PHC context, where widening the geographic scale incorporates new users
without expanding the scope of the system, in the hospital context, new units expand the
scope of the system in use. In this case, it is not about the “replication of the similar in a
network” like the “self-similarity between the branches and sub-branches of broccoli” (Braa,
Hanseth et al. 2007b, pg 19), but rather about bringing together apples, oranges and pears in
a fruit basket. Unlike the PHC context described above, scaling in hospitals demands the
concurrent scaling across not only the geographic dimension, but also widening the scope of
the system as new wards and departments are incorporated in the pool of users. This
increases the complexity of scaling HIS in hospitals significantly. The implementation of
HospMIS will require significant time to be invested in each hospital, and this must be
multiplied across all the hospitals in which the systems are to be developed (Berg and
Goorman 1999).
The geographic scaling of hospital IS is not only about working in a single hospital, but also
multiple hospitals. This means that scaling across hospitals must take into account the
implications of scaling in different sized hospitals (the configuration of a 1500 bed hospital is
very different to that of a 150 bed hospital, and the development of a hospMIS for a 1500
bedded hospital will be significantly more complex) and different types of hospitals
(psychiatric hospitals have more uniform demands for information compared to general
hospitals which have more heterogenous demands).
In summary, scaling of IS across hospitals and the health sector, must take into
consideration the dimension that is being scaled (geographic deepening or widening, and
deepening or widening of the scope). Secondly, while PHC facilities are generally fairly
homogenous in their information demands (as reflected by a fairly limited scope), hospitals
exhibit a great deal of heterogeneity in their scope because of variations in size and type.
Greater heterogeneity suggests greater complexity. The increased complexity can be
mitigated by restricting the geographic scaling process (reduce the speed of scaling, or
restrict scaling to certain units in each hospital e.g. maternity services only, OPD only, etc),
or restrict the scope that is scaled (therefore scale only basic throughput data in all hospitals,
and follow this with an expansion of the scope some time later).

150
5.7. Summary of Theoretical Contributions
In this section I first review the research objectives, and then briefly summarise my
theoretical contributions.
5.7.1. Research aim and objectives
Two main research questions were posed in order to address the aims of this research,
namely to develop complexity theory inspired conceptual models to understand the design
development and implementation of sustainable and scalable hospital management IS in
resource constrained contexts, and which take into consideration the complexities of the
hospital environment. The two research questions were:
1. Given the complex nature of the hospital environment, what are the socio-technical
considerations that contribute to the design of sustainable and scalable hospital
management IS in resource constrained settings?
2. How can the implementation process be designed to accommodate unexpected
contradictions that arise between the different realities of original intent and changing
needs in the implementation process?
It is important to recognize at this stage that while I initially set out to explore the “socio-
technical design, development and implementation” strategies in the objectives, the model
which emerges from this research does not specifically delineate these as distinctly
independent processes, but rather as iterative phases along a continuum of design,
development, implementation and re-design, develop, and implement. This pattern is along
the lines suggested by Heeks when he suggests that HIS projects should be viewed as a
“dynamic improvising developmental process” (2006, p. 132). For this reason, while in
chapter four I delineated clearly between design and implementation, in this chapter the
delineation is described in a much less clear form.
The research questions were clarified by framing five research objectives, which are tabled
below. By addressing the research objectives, the two research questions have been
addressed, and the research aim achieved.

151
Table 17: Addressing the Research Objectives through this Thesis
Research Objective Section contributing to this objective
1. Describe the complexities of the environment which influence HospMISD in resource constrained settings
Section 4.4.1 and section 5.2
2. Given the complexities of the hospital environment, conduct research and develop theoretical and practical insights related to the design of HospMIS that takes into account the socio-technical resource levels that exist in developing countries
Section 4.4.2 and sections 5.2.3, 5.3.2, 5.4.3, 5.5.5 and 5.6.5
3. Develop theoretical and practical insights into the successful implementation of HospMIS that accommodate unexpected contradictions that arise between the different realities of original intent and changing needs in the implementation process
Section 4.4.3 and sections 5.2.3, 5.3.2, 5.4.3, 5.5.5 and 5.6.5
4. Conduct research into the scaling of HospMIS, especially which aspects of IS development are universally scalable, and which require local customization
Section 5.6
5. Suggest ways in which the design and implementation strategies described will contribute to sustainable IS development in developing country contexts
Section 5.5
5.7.2. Main theoretical contributions In summarizing the theoretical contributions, I draw on the work of Walsham (1995) to
identify four categories of generalizations from the cases presented in this thesis, namely
contribution of rich insight, development of concepts, generation of specific implications, and
generation of theory. While it is noted that these categories are not mutually exclusive, I
present them in this order as it suggests a flow to building theory. Each category is discussed
separately, and expanded by using Lee and Baskerville (2003) analysis of generalizing and
generalizability.
a) Contribution of rich insight: While the individual papers each provide detailed descriptions of IS development in both
hospital and PHC settings in a variety of countries, in this thesis I have synthesized the
findings from these settings to describe the complexity of the environment and detail the
notion of “extreme heterogeneity” (see Table 18). In both these cases, the type of
generalization has been from data to description. As highlighted by Lee and Baskerville
(2003), the description of these findings does not mean that they can be generalized to all
other settings, rather, these findings may have implications for other contexts, but, the
appropriateness of this description would need to be tested in other settings, and may well
be further modified through such an exposure.

152
Table 18: Contribution of Rich insight
Description Detail in section Category
Extreme heterogeneity Section 5.2 Generalizing from data to description
Complexities of the environment Section 4.4.1 Generalizing from data to description
b) Development of concepts: A number of concepts have been developed through the research process. These are tabled
below (Table 19). Two types of generalization have been used in the development of
concepts. One approach (utilized for example in the development of concepts such as
integrated independence, and the EDS) has been to generalize from data to description. The
second has been to generalize from an existing theoretical concept, to the research finding
(as in the case of the concept attractor, or gateways). The latter therefore expands our
understanding of the existing theory by applying it in a new way in the research setting.
Table 19: Development of Concepts
Description Detail in section Category
Principle of Flexible Standards Section 4.2.4 and 4.4.2 Generalizing from data to description
Modularization (horizontal and vertical)
Section 4.2.4 and 4.4.2 Generalizing from theory to description
Essential Data Set Section 4.2.2 and 4.4.2 (b) Generalizing from data to description
Gateways Section 4.2.4 and 4.4.2 (c) Generalizing from theory to description
DHIS as a flexible standard Section 4.2.7 and 4.4.2 (d) Generalizing from data to description
Principle of Integrated independence
Section 4.2.4 and 4.4.3 (a) Generalizing from data to description
Mindful innovation Section 4.2.6 and 4.4.3 (c) Generalizing from theory to description
Attractors Section 4.2.4 and 4.4.3 (d) Generalizing from theory to description
Creation of networks and interdependencies
Section 4.2.3 and 4.4.3 (e) Generalizing from theory to description
Recognition of the new cadre of health worker (HIP)
Section 4.2.5, 4.2.7 and 4.4.3 (f) Generalizing from data to description
Public sector organizational absorptive capacity
Section 5.5.3 Generalizing from theory to description

153
c) Generation of specific implications: The third category of contribution is the generation of specific implications (see Table 20).
Examples that comprise this category are tables below. This category provides implications
for the ISDC discourse, and in the health sector specifically. In these examples, the
generalization has been from theory to description in that I test, or suggested the relevance
of existing concepts or theories, or methodological approach to the empirical data, and other
similar empirical contexts. I identified in Chapter 2 that although many authors recognized
the complex nature of hospital information systems development, few had explicitly utilized
complexity as a theoretical framework. This thesis attempts to fill this gap in the literature.
Drawing on a longitudinal action research methodology, this thesis also provides an example
for other IS researchers on the value of this type of study in exploring the micro and macro
level factors that contribute to successful HospMIS development.
Table 20: Generation of specific implications
Description Detail in section Category
Extension of CAS theory to • HospMISD and to • Scaling of HIS
Section 2.4 Section 5.6
Generalizing from theory to description
HospMISD as a co-evolutionary organizational learning process
Section 5.5.4 Generalizing from theory to description
Research methodology Chapter 3 Generalizing from methodological data to descriptions
d) Generation of theory: The last category describes the contributions of this thesis to IS theory. Four contributions
make up this category. The PAN model provides a useful way in which to view the balance
between access to technology, human resources, and the ability to process data in the HIS.
While the model was initially identified in Nigeria, it found useful application to the Ethiopian
context (Shaw, Mengiste et al. 2007), and has continued to be used by the HISP-SA team in
influencing practical approaches to HIS strengthening.
The second contribution to theory is the development of a co-evolutionary framework for
HospMISD. This contribution builds on the framework developed by Benbya and McKelvey
(2006a) in which they acknowledged was conceptual in nature and required further testing. It

154
provides a framework for understanding the role of different strategies and approaches for
ISD in resource constrained settings, and can be applied with in the co-evolutionary model,
which is the third theoretical contribution made in this thesis. The co-evolutionary model
addresses the research priority identified in Chapter 2 related to the mechanism for skills
transfer between the public sector and external support organizations. While I suggest that
the model requires further development and testing in a variety of settings, the
conceptualization of this model has been a very useful process for me personally because it
has helped me to understand more deeply the relationship between HISP-SA and the public
sector organizations with whom we work. The model provides a format which other
organizations can potentially utilize to analyze their comparative strengths and weaknesses
and structure their partnership accordingly.
The last theoretical contribution emerged during reflection on the role of HISP-SA in
supporting HISD in Africa (Shaw and Braa Forthcoming) and the continual dilemma we faced
as an organization in having to choose between consolidating our team and expanding in
new and untested areas. The concept of scaling as an inevitable process has helped us to
understand where to make the choices, and how to seek partnerships that can complement
our skills base, and issue that I identify as an important area for further research.
Table 21: Generation of Theory
Description Detail in section Category
Process for Accommodating Non-linearity (PAN) Model
Section 4.4.3 (b) Generalizing from description to theory
Co-evolutionary framework for HospMISD Section 4.5.3, 4.5.4 and 5.2.4
Generalizing from concepts to theory
Co-evolutionary ISD model Section 5.5.4 Generalizing from description to theory
Scaling as an inevitable co-evolutionary process
Section 5.6.4 Generalizing from description to theory
5.8. Synthesis of practical contributions:
In this chapter, I have summarized the practical contributions after each section. This section
is used to highlight the practical implications of this research in relation to capacity building
within the public health sector in resource constrained settings, and the practical implications
of this thesis for the HISP-SA team.
155
One of the biggest challenges in IS within resource constrained settings is that of developing
capacity within the public sector (Avgerou and Walsham 2000; Kimaro 2006; Avgerou 2008).
This research addresses this by describing the emergence of the HIP. At the micro level,
skills are developed in this practitioner through on-the-job mentoring and partnership with
HIP in the HISP-SA team, through formal and in-formal training, through scholarships to
academic institutions for further studies, and through email lists and discussion forums. At
the intermediate level, the establishment of self-organizing groups is encouraged and
facilitated between the HIP in the public sector, and other organizations like HISP-Nigeria
and HISP-SA and other NGO’s. And at the macro level we have seen these mechanisms
supported through formal and informal partnership arrangements between HISP-SA and
various public sector organizations. Recognizing the power of self-organizing groups to be
agents of change and to effect decentralized control suggests that a concerted strategy to
strengthen self-organizing groups may pay dividends and counter the skills shortage.
But what if the staff are just not there? For instance Saebo (2008) suggests, but does not
expand, that the use of the PAN model, and the choices made to balance volume of data
collected with available skills and staff suggests a the choice of “pragmatism … over
absolute requirements in terms of scaling, [is] a rare luxury in many other settings”. This hints
at the problem of staff shortage, and the pressure to capture and process data despite these
challenges. However, the essence of this thesis is that rather than pursue efforts to collect
vast quantities of data at the cost of data quality and clinical service provision, efforts should
be directed at discerning the key pieces of information that can be collected by the available
staff, within the time limitations that they have, and using appropriate technology for their
context. Effecting this balance is not a luxury, it is essential. It is precisely in these contexts
were the hard choices have to be made between the allocation of time for recording
interactions with patients, the degree of data aggregation, and the point of data capture.
Another way of addressing the staff shortage problem is to differentiate between health
workers who provide clinical services, and who may record the basic data related to the
patient-health worker interaction, and HIP who assist in the further processing of information.
In these cases, capacity is developed amongst staff who fill the ranks of statisticians, or other
administrative staff who are “more” available than the scarce health workers, rather than
drawing health workers away from their clinical duties. But, even if this happens, the capacity
of the HIP are limited, and the demands made of them in terms of data needs to be limited to
manageable proportions. It is precisely in this context that a co-evolutionary approach over
an extended timeframe is important. In this respect, we have seen in South Africa, over the
10 years of HISP-SA (and other NGO’s work there) the demands from the HIP become

156
increasingly sophisticated. Thus, despite the ongoing staff turnover, the organizational code
in the public sector related to HIS has gradually increased, and is in turn making increasingly
sophisticated demands on the HISP-SA team. This has ongoing implications for the HISP
team, to ensure that it recruits and trains its staff so as to lift its own organizational code to
higher levels.
5.9. Future research:
I conclude this chapter by highlighting future work that can arise from this research.
This thesis has identified extreme heterogeneity as a notion that characterizes the context in
resource constrained settings. A range of actions are required to manage the extreme
heterogeneity. I think it would be interesting to contrast the heterogeneity found in well
resourced contexts (see for instance some reference to this in Aanestad, Jensen et al. 2009)
with that described in this thesis, and to compare the different ways in which heterogeneity is
managed in the two contexts. Potentially this will provide useful insights into hospital
information systems development for both settings.
But perhaps the most interesting research area that I would like to pursue has been
highlighted in section 5.5.4 related to the co-evolutionary HISD model. I think that a deeper
understanding of the growth and development of the different HISP organizations (for
example HISP-SA, HISP-India, HISP-Nigeria) is essential in order to deepen our
understanding of the HISP international network, and how it needs to evolve in order to
continue to be relevant in the HIS sector. The relevance of the HISP international network is
not only important in terms of its role as a source of innovation in HIS, but also in terms of its
role in building institutional capacity through academic programs, an aspect that has not
been explored in depth in this thesis. I suggest that the two roles are closely linked with one
another, but without a deeper understanding of their interaction, we cannot harness these
opportunities to strengthen the HISP network.
A related field of research focuses on the nature of the relationship between an NGO such as
HISP-SA, and the public sector. For instance, from a business perspective, as at present,
HISP-SA does not have any significant competitors in terms of similar organizations that
provide similar types of solutions. While this may change in the future, the issue that
warrants further exploration is whether NGO’s such as those involved in the HISP network
might be an example of “future organizations” that co-evolve in partnership with government,

157
and where the driving force for continued innovation is not market forces but rather internal
competition for appropriate solutions and excellence similar to that which drives the FOSS
industry.

158

159
Chapter 6. CONCLUSIONS
This thesis presents a longitudinal action research study on the design, development and
implementation of HospMIS in resource constrained settings. The particular dilemma that
faces HospMISD in these settings is not only related to the absence or shortage of skilled
staff and access to ICT, but also the need to accommodate unexpected contradictions that
arise between the different realities of original intent and the changing needs during the
implementation process. In addressing these challenges, this thesis explores solutions which
can be implemented at the individual or micro level but which also accommodate the needs
at the macro levels of the health system. Examples of this include the development of flexible
standards such as the EDS and the principle of integrated independence. This thesis also
addresses the vexing problem of building local capacity to support the ongoing design,
development and implementation of HIS and HospMIS in contexts where the skills base is
low and staff shortages are common. In this respect, the research suggests that sustainable
HISD can be achieved by supporting a co-evolutionary approach to HISD between public
sector organizations and NGO’s such as HISP-SA. I suggest that a synergistic relationship
between these organizations is fed by their complimentary exploitative/explorative drives,
and domains of influence. This relationship supports the inevitable scaling process that
characterizes the health sector in resource constrained settings.
This thesis contributes to a number of important HIS research priorities in developing country
contexts. For example, Avgerou and Walsham (2000) call for research and action on the
importance of the context in harnessing the potential of ICT’s to aid economic and social
conditions in the developing world, and Sahay and Avgerou (2002) highlight the importance
of local adaptation of ICT solutions rather than the replication of western solutions in
developing country contexts. As part of their call to action, emphasis is placed on the
importance of developing local expertise in the design, implementation and management of
IT-related projects. In their review of the literature on IS in developing countries published
between January 2000 and May 2004, Walsham and Sahay (2006) suggest that research
emphasis should focus on four key areas, namely the development to which ICT’s contribute,
the key issues being studied, the theoretical and methodological stance, and the level and
focus of analysis. The contribution of this research in these areas is summarised in the table
below.

160
Table 22: Identified Research Priorities Addressed by this thesis
Identified Research Area Contribution of this thesis
Development to which ICT’s contribute
Development of locally appropriate FOSS in the “south” for the health sector, with a focus on hospitals. The development of local capacity in the health sector to better manage HospMIS. Development of sustainable organizations and processes to support ongoing HISD
Key issues being studied The context of HospMISD in resource constrained settings. In-depth study of open source software development and implementation in the public health sector with a focus on hospitals including approaches to scaling and sustainable ISD and implementation
Theoretical and methodological stance
Longitudinal action research study drawing on interpretive research approach and using CAS theory
Level and focus of analysis Multi-level (micro and macro) approach to analysis of data from resource constrained contexts.
I identify three main limitations of this thesis, which are also potential areas for future
research. One of the limitations relates to the relatively short periods of intervention in
HospMIS described in the cases. The description of HospMISD in the ECP was a 13 month
initiative, while that in Malawi was 19 months. Both of these timeframes are relatively short
periods for assessing the long term effects of interventions and their sustainability. While I
am aware that the hospitals continue to utilize the systems that were implemented, it would
be interesting to explore how the networks supporting the use of these systems have
changed over time.
A second limitation of this research relates to the limited focus on cultural diversity and the
impact that this has on the HospMISD (Walsham 2001). Given the multi-country nature of the
research, there have been obvious opportunities to consider cross-cultural issues, even
within countries which have huge cultural diversities.
A third limitation is related to the lack of depth to the analysis at the inter-organizational level,
particularly related to HISP-SA and the broad HISP network. This is an area that has
emerged from this thesis as important and as has been indicated in Chapter 5, this is an area
that clearly demands further research.
161
I conclude with a quote from Suchman (1987, p. vii) on plans and situated action which, in
my view, provides an invaluable insight into the approach that is necessary for sustainable
HospMISD in resource constrained settings:
“The Trukese navigator begins with an objective rather than a plan. He sets off toward the objective and responds to conditions as they arise in an ad hoc fashion. He utilizes information provided by the wind, the waves, the tide and current, the fauna, the stars, the clouds, the sound of water on the side of the boat, and he steers accordingly. His effort is directed to doing whatever is necessary to reach the objective. If asked, he can point to his objective at any moment, but he cannot describe his course.”

162

163
REFERENCES
Aanestad, M., T. B. Jensen, et al. (2009). "How to Get There from Here? An Analytical Framework for Dealing with Complexity in Information Infrastructures in Healthcare." Information Systems Research Special Issue on the Role of Information Systems in Healthcare Organizations(Forthcoming).
Aarts, J., V. Peel, et al. (1998). "Organizational issues in health informatics: a model approach." International Journal of Medical Informatics 52(1-3): 235-242.
AbouZahr, C. and T. Boerma (2005). "Health information systems: the foundations of public health." Bulletin of the World Health Organisation 83(8): 578-583.
Adjei, S. (2005). "Indicators for a health information data set in Ghana." Bulletin of the World Health Organisation 83(8): 637-738.
Akpan-Obong, P. (2007). Information and Communication Technologies in Development: contextuality and promise. IFIP 9.4 9th International Conference on Social Implications of Computers in Developing Countries, Sao Paulo, Brazil.
Alaa, G. and G. Fitzgerald (2004). Evolving Self-Organizing Activities - addressing Innovation and Unpredictable Environments. IT Innovation for Adaptability and Competitiveness. B. Fitzgerald and E. H. Wynn. Boston, USA, Springer. 141.
Allen, P. and L. V. Varga (2006). "A co-evolutionary complex systems perspective on information systems." Journal of Information Technology (Palgrave Macmillan) 21(4): 229-238.
Alma Ata Conference. (1978). "Declaration of Alma-Ata, International Conference on Primary Health Care, 6-12 September." Retrieved 1 December, 2006, from http://www.who.int/hpr/NPH/docs/declaration_almaata.pdf.
Anderson, P. (1999). "Complexity Theory and Organization Science." Organization Science 10(3): 216-232.
Anderson, P., A. Meyer, et al. (1999). "Introduction to the Special Issue: Applications of Complexity Theory to Organization Science." Organization Science 10(3): 233-236.
Argyris, C. and D. A. Schon (1996). Organizational Learning II - Theory, Method and Practice. Reading, Masachusetts, Addison-Wesley Publishing Company.
Arndt, M. and B. Bigelow (2000). "Commentary: The potential of chaos theory and complexity theory for health services management." Health Care Management Review 25(1): 35.
Avgerou, C. (2002). Information Systems and Global Diversity. Oxford, Oxford University Press.
Avgerou, C. and G. Walsham, Eds. (2000). Information Technology in Context - Studies from the perspective of developing countries. Hants, UK, Ashgate Publishing Ltd.
Avgerou, C. C. A. (2008). "Information systems in developing countries: a critical research review." Journal of Information Technology (Palgrave Macmillan) 23(3): 133-146.
Axelrod, R. M. and M. D. Cohen (1999). Harnessing Complexity: Organizational Implications of a Scientific Frontier. New York, USA, The Free Press.
Bada, A. O. (2002). "Local Adaptations to Global Trends: A Study of an IT-Based Organizational Change Program in a Nigerian Bank." Information Society 18(2): 77-86.
Bada, A. O. (2006). "Enhancing Human Resource Development Through Information and Communications Technology - Editorial Introduction to the Special Issue." Information Technology for Development 12(3): 179-183.
Barley, S. R. (1986). "Technology as an Occassion for Structuring: Evidence from Observations of CT Scanners and the Social Order of Radiology Departments." Administrative Science Quarterly 31(1): 78-108.
Baskerville, R. L. and A. T. Wood-Harper (1996). "A critical perspective on action research as a method for information systems research." Journal of Information Technology (Routledge, Ltd.) 11(3): 235-246.
164
Baskerville, R. L. and A. T. Wood-Harper (1998). "Diversity in information systems action reserach methods." European Journal of Information Systems 7: 90-107.
Begun, J. W., B. Zimmerman, et al. (2003). Health Care Organisations as Complex Adaptive Systems. Advances in Health Care Organisation Theory. S. M. Mick and M. Wyttenbach. San Francisco, Jossey-Bass: 253-288.
Benbasat, I., D. K. Goldstein, et al. (1987). "The Case Research Strategy in Studies of Information Systems." MIS Quarterly 11(3): 369-386.
Benbya, H. and B. McKelvey (2006a). "Toward a Complexity Theory of Information Systems Development." Information Technology and People 19(1): 12-34.
Benbya, H. B. and B. M. McKelvey (2006b). "Using coevolutionary and complexity theories to improve IS alignment: a multi-level approach." Journal of Information Technology (Palgrave Macmillan) 21(4): 284-298.
Berg, M. (1999). "Patient care information systems and health care work: a sociotechnical approach." International Journal of Medical Informatics 55(2): 87-101.
Berg, M. (2001). "Implementing information systems in health care organizations: myths and challenges." International Journal of Medical Informatics 64(2-3): 143-156.
Berg, M. (2004). Health Information Management - integrating information technology in health care work. New York, Routledge.
Berg, M. and E. Goorman (1999). "The contextual nature of medical information." International Journal of Medical Informatics 56(1-3): 51-60.
Bergqvist, J., P. Dahlberg, et al. (2002). "Scalability through Cultivation - designing IT support for co-ordination work." Retrieved 13 November, 2006, from http://citeseer.ist.psu.edu/cache/papers/cs/23947/http:zSzzSzwww.dahlberg.sezSzpubzSzmaster.pdf/scalability-through-cultivation-designing.pdf.
Berndt, D. J., A. R. Hevner, et al. (2003). "The Catch data warehouse: support for community health care decision-making." Decision Support Systems 35(3): 367-384.
Bhatnagar, S. (1992). Information Technology and socio-development: Some strategies for developing countries. Social Implications of Computers in Developing Countries. S. Bhatnagar and M. Odedra. New Delhi, Tata McGraw Hill.
Boerma, T. (2005). "WHO News - Getting the numbers right." Bulletin of the World Health Organisation 83(8): 567-568.
Boerma, T., E. Bos, et al. (2008). A common framework for monitoring performance and evaluation of the scale-up for better health. Geneva, World Health Organisation and World Bank.
Bossert, T., M. B. Chitah, et al. (2003). "Decentralization in Zambia: resource allocation and district performance." Health Policy Plan. 18(4): 357-369.
Braa, J. (2005). "A data warehouse approach can manage multiple data sets." Bulletin of the World Health Organisation 83(8): 638-939.
Braa, J., O. Hanseth, et al. (2007a). "Developing Health Information Systems in Developing Countries - the flexible standards strategy." MIS Quarterly 31(2): 381-402.
Braa, J., O. Hanseth, et al. (2007b). "Developing Health Information Systems in Developing Countries - the flexible standards strategy." MIS Quarterly 31 Special Issue
Braa, J. and C. Hedberg (2002). "The Struggle for District Based Health Information Systems in South Africa." The Information Society 18: 113-127.
Braa, J., E. Monteiro, et al. (2004). "Networks of Action: Sustainable Health Information Systems Across Developing Countries." MIS Quarterly 28(3): 337-362.
Brown, J. S. and P. Duguid (1991). "Organizational Learning and Communities-of-Practice: Toward a Unified View of Working, Learning, and Innovation." Organization Science 2(1): 40-57.
Burn, A. and G. Shongwe (2003). Monitoring Hospital Care. South African Health Review 2003/04. P. Ijumba, C. Day and A. Ntuli. Durban, Health Systems Trust: 29-41.
Butz, M. (1997). Chaos and complexity: implications for psychological theory and practice. Washington DC, CRC Press.
Capra, F. (2005). "Complexity and Life." Theory Culture Society 22(5): 33-44.

165
Cassels, A. and K. Janovsky (1998). "Better health in developing countries: are sector-wide approaches the way of the future?" Lancet 352(November 28, 1998): 1777-79
Castells, M. (1998). End of Millenium. Oxford, Blackwell. Castells, M. (2000). The Rise of the Network Society. Oxford, Blackwell. Chilundo, B. (2004). Integrating Information Systems of Disease-Specific Health
Programmes in Low Income Countries. Faculty of Medicine. Oslo, Norway, University of Oslo. Doctor Phillosophiae: 121.
Christensen, C. M. (2000). The Innovator's Dilemma. New York, Harper Business. Chua, W. F. (1986). "Radical Developments in Accounting Thought." The Accounting Review
LXI(4): 601-632. Cibulskis, R. E. (2005). "Information is not only for managers." Bulletin of the World Health
Organisation 83(8): 637. Ciccarese, P., E. Caffi, et al. (2005). "Architectures and tools for innovative Health
Information Systems: The Guide Project." International Journal of Medical Informatics 74(7-8): 553-562.
Cohen, W. M. and D. A. Levinthal (1989). "Innovation and Learning: The Two Faces of R & D." The Economic Journal 99(397): 569-596.
Committee on Quality Health Care in America, I. o. M. (2001). Crossing the Quality Chasm: A New Health System for the 21st Century. Washington, D.C., National Academy Press.
Crabtree, B. F. and W. L. Miller (1992). Doing Qualitative Research: multiple strategies. Newbury Park, California, SAGE Publications.
Cronholm, S. and G. Goldkuhl (2004). "Conceptualising Participatory Action Research - three different practices." Electronic Journal of Business Research Methods 2(2): 47-58.
Crossan, M. M., H. W. Lane, et al. (1999). "An Organizational Learning Framework: From intuition to institution." Academy of Management Review 24(3): 522-537.
Crossan, M. M., H. W. Lane, et al. (1995). "Organizational Learning: Dimensions for a theory." International Journal of Organizational Analysis (1993 - 2002) 3(4): 337.
Daft, R. L. (1992). Organization Theory and Design. St Paul, Minneapolis, West Publishing. Daft, R. L. and A. Y. Lewin (1993). "Where Are the Theories for the "New" Organizational
Forms? An Editorial Essay." Organization Science 4(4): i-vi. Davis, G. B. (1982). "Strategies for Information Requirements Determination." IBM Systems
Journal 21(1): 4-31. De Koning, K. and M. Martin (1996). Participatory Research in health: setting the context.
Participatory Research in Health - issues and experiences. K. De Koning and M. Martin. Johannesburg, National Progressive Primary Health Care Network (NPPHCN): 242.
Dooley, K. (1997). "A Complex Adaptive Systems Model of Organization Change." Nonlinear Dynamics, Psychology, and Life Sciences 1(1): 69-97.
Dooley, K. (2002). Organizational Complexity. International Encyclopaedia of Business and Management. M. Warner. London, Thompson Learning: 5013-5022.
Dosi, G. (1982). "Technological paradigms and technological trajectories." Research Policy 11: 147-162.
Douglas, G., C. Deula, et al. (2003). The Lilongwe Central Hospital Patient Management Information System: A Success in Compuyer-Based Order Entry where One Might Least Expect it. Americam Medical Informatics Association Conference, AMIA.
Dunphy, D. C. and D. A. Stace (1988). "Transformational and Coercive Strategies for Planned Organizational Change: Beyond the O.D. Model." Organization Studies 9(3): 317-334.
Eastern Cape Development Corporation. (2005). "ECDC Website." Retrieved November 14, 2005, from http://www.ecdc.co.za/districts/districts.asp?pageid=32
Ellingsen, G. (2004). Global Reach, Local Use - Design and use of electronic patient record systems in large hospitals. Faculty of Information Technology, Mathematics and Electrical Engineering, Department of Computer and Information Science. Tromso, Norwegian University of Science and Technology. Doctoral thesis: 244.
166
Ellingsen, G. and E. Monteiro (2003). "Big is Beautiful - electronic patient records in large hospitals in Norway 1980s-2001." Methods for Information in Medicine 42(4): 366-370.
Ellingsen, G. and E. Monteiro (2005). The slight surprise of integration. IFIP W.G. 8.2 Designing Ubiquitous Information Environments: Socio-Technical Issues and Challenges, Cleveland, Ohio.
Engelbrecht, B. and D. McCoy (1999). Establishing the Disrict Health System. South African Health Review. N. Crisp and A. Ntuli. Durban, South Africa, HST Press: 439.
Eoyang, G. (1996). "Complex? Yes! Adaptive? Well, maybe..." Interactions 3(1): 31-37. Eoyang, G. and T. H. Berkas (1998). Evaluation in a Complex Adaptive System. Managing
Complexity in Organisations. M. Lissack and H. Gunz. Westport, Connecticut, Quorum Books, an imprint of Greenwood Publishing Group, Inc. 2005.
Evans, T. and S. Stansfield (2003). "Health Information in the new millennium: a gathering storm?" Bulletin of the World Health Organisation 81(12): 856.
Fontana, W. and S. Ballati (1999). "Complexity - why the sudden fuss." Complexity 4(3): 14-16.
Fraser, S. W. and T. Greenhalgh (2001). "Complexity Science: Coping with complexity: educating for capability." British Medical Journal 323(6 October): 799-803.
Garrib, A., N. Stoops, et al. (2008). "An evaluation of the District Health Information System in rural South Africa." South African Medical Journal 98(7): 549-552.
GAVI Alliance. (2005). "Opportunities for Global Health Initiatives in the health system action agenda." Retrieved 12 September, 2008, from http://www.gavialliance.org/resources/17brd_5_HealthSystemsGHIs_6Dec2005.pdf.
Gell-Mann, M. (1995). The Quark and the Jaguar - Adventures in the Simple and the Complex. London, Abacus.
Giddens, A. (1999). Runaway World. Reith lectures. Gladwell, M. (2000). The Tipping Point - how little things can make a big difference. London,
UK, Abacus. Gladwin, J., R. A. Dixon, et al. (2003). "Implementing a New Health Management Information
System in Uganda." Health Policy and Planning 18(2): 214-224. Gleick, J. (1987). Chaos - making a new science. London, Abacus. Gleick, J. (1993). Chaos. London, Abacus. Glouberman, S. and H. Mintzberg (2001a). "Managing the Care of Health and the Cure of
Disease - Part I: Differentiation." Health Care Management Review(Winter): 56-69. Glouberman, S. and H. Mintzberg (2001b). "Managing the Care of Health and the Cure of
Disease - Part II: Integration." Health Care Management Review(Winter): 70-84. Godlee, F., N. Pakenham-Walsh, et al. (2004). "Can we achieve health information for all by
2015?" Lancet(July 9, 2004): 1-6. Gorgen, H., T. Kirsch-Wolk, et al., Eds. (2004). The District Health System - Experiences and
Prospects in Africa. Manual for Public Health Practitioners. Wiesbaden, Universum Verlag. Greenbaum, J. and M. Kyng, Eds. (1991). Design at Work:Cooperative design of computer
systems. Hillsdale, NJ, Lawrence Erlbaum Associates. Hanseth, O. (2002). "From systems and tools to networks and infrastructures - from design to
cultivation. Towards a theory of ICT solutions and its design methodology implications." Retrieved 2 September, 2005, from http://heim.ifi.uio.no/~oleha/Publications/ib_ISR_3rd_resubm2.html.
Hanseth, O., E. Jacucci, et al. (2006). "Reflexive standardisation: Side effects and complexity in standard-making." MIS Quarterly(Special Issue on Standards).
Hanseth, O. and N. Lundberg (2001). "Designing Work Oriented Infrastructures." Computer Supported Cooperative Work (CSCW) 10(3 - 4): 347-372.
Hanseth, O. and K. Lyytinen (2004). "Theorizing about the design of information infrastructures - Design kernel theories and principles." Sprouts Working Papers on Information Environments, Systems and Organizations 4(4).

167
Hanson, K., M. K. Ranson, et al. (2003). "Expanding access to priority health interventions: a framework for understanding the constraints to scaling-up." Jounal of International Development 15(2003): 1-14.
Health Metrics Network (2008). Framework and Standards for Country Health Information Systems, Health Metrics Network: 72.
Health Systems Trust, Ed. (1996). South African Health Review. Durban, South Africa, Health Systems Trust and Henry J. Kaiser Family Foundation.
Heeks, R. (2002). "Failure, Success and Improvisation of Information Systems Projects in Developing Countries." The Information Society 18: 101-112.
Heeks, R. (2006). "Health information systems: Failure, success and improvisation." International Journal of Medical Informatics 75(2): 125-137.
Herbst, K., P. Littlejohns, et al. (1999). "Evaluating computerized health information systems: hardware, software and human ware: experiences from the Northern Province, South Africa." Journal of Public Health Medicine 21(3): 305-310.
Highsmith III, J. A. (2000). Adaptive Software Development - A Collaborative Approach to Managing Complex Systems. New York, Dorset House.
Hirschheim, R. and H. K. Klein (1989). "Four Paradigms of Information Systems Development." Communications of the ACM 32(10): 1199-1216.
Holland, J. H. (1995). Hidden Order - How Adaptation Builds Complexity. Reading, Massachusetts, Addison-Wesley Publishing Company.
Hospital Advisory Group (1994). A Review of the Determinants of Hospital Performance. Geneve, Division of Strengthening of Health Services, Geneve.
Huber, G. P. (1990). "A Theory of the Effects of Advanced Information Technologies on Organizational Design, Intelligence, and Decision Making." The Academy of Management Review 15(1): 47-71.
Hunter, J., B. De Jongh, et al. (2002). An Evaluation of the Hospital Information System (HIS) in The Northern Cape Province. Kimberley, Northern Cape Province, South Africa, Information Management Unit, Northern Cape Provincial Department of Health: 37.
Jacucci, E., O. Hanseth, et al. (2006). "Introduction - taking complexity seriously in IS research." Information Technology and People 19(1): 5-11.
Jacucci, E., V. Shaw, et al. (2006). "Standardization of Health Information Systems in South Africa: The Challenge of Local Sustainability." Information Technology for Development 12( 3): 225-239.
Jansen, A. and P. Nielsen (2005). "Theorizing Convergence: Co-Evolution of Information Infrastructures." Scandinavian Journal of Information Systems 17(1): 67-100.
Jayasuriya, R. (1999). "Managing Health Information Systems for Health Services in a Developing Country: a case study using a contextualist framework." International Journal of Information Management 19: 335-349.
Jigawa State Government (2005). Jigawa Economic Empowerment and Development Strategy (Jigawa SEEDS). Dutse, Jigawa, Jigawa State Government.
Johns, B., T. T. Torres, et al. (2005). "Costs of scaling up health interventions: a systematic review." Health Policy Plan. 20(1): 1-13.
Kauffman, S. A. (1993). The Origins of Order: Self Organisation and Selection in Evolution. New York, Oxford University Press.
Kauffman, S. A. (1995a). At Home in the Universe. New York, Oxford University Press. Kauffman, S. A. (1995b). "Technology and Evolution: Escaping the Red Queen Effect."
McKinsey Quarterly(1): 118-129. Kim, R. M. and S. M. Kaplan (2005). "Interpreting Socio-Technical Co-evolution: Applying
Complex Adaptive Systems to IS Engagement." Information Technology and People 19(1): 35-54.
Kimaro, H. C. (2006). "Strategies for developing human resource capacity to support sustainability of ICT based health information systems: A Case study from Tanzania." The Electronic Journal of Information Systems in Developing Countries 26(2): 1 - 23.

168
Kimaro, H. C. and J. L. Nhampossa (2005). "Analysing the Problem of Unsustainable Health Information Systems in Less-Developed Economies: Case Studies from Tanzania and Mozambique." Information Technology for Development 11(3): 273-298.
Klein, H. K. and M. Myers (1999). "A Set of Principles for Conducting and Evaluating Field Studies in Information Systems." MIS Quarterly 23(1): 67-94.
Kling, R. (1980). "Social Analyses of Computing: Theoretical Perspectives in Recent Empirical Research." ACM Comput. Surv. 12(1): 61-110.
Knorr Cetina, K. (2005). "Complex Global Microstructures - the New Terrorist Societies." Theory, Culture and Society 22(5): 213-234.
Koza, M. P. and A. Y. Lewin (1998). "The Co-Evolution of Strategic Alliances." Organization Science 9(3): 255-264.
Koza, M. P. and A. Y. Lewin (1999). "The Coevolution of Network Alliances: A Longitudinal Analysis of an International Professional Service Network." Organization Science 10(5): 638-653.
Langley, A. (1999). "Strategies for theorizing from process data." The Academy of Management Review 24(4): 691-710.
Lee, A. S. (1994). "Electronic mail as a medium for rich communication: an empirical investigation using hermeneutic interpretation." MIS Quarterly 18(2): 143-157.
Lee, A. S. and R. L. Baskerville (2003). "Generalizing Generalizability in Information Systems Research." Information Systems Research 14(3): 221-243.
Lewin, A. Y. (1999). "Application of Complexity Theory to Organization Science." Organization Science 10(3): 215.
Lewin, A. Y., C. P. Long, et al. (1999). "The Coevolution of New Organizational Forms." Organization Science 10(5): 535-550.
Lewin, A. Y. and H. W. Volberda (1999). "Prolegomena on Coevolution: A Framework for Research on Strategy and New organizational Forms." Organization Science 10(5): 519-534.
Lewin, R. (1992). Complexity: Life at the Edge of Chaos. New York, Macmillan. Lewis, D. and S. Madon (2004). "Information Systems and Nongovernmental Development
Organizations: Advocacy, Organizational Learning, and Accountability." Information Society 20(2): 117-126.
Littlejohns, P., J. C. Wyatt, et al. (2003). "Information in Practice - Evaluation computerised health information systems: hard lessons still to be learnt." British Medical Journal 326: 860-863.
Loch, C. H. and B. A. Huberman (1999). "A Punctuated-Equilibrium Model of Technology Diffusion." Management Science 45(2): 160-177.
Lopez, D. M. and B. G. M. E. Blobel (2009). "A development framework for semantically interoperable health information systems." International Journal of Medical Informatics 78(2): 83-103.
Loveday, M., J. Smith, et al. (2006). Health Information Audit Report South Africa. Durban, South Africa, National Department of Health
Health Systems Trust: 50. Lundberg, N. and H. Tellioglu (1999). "Understanding the Complex Coordination processes
in Health Care." Scandinavian Journal of Information Systems 11(1). Madon, S., N. Reinhard, et al. (2007). Digital Inclusion Projects in Developing Countries:
Processes of Institutionalisation. 9th International Conference on Social Implication sof Computers in Developing Countries, Sao Paulo, Brazil, International Federation for Information Processing.
Mahlalela, X., J. Rohde, et al. (2000). Primary Health Care in the Eastern Cape Province 1997 - 2000. X. Mahlalela. Bhisho, Eastern cape Province, South Africa, Equity Project, Management Sciences for Health: 123.
Malone, T. W., K.-Y. Lai, et al. (1992). Experiments with Oval: A Radically tailorable Tool for Cooperative Work. ACM Conference on Computer Supported Cooperative Work (CSCW '92), Toronto, Ontario, Canada, ACM Press.

169
Mandela, N. (2003). Speech on New Patriotism at the State of the Nation address, Houses of Parliament, Cape Town, 7 February 1997. Nelson Madela - From Freedom to the Future: Tributes and Speeches. K. Asmal, D. Chidester and W. James. Johannesburg, Jonathan Ball Publishers: 159-162.
March, J. G. (1991). "Exploration and Exploitation in Organizational Learning." Organization Science 2(1): 71-87.
Marion, R. and J. Bacon (1999). "Organizational Extinction and Complex Systems." Emergence 1(4): 79.
Mate, K. S., B. Bennett, et al. (2009). "Challenges for Routine Health System Data Management in a Large Public Programme to Prevent Mother-to-Child HIV Transmission in South Africa." PLoS ONE 4(5).
Mbananga, N., R. Madale, et al. (2002). Evaluation of the Hospital Information Systemm in the Northern Province in South Africa. Durban, South Africa, Health Systems Trust: 87.
McCoy, D., M. Chopra, et al. (2005). "Expanding Access to Antiretroviral Therapy in Sub-Saharan Africa: Avoiding Pitfalls and Dangers, Capitalizing on the Opportunities." American Journal of Public Health 95(1): 18-22.
McKelvey, B. (1997). "Quasi-natural Organization Science." Organization Science 8(4): 352-380.
McKelvey, B. (1999a). "Avoiding Complexity Catastrophe in Coevolutionary Pockets: Strategies for Rugged Landscapes." Organization Science 10(3): 294-321.
McKelvey, B. (1999b). "Complexity Theory in Organization Science: Seizing the Promise or becoming a Fad." Emergence 1(1): 5-32.
McKinney, E. H. J. (2002). "Leveraging the Hidden Order of Systems." Retrieved 20 October 2005, from http://www.bauer.uh.edu/parks/fis/systemsMckinney.htm.
Merali, Y. M. (2006). "Complexity and Information Systems: the emergent domain." Journal of Information Technology (Palgrave Macmillan) 21(4): 216-228.
Merali, Y. M. and B. M. McKelvey (2006). "Using Complexity Science to effect a paradigm shift in Information Systems for the 21st century." Journal of Information Technology (Palgrave Macmillan) 21(4): 211-215.
Monteiro, E. (2003). "Integrating Health Information Systems: A Critical Appraisal." Methods Inf Med 42: 428-32.
Montoya-Aguilar, C. (1994). Measuring the Performance of Hospitals and Health Centres. Geneve, Division of Strengthening Health Systems, World Health Organization.
Mosse, E. L. and S. Sahay (2005). "The Role of Communication Practices in the Strengthening of Counter Networks: Case Experiences from the Health Care Sector of Mozambique." Information Technology for Development 11(3): 207-225.
Newbrander, W., H. Barnum, et al. (1993). Hospital Economics and Financing in Developing Countries. Geneve, World Health Organization.
NICS 2006 Group (2007). Nigerian National Programme on Immunization - National Immunization Coverage Survey 2006. Abuja, Nigeria.
Nielsen, P. and J. L. Nhampossa (2005). Internationalization of Information Infrastructures and Control: Cases from Mozambique and Norway. 8th International Working Conference of IFIP WG9.4: Enhancing Human Resource Development through ICT, Abuja, Nigeria.
Orlikowski, W. (1996). "Improvising Organizational Transformation Over Time: A Situated Change Perspective." Information Systems Research 7(1): 63-92.
Orlikowski, W. and C. S. Iacono (2001). "Desperately Seeking the "IT" in IT Reasearch - A call to Theorizing the IT Artifact." Information Systems Research 12(2): 121-134.
Owei, V., B. Maumbe, et al. (2007). Toward a Mobile e-Government manifesto for Developing Countries: issues and recommendations for future research directions. IFIP 9.4 9th International Conference on Social Implications of Computers in Developing Countries, Sao Paulo, Brazil.

170
Padarath, A., C. Chamberlain, et al. (2007). Health Personnel in Southern Africa: Confronting maldistribution and brain drain. EQUINET Discussion Series. R. Loewenson and C. Thompson. Durban, South Africa, EQUINET
Health Systems Trust MedAct: 41. Perrow, C. (1967). "A Framework for the Comparative Analysis of Organizations." American
Sociological Review 32(2): 194-208. Perrow, C. (1999). Normal Accidents: Living with High Risk Technologies. New Jersey,
Princeton University Press. Pettigrew, A. M. (1985). Contextualist Research: a natural way to link theory and practice.
Doing Research that is Useful in Theory and Practice. E. Lawler. San Francisco, Jossey-Bass.
Pettigrew, A. M. (1987). "Context and Action in the Transformation of the Firm." Journal of Management Studies 24(6): 649-670.
Piantanida, M., C. Tananis, et al. (2002). Claiming Grounded Theory for Practice-based Dissertation Research - a think piece. Conference on Interdisciplinary Qualitative Studies. Athens, Georgia.
Plsek, P. E. (2001). Appendix B: Redesigning Health care with Insights from the Science of Complex Adaptive Systems. Crossing the Quality Chasm: A New Health System for the 21st Century. I. o. M. Committee on Quality Health Care in America. Washington, D.C., National Academy Press: 89-110.
Plsek, P. E. and T. Greenhalgh (2001). "Complexity Science: the challenge of complexity in health care." British Medical Journal 323(15 September): 625-628.
Plsek, P. E. and T. Wilson (2001). "Complexity Science: Complexity, leadership, and management in health care organisations." British Medical Journal 323(29 September): 746-749.
Priesmeyer, H. R. and L. F. Sharp (1995). "Phase Plane Analysis: Applying Chaos Theory in Health Care." Quality Management in Healthcare 4(1): 62-70.
Priesmeyer, H. R., L. F. Sharp, et al. (1996). "Chaos Theory and Clinical Pathways: A Practical Application." Quality Management in Healthcare 4(4): 63.
Prigogene, I. and I. Stengers (1984). Order Out of Chaos: Man's New Dialogue with Nature. New York, Bantam.
Puri, S. K. and S. Sahay (2004). The Politics of Knowledge in Using GIS for Land Management in India. Information Systems Research: Relevant Theory and Informed Practice. IFIP TC8/WG8.2 20th Year Restrospective. July 15-17, 2004, Manchester, United Kingdom. B. Kaplan, D. P. Truex III, D. Wastell, A. T. Wood-Harper and J. I. DeGross, Kluwer Academic Publishers: 597-614.
Ramanathan, J. (2005). "Fractal Architecture for the Adaptive Complex Enterprise." Communications of the ACM 48(5): 51-57.
Rugg, D., M. Carael, et al. (2004). "Global advances in monitoring and evaluation of HIV/AIDS: From AIDS case reporting to program improvement." New Directions for Evaluation 2004(103): 33-48.
Saebo, J. (2008). "Scaling of Health Management Information Systems (PhD Upgrade Document)." Retrieved 1 July, 2009.
Sahay, P. S. (2001). "Editorial: Special Issue on "IT and Health Care in Developing Countries"." Electronic Journal on Information Systems in Developing Countries 5(0): 1-6.
Sahay, S. and C. Avgerou (2002). "Introducing the Special Issue on Information and Communication Technologies in Developing Countries." Information Society 18(2): 73-76.
Sahay, S., E. Monteiro, et al. (2007). Towards a Political Perspective of Integration in IS Research: The case of health information systems in India. 9th International Conference on Social Implications of Computers in Developing Countries, Sao Paulo, Brazil.
171
Sahay, S., E. Monteiro, et al. (2009). "Configurable Politics and Asymmetric Integration: Health e-Infrastructures in India." Journal of the Association for Information Systems 10(5): 399-414.
Sahay, S. and G. Walsham (2005). Scaling of Health Information Systems in India: Challenges and Approaches. International Federation for Information Processing Working Group 9.4 Conference, Abuja, Nigeria.
Sahay, S. and G. Walsham (2006). "Scaling of Health Information Systems in India: Challenges and Approaches." Information Technology for Development 12(3): 185-200.
Schneider, H., D. Blaauw, et al. (2006). "Health Systems and Access to Antiretroviral Drugs for HIV in Southern Africa: Service Delivery and Human Resources Challenges." Reproductive Health Matters 14(27): 12-23.
Seebregts, C., B. Mamlin, et al. (2009). "The OpenMRS Implementers Network." International Journal of Medical Informatics(Forthcoming): 10.
Seel, R. (1999). "Complexity and OD." Retrieved 1 November 2005, 2005. Sen, A. (1999). Development as Freedom. Oxford, Oxford University Press. Shaw, V. (2003). The Development of an Information System for District Hospitals. The
Digital Challenge: Information Technology in the Development Context. S. Krishna and S. Madon, Ashgate.
Shaw, V. (2005). "Health information system reform in South Africa: developing an essential data set." Bulletin of the World Health Organisation 2005(83): 632 - 639.
Shaw, V. (2007). Considering the Options for Hospital Management Information Systems. Helena 12th E-Health Conference, 2007, Bamako, Mali.
Shaw, V. and J. Braa (Forthcoming). "Developed in the South" - an evolutionary and prototyping approach to developing scalable and sustainable health information systems. Development Informatics and Regional Information Technologies: Theory, Practice and the Digital Divide. J. Steyn, IGI Global. Vol 3: ICT's for Development in Africa: Theory, Practice and the Digital Divide.
Shaw, V., S. Mengiste, et al. (2007). Scaling of health information systems in Nigeria and Ethiopia - Considering the options. IFIP 9.4 9th International Conference on Social Implications of Computers in Developing Countries, Sao Paulo, Brazil.
Shaw, V., C. Simoonga, et al. (2008). Using Communities of Practice as a Lens for Understanding Adoption of ICT. IST-Africa Conference 2008 Windhoek, Namibia, International Information management Corporation.
Shibuya, K., S. Scheele, et al. (2005). "Health statistics: time to get serious." Bulletin of the World Health Organisation 83(10): 722.
Silva, L. (2007). "Institutionalization does not occur by decree: Institutional obstacles in implementing a land administration system in a developing country." Information Technology for Development 13(1): 27-48.
Silva, L. and R. Hirschheim (2007). "Fighting Against Windmills: Strategic information systems and organizational deep structures." MIS Quarterly 31(2): 327-354.
Silva, L. O. (2002). "Outsourcing as an Improvisation: A Case Study in Latin America." Information Society 18(2): 129-138.
Simon, H. A. (1962). "The Architecture of Complexity." Proceedings of the American Philosophical Society 106: 467-82.
Simon, H. A. (1969). The Sciences of the Artificial. Cambridge, Massachusetts, The Massachusetts Institute of Technology.
Simon, H. A. (1991). "Bounded Rationality and Organizational Learning." Organization Science 2(1): 125-134.
Stacey, R. D. (1995). "The Science of Complexity: An Alternative Perspective for Strategic Change Processes." Strategic Management Journal 16(6): 477-495.
Suchman, L. A. (1987). Plans and Situated Actions - the problem of human-machine communication. Cambridge. , Cambridge University Press.
Swanson, E. B. and N. C. Ramiller (2004). "Innovating Mindfully with Information Technology." MIS Quarterly 28(4): 553-583.

172
Tan, J., H. J. Wen, et al. (2005). "Health Care and Services Delivery Systems as Complex Adaptive Systems." Communications of the ACM 48(5): 36-44.
Urry, J. (2003). Global Complexity. Cambridge, UK, Polity. Urry, J. (2005a). "The Complexities of the Global." Theory, Culture and Society 22(5): 235-
254. Urry, J. (2005b). "The Complexity Turn." Theory, Culture and Society 22(5): 1-14. Van de Ven, A. H. and M. S. Poole (1995). "Explaining Development and Change in
Organizations." Academy of Management Review 20(3): 510-540. Van den Bosch, F. A. J., H. W. Volberda, et al. (1999). "Coevolution of Firm Absorptive
Capacity and Knowledge Environment: Organizational Forms and Combinative Capabilities." Organization Science 10(5): 551-568.
Van Lerberghe, V. and Y. Lafort (1990). The Role of the Hospital in the District - Delivering or Supporting Primary Health Care. Current Concerns. Geneve, Division of Strengthening of Health Services, World Health Organisation.
Van Maanen, J. (1983). Qualitative Methodology. Beverley Hills, Sage. Vander Plaetse, B., G. Hlatiwayo, et al. (2005). "Costs and revenue of health care in a rural
Zimbabwean district." Health Policy Plan. 20(4): 243-251. Volberda, H. W. and A. Y. Lewin (2003). "Guest Editors' Introduction Co-evolutionary
Dynamics Within and Between Firms: From Evolution to Co-evolution." Journal of Management Studies 40(8): 2111-2136.
Waldrop, M. M. (1992). Complexity - The Emerging Science at the Edge of Order and Chaos. New York, Simon and Schuster.
Walsham, G. (1993). Interpreting Information Systems in Organisations. Chichester, England, John Wiley and Sons.
Walsham, G. (1995). "Interpretive case studies in IS research: nature and method." European Journal of Information Systems 4: 74-81.
Walsham, G. (2001). Making a World of Difference - IT in a Global Context. Chichester, England, Wiley.
Walsham, G., D. Robey, et al. (2007). "Foreword: Special Issue on Information Systems in Developing Countries." MIS Quarterly 31(2): 317-326.
Walsham, G. and S. Sahay (2006). "Research on information systems in developing countries: Current landscape and future prospects." Information Technology for Development 12(1): 7-24.
Walsham, G., V. Symons, et al. (1988). "Information Systems as Social Systems: Implications for Developing Countries." Information Technology for Development 3(3): 189-204.
Wamukuo, J. and P. Ntutela. (2002, October). "Estimating the Cost of District Hospital Services." Retrieved 19 November, 2005, from http://www.doh.gov.za/docs/reports/2002/findc-report01.pdf.
Webb, P. and C. Pollard (2006). "Demystifying a hermeneutic approach to information systems research." Australian Journal of Information Systems 13(2): 31 - 48.
Weick, K. E. (2001). Organisation Redesign as Improvisation. Making Sense of the Organisation. Oxford, UK, Blackwell Publsihing: 57 - 91.
Weick, K. E., K. M. Sutcliffe, et al. (1999). "Organizing for High Reliability: Processes of Collective Mindfulness." Research in Organizational Behavior 21: 81-123.
Wikipedia. (2009). "Complexity." Retrieved April 25, 2009, from http://en.wikipedia.org/wiki/Complexity.
Williams, J. G. (1999). "The use of clinical information to help develop new services in a district general hospital." International Journal of Medical Informatics 56(1-3): 151-159.
Wilson, T. and T. Holt (2001). "Complexity Science: Complexity and clinical care." British Medical Journal 323(22 September): 685-688.
Wolf, R. C., G. Bicego, et al. (2004). "Developing and implementing monitoring and evaluation methods in the new era of expanded care and treatment of HIV/AIDS." New Directions for Evaluation 2004(103): 81-100.

173
Wood-Harper, A. T. (1984). Research Methods in Informatin Systems: Using Action Research. Research Methods in Information Systems - Proceedings of the IFIP WG8.2 Colloquium, Manchester Business School, North Holland.
World Health Organisation (2003). Millenium Development Goals - WHO's contribution to tracking progress and measuring achievements. Geneva, World Health Organization.
Wyatt, J. C. (1995). "Hospital Information Management: the need for clinical leadership." British Medical Journal 311: 175-178.
Xia, W. and G. Lee (2004). "Grasping the Complexity of IS Development Projects." Communications of the ACM 47(5): 69-74.
Zahra, S. A. and G. George (2002). "Absorptive Capacity: A Review, Re-conceptualization, and Extension." Academy of Management Review 27(2): 185-203.
Zimmerman, B., C. Lindberg, et al. (1998). Edgeware: Insights from Complexity Science for Health Care Leaders.

174

APPENDICES


APPENDIX 1
Shaw, V. (2003). The Development of an Information System for District Hospitals. In S.
Krishna & S. Madon (Eds.), The Digital Challenge: Information Technology in the
Development Context: Ashgate.


� ��
�
�
�
����������������� ������� ����������������
�������������� ���
�
��
��������������������������� ���!����"# ��$������� ��#��������
��%��# �� �����&�'��'$��% %�(� )$�����(� )$������%�
�
�����
� �*��+����,���� ������#� �����������-����. #"���#���/����� ���!�������� ��#���
���,+�� (012)�31�425�3165�&��7�
(012)�68�263�5504�������
���#,+�"���&9&�,%��%:���

� ��
� �������#� +�
��������������� �������������������������� �������������������������������������������� ��������������������������������������������������������������������������������������������������� ������� ������� ������������������������������������������������������������������������������������� ���������������������������� ������������������������������������������������������ ���������������� �������������� ���������������� ������������������������������������������������������������������������������������������������������������������������������������������������������������!��������������������������� ������������������������������� ���������������������������������������������������������������������������������������������"��������������������������������������������� ������������������� ������������������������������������#������$���������������%����������������������������������������������������������������������������

� &�
������������������������������������������
�%������� ��;�+�
�������� ������������!������'����(���������%���)�������%���*�����%���)�������������(��������������������������������������������������������������������!������'����(��������������+������(����������������� ���������������������������,(����(����������%���)�����-���������������������������������./�01�����./1�������������������������������2������'����(�����������������3��1�����4������(������� ������/��1��*����������5�����������333����
�����!������'�������� ��������������������������������������������������������������������������(��!��6� ������������������������������������������������������%���)������������������������������������������!��������������������������"�����������������������"�����������������������������"� �������������������������������������� ��� ������������!����������������������������������������������������������������2������������������������������������������������ ���������������������������������
� �#������ ������ ���!��
��"# ���
�����,#:�<������*#� �
=�7�������*#� �
� � "���*��
������*��������77/���#����������333������ ������
8���� &0� 77� .0�.�
9���� 0�*�������������77/���#����������333������ ������
/3�0� &0� �3/� 07�.�
1�'������������������������777�� 8�� �33� �7� �
1�'��������������� �����������77/��
:�� �33� 80� �33�
(����������������������������������
0��8� 80� &:� �
1��������������������������������������77/��
/��.� �33� 88� �
��<,��>+����!��#�� ����=���� �#�������
�(���77.������������� ���������������������������������������������������������,#������$�����%����-����������������������������������������������������������������������������������������������������������������� ���������������������������������������������������������#������$�����%����������������������������������������������(�������$�����'�������������������������������������������������������������������'���������������������������������������������� �����������������������������������������;��������������������������������������������������������������������������������������������������������������������������������!���������������������� ������������������������������������������������������������������"�������� �������������������������������#������*�������������������������(���������*������������

� .�
��*� #���#� �,�������������������#���#�������,����������# ����������� ���!����"# ���
�
�,# #��
<:33��������������
�#���#������!#��,�
:8��������������
��<?�#���#���� #�
� 0�����������
�#���#������#��
�.��������������
��"# �#�,���������#��
�
����$������������������������������������������������������������������������������������������������������� ������������������������ ��������� ��"������������� ���������������������������������������������������������"���������$����������������������� �������������������������2�������������������������������!���=����������������������������������������'��"��������������������!�������������������������������'��"�����������������������������������������������"������������������������������������������������������4��������������������������������������������������������������� �������������� ���������������������������������������� ��������������������������������������������������������������������������������������������������>��������������������������������"��������������������� �������������������������������������������������������������������������������������������������"������������������������������������������������������������������� ������������ ����������������������������?��������;���"���������������������� �������������������������������������������������������������������������������������2���������������������������������������������������� �����������������������������������������������������������������������������������������������!��������������������������������������������������%���)���������������������������������������($'������������������������������������������������������������� �������� �������������������������"�������������($'��������������������������������������������������������������������������������������������������������������������������������������������������������������� �������������������������������
��%�������"�,�!�� ��������#���#������!#��,�� ������#� �������+�
�)�� �������#� +�
�����������������$�������������!������'����(����������� ��������������������������������������������� ���������������77.���������������&��������������>��������0���������������������������������������������������������������������������������������������������@���������*���������%������@*%��������������������������������������������������������������������������������������������������������������������������������������������������������������
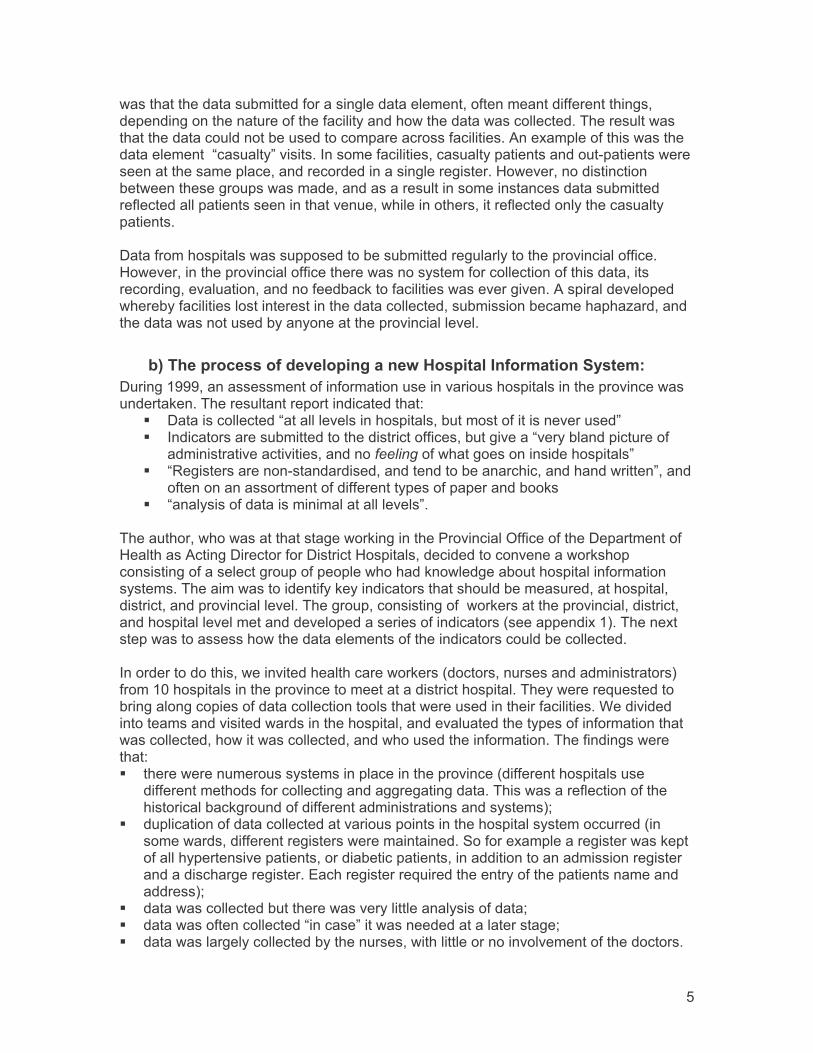
� 0�
���������������� �������������������������������������������������������������������������������������������������������������������������������������������������� ��������������������������������)�����������������������������������,�������-���������������������������������������������� �������������������������������������������������������������������$������������������ ���������������������������������������������������������������� ���������������������������������������������������������������������������������������������#���������������������������� ���� ������������������������������������$����������������������������������������������������������������������������������������������������� ��"����������������������������)���������������������� ������������������������������������������� ������� �����������6��������������������������� �������������������������������
<)�����!������������"�,�!# *��� �&����!#��,�� ������#� �������+�
#�������777������������������������������������������������������������������������"��������������������������������A��� #��������������,������������������������� ����������������������-��� ��������������� ������������������������ ���������,����� ��������������
���������������������������������������������������������������-��� ,5�������������� ���������������������� ��������������������������-������
��������������������������������������������� "���� ,��������������������������������������-��
������������������������������"����������(���������>�����������#����������$��������)�����#���������#������$����������������������������"�������������������������������������������"��������� �����������������������������������������������"��������������������� ���������������������������������������������������������������������������"���������������������������������������������������������������������������������������������������������������������������������������������������������������� ����������������������������������������������������"����������������������������������������3�����������������������������������������������������������;������� �����������������������������������������������������������������2����������������������������������������������������������������������������������������������������������������������������������������������������������������A��� ����������������������������������������������������������������������
��������������������������������������������������������������������������������� ��"�����������������������������������������B�
�� ������������������������������������������������������������������������������������������������������������������%��������������������������"���������������������������������� ��������������������������������������������������������������������!��������������;�������������������������������������������B�
�� ���������������� �����������������������������������B��� ��������������������,�������-���������������������������B��� ������������������������ �����������������������������������������������
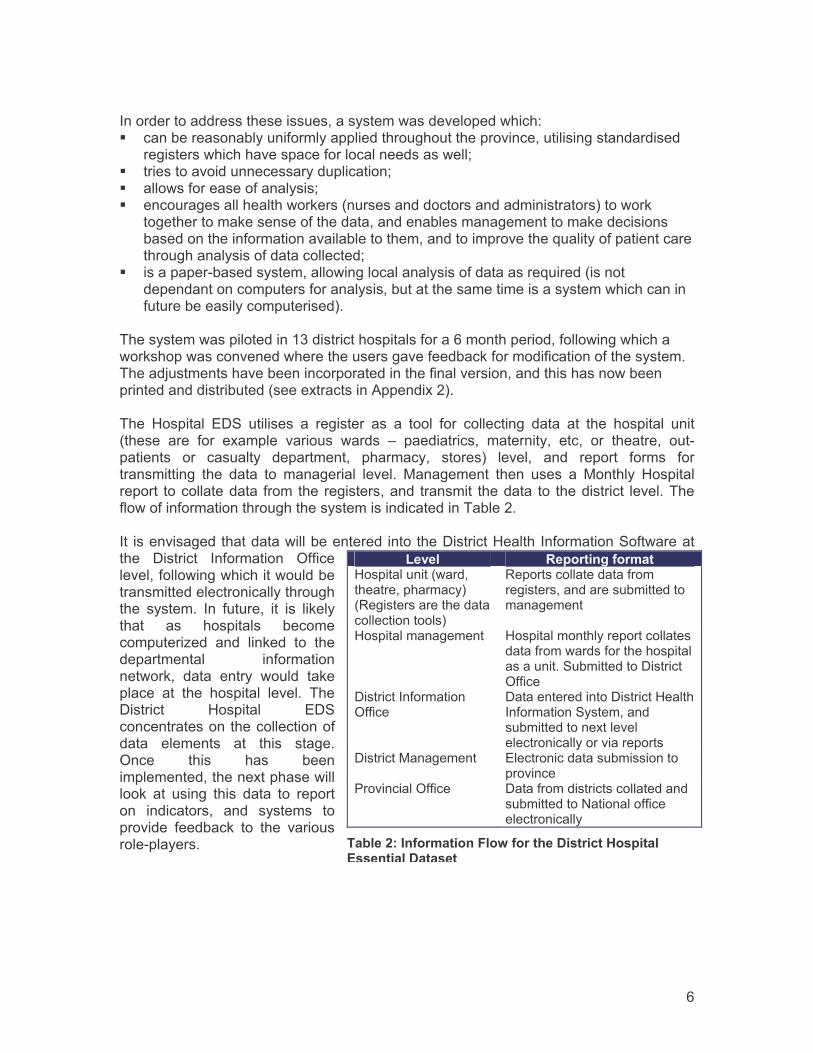
� 8�
���������������������������������������������������������A��� ���� �������� ������������������������������������������������������������
�����������������������������������������������B��� ��������������������������������B��� ������������������������B��� ����������������������"�����������������������������������������"�
���������"������������������������� �����������������"����������� ������������������������� ������������������������;�����������������������������������������������B�
�� ���������� ���������������������������������������������;�������������������������������������������� ���������������������������������������������� ����������������������
�������������������������&���������������������8������������������������������"���������������������������������������� ��"��������������������������������C������������ ������������������������������������������������� �������������������� �������������������)����������������� $������ !#%� �������� �� �������� ��� �� �� ��� ��������� ���� �� ��� ������� ���������� ���� ��� �������� ������� ������ D� ������������ ��������� ���� �� ������� � ������� �� �������� ���������� ���������� ������ ������� ���� ����� ����� ������������� ��� ���� � ����������� ������� *��������� ���� ����� �� *����� $����������� ����������� ������� �������������� ������� ������� � ���������� ���������������������������������������������������������� ��������� ������������������������� ��������� ������#������$��������������%����������� #������ ��������� >���������������������������������� ��������������������������������� ������� ��� ������� �� ��� ��"������� ��� �������� ������������6��� ���� ���"��� � �������������� �������������"�� ���� ����� ����� �"�������� �� ��� ������� ������� ����#������ $������ !#%������������������������������ �������� �� ���� ������>���� ���� ���� �����������������������������������"� �� ������ ���� ���� � ������� ���������� ���� ������� �������� ���� ��"� � ��� ���������� ����������
��"�,� ��!���# *��������$�����������������������������������5�������������������������������
5��������������������������������������� �����������������
$���������������� $�������������������������������������������������������������%� ������#������>������
#���������������>������
#�������������#������$��������������%������������ �����������������������������������������
#������*��������� !�������������� ����������������
(���������>������ #���������������������������� ������+�������������������������
��<,��1+�� ������#� ��,�&����������#���#������!#��,����� �#�,���������

� :�
����� ��� ������������������������"������������������������#������$������!��������#�������
)������ (���������� (������2�"���� $�������"������
������������������E�����������������E�+������������
#������������������ ������������������%��
?����#������$������
*�����������������������������������������������������
!�������������������������������������E���������������
#���������������������������
�
%� ������������������������������������
�
!�� ���������������������������� �����������������������������������������������������������������������������
(����������������� �&�#������$�������
�����������������������������
!���������������� �&�#��������������
�'��������� ��"�������"����������C��������������
��<,��8+����!��# �������"�,�!�� ����������#���#������!#��,����� �#�,���������
�
���%��#�����#� �������������#�# *��������������������+�
)�������������������������������������������������� ���������������������������������� �����+#$��%��������������F������������������������������������"�����������������������������������@������+#$���������������������������������������������������� ����������"���������������������������������������������������������������������� �������������������������������������������������������������������������������������������������������������� ����������������������������������������������������������������������������������� ������������� ������������������������������� ����������������������������;������ �����������������������������������������������������������������5���������5�����7/����$�������������F�����������������%������@�������2���������77&����������� ���������������� ������������ ��� �������������������������� ������������������������������� ������������ �������������������������������������������������������������������#������$���������������%��������������������������������������������� �������������������������������%���)������������������������������ ����������������������������������"�������������������)��������������������������������������������
�)���;!,��# *���������������&��+�
2������������������������������������������+#$������������������������������������������� �������������������������+#$��������������������������������������������(�������������������������������������������������+#$������������������������� �����������������������������������������������������������(����������������������;�������,������������;������������+#$-���������������
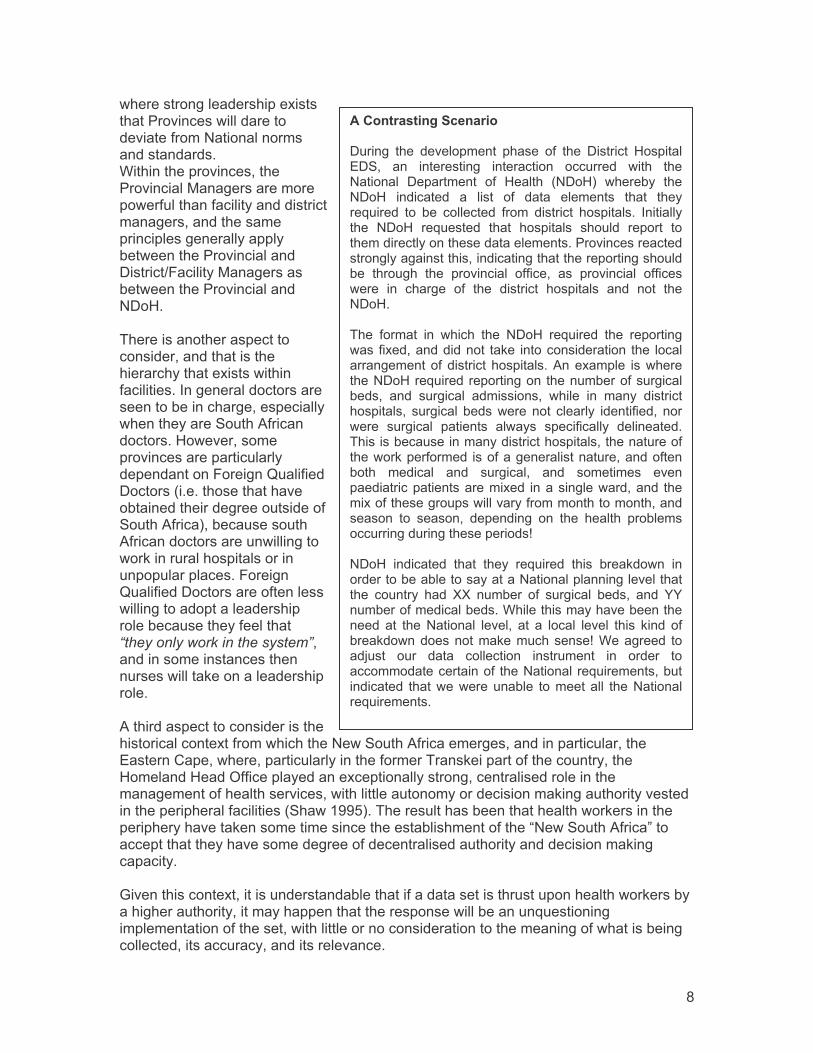
� /�
�������������������������������(������������������������������+�������������������������2���������������������(���������*������������������������������������������������������������������������������������������������ ���������(�������������#�����G@�������*����������� ���������(�������������+#$������������������������������������������������������������������������������������������������������������� �������������������������������������%���)�������������$�����������������������������������������������@������H���������#���������������������� ��������������������������%���)�������� �����������)�����������������������������"����������������������������������������@������H���������#����������������������������������������������� ��������������������� ����������������� ����������������������������������������������"�����������������������)������������������������������������������������������+���%���)������������������������������������!������'�����������������������������������������"����������������������$�������$����>��������������������������������������������������������������������������������������������������������������"���������������������������������������������%�����770����������������� ���������������"��������������������������"����������������������� �������������,+���%���)�����-�������������������������������������������������������������������"��������������4������������������������������ ��������������������������������������"���� ��������������������������������������������������� �������;��������������������������������������������������������������������������� ����������������������������������������������
��� �����# *���� ��#���#������ ��� ���������� ������ �� ��� #������ $������!#%�� ��� ���������� ��������� �������� ���� ���+������ #�������� �� $����� �+#$�� ����� �� ���+#$� ��������� �� ���� �� ���� �������� ��� ������;������ � �� �������� ���� ������� ��������� ������������ +#$� ��;������ ��� �������� ������ ����� ���������������������������������(���������������������������������������������������������������� �� ������ ��� ���������� ������� ��� ���������� ������������ ��� ������� �� ��� ������� �������� ���� �� ���+#$�������� ����� ��� ������ ��� +#$� ��;������ ��� ������������ ����������������� �"�� �������������� ��� ������������������ ������� ���������)���������� ������������+#$���;���������������� ������ �������������� ����� ���� ��������� ����������� ������ ��� ����� ���������������� ��������� ����������� �������� ����������� �������� ��������� ������� ������� ������������� ������������������� �����������������������������������������������"���������� �������������������������������� �� �������� ���� ���������� ���� �������� �������������������������������� ���������������������� ������������������������������������������������������ � ������� ���������� �� ��� ������ �� ��������������������������������I���+#$� ��������� ��� ���� ��;������ ���� ���"���� ��������� ��� ������������+��������������������������� ������ ���� JJ� ��� ��� �� ��������� ����� ���� KK���� ������������� �����2������������������ ������������ �� ���+������ ������� �� �� ����� ������ ���� "���� �� ���"������������"������������I�2��������� ���C��� ��� ���� �������� ��������� ��� ����� ������������������� ���+������ ��;���������� ����������� �������������� ��� ��������� ���+��������;����������
�

� 7�
�4������������������������������������������������������������������� ������������������������� �������������������������������������������������������������������������������������������������������;��������������������������������������������� �����������L���$������7/��������� ��������������� ����������;��������5��������5��������������������������������������������������������� ����� ������� ������������������������������������������ ������������������������� C�������������������������������� �����������������������>����������������������������� ���� ����$���������������������������� ����������;����������;������ ����������
��� �������������������� ����������������������������������������������������������(���������>�������������������������� C����������������������������������������� ��������������������������������������������������������������������������� ������������������������ C������������ �������������������������������������������������������������������������������������������������������������������������������������� ���� �����������������������
�� ������������ �������������������2������������������������������������� ������� ���������������������2����������������������������������������������������������������������������
��� %�������������������������"������������������"�������������������������"���������@����������������� ��� ���������������������������������"��������������������� ����������������������� ��������������������������� C������� ������������������������������������"��������� �����������������������
��� )���������������������� ����������������������������������������������������������������$���������������������������������������������������� ������������������������������������������������������������������������ ����������������$������������������������������������������������ ����������������������� �����������������!�����������
��� =���������������������������������������������������������������G������ C��������������������"�����������������������
��������������������������������������������������������������������������� ��$����������������������������������������������� ���������������������������������������������������#$!#%�������� ������������������������������������������������A��� �����������������������������������������������������������������
��������"������������������������������;������������������������������������������������������������B�
�� �����������������������������������������������"���������������������������������������� ������������������������������������������������������������������������������������������������������;����������������������������������������������� ������������� ��������������������������� ����������������� ���������������� ���������������������������������� ���;�����������������������������������������������������"�������������������B�
�� ��������������������������������������������������������������������������������������������������������������B�

� �3�
�� ��������������������������������������������������"���������������������������������������������������������������������������������������������������� ����������������
�2��������������������������������� ������������������������������������������������������������� ��������������A��� �� �� �������� ��������������� ��������������������������������
�����������B��� �� ����������� ��������� ������� ���������������������������������"����
�������������������������#� ������(���������$����>������������� ��-����
<)��;!,��# *���������������'�#,�# *���!��#��+�
>����� ��� ��������� ������������������� ��������������� ���������������������������������� ����������������������������������������������������������������������������������������������� ����������������������������"������������������������($'���������������������� ��� ���"������;��������������"�������������������"������������������"��������������� �����"���������������������������������������������������� �������������������������������������������������������������� �� �������������������������������������������� ����������������"�����������������������������������M� ��� ��7//������"��� ����������� ��� ������������������������������� ��� ���������� ����� �� �������� �� ���� ������� ��������� �� ������ ���� ��������������������������������������������������%���������������������������������������������� ��� ��� ����������������$������� ���$������ ��������������������������������������������������������������������������������������������������� ������� ��� ���� �� ���� ������������ ���� ��������� ��� ���� ����� ������ ��������� �� ��� ����� ������ ���� �������� ���� �������� ��� �������� ������ ����� ������ ��������� ������������� �� ����� ���������� �������� ��� ��������� ����� ���� "������������������������� ������� ���� �� ��� ������ ������� ��� ���� ��� �� ��� �� ������ ����� ������ �� �������������� ������� ������������������������� ������������������������ ������������������� ��������� ���� ���������� ��� ����� ��������� ��� ���� ������ ��� � ����������������� ����������� ����� � �� ����� � ��� ���������� �� �� ������ ��� ������ ��������������������������������� �����������������"�������)����������;���������������������������������������������������������������������������2���������77&�������� �������� ���������������������������D������������������� ������������������������������������������������$������������������������������������������� ������������������������������������������������������������������������ ����������������������������������������� ������������������������������������>��������������������������������������������������������������������������������;������������������������������������������������������������������������������*��������������������������������������������������������������������������������������������������������������������������������������������>��������������������������������������������������������������������������������������������������������������������������������������������%���)������������������������������������ �����

� ���
��� ������������������ ����������������������������� ����������������������������������������(�������������������������������������������������������������������"���������������������������������������������������������������������������������������������������������������������������������������������"�����������������C���������������;������������������������������������������������������"��������������������������������L���F������778�������������,� �� ��� ������$����������������������%���������������������� ������������ ������������� ������������������������������� ����������� ��������������& ������"��������������������������� ���������������������� ����������������������������������������������������-���
��%��� �,��#� +�
�������������������������������������������������������������"�������������#������$���������������%���������������������������������������������������������������������������������������������� ������������������������������������������������������������������ ���������������������������������������������������� ����������� ������������������������������������������������������������������������������������������������������������)�������������������� ����������������������������������������������������������������������;�����������������������������������������������������������"��������������������*���������������������������������������������������������������"�������������������������������������������,������-������������������������������������������������������������"�����������������������������������������

� ���
������ ����
��� F�����L����778���#��������������(�������$�����'��������������������������
���#���������'������� �����������������*����������%���)��������@�(�7�.������=������(� ���������
�� $�����L����7/����(�����������F����������+���(���������$�������;����A�)������ "��������������������������(��5���������L��5�����'����������L���2�����N�%��+��7 &8��
�� *����������J���L��5�������������333���(�������$�����'����������!������'����(��������77:� ��333��J��*����������F������!�����������(��������%���)�������!;����(�C����*���������%�����������$����+���&��
�� 5������(������L��5������7/����$�������;����A�)������ "��������������������������'����������L���2�����N�%����
�� %�����?����770���O#�����������������$�����%������'�����A�(���������5���������H��������#������O�
�� 2��������4����77&�����������������������%���������>������������'����������!��������L���2���������%����
�� M� ����%����7//���������)��������%����*������A��������������"�����������$��������(����������(� ���������
��

!!� �#;�>+��������� �#����������������#���#������!#��,�� ����
��#� �������+�
)�������
���
(�����
���&��
� ���
����
���
��
���
�����
���
����
���
� ��
����
������
�����
� ��
���
���� �������
� ������
��
��
�
�����
������
����
����
����
� ��������
F���>
���������5
��
��F
���
�����
�������
��*
���
�����������
*��
���
���������)
�����
����
%��
� ����
��������
�
�)
����
��������
�����
��
���
������������
*��
���
���������#
�������
���E
�#���
��E
����
����
���
��
2���
������
�1
��F
�������������
*�
�F
������������
2���
������
��
����
�����������
*��
���
���������
�����
��'
�����#
���
�5��
�*
�P��
���
������
������
2���
������
��
������������
����
����
2���
������
�(
������
��*
����
��5
��
�)
�%
����
F���
��E
�����
�����������
��"�
=� ���2
���
�5
����
��
�� ���
��
=� ����
���
������
�*
��
�����*
����
��5
��
��
*��
���������
��
*��
������
���
���
���
��
�������
������
=� ����
���
������
�#
���
���������
��
��
������
���
������
2���
�5����
��
������
��
2���
������
���������
�1
�������
������
����
���
����
��
*�
P�������
�����
����
�����
�����
����
��
(�����
���
�2���
�5
����
P�������
����Q
�0��
��
��
��
(�����
���
�2���
������
����
��
P��
(
�������
���
*�
P���(
�������
���
������������
���
+G)
��
�'
����
��������
�����
*�
P����
����
����
����
���
��
����
����
���
2���
������
@��
���
������
����
0 .
0�
�
�������� ��
=�
�F���
�2���
����
��
*�
P�����
��
� ��
���
���
���
�����
��Q��0
33�
���
���
=� ����
���
���
���
��
�����
��
���
��
=� ����
���
������
�1
�#����
�������
���2
5������
���
*�
P�������
�������
���2
5������
���
=� ����
���
���
���
��
�������
�������
=� ����
���
������
�1
������
����
����
������
�1
�)����
����
����
������
=� ����
���
���
���
��
�������
�������
=� ����
���
������
�'
���������%
�����5
��
��
P�������������
������
�������
"�
��
�������
�������
=� ����
���
������
����������
����
���
����
�*
�#
����
��������
�
���Q
�/��
����
�=� ����
���
���
���
��
�������
�������
=� ����
���
������

!!� �#;�>+��������� �#����������������#���#������!#��,�� ����
��#� �������+�
)�������
���
(�����
���&��
� �����
������
����
����
����
�����
�1
�5���
�����
���
���
�����
��
*�
(�����
������
�����
�����
�������
���
>(
#������
>(
#�E
����������
�������
>(
#������
�1
����
��
��
�*
?)
��E
����
�����
������
������
>(
#������
>(
#�E
����������
�������
>(
#������
���
�����
����
����
����
�����
� �
�1
��
������
���
�����
�"�
)�
P��
��
���
���
�����
�"�
%
��������
P���
����
����
� ������
�"�
%
��������
�1
�!#
=���
���
�����
�"�
)�
P�!
#=���
���
�����
�"�
(����
���������P���
����
����
� ������
�"�
(����
���������
����
���
���������
�P���
����
������ ���
�P��
�����������
�
��
��
��
�
��
��
��
�
����
����
����
����
����
�'
������(
#!
�*
���
����
����������
���������
�����
���
�
@��
�����
��*
������
���
%���
���@*
%��
5�����
(����������
;���
���
��
$�������
��
��������
�1
�F����������
����
��
!���������
���
��
����
������
@*
%�5
�����
F������
���
���
����
%��
� ����
��������
�
�1
�����
����
��
���
���
��
��
*�
��
����
��
�������������
������
��
�'
����F
"�
����
���
����
���
��
���
�

!!� �#;�>+��������� �#����������������#���#������!#��,�� ����
��#� �������+�
)�������
���
(����&
���&��
�
���
�������
�������
� ������
����
����
��
���
�����������
+���� ��
�#��
������%
� �
����
��
���
��)
�P�*
��
����������
� �
��
��
5������
�#
�����
�>
����
��
����
��
��
5������
�#
�����
�>
����
��
�����
������
��(
���������
%� �
����
�����
��)
�P�*
��
����������
� �
��
��
5������
�#
�����
�>
����
��
����
��
��
5������
�#
�����
�>
����
��
�*
��
���������
�����������
)�
P�*
��
����������
� �
��
��
5������
�#
�����
�>
����
��
����
��
��
5������
�#
�����
�>
����
��
�1
����
�����
��������
���
)�
P��
�������
��������
���
5������
�#
�����
�>
����
��
����
��
��
5������
�#
�����
�>
����
��
�(
$'
��������
�P�(
$'
�������
5������
�#
�����
�>
����
��
����
��
��
5������
�#
�����
�>
����
��
����
��
F��������
������
���(
#!
�)
�)
������F
�����
@*
%�
(#
!���������
$�������
��
��������
�1
�!���������
����
��
��
�
�� �(
���
�����
*�
��
����������
���
�������
����������
@*
%�
��
������������
�@*
%�
�� �#
�����
*�
��
����������
�����������������
@*
%�
��
������������
�@*
%�
���
����
�1
��������
������
����
��
��
�
�� �(
�((
���
���
���
)�
2����������
����
�������
*��
��
��
P��
��
����
��������
�������
��(
�((
�����
����
���
�� �@
�������
���
������"���
�)
�2
����������
���������
����
����
���
*��
��
��
P��������
����
����
����
�������
���
�'
�������
�������
�)
�P��
���
��
$�������
��
���
�����
P��
��
����
���
$�������
��
��������
������
����
1�'
����������
��������
��
��
�
�� �*
������
���
)�
P��
����������
��������
(���
��������
� �����(
!5
%)
=��
P��
����������
����
���
��
(!
5%
)=�
�� ��
����
���
)�
P��
����������
��������
(!
5%
)=�
P��
����������
����
���
��
(!
5%
)=�
�1
���������
�������
�����
���������������
�
���
)�
P��
�������
�������
����������
�
���
�P��
�������
�������
��
���
�����
'�������������������������
����
����
)�
��
���
�����
�������
���
����
@*
%�
(#
!�
$�������
��
��������
�
1��
���������
��
���
������
�����
���
�25
��%
���
���@F
'B��
)�
�=� ������
���
P��
���
������
����
� ��
������
����@F
'��)
@F
�����
���
9N
!��'
%@��
���
��
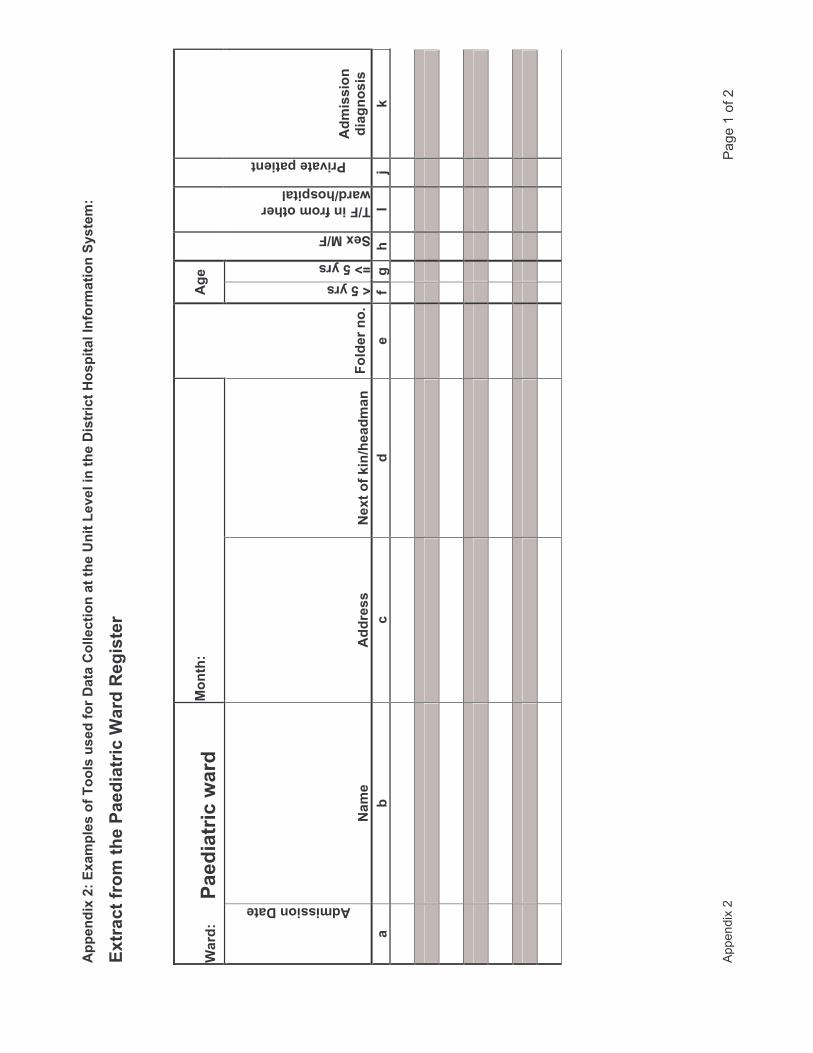
!!� �#;�1+��;��!,���������,������������������,,���#� ��������. #����"�,�# ������#���#������!#��,�� ����
��#� �������+�
)�������
���
(�����
������
�;������������������#���#��/
������*#�����
�� /���+����������#���#��&���
�� ��+�
*��
��
��#��#� ������
�����
�������
��;�����7# @������ ���,���� �%�
A�4�����
BC�4�����
��;�@��
�@��# ������������
&���@���!#��,�
�#"����!��#� ��
��#��#� �
�#�* ��#��
���
<�
��
��
��
��*���
��-�
7�
����
����
����
����
����
��
����
����
����
����
����
��
����
����
����
����
����
��
����
����
����
����
����
��
����
����
����
����
����
��
����
����
����
����
����
��
����
����
����
����
����
��

!!� �#;�1+��;��!,���������,������������������,,���#� ��������. #����"�,�# ������#���#������!#��,�� ����
��#� �������+�
)�������
���
(�����
������
�;������������������#���#��/
������!���+�
�
��!���������/���+�DDDDDDDDDDDDDDD�
�� ��@����+�DDDDDDDDDDDDDDDDDDDDDDD�
,,�&�����
�����#���#��
)��
����
���Q
�0��
���
��
��#��#� �+�
@�
���
���
������
��A�
*���
���
���
)��
����
���R
�S�0
��Q
�����
����
��
��� ������# �+�
�@��
���
���
����
F'
4��
� ���
���
@�
��
����
$������
����
�
���
����
����
�����
��������
�Q���
������
��
����
@�
��
����2
���
���
����
����
�F
�+��
���
��!����#� �+�
@�
���
�����
��������
A���
����
��%
�����
�*���
����
��Q
�0��
���+
��
���
���������
��
����
����
4��� �
��
����G�
������
���
��
���
��
����������
����
��)
���
�5������
�������
����
��
�����������
��
�����
���
���
����
'�����
����
��
�������
��#
���
��
����
'���
����
��
��9
����Q
�R�:
������
����
��+
��������
��
��/ �
/��
����
����
��*
�����
��
��
���7��
���� ��
�����0��
���
����
��>
����
���
����
���������
�����0��
���
����
��0��
����
� ��
���������
����
���
�
�����
����
��������
���
����


APPENDIX 2
Shaw, V. (2005). Health information system reform in South Africa: developing an
essential data set. Bulletin of the World Health Organisation, 2005(83), 632 - 639.


Round Table
Health information system reform in South Africa: developingan essential data setVincent Shaw^
Abstract Health services are increasingly under pressure to develop information systems that are responsive to changing healthneeds and appropriate to service objectives. Developing an essential data set provides managers with a clearly defined set ofindicators for monitoring and evaluating services. This article describes a process that resulted in the creation of an essential dataset at district level. This had a significant impact on neighbouring districts and resulted in the development of a regional essentialdata set, which in turn helped to influence the creation of a provincial and then national essential data set. Four key lessons maybe drawn from the process. The development of an essential data set both requires and can contribute to a process that allows thereporting requirements to be adjusted over time in response to changing circumstances. In addition, it contributes to (and requires)the integration of programme reporting requirements into a coherent information system. While the case study describes a bottom-upapproach, a top-down consultative process is advocated because it establishes a framework within which information needs can bereviewed. Lastly, the use of surveys can aid efforts to keep the essential elements to a minimum. In conclusion, the development ofan essential data set contributes to strengthening health services because it necessitates dialogue between programme managersand defines indicators to be monitored by them.
Keywords Information systems/organization and administration; Health status indicators; Data collection/methods; Community healthservices; Delivery of health care; Program evaluation/methods; South Africa (source: MeSH, NLM).
Mots des Systeme information/organisation et administration; Indicateur etat sanitaire; Coliecte donnees/methodes; Service publicsante; Delivrance soins; Evaluation programme/methodes; Afrique du Sud (source: MeSH, INSERM).
Palabras clave Sistemas de informacion/organizacion y administracion; Indicadores de salud; Recoleccion de datos/metodos; Serviciosde salud comunitarios; Prestacion de atencion de salud; Evaiuacion de programas/metodos; Sudafrica (fuente: DeCS, BIREME).
Bulletin of the World Health Organization 2005;83:532-539.
Voirpage 635 le resume en frangais. En la pagina 636 figura un resumen en espafiol. .636 »»«iue
IntroductionIncreasingly, information systems for monitoring health servicesare being scrutinized for their appropriateness and ability toprovide meaningful information to managers (7—^. The visionof the District Health Information System (DHIS) developedin South Africa is "to support the development of an excellentand sustainable health information system that enables all healthworkers to use their own information to improve coverage andquality of health care within our communities" (5). According tothe basic principles of the DHIS, it supports the district-basedprirhary health care approach, collects essential data used tocalculate indicators, encourages decentralized use of informa-tion by health workers, includes all service providers at all levels,and integrates with and supports other information systems.
Over the past 10 years, a comprehensive primary healthcare information system has been developed in South Africa.One of its key elements is an essential data set, which may bedefined as a set of the most important data elements, selected
from all primary health care vertical programmes, that shouldbe reported by health service providers on a routine basis,with the aim of being able to generate indicators that monitorthe provision of health services in an integrated manner. Anessential data set is thus important in that it contributes tothe principles listed above and facilitates decentralized use ofinformation by health workers because their monitoring needsare clearly defined.
There are two key messages in this definition, containedin the linked concepts of integration and an essential data set.Programme managers (e.g. coordinators of the Expanded Pro-gramme on Immunization (EPI) and programmes for women'shealth, HIV/AIDS and sexually transmitted infections, andtuberculosis), in an effort to ensure that all angles of servicedelivery are taken into consideration, often require a very largeamount of information for their specific programmes. Theirprimary concerns are their programme needs, and little at-tention is giveti to the means of collecting the information or
' Manager, Health Information Systems Programme, School of Public Health, University of the Western Cape, South Africa (email: [email protected]).Ref. No. 04-015032
632 Bulletin of the World Health Organization | August 2005, 83 (8)

Vincent Shaw
Special Theme - Health Information Systems
Developing an essential data set for health information
the needs of other programmes. The requirements of variousprogrammes may duplicate each other, and the vertical report-ing of this information often requires separate data collectiontools. As a result, the health worker is faced with a myriad ofbooks and forms, all used to collect information for specificmanagers, but with little integration and no vision of its use atthe local level. Experience has shown that the larger the number,ofdata elements to be reported upon, the poorer the quality ofthe data {6, 7).
The creation of an essential data set is based upon two keyprinciples: limiting the routine reporting requirements for pri-mary health care and hospital services to a set of 100—150 dataelements, enabling the calculation of 80-120 indicators; andintegrating the reporting requirements of various programmemanagers, so that their needs are contained within the set ofessential data elements and indicators.
This article describes a process that resulted in the creationof an essential data set at district level. This had a significantimpact on neighbouring districts and resulted in the develop-ment of a regional essential data set, which in turn helped toinfluence the creation of a provincial data set.
Developing an essential data set at districtlevelIn a remote district in the northern part of the Eastern CapeProvince, the district management team found that the data col-lected by the clinic staff seemed inappropriate for the adequatemanagement of services. Until then, data had been submitted tothe head office on a routine (quarterly) basis, but no feedbackwas ever received. The requirements for data submission hadbeen determined by head oflfice staff many years earlier and hadnot been revised to accommodate recent changes in the priori-ties for health service delivery.
The decision to review the data collected at facility leveltook place in 1994, when the "new" South Africa was requir-ing an increasingly decentralized management structure andgreater transparency in terms of access to information andhealth statistics. In addition, the focus had shifted significandyfrom a hospicentric health service to a health service orientatedtowards primary health care.
The district team evaluated all the services that they wereproviding, and identified data elements or indicators thatwould accurately monitor these services. This exercise includeda process of evaluating existing data elements being collected.For each data element that health workers wanted to be in-cluded, they had to answer the questions: Why do we wantto collect this information? How will we use it? The answersshould underpin the need to monitor the integrated strategicplan for the district. If the health workers could not come upwith a reasonable answer to either of the questions, the dataelement was discarded or reformulated so that the questionscould be answered,
A long list ofdata elements and their associated indica-tors was developed. Then began a process of whittling awayat the list until about 70 elements remained, which were con-sidered the most essential data elements required to calculateabout 75 indicators. This set of indicators was small enoughto allow management to focus on the key aspects of serviceprovision, yet was large enough to monitor services across allprogrammes. It provided management with an integrated sys-tem for assessing services. Along with the data elements andindicators, a set ofdata collection tools was developed.
Box 1. An essential data set must be able to accommodatechanges over time
There were a number of important modifications that came aboutas a result of the process of establishing an essential data set. Oneexample that higiniights how experience influenced the developmentof the data set hinges on the data elements collected for antenatalservices. Two of the antenatal indicators were:
• antenatal coverage (first antenatal visit divided by the expectednumber of pregnancies in the women of childbearing age);
• average antenatal visits per antenatal client (first antenatal visit plusfoilow-up antenatal visit divided by the first antenatal visits).
The district management team found a very high antenatal coveragerate in the district (112% for January-December 2000); with anaverage of three antenatal visits per antenatal client, it was apparentthat the pregnant population was able to access the required services.The next step was to seek to improve the quality of services by firstdetermining the percentage that accessed the services within the first20 weeks of pregnancy and, if necessary, increase it. The team's gutfeeling was that a very low percentage actually accessed services inthe first trimester. Hence a new, more specific indicator was introducedand the existing data element "First antenatal visit" to be split into:"First antenatal visit within first 20 weei<s of pregnancy" and "Firstantenatai visit after 20 weeks of pregnancy".
Managing upwards: the district influencesthe regionAs the district implemented the new system, adjoining districtscame to learn about the new data set and its efficiency. Gradu-ally, pressure from other areas within the region to implementthe same data set mounted; as a result a regionwide consulta-tive meeting was convened, at which the district data set wasassessed and adapted to accommodate the needs of the region.This, in turn, resulted in the region approaching the provinceto reduce the number of indicators being reported upon; fi-nally, after some time, the province approached the nationaladministration, and in June 2002 a national workshop adoptedan essential data set for the country.
Important lessons learned from this processReporting requirements must be able to changeover timeChanging needs of patients require changing reporting re-quirements, as evidenced by the emergence of the HIV/AIDSepidemic and increasing access to antiretroviral therapy. In thecase of the HIV/AIDS epidemic, managers at the central levelhave generally been responsive to the needs of patients and thereporting requirements of donors. The reality is, however, thatthese managers operate from positions of power and are able toimpose reporting requirements even if they have not been wellthought through. Managers at facility level may have a bettergrasp of the needs of patients, but they have less influence inmaking these needs known. The result is that once reportingneeds have been defined, they remain cast in stone.
Reviewing reporting requirements requires a broadly con-sultative process between managers of different programmesin order to ensure that duplication is avoided. This is not easyto achieve.
As managers use information, their understanding of itsmeaning improves and their demands become more sophisti-cated, Bodart & Shrestha (S) describe four types of indicator
Bulletin oftheWorld Health Organization | August 2005, 83 (8) 633

I Special Theme - Health Information SystemsI Developing an essential data set for health information
(count, proportion, rate and ratio). Our experience has shownthat managers are initially most comfortable identifying countindicators (e.g. number of patients with hypertension). Theyshould be encouraged to look beyond this, however, to identifyhow they would use this count indicator to improve service de-livery. This often leads to the development of indicators whichbring in another data element as the denominator, creating oneofthe other three indicator types. Box 1 provides an examplefrom which it can be seen that an atmosphere needs to be cre-ated where the review of reporting requirements is acceptable,even the norm. This needs to be the case both at the centraland the peripheral levels.
Programme reporting requirements must beintegrated in order to ensure the development ofcoherent informationThere should be agreement among programme managers toadhere to the principle of developing an integrated data set. Inthe absence of this, health workers at the facility level are likelyto have to cope with uncoordinated and often duplicate de-mands for information that will result in their being distractedfrom their primary function — providing health services. Anexample would be where the nutrition programme requiresreporting on the number of children under five years of ageattending the clinic, number of children weighed, and numberof children with malnutrition. In order to be sure that facilitiesreport on these elements, the programme develops a data col-lection form specific to its needs. At the same time, EPI requiresreporting on children attending under two years of age, and
Vincent Shaw
immunizations given to them (BCG, DPTl-2-3, OPVl-2-3,etc.). It also develops a report format specific to its needs. Boththese programmes are targeting the same population group,without considering that, from a health care worker's point ofview, the child who needs to be immunized also needs to beweighed and given vitamin A, and in the clinic it is the samehealth worker who provides all these services. Adopting an inte-grated approach would ensure that systems are developed whichcomplement each other and are appropriate to the manner inwhich services are delivered.
An integrated data set also provides managers at facilityand district alike a clearly defined target to work towards, bothin terms of collecting and using the information.
A top-down consultative process establishes aframework for reviewThe creation of an essential data set for South Africa began asa bottom-up process. Decentralized districts are often less bu-reaucratic in nature than central systems, and more responsiveto the changing needs of patients. As a result, they are able tosee the need to revise reporting requirements and are able toeffect a change reasonably easily. It is also easier to bring dif-ferent programme managers together at district level, to ensureintegrated reporting.
A more strategic position to adopt, however, would befor a national ministry to take it upon itself to facilitate thedevelopment of an essential data set for the country. A con-cept in support of this process is a hierarchy of informationneeds (5, 9).
Fig. 1. The hierarchy of information needs
Information used by national programme managers
Information collected byand used at facility level
Information required by national authority
Additional information required by distria or municipal department
\ / Additional information required by facility management
634 Bulletin of the World Health Organization August 2005, 83 (8)

Vincent Shaw
A hierarchy of information needs operates at the follow-ing levels.1. A national ministry determines an essential data set — this
is the minimum reporting requirement for all facilities andhealth service providers in the country.
2. The next level of management (a region or province) addsindicators that they believe they should collect in order to beable to manage their services efficiently (e.g. in the examplein Box 1 the original indicator was split in order to obtainmore detailed information).
3. A district management team adds to the regional essentialdata set indicators they believe are important to managetheir services (e.g. a district wants to improve the supervisionprocess in clinics, so monitors the percentage of plannedsupervisory visits undertaken).
4. A facility develops an essential data set which includes indi-cators from the ministry, region and district, as well as theirown indicators (e.g. if facility staff want to confirm thatthey carry an increasingly large workload of patients fromoutside their official catchment area, they develop an indi-cator "Percentage head count attendances from outside thecatchment area"). The type of information important for afacility management committee, and possibly for a district, isnot necessarily relevant at the national or regional levels.
Applying the concept of a hierarchy of information necessitatesadherence to the principle of only transmitting the informationthat is required to the next level. With the advent of computers,and patient-based information systems, the temptation to trans-mit all the information through to all levels must be resisted.
Additional information can be collected throughspecific programme surveysIn order to ensure that the essential data set is limited in size, itis necessary to provide programme managers with an alternativemechanism for collecting programme data outside the routinereporting system. This is done by using surveys.
Surveys should be used to gather information that willcomplement the routine reporting. As some indicators donot change much over time, they do not need to be reported
Special Theme - Health Information SystemsDeveloping an essential data set for health information
on monthly — they could be collected annually or quarterlythrough the use of surveys. Typical contents of a survey ques-tionnaire would be questions about quality of care, availabilityof equipment, staffing and budget allocations. Surveys can beused creatively to strengthen health services. For example, itmay be that in order to reduce the cost of surveys, a three-yearrolling plan is developed, ensuring that each year a third ofall facilities are surveyed: all are surveyed over the three-yearperiod. A survey data set would contain core information thatis common to all the years, and additional information couldbe changed from year to year according to need.
ConclusionDeveloping an essential data set provides nianagers with a clearlydefined set of indicators for monitoring and evaluating services.The process of developing an essential data set can strengthenthe health services and the health information system becauseit requires coordination of reporting requirements among pro-gramme managers, and the creation of a framework for review-ing information needs over time. Applying the concept of ahierarchy of information needs allows each level within thehealth service to develop its own data set, while still respond-ing to the needs of the central administration. This encouragesthe use of information at a local level because each level hasbeen involved in determining the indicators and data elementsthat are collected. Annual surveys can be used to complementroutine reporting, enabling the essential data set to be kept to
a minimum.
AcknowledgementsThis article would not have been possible without the innova-tions developed in the Ukhalhamba District under the guidanceof Arthur Heywood, supported by the vision and leadership ofJenny Brown, Elsabe Schlebusch and, later, Rudi Thetard. Thenurses who worked in the clinics in the Ukahlamba Districtare thanked for their perseverance in testing the hierarchy andin developing the initial set of indicators.
Competing interests: none declared.
Resume
Reforme du systeme d'information sanitaire en Afrique du Sud : mise au point d'un jeu de donneesessentiellesLes services de sante sont de plus en plus incites a developperdes systemes d'information reagissant a revolution des besoinssanitaires et repondant aux objectifs de service. La definition d'unjeu de donnees essentielles fournit aux gestionnaires une seried'indicateurs dairement def inie permettant de surveiller et d'evaluerles services. Le present article decrit un processus aboutissant ala creation d'un jeu de donnees essentielles au niveau du district.Cette operation a eu un impact important sur les districts voisinset a conduit a la mise au point d'un jeu de donnees essentiellespour la region, processus qui, a son tour, a contribue a I'elaborationd'un jeu de donnees essentielles a I'echelle de la province, puis dupays. Quatre enseignements peuvent etre tires de cette experience.La mise au point d'un jeu de donnees essentielles necessite unprocessus permettant d'ajuster les exigences de notification
au cours du temps en reponse a revolution des circonstances,processus auquel elle peut en meme temps contribuer. En outre,elle facilite (et impose) I'integration des exigences de notificationdes programmes dans un systeme d'information coherent. Bienque l'etude de cas decrive une demarche partant de la base, unprocessus consultatif descendant est preconise car il fixe un cadredans lequel les besoins en information peuvent etre analyses. Enfin,la realisation d'enquetes peut contribuer aux efforts pour limiterle plus possible le nombre d'elements essentiels. En conclusion,la mise au point d'un jeu de donnees essentielles participe aurenforcement des services de sante car elle implique un dialogueentre les directeurs de programmes et la definition d'indicateursque ces derniers doivent surveiller.
Bulletin of the World Health Organization | August 2005, 83 ( 635

Special Theme - Health Information Systems
Deveioping an essential data set for health information Vincent Shaw
Resumen
Reforma de los sistemas de informacion sanitaria enesencialesLos servicios de salud se encuentran sometidos a una presion cadavez mayor para desarrollar sistemas de informacion sensibles alas nuevas necesidades de salud y apropiados para alcanzar losobjetivos fijados. Un conjunto de datos esenciales puede dotara los administradores de un abanico claramente definido deindicadores para vigilar y evaluar los servicios. En el presentearticulo se describe un proceso que permitio crear un conjuntode datos esenciales a nivel de distrito. Ello tuvo importantesrepercusiones en los distritos vednos y condujo a desarrollar unconjunto de datos esendales de ambito regional, lo cual influyo asu vez en la creadon de un conjunto de datos esenciales provindaly mas tarde nacional. Cabe extraer del proceso cuatro importanteslecciones. El desarrollo de un conjunto de datos esendales exige yal mismo tiempo puede favorecer un proceso que permita ajustar
Sudafrica: desarrollo de un conjunto de datos
las necesidades de informadon con el tiempo en respuesta a laevolucion de las circunstancias. Ademas, propicia (y requiere)la integracion de los requisitos programaticos en materia depresentacion de informes en un sistema de informacion coherente.Mientras el estudio de casos describe un enfoque ascendente,aqui se preconiza un proceso consultivo descendente, pues asf seestablece un marco en el que pueden analizarse las necesidadesde informacion. Por ultimo, la utilizadon de encuestas puedeser una ayuda para redudr al minimo los elementos esenciales.En conclusion, el desarrollo de un conjunto de datos esencialescontribuye a fortalecer los servicios de salud porque requiere quehaya dialogo entre los gestores de los programas y define losindicadores que estos deberan vigilar.
oUki. l (3 JVAL.; i i ^ l sift
jls i=»^
ii; jf oU-j_J,l
Uf
\:^\ Js.
^ J OUjlUll
i 3.30̂ 1 CJ
oli
References
1. Green A. An introduction to heaith planning in deveioping countries. Oxford:
Oxford University Press; 1999.
2. White Paper on the transformation of health services. Durban: South African
Department of Health; 1997. Available from: http://www.doh.gov.za/docs/
index.html
3. information support for new public heaith action at district level. Report of
a WHO Expert Committee. Geneva: World Health Organization; 1994. WHO
Technical Report Series, No. 845.
4. Campbell B, Adjei S, Heywood A. From data to decision making in health:
the evolution of a health management information system. Amsterdam:
Royal Tropical Institute; 1996.
5. Heywood A, Rohde J. Using information for action: a manuai for health
workers at faciiity level. South Africa: EQUITY Project.
6. Stoops N, Williamson L. Using health information for local action: facilitating
organisational change in South Africa. In: Krishna S, Madon S, editors. The
digital challenge: information technology in the deveiopment context.
Gateshead: Athenaeum Press Ltd.; 2003.
7. Williamson L, Stoops N. Using information for health. In: South African Heaith
Review 2001. Available from: http://hst.org.za/sahr/2001/chapter6.htm
8. Bodart C, Shresta L. Identifying information needs and indicators. In:
Lippeveld T Suaerborn R, Bodart C, eds. Design and implementation of
heaith Information systems. Geneva: WHO; 2000:Chapter 4.
9. Braa J, Hedberg C. The struggle for district-based health information systems
in South Africa. The information Society 2002; 18:113-27.
636 Bulletin of the World Health Organization | August 2005, 83 (8)

Round Table Discussion
Information is not only for managersRichard E. Cibulskis^
The product described hy Shaw — a simplified health informa-tion system implemented on a national scale — is not new (1,2). What is interesting is the hottom-up process, as it is quiteunusual for systems originating in one district to take hold overa wide geographical area. This may be because some districtsare reluctant to use a system designed by other districts or be-cause they do not have the same resources for implementation.Whatever the circumstances, bottom-up processes can producea variety of incompatible information systems, each competingto be adopted as a national standard. South Africa does notappear to have succumbed to this problem, but it is still notclear if its system really works. It would be instructive to learnmore about its reporting rate from institutions. This is a goodindicator of an information system's performance as it requiresseveral basic processes to be fulfilled, such as a complete listingof reporting units, compliance with reporting requirements andprocesses for monitoring compliance. A good reporting rate isalso critical to the eventual interpretation of indicators.
Whether a top-down or bottom-up approach is preferred,the design of health information systems requires a clear un-derstanding of why data are being collected; ultimately theyshould influence the behaviour of those in control of resourcesin ways that will enable the health sector to achieve its objec-tives. Data should certainly be used by health managers to planand monitor programmes, enabling them to allocate resourcesto priority health problems or populations. The informationrequired for this task, however, is wider than that provided byroutine health information systems. Some relevant data systems— for population, finances, and staffing — are managed byother government departments, while some information is col-lected through censuses or surveys (particularly if many servicesare delivered through non-government providers). An optimalinformation strategy needs to consider how the different sourcesof information will work together. For example, it should beclear about the definitions of indicators and the coding systemsused for geographical units. Some form of centrally coordinatedapproach seems inevitable. Such coordination should not bemistaken as being set up for the purpose of supplying centrallevel managers with information: although they might benefitfrom information, they rarely have the capacity or authority torespond to large quantities of data. Rather, central coordinationis primarily to bring together data from districts so that they canbe summarized in such ways that districts can compare theirperformance with that of others.
Health managers are often ineffective users of informa-tion, despite efforts to train them, encourage them or providethem with new information systems. Time and again, inequi-ties or inefficiencies in the use of resources go unheeded. Thismay be because health managers have little influence over key
Round Table IRound Table Discussion I
decisions in government or perhaps because they are not mo-tivated to respond. There is a growing awareness that if we areinterested in enhancing the performance of the health sectorthen external uses of information can carry greater weight thaninternal uses (3). Thus, public disclosure of information can help"politicians, patients and citizens to scrutinize the operationswhich they are financing" (4) and in this role it can encouragemanagers to be more responsive to their clients' needs. Similarly,information can be used by health managers to lobby externalauthorities for greater support. If external uses of informationhave greater impact than internal uses, should not the healthsector take this into account when designing its minimal datasets? It may be that the minimal data set for politicians, citizensand the treasury are the same as that for health managers, butnot necessarily so. Citizens may be more interested in learn-ing whether basic inputs such as staff and drugs are available,whereas a ministry of finance may be interested in learningwhether national development priorities are being delivered.Whatever the final content, minimal data sets need to beginwith the key users and uses of information and they should notremain the preserve of health managers. •
Competing interests: none declared.
1. Lippeveld T, Sauerborn R. A framework for designing health informationsystems. In: Lippeveld T, Sauerborn R, Bodart C, editors. Design andimplementation of heaith information systems. Geneva: WHO; 2000:15-32.
2. Cibulskis RE, Hiawalyer G. Information systems for health sector monitoring inPapua New Guinea. Buiietin of the Worid Heaith Organization 2002;80:752-8.
3. The World Bank. World development report 2004 - Making services workfor poor peopie. Washington (DC): the World Bank; 2003.
4. Smith P The use of performance indicators in the public sector. Journai ofthe Royal Statistical Society Series A 1990;! 53:53-72.
Indicators for a health information dataset in GhanaSamAdjei^
A health information system handles the recording, storage,retrieval and processing of health data. Broadly defined, thehealth information system should cover such data sources asvital registration, censuses, routine service-generated statistics,population-based surveys and research information, in order toprovide evidence for decision-making in the health system.
Assessments of health information systems have givenrise to several misgivings. Foremost among them is the fact thatmultiple data sources are not linked to each other; indeed, dif-ferent instruments may generate different data on the same per-son or event. Routine service data are collected with the needsof higher-level programme managers and donors in mind; inaddition, they may be incomplete or of doubtful quality, andtimeliness can be a problem. Surveys are useful, but they tendto be expensive and donor driven and are often not linked toroutine service data. Research data are generally available butare rarely included as part of the health information systembecause research is conducted outside the scope of ministriesof health. Dissemination of the information collected is usually
Monitoring and Evaluation Advisor, World Bank Office Jakarta, Jakarta Stock Exchange Building Tower 2,12th floor, Jl Jenderal Sudirman Kav 52-53, Jakarta 12190,Indonesia (email: [email protected]).Deputy Director-General, Ghana Health Service, Private Mail Bag, Ministries, Accra, Ghana (email: [email protected]).
Bulletin of the World Health Organization | August 2005, 83 (8) 637
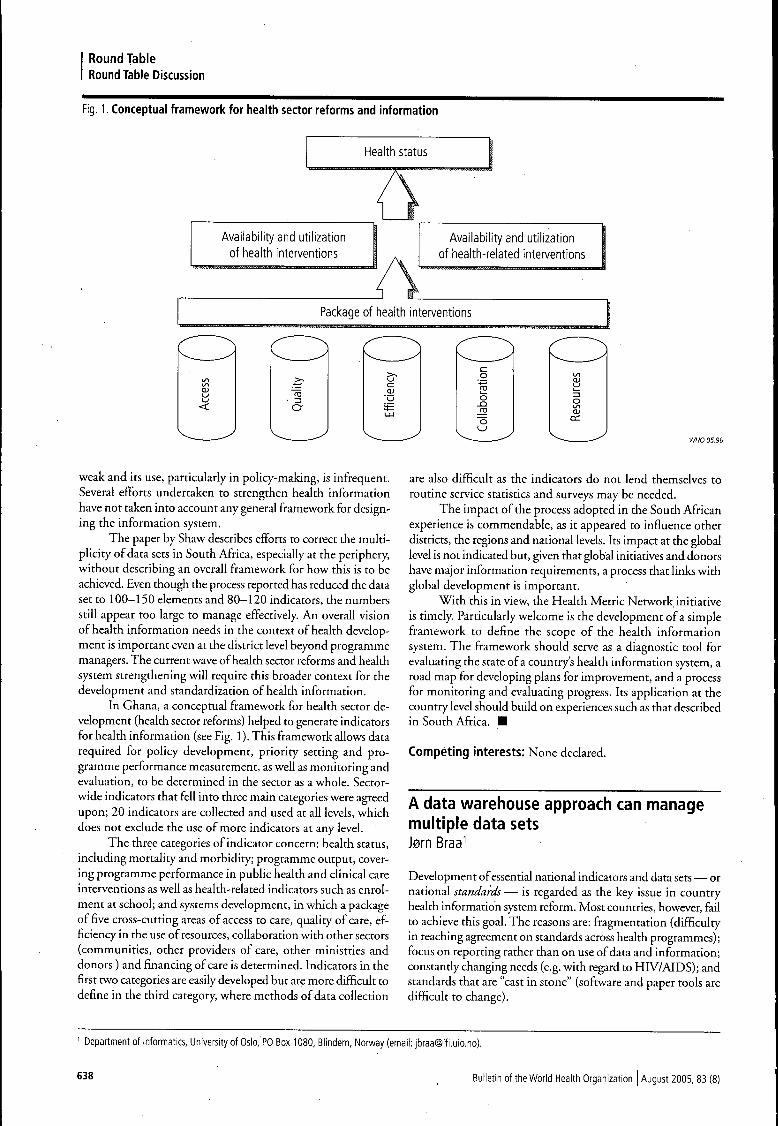
Round TableRound Table Discussion
Fig. 1. Conceptual framework for health sector reforms and information
Health status
Availability and utilizationof health interventions
Availability and utilizationof health-related interventions
Package of heaith interventions
"to
o-
weak and its use, particularly in policy-making, is infrequent.Several efforts undertaken to strengthen health informationhave not taken into account any general framework for design-ing the information system.
The paper by Shaw describes efforts to correct the multi-plicity of data sets in South Africa, especially at the periphery,without describing an overall framework for how this is to beachieved. Even though the process reported has reduced the dataset to 100-150 elements and 80-120 indicators, the numbersstill appear too large to manage effectively. An overall visionof health information needs in the context of health develop-ment is important even at the district level beyond programmemanagers. The current wave of health sector reforms and healthsystem strengthening will require this broader context for thedevelopment and standardization of health information.
In Ghana, a conceptual framework for health sector de-velopment (health sector reforms) helped to generate indicatorsfor health information (see Fig. 1). This framework allows datarequired for policy development, priority setting and pro-gramme performance measurement, as well as monitoring andevaluation, to be determined in the sector as a whole. Sector-wide indicators that fell into three main categories were agreedupon; 20 indicators are collected and used at all levels, whichdoes not exclude the use of more indicators at any level.
The three categories of indicator concern: health status,including mortality and morbidity; programme output, cover-ing programme performance in public health and clinical careinterventions as well as health-related indicators such as enrol-ment at school; and systems development, in which a packageof five cross-cutting areas of access to care, quality of care, ef-ficiency in the use of resources, collaboration with other sectors(communities, other providers of care, other ministries anddonors) and financing of care is determined. Indicators in thefirst two categories are easily developed but are more difficult todefine in the third category, where methods of data collection
are also difficult as the indicators do not lend themselves toroutine service statistics and surveys may be needed.
The impact of the process adopted in the South Africanexperience is commendable, as it appeared to influence otherdistricts, the regions and national levels. Its impact at the globallevel is not indicated but, given that global initiatives and donorshave major information requirements, a process that links withglobal development is important.
With this in view, the Health Metric Network initiativeis timely. Particularly welcome is the development of a simpleframework to define the scope of the health informationsystem. The framework should serve as a diagnostic tool forevaluating the state of a country's health information system, aroad map for developing plans for improvement, and a processfor monitoring and evaluating progress. Its application at thecountry level should build on experiences such as that describedin South Africa. I
Competing interests: None declared.
A data warehouse approach can managemultiple data setsJ0rn
Development of essential national indicators and data sets — ornational standards — is regarded as the key issue in countryhealth information system reform. Most countries, however, failto achieve this goal. The reasons are: fragmentation (difficultyin reaching agreement on standards across health programmes);focus on reporting rather than on use of data and information;constantly changing needs (e.g. with regard to HIV/AIDS); andstandards that are "cast in stone" (software and paper tools aredifficult to change).
Department of Informatics, University of Osio, PO Box 1080, Blindern, Norway (email: [email protected]).
638 Bulletin of the World Health Organization August 2005, 83

Round TableRound Table Discussion
Despite these problems, South Africa has managed todevelop national standards that are flexible enough to "absorb"local innovations and changes over time. The following pointsmay help to explain why this is so.• The "hierarchy of standards" ("information needs" in $haws
figure) has been a powerful tool to negotiate a balancebetween the national needs for control with the local (e.g.province or health programme) needs for flexibility or moredata. While all health units are required to collect and reportthe core national data, they are at the same time allowed tocollect their own additional data.
• Use of information is highlighted by linking data sets totargets and indicators.
• The flexible approach to standards following the hierarchymakes it easy to absorb and implement changes over time;there is no "final" data set. Local innovations are allowed forand may eventually be included in the national data set.
• The flexibility of the South African District Health Infor-mation System (DHIS) database application is crucial tomanaging the ever changing national and local data sets.Data elements, indicators and data sets are added, edited andmanaged by the health services themselves, thus making itpossible to manage multiple data sets at district level. This"data repository" or "warehouse" approach may be a key tohow the lessons from South Africa could be applied in othercountries.
Over the years, I have been involved in efforts to apply theSouth African lessons in many countries. It has not been easy.National health information system databases and reportingformats tend to be rigid and unable to respond to changes, thusleading to fragmentation of the system. The HIV/AIDS pro-grammes are currently aggravating this situation.
So what can be done? Current efforts to establish inte-grated data sets in contexts as different as Addis Ababa (Ethiopia),Botswana, Zanzibar (United Republic ofTanzania), AndhraPradesh (India) and Ho Chi Minh City (Viet Nam) may pro-vide some answers. Here data sets from all or most programmesare combined and streamlined by sorting out overlaps, gapsand inconsistencies. Following the South African district datawarehouse approach, the combined essential data set is thenfurther improved and reduced by focusing on the need-to-know indicators. Programme-specific software applications arelinked electronically to the DHIS, thus providing a shared datarepository. The objective of integrating all indicators relevantto the Millennium Development Goals has proven importantin building consensus.
Purists may argue that the data warehouse approach basedon flexible standards advocated here is violating the spirit of theSouth African minimum essential data set approach, by taking acombined — maximum — data set as the point of departure. Itmay, however, be the most appropriate way to apply the SouthAfrican indicator-driven approach in a situation increasinglydominated by strong programmes and multiple uncoordinateddata sets and software applications. •
Competing interests: none declared.
The data set must focus on service qualityJens Byskov^ & Oystein Evjen Olsen^
The paper by Vincent Shaw highlights some of the long awaitedpractical approaches to ensure relevance and use of health in-formation systems in developing countries. The South Africanexperience he recounts is very relevant as current "best prac-tice". It is a very important step forward in the simplificationand integration of programme areas and routine services intoa shared essential set of routine data. The cohesion of healthservices and the whole system will be much strengthened bysuch a shared data reference and information base.
The essential data are still to be selected by programmemanagers, however, even though the definition of the dataset emanated from the district level. It is not shown how thedata will be turned into useful information that will assist inplanning and monitoring at all levels of the health system. Theexamples taken from the nutrition programme and the Ex-panded Programme on Immunization only exemplify healthstatus (outcome) and service provision (output) data.
In the section on specific programme surveys, resourceand staff availability are mentioned as well as service quality.It is worrying that these are not shown to be included in anessential routine data set, as it is extremely important that anessential data set allows production and sharing of informationon health management. It is also not shown whether quality ofcare will be viewed from both provider and user perspectivesand whether user views on service priorities and other qualita-tive data are included.
In Shaw's figure, the column of information used by thenational level on a routine basis within the triangle of informa-tion should be seen as the core data on facility performance thatmust be shared in an accessible database for the whole healthservice and other parts of the health system, and be availablefor sharing with users and the public.
The information needs triangle could also be depictedas service quality at the bottom, supervision and coordinationneeds at the intermediate level, and policy needs at the top.The main focus of the data set must be on service quality, withless emphasis on supervision and coordination and even lesson policy. Service quality must relate to health management,service output and outcomes as viewed from both the providerand the user sides.
The number of data elements and indicators still seemsto be high in relation to similar elements in the core part ofthe health information system in other African countries andmay indicate a still limited degree of compromise and sharedfocus between the levels and programmes. A stronger emphasisis needed on the iterative nature of the health informationsystem, and not so much on annual or quarterly "reporting".We need to move away from a culture of reporting to a cultureof using the data for ourselves — facilities or districts first— on a continuous basis. Benchmarking and quality assuranceprocesses exemplify some useful frameworks for continuoususe of data. I
Competing interests: none declared.
DBL-lnstitute for Health Research and Development, Jaegersbcrg Alle 1D, Charlottenlund, DK-2920 Denmark (email: [email protected]). Correspondence should besent to this author.
• DBL-lnstitute for Health Research and Development, Primary Health Care Institute, Iringa, PO Box 105297, Dar es Salaam, United Republic ofTanzania{[email protected]).
Bulletin of the World Health Organization | August 2005, 83 (8) 639


APPENDIX 3
Jacucci, E., Shaw, V., & Braa, J. (2006). Standardization of Health Information Systems in
South Africa: The Challenge of Local Sustainability. Information Technology for
Development, 12( 3), 225-239.

Standardization of Health Information Systems inSouth Africa: The Challenge of Local Sustainability
Edoardo JacucciDepartment of Informatics, University of Oslo, PB 1080, Blindern N-0316, Oslo,Norway. E-mail: [email protected]
Vincent ShawDepartment of Informatics, University of Oslo, PB 1080, Blindern N-0316, Oslo,Norway; Health Information Systems Programme, School of Public Health,University of Western Cape, Cape Town, South Africa. E-mail: [email protected]
Jørn BraaDepartment of Informatics, University of Oslo, PB 1080, Blindern N-0316, Oslo,Norway. E-mail: [email protected]
ABSTRACT
The implementation and development of routine health information systems continue to provide anumber of challenges for managers—the more so in developing countries where resources are scarceand human resource and technical skills limited. This article conceptualizes the interdependencebetween the local adaptation and appropriation of global standards, and the value that this adds tothe global standard through improved quality of data. These processes reinforce one another in thecreation of sustainable information systems. The article draws upon a case study of a rural hospitalin South Africa. A successful change process is documented, wherein the organization, throughinnovative management and leadership, actively and successfully appropriated the national standard.The case study is used to highlight three main messages, namely, that standards should be able to belocally appropriated, that the creation of networks helps to support the local adaptation of standards,and that the layering of information systems is important to encourage the use of information andhelps to improve data quality. C© 2006Wiley Periodicals, Inc.
Keywords: standardization; district health information system; sustainability
1. INTRODUCTION
The implementation of routine health information systems in developing countries is widelyseen as critical for improving the quality of health services (Lippeveld, Sauerborn & Bodart,2000). By providing the management of the health sector with timely and accurate data,for instance, resources can be allocated more effectively and epidemics can be monitoredand appropriately addressed. In order to address the health system of an entire countryit becomes imperative to standardize the processes of data production and collection at
Shirin Madon was the accepting Special Issue Editor for this paper.
Information Technology for Development, Vol. 12 (3) 225–239 (2006) C© 2006Wiley Periodicals, Inc.Published online in Wiley InterScience (www.interscience.wiley.com). DOI: 10.1002/itdj.20044
225

226 JACUCCI, SHAW, AND BRAA
the various levels of the health sector. By standardizing the data set to be collected, allsorts of statistical analyses between facilities, districts, and provinces become possible. Al-though standardization is necessary to harmonize and integrate the information, the actualimplementation of a standard at the local level often demands flexibility and adaptation(Hanseth, Monteiro, & Hatling, 1996; Rolland & Monteiro, 2002; Timmermans & Berg,1997). Especially when considering implementation of Information Systems (IS) in devel-oping countries, issues of diversity and context dependency of the implementation sitesbecome extremely relevant (Avgerou, 2002; Avgerou & Walsham, 2000).
In South Africa the Health Information System Programme (HISP) addressed this chal-lenge by means of a particular standardization and implementation strategy: the creation ofa hierarchy of standards to allow flexibility, and particular attention to build “local capacity”(Braa & Hedberg, 2002; Shaw, 2002). Accordingly, a core set of essential health data isdefined and used at all levels (from the facility to the national level) and additional dataelements are added at each level to satisfy local management needs. The set of essentialdata and its hierarchy constitutes what can be called the standard. Once the standard is im-plemented, data quality in the entire system must be guaranteed to ensure its sustainability.Possibly, the best strategy is to make sure that the data are used at the level of collection. Inorder to obtain proper local use, the intervention should also build local capacity in termsof human resources, competencies, and infrastructural support. Hence, it can be argued thatthe sustainability of the “global” standard-based health IS is highly dependent on achievinga “local” sustainability of a local system that collects and reports the data.
Although larger hospitals tend to receive more attention due to the greater complexityof the intervention, smaller hospitals risk receiving less attention and being marginalizedin the process. In fact, rural and smaller hospitals are statistically less significant, usuallyhave less infrastructural support, and are less attractive for skilled workers. It also can beargued, although the opposite is demonstrated here, that information systems are not asimportant to run these small hospitals. This article tries to look deeper into the challengeof local sustainability in the particular case of small rural hospitals.
More in general, the following issues have been identified as main sources of problems inachieving the sustainability of IS in developing countries (Braa, Monteiro, & Sahay, 2004;Heeks & Baark, 1999; Littlejohns, Wyatt, & Garvican, 2003; Sanford, Kanga, & Ahmed,1994):
• Limited duration of donors’ financial support.• Inadequate focus on local expertise.• Too-narrow interventions (often a sustainable health information system requires a
parallel reform of the health sector).• Technical bias of projects (inadequate focus on human resource development).• Pilot project orientation.
The article contributes to the ongoing discussion on implementation of sustainable healthinformation systems in developing countries by better conceptualizing the role of localimplementation in the quest for global sustainability. Introducing the concept of localsustainability, will stress a necessary condition in order to achieve the sustainability of thewhole information system. The article will show how this concept addresses some of theabove-mentioned recognized challenges of sustainability.
By drawing on a success case of a small rural hospital, the article shows how localsustainability is not simply an equilibrium state to be reached. On the contrary, it will be
Information Technology for Development DOI: 10.1002/itdj

STANDARDIZATION OF HEALTH INFORMATION SYSTEMS IN SOUTH AFRICA 227
shown that sustainability at the local level means proactively appropriating what is imposedby the global standard in order to follow local vision and entrepreneurship.
The remainder of the article is structured as follows. First the current contribution to theongoing discussion on sustainability of information systems in developing countries willbe discussed. Then an account of the methodology for data collection, analysis, and theprocess of theorization will be provided. Subsequently, the case study will be described. Adiscussion of the main findings will follow, and the theoretical concept of local sustainabilitywill be derived from the empirical evidence. Finally, conclusions will be drawn.
2. LITERATURE REVIEW
The overall aim of the article is to contribute to the discussion on sustainability of infor-mation systems in developing countries by developing a theoretical concept. The followingsection will provide an account of the ongoing theoretical discussion in order to betterposition the current contribution.
2.1 Sustainability of IS in Developing Countries
Sustainable development was first defined as “. . . development that meets the needs ofthe present without compromising the ability of future generations to meet their ownneeds . . .” (Brundtland, 1987). This definition has been reinterpreted in the domain ofinformation systems to address challenges in the design and implementation of sustainableIT solutions (Korpela, Soriyan, Olufokunbi, & Mursi, 1998; Misund & Høiberg, 2003;Oyomno, 1996; Reynolds & Stinson, 1993). Within the IS field, other contributions ad-dressed the challenge of overcoming the sociotechno divide (Roode et al., 2004), anddiscussed the role of donors (Kimaro & Nhampossa, 2004).
Here the focus is on a particular aspect of establishing a sustainable national-standard–based health information system. The specific goal is to analyze the local (hospital) dimen-sion of creating a sustainable global (national) standardized system.
2.2 Sustainability and Standardization
If the implementation of the IS is not local but reaches a national dimension, standardizationof the data, the tools for data collection, and the organization around them become keyaspects. Especially in developing countries, IS implementation tends to be very sensitiveto local context (Avgerou & Walsham, 2000; Walsham, Symons, & Waema, 1988). Thisimplies that if the endeavor is one of developing the same idea (the standard) in manydifferent contexts, the challenge of sustainability tends to split on two levels: A globallevel where the standard should be accepted by processes of institutionalization, support,networking, and funding; and a local level where the standard needs to be implementedin a way that becomes well integrated in the local context. This creates a tension betweenthe local and global scale development of the information system (Braa & Hedberg, 2002).In terms of scalability of standards, the attempt to standardize across local contexts ismediated by the need for local flexibility of the standardized solution (Hanseth et al., 1996;Rolland & Monteiro, 2002). This is even more true in the case of standards for health care,where the local conditions and work practices tend to reinterpret, if possible, any universal
Information Technology for Development DOI: 10.1002/itdj

228 JACUCCI, SHAW, AND BRAA
solution as a localized solution, thus creating “local universalities” (Timmermanns & Berg,1997).
In the context of the case study, the standardization of data, data-collection tools, andorganization support was a necessary step to reduce the fragmentation of systems andchannels of information nationwide. The aim was to reach a degree of coordination atnational and provincial levels so as to improve efficiency of health management. It followsthat the “. . . local-scale development relies on development at the global scale . . . ,”because “. . . local health units are part of, and dependent on, the larger health system andwill therefore need to interact with the higher level health system by way of standards fordata collection . . . ” (Braa & Hedberg, 2002).
The problem then, of balancing the local and global, has been addressed by suggestingthat sustainability should be built “. . . through ongoing and continuous translations, aroundboth the vertical (local appropriation) and horizontal (diffusion) axes . . . ” (Braa et al., 2004).The concrete strategy suggested is to create an inherently flexible standard in the form ofa hierarchy of standards. A core standard, an essential data set, is decided at national leveland applied everywhere. At each lower level of the hierarchy (province, district, facility)the data set can be expanded to include other indicators, which will be collected in the levelbelow.
These strategies, which so far proved to be adequate, tend to address the tension betweenstandardization and flexibility and find a balance between the global and the local.
3. METHODOLOGY
This article uses an interpretive approach to case study for the research presented (Klein& Myers, 1999; Walsham, 1995). The interpretive approach has proven to be a suitablemethodology to study IS as social systems, where the aim is to investigate the intricaciesof social and technical aspects of IS development (Walsham, 1993). Moreover, case-studyresearch constitutes an adequate empirical enquiry that helps in investigating a contempo-rary phenomenon within its real-life context, where boundaries between the phenomenonand the context are not clearly evident, and in which multiple sources of evidence are used(Yin, 1989). Sources of data used during this research include interviews, direct and partic-ipant observation, physical artifacts (PC and software programs, such as the district healthinformation software and the budget spreadsheet, and the Excel ward register described inthe case section), and documentation.
Initially, a considerable amount of data were collected during the visit to eight hospitals inEastern Cape in the time span of 2 years (2003–2004): four district–rural, one district–urban,and three tertiary–urban. The hospitals approached were all experiencing evident problemsin collecting and reporting health data. The majority of the hospitals visited were situatedin rural areas in the Transkei region in the Eastern Cape Province. The data were collectedduring a total of 22 days of on-site fieldwork, which included interviews with hospitalstaff and observations of meetings and work performed by the HISP team. Hospital staffinterviewed included the hospital superintendent, matrons, nurses, the information officer,data-entry clerks, and, in some cases, doctors.
Preliminary analysis of data from the hospitals indicated that the data were of poorquality and not suitable for use by managers to inform their decision making. This raisedthe questions of how to build local capacity, and adopt a context-sensitive implementationstrategy of a national standard, that would ensure a sustainable HIS. It became clear at that
Information Technology for Development DOI: 10.1002/itdj

STANDARDIZATION OF HEALTH INFORMATION SYSTEMS IN SOUTH AFRICA 229
point that visiting a hospital that was submitting high-quality data could provide insightsand ideas on how to intervene in more problematic hospitals. New Hope1 was selectedfrom among a group of several hospitals in Eastern Cape with a “functioning” informationsystem. Its rurality and small size make it a suitable case-study example. The initial ideawas that it could be compared to a similar small hospital in a more rural area in the Transkei.
The first author spent 2 full days at the hospital conducting interviews with the hospitalmanager, the matron, the information officer, and nurses in the wards. During the same2 days he participated in the budget review meeting conducted by the budget reviewcommittee of the network of provincially aided hospitals (see case chapter). Notes weretaken during the observation and an interview session was recorded on minidisk (MD) andtranscribed afterwards.
An additional source of data specific to the case of New Hope Hospital was providedby the first author, who previously played a role in the establishment of the network ofprovincially aided hospitals and (at the time of the research) acted as manager of the HISPprogram in South Africa.
A diary, updated on a daily basis, served as a first step in the data collection and analysisand was used, together with the interview transcript, to build the empirical section presentedin the article.
As for the use of theory, the data presented in the article was collected with the aim ofunderstanding what sustainability meant for the hospital in the case study. Hence, if not atheoretical framework, at least the discourse on sustainability (as presented in the theorysection) served as initial guide to the field-work design and data collection.
Finally, the aim of this interpretive work (and type of contribution) is to generalize fromthe case by developing the theoretical concept of local sustainability in order to contributeto the discourse on sustainability of IS in developing countries (Walsham, 1995).
4. CASE DESCRIPTION
This section will present the case study. First some background information on the nation-wide health information system standardization program in South Africa will be provided.The information system analyzed in the case is a part of the South African standardizationprogram. This will be followed by a description of how the information system works atNew Hope hospital and how it was changed after the first implementation in 1999 as partof the standardization program. Finally, a preliminary analysis of contingent factors thatcontributed to the creation of a locally sustainable information system will be given.
4.1 The Quest for a National Standard for Routine Health Data in South Africa
As part of the Reconstruction and Development Program (African National Congress[ANC], 1994b) in South Africa an effort was launched for the restructuring of the healthsector in all provinces. This effort included the creation of a unified health informationsystem (HIS) (ANC, 1994a). The HISP (Health Information Systems Programme) initiativeaddressed the challenge in the Western Cape Province by defining an essential data set (EDS)of indicators and by developing a district health information software (DHIS) to supportdata collection, aggregation, and analysis at the district level. Eventually, the HISP initiative
1The real name of the hospital has been disguised.
Information Technology for Development DOI: 10.1002/itdj

230 JACUCCI, SHAW, AND BRAA
scaled up to the national level and the standardization process was carried out in the otherprovinces in a coordinated manner (Braa & Hedberg, 2002; Braa et al., 2004).
In the Eastern Cape Province the implementation of the DHIS and the EDS standard waslaunched in 1999. As part of the implementation, hospitals were provided with new formsand registers for data collection, computers, and the DHIS software. In addition, trainingsessions were organized for the hospital staff (Shaw, 2002).
An assessment of many hospitals in Eastern Cape in 1999 indicated that (Shaw, 2002):
• Data are collected “at all levels in hospitals, but most of it is never used.”• Indicators are submitted to the district offices, but give a “very bland picture of
administrative activities, and no feeling of what goes on inside hospitals.”• “Registers are non-standardized, and tend to be anarchic, and hand written,” and often
on an assortment of different types of paper and books.• “Analysis of data is minimal at all levels.”
4.2 Implementation at New Hope Rural Hospital
The following sections will provide an account of how a small rural hospital in the EasternCape Province managed to appropriate the standardized HIS in a successful and proactiveway.
4.2.1 Background. The New Hope Hospital is a small hospital of 25 beds in thenorthern area of the Eastern Cape. The town of New Hope was founded in 1800 and isreachable via a tar road.
The hospital is staffed with two part-time doctors (amounting to a full-time equivalentdoctor) and 40 staff (of which 20 are nurses) as well as a hospital manager, an administrationofficer, one information officer, and a clerk. The registers, the DHIS, and a computer wereinstalled during the DHIS rollout in Eastern Cape in 1999. The intervention put in place aninformation work flow complete with registers, forms, a computer, and the DHIS application(see Figure 1 for a simplified overview).
The ward registers are books where the nurses should enter the data about the patientsthat are admitted and discharged. There is one long line to fill for each patient and oftenthe fields (like the type of diagnosis or type of separation) simply require a tick (hence thename “tick register”). The midnight census is a form compiled by a nurse during the nightshift indicating the number of patients present in the hospital during the night. A wardreport is then compiled on a monthly basis. The data from the monthly ward reports arethen aggregated at the hospital level and then usually entered in the dedicated software: thedistrict health information software.
The hospital is one of a group of hospitals, called the provincially aided hospitals (here-after called the PAH network). They have been functioning as semiautonomous hospitals inthe Eastern Cape and other provinces for over 10 years. A service-level agreement (SLA)between the Eastern Cape Province and the hospitals defines their size (the number of beds)and the amount of financial aid. As part of the SLA, the hospitals are required to raise 10%of their budget through the provision of services to private patients, and the balance (whichis 90% of their total budget) is funded through the province.
In order to run and sustain the PAH network a budget review committee periodicallyassesses the budget and the routine health data, and provides recommendations to the
Information Technology for Development DOI: 10.1002/itdj

STANDARDIZATION OF HEALTH INFORMATION SYSTEMS IN SOUTH AFRICA 231
Figure 1 The work flow of information initially implemented by HISP in 1999.
managers of the hospital. To maintain the budgetary information, the hospitals are providedwith an Microsoft Excel application developed by the budget review committee with theaid of the provincial office—the budget spreadsheet.
4.2.2 The information system of the hospital—creativity and teamwork. Thesituation found in New Hope was surprising. The registers and the midnight census formprovided during the DHIS roll out were not in use. The staff in the hospital decided that thesewere too time consuming (especially for the nurses). Hence, the manager, the clerks, theadministration officer, the sisters, and the matron discussed what information they neededto collect and how, and designed new forms according to their needs. They developed theirown solution, which is now working (Figure 2), and provides data for the DHIS (which ismandatory) and for the staff in a manner more appropriate to their situation.
Interestingly and in contrast with basically all the other hospitals visited, they did notuse an admission/discharge register, nor a midnight census. They substituted two formscompiled daily. One is the daily statistical return, the other is the night head count. Thedaily statistical return lists all admissions/discharges of the day and is filled in by the sistersas the patient arrives or is discharged. At the end of the day the administration clerk does around of the wards, collects these forms, and copies each single entry into the ward registerspreadsheet (a replication of the ward register in Microsoft Excel). The nurses now have toenter very simple data compared to those required on the ward register. They also do notneed to calculate and compile the monthly reports. Overall, the nurses perceived that theiradministrative work was considerably eased.
The night head count is used by the sisters locally and provides a list of who is inthe beds in the wards. At the end of the month the information officer easily counts andcalculates the aggregated data from the ward register spreadsheet and enters them in theDHIS monthly report to be handed to the district information officer. At the same time
Information Technology for Development DOI: 10.1002/itdj

232 JACUCCI, SHAW, AND BRAA
Figure 2 The redesigned information work flow: Most of the registers are gone.
she updates several graphs depicting various monthly statistics, which were found hangingin the manager’s office. Examples of those statistics are: inpatient admissions, patientturnover, bed occupancy, theater activity (source of large costs), and number of private(paying) patients.
The observed reappropriation of the implemented standardized work flow was possibleprimarily because of the availability and teamwork of skilled and competent people. Theroles of both the hospital manager and of the information officer where key to the changeprocess: The manager had the vision of an improved local IS and the information officerhad the necessary competencies and computer skills to implement it.
The main results of the redesign are as follows:
• Nurses have less and simpler data to enter and no monthly report to compile; theyperceived that their administrative work was considerably eased.
• There is one less form—the midnight census is indeed redundant, as the same infor-mation can be calculated from the ward register spreadsheet.
• There are fewer steps in the work flow that require manual calculations and data entry;hence there is less possibility of creation and propagation of mistakes.
• As the ward registers are now replicated in the ward register spreadsheet, immedi-ate/daily analysis of data is possible.
• A drawback, however, is that the clerk or the information officer must be more skillfuland take on greater responsibility.
Observations have shown that the redesigned system still had considerable room for im-provement, because not all the computing capabilities of Microsoft Excel were exploited.The manager stressed that all this was possible only through good cooperation and team-work:“We try our best and we really work as a team. You can’t do anything if you don’thave the support of others. Then you can close down the hospital.”
Information Technology for Development DOI: 10.1002/itdj

STANDARDIZATION OF HEALTH INFORMATION SYSTEMS IN SOUTH AFRICA 233
What was surprising was that no external intervention, aid, or pressure played a role inthe vision and execution of the redesign. It was all possible with the given tools (by theDHIS rollout) and the local human resources.
4.2.2.1 Use of Information. As mentioned, graphs were regularly (on a monthly ba-sis) produced from the DHIS. When the manager was asked what she did with all thatinformation and the graphs, she replied that she used the data mainly to manage thehospital and as evidence to present during financial negotiations with the district healthadministration.
Looking at the graphs on the wall led the researchers to ask a more direct question:Researcher: What do you see from these graphs?Manager: [Looking at the in-patient admission statistics] The in-patient admission is a
lot. It shouldn’t be so many admissions at the same time. So I must go and look that doctorsdon’t just seek patients to admit them to set the stats high. Turnover tells me how quickthe patients move out; also the average days per patient that they don’t stay too long. Thatthey don’t stay longer than 5–6 days. Our bed occupancy is confronted also with the dailycosting from kitchen and cleaning.
[In the bed occupancy graph] 100% will be 25 beds. But we are using more.R: And the peak in the theater activity the end of last year?M: There was a problem with cesarean sections. We had a lot of problem births. This
other graph is to see how our private patients go because we need to make up our 10%[10% of the hospital budget must be privately funded by ‘private’ patients].
Looking at the complete picture of the information system in place in New Hope Hospital(Figure 3) shows that there are several end users of the information at local (ward) level,hospital, and district (or higher). Also, the three computerized components (the DHIS, theward register spreadsheet, and the budget spreadsheet) all play the central role of preparingand aggregating the data for the end users.
Generally, all the information is collected and used for a reason. There is no informa-tion collected but not reported or used, and the information channels are also sometimesintegrated (e.g., the budget-review information builds upon an indicator calculated with theDHIS).
4.2.2.2 Layering of Information Systems. A final element to note is the relationshipbetween the described hospital information systems and the budgetary system used in thePAH network. During the budget review session of this hospital, which was attended by theresearchers, the most relevant indicator that was used to evaluate the overall managementperformance was the cost-per-patient-day indicator. This indicator is created by dividingthe total costs of the hospital by the number of inpatient days. The number of inpatientdays is taken from the statistics created from the hospital information system (particularlyfrom the midnight census data) and entered in the DHIS. This indicator should be between350–400 ZAR per inpatient day.
It is worth noting that poor quality of the inpatient-days indicator reflects an underre-porting of the number of inpatient days. Hence, the more accurate the number of inpatientdays, the lower the cost per patient day, the better the indicated performance, and the betterthe outcome of the budget review.
The layering of one information system over another creates dependencies and forms ofincentives for keeping the quality of data accurate.
Information Technology for Development DOI: 10.1002/itdj

234 JACUCCI, SHAW, AND BRAA
Figure 3 The overall view of the information system at New Hope Hospital.
4.2.3 Analysis of contingent factors. This section will contain a preliminary anal-ysis of some themes that emerged from the fieldwork as being relevant for the positiveoutcome of the local redesign and change process.
There is no evidence to suggest that the training during the rollout of the DHIS was ofa better or worse quality at New Hope than it was for other hospitals of the same size.Nevertheless, it was clear that the manager and the administrative officer had sufficientcompetence to fill any possible gap. The information officer of the hospital implementedthe idea of replicating the ward register in Excel, so as to have continuous and accuratestatistics. This shows a probably above-average level of computer literacy compared to hercolleagues in other rural hospitals in Eastern Cape. The hospital organization acted as ateam, sharing knowledge and creativity. This is evidently the main source of knowledge,rather than the simple sum of the individual skills.
Moreover, teamwork also meant participation, so that the nurses could have their re-quirement of a lessened administrative workload fulfilled. Being part of the final solutionmade them motivated to sustain it. This kind of teamwork and leadership evidently keptthe motivation of the staff high.
The provincially aided hospitals (PAHs) are not financially advantaged compared toprovincial hospitals (who get 100% subsidy, and are not autonomous). In reality the costper patient day in the PAHs is less than that in the provincial hospitals. However, it appearsthat there is a caring ethos that has been created around being an employee of a PAH,that translates not only to care of patients but also to care of the environment. It therefore
Information Technology for Development DOI: 10.1002/itdj

STANDARDIZATION OF HEALTH INFORMATION SYSTEMS IN SOUTH AFRICA 235
appears as if these hospitals are financially advantaged, but in reality their ethos translatesto taking a greater interest in keeping the environment around them neat and tidy. Still, thehospital had to constantly negotiate with the district office to have their workload recognizedfinancially.
Finally, as mentioned, New Hope managed to become part of a wider network of provin-cially aided hospitals. As illustrated, the network sustains itself by means of mutual assess-ment and mentoring. In addition, the network can act as one actor for bigger argumentswith the province. In a way, the network helps the hospital to overcome its rural locationand risk of isolation.
5. DISCUSSION
In this section the data will be further analyzed to understand the factors that positivelycontributed to the reinvention and sustainability of the system. In the light of such factorsthe generalization will be taken one step further in order to conceptualize what localsustainability means and why it is relevant to achieve the overall sustainability of theglobal system.
5.1 What Can Be Learned from New Hope
5.1.1 Creating space to allow local innovation to ensure local relevance.Building local infrastructure and human resources (HR) capacity is certainly a key aspectfor a sustainable information system (Shaw, 2002). In New Hope Hospital this capacitymanifested itself by the manager displaying her rigorousness, willingness to improve thesituation, and determination to achieve the improvement. These skills were nourished by thePAH network, which met frequently (four times per year) and encouraged local innovationto improve care provided to patients. Her awareness of the importance of a participatoryapproach in the design of the new solution was probably the most important factor for thesuccess of the change process. In this sense her authority was used to lead the change,rather than simply as a means for control of bureaucratic activities. Certainly, without theskills of the information officer the changes probably would not have been so radical.
The characteristic that is most likely at the core of the success is the willingness to improveand to reflect upon and question the status quo. In this hospital, the status quo created bythe DHIS implementation was simply the starting point for a local reinterpretation of whatthat implementation meant. The people in the hospital managed to make a distinction that isnot always understood: the distinction between the means and the goal of the implementedstandardization. The actual standard (the essential data set, or EDS) is an abstract constructand constitutes the specific goal of the standardization process. The tools and the work-flow design provided are elements around the standard, but are not the goal. They are thesuggested means to achieve the specific goal of filling in the data sets with appropriatedata. These tools (registers, forms, and work flow) are provided as a start-up kit, where theinformation system is lacking or is too fragmented. But the hospitals are not really boundto them. In principle, they can arrange their own information system as they see fit, aslong as good-quality data are passed along (e.g., through an EDS). New Hope Hospital didnot fall into the easy trap of simply following the orders of the province in a bureaucraticway. Instead, with a bit of entrepreneurial spirit, they reorganized the system to meetthe goals of the province and their own as well. Here, the EDS and the DHIS, through
Information Technology for Development DOI: 10.1002/itdj

236 JACUCCI, SHAW, AND BRAA
their reflexive appropriation by the hospital, acted as enabling (i.e., not as constraining)factors.
Local adaptation of the standard is particularly important in obtaining adoption of thesystem, which is important to ensure long-term sustainability. Hospitals that have madethe procedure their own have an interest in seeing it work and in continuing to invest in thesystems and processes necessary to keep it working. In other hospitals, where there is lessinnovation, the system and tools are seen as coming from province and the product is forthe province. In this case there is little interest in whether the product (the data in the EDS)is good or bad, because it has little local relevance.
5.1.2 Networking against marginalization. Rural hospitals always run the risk ofbeing marginalized. Poor communication and transport, often together with poor socioe-conomic conditions, make hospitals in rural areas less attractive for skilled employees.In the worst case a vicious circle of demotivation and lack of teamwork between pro-fessions in the organization can send the hospital into a dangerous downward spiral.Although this phenomenon has been observed in one particular hospital in Transkei,2
it is certainly not the case at New Hope. But the risk is real, and should be takeninto account seriously when implementation in other small and rural hospitals is beingconsidered.
A possible counterstrategy to fight the risk of marginalization (whether real or potential) isbecoming part of an active network of similar hospitals. By becoming part of the provinciallyaided hospitals, New Hope Hospital escaped this risk, gaining advantage at least on twofronts: (1) the hospitals in the network mutually support and learn from each other, byfrequently monitoring and improving each other’s management performance and (2) thenetwork acts as an institutional amplifier of New Hope Hospital’s voice and needs.
5.1.3 Layering of information systems. A last aspect to emphasize is the relation-ship between the financial budget information system and the information system for healthdata.
As mentioned in the case section, the cost-per-inpatient-day indicator constitutes a clearexample of new possibilities opened by a working health information system: the better thehealth information system, the more accurate the inpatient-day indicator, the more accuratethe evaluation of the management performance (cost per inpatient day).
Thus the layering of health and budget information systems creates a double incentive:
• In order to have the budget review working, the health information system of thehospital must also be working.
• The more accurate the inpatient-day indicator, the lower the cost-per-inpatient-dayindicator (usually bad quality of the indicator reflects in an underreporting of inpatientdays), the better the performance indicator and the outcome of the budget review.
2In previous fieldwork the researchers visited several rural hospitals in the Transkei region. In one of them (thesmallest) it appeared that building a working information system was the least of the problems. The organizationwas under stress, the employees were demoralized, and there was very little teamwork between the variousprofessions.
Information Technology for Development DOI: 10.1002/itdj

STANDARDIZATION OF HEALTH INFORMATION SYSTEMS IN SOUTH AFRICA 237
5.2 What Does Local Sustainability Mean?
In this section the findings will be summarized, and then generalized by explaining themeaning and the role of the concept of local sustainability.
In the theory section, it was argued that the (global) sustainability of a standard-basedsystem is dependent on its use, which in turn is dependent on the quality of the informationreported. Apparently, the best strategy is to make sure that the data are used locally (atthe point where it is collected). This requires flexibility of the standard (to enable localadaptation and appropriation) and the establishment of local capacity (or unleashing thelocal potential) to maintain it.
What should be stressed is the perspective of the local site (in this case a small ruralhospital). What is clear from this case is that local use, local capacity building, and localappropriation of the standard are part of the same effort of locally achieving a sustainableinformation system.
But local sustainability is more than sum of these parts; it implies a shift of responsibilityfrom whatever hierarchical level above to the very people managing the data locally. Localsustainability is reached not simply when the data are collected and used properly, but whenthe local organization at the bottom of the hierarchy is also capable to proactively reinventthe standard by independent reflection on its own work.
In this sense, sustainability is not the reaching of a state of equilibrium; rather, it iscreated, reinvented, and continuously negotiated. All this implies a proactive engagementby the local authority in reappropriating (on its own terms and following its own visionwith entrepreneurship) what is imposed on it by the global authority.
These findings address the more general set of common problems of building a sustainablesystem. Issues that contribute to the lack of sustainable systems in developing countriesare listed in the introduction, and are addressed here. By creating the conditions for localsustainability:
• The implementation on the local level becomes less dependent on the limited durationof donors’ financial support.
• An increased focus on local expertise is facilitated.• Too-narrow interventions are not prevented. However, a precondition for local sus-
tainability is a dialectic relationship with a more general or global effort.• A more holistic (not purely technical) approach is forced which leads to leveraging
local innovative resources.
6. CONCLUSIONS
This article has addressed the challenge of creating a sustainable standard-based nationwidehealth information system. An analysis of how the quest for sustainability splits on a globaland a local level has been provided. On both levels sustainability needs to be created andmanaged, and each level is dependent on the other level. Hence, on the local level the mainchallenge faced by hospitals is to create a locally sustainable information system usingwhat is provided by the global standardization process as a starting point.
A case study has demonstrated how local sustainability is not simply a state to bereached. It is rather a continuous-change process where the local organization reflects uponand proactively reinterprets its own way of working.
Information Technology for Development DOI: 10.1002/itdj

238 JACUCCI, SHAW, AND BRAA
Finally, it has been shown that creating the condition for local sustainability is particularlyimportant for small rural hospitals in order to reduce their risk of being further marginalized.The case suggests that cultivating a sense of entrepreneurship, networking with othersimilar hospitals, and interlinking information systems within the hospital may be possiblestrategies to create local sustainability.
ACKNOWLEDGMENTS
This project has been funded by the Norwegian Research Council and organized by theUniversity of Oslo, Norway, and the University of Western Cape, South Africa. The authorswould like to thank all the people involved in the project who contributed to the researchwith enthusiasm and expertise. Special thanks go to the anonymous reviewers and the guesteditors for organizing an interesting conference and professionally editing this special issue.The authors are also deeply thankful for all the staff at the hospitals visited in the EasternCape for sharing their experiences and concerns. Particular thanks are due to the staff andmanagement of the “New Hope” hospital for their active participation in the project.
REFERENCES
African National Conference (ANC). (1994a). A national health plan for South Africa. Johannesburg:African National Congress.
ANC. (1994b). The reconstruction and development programme. Johannesburg: African NationalCongress.
Avgerou, C. (2002). Information systems and global diversity. Oxford, United Kingdom: OxfordUniversity Press.
Avgerou, C., & Walsham, G. (2000). Information technology in context: Studies from the perspectiveof developing countries. Hampshire, United Kingdom: Ashgate.
Braa, J., & Hedberg, C. (2002). The struggle for district-based health information systems in SouthAfrica. The Information Society, 18, 113–127.
Braa, J., Monteiro, E., & Sahay, S. (2004). Networks of action: Sustainable health information systemsacross developing countries. MIS Quarterly, 28, 337–362.
Brundtland, G. H. (Ed.). (1987). Our common future: The World Commission on Environment andDevelopment. Oxford, United Kingdom: Oxford University Press.
Hanseth, O., Monteiro, E., & Hatling, M. (1996). Developing information infrastructure: The tensionbetween standardization and flexibility. Science, Technology and Human Values, 21, 407–426.
Heeks, R., & Baark, E. (1999). Evaluation of donor funded technology projects in China (workingpaper). Manchester, United Kingdom: University of Manchester, Institute for Development Policyand Management (IDPM).
Kimaro, H. C., & Nhampossa, J. L. (2004). The challenges of sustainability of health informationsystems in developing countries: Comparative studies of Mozambique and Tanzania. In TimoLeino, Timo Saarinen, & Stefan Klein (Eds.), Proceedings of the 12th European Conference onInformation Systems, Turku, Finland.
Klein, H. K., & Myers, M. D. (1999). A set of principles for conducting and evaluating interpretivefield studies in information systems. MIS Quarterly, 23, 67–93.
Korpela, M., Soriyan, H. A., Olufokunbi, K. C., & Mursu, A. (1998). Blueprint for an African systemsdevelopment methodology: An action research project in the health sector. In C. Avgerou (Ed.),Implementation and evaluation of information systems in developing countries (pp. 173–285).Vienna: International Federation for Information Processing.
Lippeveld, T., Sauerborn, R., & Bodart, C. (2000). Design and implementation of health informationsystems. Geneva: World Health Organization.
Littlejohns, P., Wyatt, J. C., & Garvican, L. (2003). Evaluating computerized health informationsystems: Hard lessons still to be learnt. British Medical Journal, 26, 860–863.
Information Technology for Development DOI: 10.1002/itdj

STANDARDIZATION OF HEALTH INFORMATION SYSTEMS IN SOUTH AFRICA 239
Misund, G., & Høiberg, J. (2003). Sustainable information technology for global sustainability. DigitalEarth—Information Resources for Global Sustainability Symposium, Brno, Czech Republic.Retrieved August 2004, from http://www.ia.hiof.no/∼gunnarmi/omd/dig earth 03/
Oyomno, G. Z. (1996). Sustainability of governmental use of microcomputer-based informationtechnology in Kenya. In Mayuri Odedra-Straub (Ed.), Global IT & socio-economic development.Marietta, GA: Ivy League.
Reynolds, J., & Stinson, W. (1993). Sustainability analysis, primary health care advancement program.Bangkok, Thailand: Aga Kahn Foundation.
Rolland, K. H., & Monteiro, E. (2002). Balancing the local and the global in infrastructural informationsystems. The Information Society, 18, 87–100.
Roode, D., Speight, H., Pollock, M., & Webber, R. (2004). It’s not the digital divide—it’s the socio-techno divide. In Timo Leino, Timo Saarinen & Stefan Klein (Eds.), Proceedings of the 12thEuropean Conference on Information Systems, Turku, Finland.
Sanford, P., Kanga, G. J., & Ahmed, A. M. (1994). The management of health services in Tanzania:A plea for health sector reform. The International Journal of Health Planning and Management,9, 295–308.
Shaw, V. (2002). The development of an information system for district hospitals. In S. Krishna &S. Madon (Eds.), Proceedings of the 7th IFIP 9.4 Working Conference, Bangalore, India.
Timmermans, S., & Berg, M. (1997). Standardization in action: Achieving universalism and local-ization in medical protocols. Social Studies of Science, 27, 273–305.
Walsham, G. (1993). Interpreting information systems in organizations. New York: Wiley.Walsham, G. (1995). Interpretive case studies in IS research: Nature and method. European Journal
of Information Systems, 4, 74–81.Walsham, G., Symons, V., & Waema, T. (1988). Information systems as social systems: Implications
for developing countries. Information Technology for Development, 3.Yin, R. K. (1989). Case study research—Design and methods. Newbury Park, CA: Sage.
Edoardo Jacucci is a Research Fellow in the Department of Informatics at the University of Oslo,Norway.
Vincent Shaw is the Manager of the Health Information Systems Programme in South Africa.The Health Information Systems Programme (HISP) started as a local pilot project in three healthdistricts in the Western Cape in 1994–1998. It was a collaborative research-and-development effortbetween the University of the Western Cape, the University of Cape Town, the Norwegian ComputingCentre/University of Oslo, and the Western Cape Department of Health.
Jørn Braa is an Associate Professor in the Department of Informatics at the University of Oslo,Norway.
Information Technology for Development DOI: 10.1002/itdj


APPENDIX 4
Braa, J., O. Hanseth, et al. (2007). "Developing Health Information Systems in Developing
Countries - the flexible standards strategy." MIS Quarterly 31(2): 381-402.


Braa et al./Health Information Systems in Developing Countries
MIS Quarterly Vol. 31 No. 2, pp. 381-402/June 2007 381
SPECIAL ISSUE
DEVELOPING HEALTH INFORMATION SYSTEMS INDEVELOPING COUNTRIES: THE FLEXIBLESTANDARDS STRATEGY1
By: Jørn BraaDepartment of InformaticsUniversity of OsloPost-box 1080 Blindern0316 [email protected]
Ole HansethDepartment of InformaticsUniversity of OsloPost-box 1080 Blindern0316 [email protected]
Arthur HeywoodSchool of Public HealthUniversity of Western CapeDiemaaar Way KommetjieCape TownSOUTH [email protected]
1Dan Robey was the accepting senior editor for this paper. Gert-Jan deVreede was the associate editor. Brian Butler served as a reviewer. Twoadditional reviewers chose to remain anonymous.
Woinshet MohammedDepartment of InformaticsUniversity of Oslo and Addis Ababa UniversityPost-box 1080 Blindern0316 [email protected]
Vincent ShawDepartment of InformaticsUniversity of Oslo and University of
Western CapePost-box 1080 Blindern0316 [email protected]
Abstract
The development of appropriate integrated and scalableinformation systems in the health sector in developingcountries has been difficult to achieve, and is likely to remainelusive in the face of continued fragmented funding of healthprograms, particularly related to the HIV/AIDS epidemic. Inthis article, we propose a strategy for developing informationinfrastructures in general and in particular for the healthcare sector in developing countries. We use complexityscience to explain the challenges that need to be addressed,in particular the need for standards that can adapt to achanging health care environment, and propose the conceptof flexible standards as a key element in a sustainable infra-structure development strategy. Drawing on case material

Braa et al./Health Information Systems in Developing Countries
382 MIS Quarterly Vol. 31 No. 2/June 2007
from a number of developing countries, a case is built aroundthe use of flexible standards as attractors, arguing that if theyare well defined and simple, they will be able to adapt to thefrequent changes that are experienced in the complex healthenvironment. A number of paradoxes are highlighted as use-ful strategies, integrated independence being one thatencourages experimentation and heterogeneity to develop andshare innovative solutions while still conforming to simplestandards. The article provides theoretical concepts to sup-port standardization processes in complex systems, and tosuggest an approach to implement health standards indeveloping country settings that is sensitive to the localcontext, allows change to occur through small steps, andprovides a mechanism for scaling information systems.
Keywords: Health information systems, standards, com-plexity science, developing countries
Introduction
This article addresses the issue of strategies for developinginformation infrastructure standards in general and for thedevelopment of information systems support for the healthcare sector in developing countries in particular. We identifycomplexity as the main source of the challenges that suchstrategies need to address and propose the concept of flexiblestandards as a key element in a sustainable infrastructuredevelopment strategy. The article contributes theoreticalconcepts to support standardization processes in complexsystems, and suggests that the complexity of a standard isdetermined by its constituting actor network. We describe anapproach to development and implementation of health stan-dards in developing country settings that is both sensitive tothe local context and scalable across geographic and program-matic areas.
Poor health status, rampant diseases such as HIV/AIDS, andinadequate health services are seriously hampering human,social, and economic development in developing countries.Considerable efforts are currently being made by internationalaid and United Nations agencies to address these problems.The United Nations’ millennium development goals (MDGs)(UN 2000), which target the major health problems alongsideother key development issues related to poverty reduction,constitute a coordinating framework for these efforts.Appropriate health information systems (HIS) are seen ascrucial in this respect (AbouZahr and Boerma 2005; WHO2000). On the ground, however, HIS development in devel-oping countries has proved to be difficult due to organi-
zational complexity (Gladwin et al. 2003; Jayasuiriya 1999),fragmented and uncoordinated organizational structures allmaintaining their own HIS (Chilundo and Aanestad 2004;Jeppsson and Okuonzi 2000), unrealistic ambitions (Heeks2002), and more generally due to the problem of sustainability(Kimaro and Nhampossa 2005; Sahay et al. 2000).
The health care sector in a country consists of a large numberof institutions ranging from small and simple health carecenters up to large and technologically advanced hospitals.These institutions are managed by a number of overlappinginstitutional bodies, organized into geographic areas (district,province, nation), and according to vertical programs (HIV/AIDS, maternal health, vaccination) and services (primaryhealth care, hospitals, laboratories, drug supply). Programsare influenced at the national level through variousinternational donor organizations and the World HealthOrganization. While global and national health policiesnormally recommend local management and integration ofhealth information from various services and programs, thecurrent reality is very different. National health systems aretypically made up of a number of relatively independenthealth programs and services which, in the absence of centralstandards, each maintain their own vertical and uncoordinatedreporting systems. The lack of shared standards for datacollection means that the same data are often collected andreported many times through different structures, while at thesame time there are gaps where important data do not getreported. Inconsistencies in definitions and procedures createfurther fragmentation (Chilundo and Aanestad 2004; WHO1994) and lack of coordination, and inefficiencies. Thisresults in excessive data of poor quality and generally pooruse of it (Sandiford et al. 1992). The integration (de Kadt1989, WHO 2000) and coordination of HIS is consequentlya priority that needs to be addressed.
Fragmentation of HIS is aggravated further as donor fundingtargets specific areas and creates new information systemswhich are not integrated with the existing HIS (Okuonzi andMacrae 1995). The development of relatively cheap andeffective antiretroviral drugs to treat AIDS patients has led toambitious plans to roll out treatment to millions of people indeveloping countries, and multibillion dollar funds are raisedto implement these plans. This large-scale funding for HIV/AIDS is contributing to disintegration, leading the WHOHIV/AIDS department to state: “[1] There is an urgent needfor strategic information in conjunction with the antiretroviraltreatment [of AIDS patients] programmes, including thedeveloping of monitoring and evaluation systems….[2] Efforts should be made to integrate antiretroviral treatmentinto existing HIS run by governments....[3] Strengthening

Braa et al./Health Information Systems in Developing Countries
MIS Quarterly Vol 31 No. 2/June 2007 383
existing HIS in countries can be one of the positive exter-nalities produced by antiretroviral treatment programmes”(WHO 2003, p. 1, numbering added). Regarding standardiza-tion, [4] it is “urged that the monitoring and evaluation ofART [antiretroviral treatment] programs be simple, with datacollection limited to only that information deemed to beessential for the well functioning of programmes” (WHO2003, p. 3). However, [5] “The process of implementingART programmes is difficult and open-ended…goals andobjectives of therapy are varied and they have not yet beenagreed upon” (WHO 2003, p. 4). The end result has been thedevelopment of independent and often burdensome infor-mation systems for ART.
From the above, it is obvious that an integrated health infor-mation infrastructure is important in developing countries andthat such infrastructures need to be based on common stan-dards for information sharing and exchange between infor-mation systems, programs, and institutions. We use the terminformation infrastructure in its broader sense, meaning thetechnological and human components, networks, systems, andprocesses that contribute to the functioning of the healthinformation system. In developing countries in particular,access to the components of the infrastructure vary hugelybetween regions and geographic areas, resulting in inequitiesand uneven development of the infrastructure. These charac-teristics of information infrastructures in developing countriesadd to the complexity of developing integrated systems. Thequestion is, then, what is an appropriate strategy for devel-oping the required standards? This article suggests ap-proaches that allow the development of specialized, butintegrated, HIS, as expressed by these HIV/AIDS practi-tioners, through flexible standardization approaches that focuson simplicity and the essential needs for information.
At a first level, the challenge is to develop workable datastandards, then, at a second level, the interface between theexisting paper-based systems and the rapidly emergingcomputer-based infrastructure needs to be dealt with. Inparticular, ART programs are pushing implementation ofelectronic patient records that in many developing contexts,for the foreseeable future, will have to coexist with the paper-based patient record system. We will focus on the develop-ment of standards at two levels, at the technical level ofsoftware and at the service delivery level for data collectionand communication. Standardization is understood in termsof the definition by De Vries (2003) as
the activity of establishing and recording a limitedset of solutions to actual or potential matching prob-lems directed at benefits for the party or parties
involved balancing their needs and intending andexpecting that these solutions will be repeatedly orcontinuously used during a certain period by a sub-stantial number of the parties for whom they aremeant (p. 155).
The structure of this paper is as follows: In the theory andrelated research section, we explore complexity science as thepoint of departure for a framework within which to analyzeand discuss standardization in the health care sector. Themethodology section describes the study as a longitudinal,action research study, and explains the ontological andepistemological basis for the analysis. The empirical data arepresented in the fourth section and draw mainly on materialfrom the health information systems standardization experi-ences of the Health Information Systems Programme (HISP)group in South Africa, Ethiopia, and Thailand. In the discus-sion section, we highlight the key issues of flexible standardi-zation in developing country contexts. The final section pro-poses concrete guidelines for HIS standardization.
Theory and Related Research
We present our theoretical framework and related research,based on the main concepts from the emerging field ofComplexity Science, supplemented with insights and conceptsfrom the study of complexity within the social sciences andcomplex technologies or socio-technical systems.
Complexity Science
Over the last couple of decades, the field of ComplexityScience has emerged, primarily from the study of phenomenawithin physics, such as thermodynamics, and biology. Contri-butions are also made from studies of more social phenomena,in particular within economics, such as financial markets andthe issue addressed in this article, standardization (Arthur1994; David 1986). Complexity Science is made up of abroad range of disciplines including chaos theory and com-plex adaptive systems (CAS). CAS are concerned with thedynamics with which complex systems evolve throughadaptation.
CAS are made up of semiautonomous agents with the inherentability to change and adapt in response to other agents and tothe environment (Holland 1995). Agents can be grouped, oraggregated into meta-agents, and these can be part of a hier-archical arrangement of levels of agents. Agents can respond

Braa et al./Health Information Systems in Developing Countries
384 MIS Quarterly Vol. 31 No. 2/June 2007
to stimuli; they behave according to a set of rules (schema).Adaptation is the process whereby individual agents and theCAS change to fit each other and their environment. Adapta-tion, and creativity and innovation, are seen as being optimalat “the edge of chaos” (Stacey 1996), or more generally,adaptation occurs within the zone of complexity which islocated between the zone of stasis and the zone of chaos(Eoyang 1996; Wilson et al. 2001). Dooley (1996) suggeststhat CAS behave according to three principles: order is emer-gent, the system’s history is irreversible, and the system’sfuture is unpredictable. In particular, attention has beendirected at how order within such systems is created withouta “designer” but rather emerges, for instance, like the orderamong cells in an organism, molecules in a fluid or othermaterial, a beehive—or the emergence of a standard. Centralto the emergence of orders are attractors (i.e., a limited rangeof possible states within which the system stabilizes). Thesimplest attractor is a single point. There are also attractorswith specific shapes that are called strange attractors, that is,“unstable spaces to which the trajectory of dynamical systemsis attracted through millions of iterations” (Capra 1996).Orders emerge around attractors through various feedbackmechanisms, and through path-dependent processes of manysmall steps that may end in lock-in situations (David 1986).A de facto, or emergent, standard, such as MS Windows orQWERTY, is a typical example of an attractor. The use of“attractors for change” is recommended when seeking tobring about changes in areas where there is only moderatecertainty and agreement (Plsek and Wilson 2001).
Even though complex systems may acquire persistent struc-tures (around certain attractors), complex systems do evolve.The driving force behind such evolution and change isvariety, the fact that the agents populating the systems areheterogeneous and different and that they seek to adapt toeach other and their external environments.
Setting a new standard within this perspective means theactive creation of an attractor. We will discuss how to do thatby drawing upon some concepts from actor-network theory(ANT). Central in ANT, just like CAS, has been the emer-gence of order, or how actors succeed in their order-makingefforts. In this context, order means widely accepted scien-tific theories or working technologies. ANT describes order-making as the building of socio-technical networks whereelements of various kinds (technologies, humans, institutions,etc.) are translated (i.e., modified or reinterpreted) andenrolled into aligned actor-networks. Actors are also seen asheterogeneous networks (e.g., Callon 1991). Multiple actor-networks can be connected through so-called boundaryobjects (Star and Griesmer 1989), that is, objects which have
some meaning in common across networks and more specificmeanings within individual networks.
Complexity in Health Care andInformation Systems
As Complexity Science has gained momentum, its conceptsand insights are increasingly picked up in other disciplines,illustrated by special issues on complexity in journals such asOrganization Science, Theory, Culture & Society, andInformation Technology & People. Complexity Science isalso increasingly being applied in the area of health careorganizations (e.g., Plsek and Wilson 2001), and is adopted inInformation Systems and Organization/Management Studieswhere it is applied in a rather optimistic tone: complexsystems are best managed by enabling their self-organization(see, for instance, Axelrod and Cohen 1999; Benbya andMcKelvey 2006). While we agree that a new order cannot bedesigned and imposed on a complex system, we believe thatmore ambitious strategies, where a more active interventionistapproach is adopted, are needed in the domain we areaddressing. The HIV/AIDS pandemic together with thehuman resource crisis in the health sector in developingcountries make it clear that there is a desperate need to bringthe evolution of health care systems and their informationinfrastructures on a different trajectory than the current one.One way to do this, while not detracting from the ability of acomplex system to evolve as a self-organizing system, is tocreate an attractor that will lead to the emergence of a newand better order. At the center of this order will be a complexsystem of standards, crafted and maintained as a complexadaptive system where lock-ins are avoided. Scalability is identified as a basic requirement for successfulIS development in developing countries (Sahay and Walsham2005). Scale is referred to as the scope of an IS (how manyusers use the system), and scaling as the expansion of thesystem in scope and size (expanding the use of the systemacross geographical areas, as well as technical areas).Escalating complexity, increasing population and area to becovered, in particular in relation to available resources andinfrastructure, make scaling a tremendous challenge in devel-oping countries (Sahay and Walsham 2005). Scaling is alsoa central concern in complexity science:
Complex, adaptive systems exhibit coherencethrough scaling and self-similarity. Scaling is theproperty of complex systems in which one part ofthe system reproduces the same structure and pat-terns that appear in other parts of the system(Eoyang 1996, p. 36).

Braa et al./Health Information Systems in Developing Countries
MIS Quarterly Vol 31 No. 2/June 2007 385
Broccoli is used as an example of scaling in a natural systemas branches and subbranches have the same structure as thewhole plant (Eoyang 1996). Drawing on empirical data, wewill show how the development of simple standards cansupport the scaling process, while still encouraging diversityand experimentation (unlike the self-similarity of broccoli).
Standardization, Technology, andCreation of Attractors
Research on standardization acknowledges that the “world ofstandards” is rapidly changing—into a more complex one.The number of standards has increased substantially, and sohave the links between them (Romer 1990; Schmidt andWerle 1998). However, complexity theory has not yet beenapplied explicitly beyond the concepts primarily coming outof the economic research on standardization mentioned above.Among those interested in research on standardization, con-sensus emerges about the growing complexity related tostandards and standardization which implies that old modelsare not suited for current challenges. The bureaucratic modelsof standardization bodies make them all too slow, and variousconsortia models are becoming more popular (see David andShurmer 1996; Shapiro et al. 2001). The world is changingmore rapidly and standards need to be more flexible to adaptto this (Egyedi 2002; Hanseth et al. 1996). Hanseth et al.(1996) discuss two kinds of flexibility—use and changeflexibility—and argue that standards need both. Changeflexibility (the ability to change standards) is enabled bymodularization. That means, in this context, combiningsimple standards with gateways translating between them(Hanseth 2001), not only gateways between computer-basedinfrastructures, but also gateways integrating paper- andcomputer-based infrastructures, as has proved very useful forimproving the information systems in hospitals (Hanseth andLundberg 2001). Use flexibility determines the extent towhich a standard can support many different activities andtasks. Use flexibility makes it possible for users to change thepractices supported by the standard without changing thestandard.
This article will contribute to these strands of research byproposing a strategy for staging the emergence of newstandards, and will highlight the importance of ensuring thatthey are an adaptive system of standards. We see this as astrategy for change within complex and self-organized sys-tems. In particular, we see the importance of simple standardsas a component to assist the process of scaling IS in healthservices. We now turn to an explanation of the methodologyused in this research, before exploring the empirical data indetail.
Methodology
While this article draws on case material from experiences inthe development and assessment of health informationsystems in three specific countries (South Africa, Ethiopia,and Thailand), the authors are all involved in the broadernetwork of the Health Information Systems Programme(HISP) (Braa et al. 2004; see also www.hisp.info). As such,their experience has been gained from action research in alarge number of additional developing country contexts suchas Botswana, Cuba, India, Malawi, Mongolia, Tanzania, andVietnam.
The authors, and HISP, draw on the Scandinavian actionresearch tradition in IS development where user participation,evolutionary approaches, and prototyping are emphasized(Greenbaum and Kyng 1991). These perspectives havestrongly influenced the involvement and approaches followedin IS development and standardization in the countriesdiscussed in this article. Action research aims at generatingnew knowledge through taking part in the full cycle ofplanning, implementing, and analyzing the results fromconcrete interventions (Susman and Evered 1978). Whileaction research has been the major modus operandi ingenerating the empirical data presented in this article, con-textualism has been the ontological basis for the research.
Ontological Basis for the Study
Contextualism (Pettigrew 1985, 1987) emphasizes the impor-tance of the context–content–process axis. Four key aspectsof this view are highlighted, namely that the content, context,and process interact and influence one another; contextualismallows the exploration of the origins, development, and imple-mentation of organizational change. The study of organiza-tional change is described at the horizontal level—thesequential interconnectedness of phenomena across time(past, present, and future) and the vertical level (the inter-dependencies between the levels within and outside theorganization) (Pettigrew 1985, p. 64)—and the analysis ofchange within the organization requires analysis at multiplelevels, across time, and needs to incorporate cross-sectionalcategories. These aspects resonate with the approach adoptedby the HISP network, which has followed a contextualistapproach to information systems development, understandingand respecting historical influences (horizontal levels) as wellas the vertical influences (policy implementation, reportingrequirements) that have contributed to HIS development.
Pettigrew (1985) provides a description of the prerequisitesfor a contextualist analysis, and provides criteria for evalua-

Braa et al./Health Information Systems in Developing Countries
386 MIS Quarterly Vol. 31 No. 2/June 2007
tion of contextualist research. We have addressed these byproviding evidence in the case studies of longitudinal involve-ment in information systems development (in the SouthAfrican case study, more than 11 years), as well as depictingthe role of both vertical and horizontal influences in shapingthe aspects studied. The use of multiple cases allows us toreflect on the differences between the contexts, and the factorsthat have contributed to these differences.
Interpretive research methods (Walsham 1993) have beenused to make sense of the experiences, observations, andfindings of the researchers. The data analysis process can beseen as an integral component of the action research processof the HISP network. All of the authors have at variousstages taken on different roles, at times assuming the role ofresearchers, implementers, critical analysts, or a combinationof all three.
The selection of the three countries for this article is purpose-ful. We wanted to present success stories found in Thailandand South Africa, and Ethiopia, a country which, in terms ofpotential for HIS development, provided challenges in a moredifficult context. The selection of this range of cases providesfor interesting opportunities to contrast the contexts thatcontribute to information systems development.
Data Collection Methods
The authors have been involved in HIS research and develop-ment in South Africa since 1994 and in Ethiopia since 2003,as participants in the HISP project (Braa et al. 2004). Two ofthe authors are permanent residents in southern Africa andone in Ethiopia.
Data were drawn from a number of sources: diaries, notesand reports maintained by the researchers and students,annual reports, and statistical bulletins. Additional sources ofinformation included in-depth interviews with key informants,focus group discussions, and informal discussions, as well asfield visits and observations. Direct observation of staff atwork was a major source of information as authors workedwith the HISP country teams.
The data for Thailand was obtained through a study com-missioned by a development aid agency. The fact that theresearchers had previous knowledge of Ethiopia and SouthAfrica, but no knowledge about Thailand, led to differentapproaches to the data gathering. There was a focus on thenational level of the Ministry of Health, although every levelof the health system (subnational, district, and facility) wasvisited, including a relatively extensive tour of six key offices
at national level, other HIS-related organizations outside ofthe health system (universities, parastatal organizations, thenational statistics office), WHO, and site visits to two pro-vinces (Nan and Nonthamburi), four districts, five hospitals,and four clinics.
Case Study: The HISP Experience
This case study focuses on efforts to develop standards andinformation infrastructures in the HISP project. Emphasis ison South Africa where the HISP project started and where themost significant results have been achieved. We will focusfirst on the development of a new standard as the creation ofan attractor, and second on how this standard evolved into acomplex adaptive system of standards. Next we will brieflypresent experiences from other countries where HISP also hasbeen involved in order to contextualize the experience fromSouth Africa by illustrating variety among countries and thebroad range of issues and challenges that need to be ad-dressed. Then we present the case of Ethiopia, a vast andpoor country. Finally, we will present successful standardi-zation efforts in Thailand, a country where HISP has not beeninvolved, but which demonstrates useful experiences for theproposed approach. Table 1 presents statistical profiles of allthree countries.
South Africa
During the apartheid era in South Africa, health services werefragmented into 17 different services, separated according torace and the system of “homelands” for black South Africans.This resulted in extreme inequity between populations andracial groups in health services provision and health status.The health information reporting systems and the data stan-dards used were equally fragmented and incompatible. Withthe advent of democracy, “everybody” expected “everything”to change—including the health care system. Equity in healthservices provision and health status has, therefore, been amajor political target in post-apartheid South Africa. In orderto measure and monitor the extent to which equity isachieved, and to pinpoint areas where more resources andefforts are needed, a standardized system for collecting healthdata from the whole country and covering all populationgroups is seen as a necessity. This has to be achieved in acontext where extremes in terms of access to informationcommunication technologies exist. In the urban centers theinfrastructure is well developed, while in the rural areas manyhospitals and health centers lack a reliable electricity supplyand passable roads, let alone access to the Internet (Day andGray 2005).

Braa et al./Health Information Systems in Developing Countries
MIS Quarterly Vol 31 No. 2/June 2007 387
Table 1. Country Profile (Statistics from UNDP 2003)South Africa Thailand Ethiopia
Population 45.8 million 62 million 68.6 million
Area (sq. km) 1.2 million 513 thousand 1.1 million
Life Expectancy at birth (years) 45.7 69.3 42
Fertility rate 2.8 1.8 5.6
Prevalence of HIV (% of population aged 15-49) 15.6 1.5 4.4
Maternal mortality rate (per 100,000 births) 150* 44 870
Infant mortality rate (per 1,000 live births) 53 23 112.0
Under 5 mortality rate (per 1,000 children) 66 26 169.0
Human development index rank 111 74 169
Gross national income per capita (US $) 2,750 2,190 90*Data from Day and Gray (2005).
The process of standardization of health data has been a keyaspect of the process of reforming the HIS, and the healthsystem itself. However, achieving agreement on the standardshas not been an easy process as is described in detail below.
The Creation of an Attractor
What became the HISP project started in 1994 as a smallcollaborative research project between the University of CapeTown, the University of Western Cape, and a NorwegianPh.D. student. The aim was to provide health care workerswithin a poor township in Cape Town (Mitchell’s Plain) withbasic information to deliver better health services to the localpopulation (see Braa and Hedberg 2002). At the same time,several projects were initiated to address the problem of HISfragmentation. It was soon realized that the development ofa set of tools for local clinics and districts needed to be co-ordinated with activities at higher (provincial) levels, inparticular regarding data standards. In this case, the datastandard was a uniform set of data elements (a data set) withclear definitions, reported on by facilities, and which sensi-tively reflected the provision of health services. In order toreach consensus on data sets, widespread negotiation andconsultation with different health programs and services werecarried out in the Western Cape Province, and in May 1997,a first experimental minimal data set was implemented in allclinics in the two HISP pilot districts. In parallel with thenegotiations on data sets, HISP developed a desktop databaseapplication, the District Health Information Software (DHIS),for managing the data sets. DHIS was first developed as atypical action research experiment using rapid prototyping to
support the implementation of data standards in the pilot sites.Later, as the user base increased, the development of theDHIS has turned into an ongoing evolutionary software devel-opment project where experiments and prototyping are limitedto selected sites before new versions are released to all users(see Braa and Hedberg 2002).
In the negotiations about minimal data sets, it was difficult toget a real breakthrough because different programs had dif-ferent needs. In addition, since the health facilities belongedto different authorities, it was difficult to get agreement toimplement similar standards for data collection in theirrespective facilities. In the Cape Town area, for example,health services were organized either under the municipality(for citizens of the former “official” South Africa) or underthe Regional Services Council, (for the peri-urban blacktownships). In order to address equity, information systemsobviously had to be implemented across these structures.These problems were addressed by arguing, on the one hand,that since “it is not possible to agree on everything, we shouldagree on a basic minimum,” and on the other hand, thateverybody will continue to have the freedom to collect theadditional data they wanted. This principle was encapsulatedas a hierarchy of standards, and has been essential in arrivingat basic consensus during the standardization process in SouthAfrica (see Figure 1).
Finally, in January 1998, agreement was reached to imple-ment, in all health facilities in the Western Cape Province, theminimum data set of 47 data elements that had been pilotedand revised in the HISP pilot sites. Once implemented, thisdata set quickly became a success, basically for two reasons.

Braa et al./Health Information Systems in Developing Countries
388 MIS Quarterly Vol. 31 No. 2/June 2007
Health Facility & community level; clinic, health centre, hospital
District level; woreda, local government
Subnational level; province, region
National level; federal
International level
StandardData, Datasets,and Indicatorsfor each level
Community
District
Province
National
International
Patient level; or singular, local unit for not patient related data
Patient/Singular unit
Figure 1. Hierarchy of Data Standards Used in South Africa with the Patient Level Added
First, it was the first time uniform data had been collectedacross the different health services in the province, and,second, the implementation was supported by the DHISapplication which provided a coherent platform for data entryand processing, and presentation of data, as well as the abilityto easily accommodate the changes brought about by therestructuring of health services in post-apartheid South Africa.Where previously the segregation practices resulted inseparate information systems, the DHIS provided a completedata set on the desktops of both managers and health workers.In addition, the philosophy behind the development of theDHIS software, which emphasized the empowerment of usersat a local level to use information to manage their healthservices, was coherent with that of empowering disadvan-taged people in the “new” South Africa.
Almost simultaneously to these developments in the WesternCape, the Eastern Cape Province started to develop a differentdataset. The provincial government, supported by EQUITY,a large USAID funded project, had a strong interest in devel-oping data standards. However, they lacked a softwaresystem for data processing. In October 1998, HISP presentedthe achievements in the Western Cape, at which time the teamwas approached by the EQUITY manager who asked, “Areyou able to customize the DHIS, import the data from oursoftware, and implement it in all districts in the Eastern Capebefore December?” The answer proved to be “yes,” and theresulting implementation of internally uniform datasets in two
provinces was a major step forward in developing flexiblestandards in South Africa.
Although the two data sets differed, the important issue wasthat key data were comparable. For the first time, data hadbeen uniformly collected across black and white populationgroups, urban and rural areas, rich and poor, in two provincespreviously divided into black homelands, and “coloured” andwhite administrative areas. The achievement of simple, prac-tical results in two provinces sparked interest in other pro-vinces and at the national level. As a result, consensus wasachieved over a number of years on a national standard dataset (Shaw 2005).
At this stage, we can say that an attractor for a new order, anew set of standards, was created. The standards componentof this attractor consists of the two data sets defined andagreed upon in the two provinces (Eastern and WesternCape). What really made these data sets an attractor was thefact that collecting, sharing, and making decisions based onthese data was supported by a working software system, asoftware system that was in use in all districts in the EasternCape and in pilot districts and at the regional level in theWestern Cape Province. There are multiple reasons for theemergence of this attractor, among which is the fact thatdespite strong opposition to reducing the reporting require-ments to a minimum data set, the presence of a coherent dataset, and a functional tool to analyze the data, addressed an

Braa et al./Health Information Systems in Developing Countries
MIS Quarterly Vol 31 No. 2/June 2007 389
important need for managers. The attractor was created byenrolling users and their existing work practices, minimal datasets, a software package, and health care authorities plus someadditional components into a heterogeneous but aligned actornetwork. This occurred in a political climate that stronglysupported this change, and which drove donors and newlyappointed managers in the same direction.
Making a Set of Standards an Adaptive System
The collaboration between the Western and Eastern Capeprovinces initiated the countrywide standardization processwhich subsequently included all provinces and the nationallevel, and the first national essential data set was agreed uponin June 2000. While all provinces maintain their ownextended data sets, the national data set makes up the sharedcore which all provinces must collect and report. This dataset has been revised several times since then. At each revi-sion, the debate rages as to which data elements get includedand which do not get included. Over time, additional dataelements have been added, either as existing program datasets have expanded, or to accommodate new vertical pro-grams (e.g., HIV/AIDS programs). By 2005, it was expandedto become a national indicator dataset (NIDS), reflecting theincreased focus on the use of indicators, as compared to theearlier focus on data elements. The term indicator is used inpublic health to denote information, obtained from dataelements, which is used to measure the extent to which healthtargets are met (e.g., achieve an immunization coverage[indicator] of at least 80 percent [target]).
The tension over which indicators are included in the NIDSis constantly present, and is in fact never resolved. Thetypical pattern in the development of the NIDS has been thatnew data sets for selected vertical programs are initiallydeveloped as a separate data set, and collected and collated ina separate database within the DHIS software. This allowsexperimentation and fine-tuning to occur, often in selectedsites or specific geographic areas. Once the data elementshave stabilized, the data set (or a subset) gets included in theNIDS, and becomes part of the national reporting system.This has happened with the development of a hospital data setin the Eastern Cape Province, and with the development of anEmergency Medical Rescue Service data set for the country.
The response to the HIV/AIDS pandemic has resulted inservices being organized as separate vertical programs, withseparate funding, which is seen as a threat to the unificationof the health system. Different information systems aredeveloped and provinces are not bound to use a specificsystem. Reporting is limited to the NIDS, and although the
data may be collected through different systems, extracts aregenerally used for inclusion in the NIDS, using the DHIS asthe de facto national standard for data processing and colla-tion. Data on vertical programs such as the Prevention ofMother to Child Transmission (PMTCT) is thus uniformlycollected in all health facilities (in accordance with theNIDS), even though data at the patient level are managedthrough many different systems in various provinces andinstitutions.
As managers use information, and understand the meaning ofthe data elements and indicators, they start changing theirpractices and their information needs change. This isillustrated by the example in Exhibit 1.
Braa (2005) suggests that two important aspects havecontributed to the flexibility of the South African approach.First, the principle of the hierarchy of standards makes it easyto absorb and implement changes over time; there is no“final” data set in the sense that changes and experimentationare encouraged. Second, the flexibility of the DHIS softwaremakes it easy to technically manage the ever changingnational and local data sets.
Using Gateways to Accommodate Heterogeneity
Gateways translating data standards between the reportinglevels and horizontally between subsystems have beenimportant in the successful scaling of the standards in SouthAfrica. The gateways are of three general types: paper topaper (e.g., registers for primary registration of patient dataand aggregating monthly data sets), between paper andcomputer, and from computer to computer. The types ofgateways that are needed are changing rapidly. Electronicpatient record systems are increasingly used in hospitalsindicating that electronic gateways will be important in thefuture. Over the last 10 years, computer availability hasgradually moved down the hierarchy from district offices tohospitals and some health centers (mainly in large urbancenters). Increasingly the gateways between paper reportsfrom facilities and the DHIS is also moving down thehierarchy, as facilities enter their own data directly into thesoftware. However, this is happening at an uneven pacebetween rich and poor areas.
Summary of the South African Case
In a post-apartheid South Africa, an attractor was created (auniform data set, and the DHIS software to collate and ana-lyze the data) in response to the need for integration and

Braa et al./Health Information Systems in Developing Countries
390 MIS Quarterly Vol. 31 No. 2/June 2007
Exhibit 1. Debating the Value of Data Elements
The process of defining and redefining the data sets in South Africa did not take place overnight. It was a journey thatlasted years, and involved many iterations, as different role-players became involved. In some areas, there was intensedebate about the inclusion or otherwise of certain data elements. The data elements collected for the immunization programserve as a good example.
The Expanded Programme on Immunization (EPI) Directorate required reporting on nine data elements. Their informationrequirements were largely focused on the numbers of immunizations given, with little attention paid to the development ofindicators. On the other hand, one of the district municipalities in the Eastern Cape requested that the provincial data setbe revised, omitting two data elements, which they argued could be calculated from the other data elements. The reasonfor the change was to focus health workers on the most important data elements. The purpose of the immunization programwas not to count individual immunizations, but to have 90 percent of all infants “fully immunized” by the age of 1 year, hencethe request for the inclusion of the data element “fully immunized under 1 year.”
The counterargument provided by the province was that• national required the data in a specific format, and province was not in a position to adjust this• WHO required this data and therefore national was not in a position to change this• the numbers of immunizations given were needed in order to determine stock levels• the data set would be incomplete if this data was not submitted
Eventually it was resolved that the district council would carry on submitting the data required by province, and wouldcontinue to collect their new indicator (fully immunized under 1 year), but that the concerns would be raised at the nationallevel and that the request for a process for review would be tabled. It took 3 years before the adjusted data set wasaccepted nationally, and occurred only after it could be demonstrated how useful the new indicator has been. Trying tointroduce this data element in other countries has faced similar resistance, mainly because the WHO has not yetrecognized the value of this data element.
equity. For the first time managers, had access to useful andcurrent data. The success of this attracted more users, pro-vinces, and health care programs. Besides the investment inthe development of the technical parts of the informationinfrastructure, a huge investment went into training healthworkers in the 4,000 public health facilities spread across the9 provinces. This contributed to the development and accep-tance of the standards, and the creation of the attractors. Overtime and as the process unfolded, standards (i.e., minimal datasets) could be modified and extended as needs changed.Another set of standards has developed, being the emergenceof different gateways to communicate the information.During this process, the complexity of the system of standardsincreased, and the types of gateways in use has changed asaccess to infrastructure has improved. The adaptability of thesystem makes it easy to implement because it supportsexisting practices while its flexibility accommodates thetransformation of practices. These practices are radicallydifferent from the practices used under the apartheid regime,which were bureaucratic, centralized, and inflexible.
Accommodating the changes in the data standards has beenpossible because the individual standards have been simple
and accordingly flexible. They have been simple in the tech-nical sense that modifications have been easy to make. Justas important, they have been organizationally simple becauseeach has been limited in functional scope, and because eachactor has been free to increase this scope by adding their ownadditional data standards as allowed for by the hierarchy ofstandards. The conflicts involved have been limited. Otherstandards have been restricted to a limited domain (geo-graphic area), and, accordingly, the number of actors thatneeded to agree on modifications has been limited. Accom-modating a variety of standards within related domains hasincreased the breath of experiences gained and increased thespeed of learning and improved the overall informationinfrastructure as well as the health care system.
We believe that the South African experience can be con-sidered a best practice that others should try to adopt. But allcountries are so doing so is not a trivial matter. For instance,as demonstrated by many researchers mentioned above, com-plex socio-technical systems and their standards usually havestrong inertia. According to Hughes (1987), their trajectorycan only be changed in unique circumstances—during seriouscrises or external shocks. The regime change in South Africa

Braa et al./Health Information Systems in Developing Countries
MIS Quarterly Vol 31 No. 2/June 2007 391
was such a unique circumstance. In the next section we willdiscuss attempts at replicating this strategy in other countries,and use these experiences to propose a more generally validrecipe for best practice for IS standardization.
HISP Experiences in Other Countries
This section will briefly describe the main experiences gainedin some of the other countries in which HISP has been active,in order to highlight the variety of approaches and the variouschallenges met when trying to get started with bottom-upstandardization activities. These examples are provided in anattempt to illustrate the ways in which a bottom-up, andevolutionary, approach to standardization may be undertaken.
HISP has been active in Mozambique since 1998. Theachievements have been modest in terms of standards beingadopted. Implementation and testing in individual provinceshas been fraught with problems. One of the main reasons isthat the health care sector in Mozambique, as in the rest of thepublic sector, is highly centralized and HISP members havenot been able to convince the central health authorities toprovide strong support for a more experimental approach.
In India, HISP is established in two states, and in the state ofAndhra Pradesh significant results have been achieved. HISand health in general in India is organized in vertical pro-grams with little horizontal collaboration and integration.HISP has managed to develop standards within the Health andFamily Welfare program, a large program that includes verti-cal programs such as family planning, immunization, etc.Coordination among other programs and hospital services hasbeen difficult to achieve.
Vietnam has a similar fragmented structure with little inte-gration between program silos. Here it has nevertheless beenpossible to agree on the development of a shared data set forall data and indicators for one very specific purpose: tomeasure progress toward the United Nation’s millenniumdevelopment goals. This approach will eventually motivatea minimum data set approach similar to the one in SouthAfrica, although more limited.
In Botswana, because of a dysfunctional official HIS, eachhealth program developed their own independent standardsand systems. This created problems because only the “rich”programs managed to develop internally good systems, andthere was no coordination between program-specific stan-dards. In 2005, under strong managerial leadership in thehealth ministry, all program managers agreed to establish oneshared HIS by combining the different subsystems. Since all
data passes through the districts, the decision was to captureand include all program-specific data sets in one data ware-house, using the DHIS, at the district level. Programs at thenational level could then gain access to all data in the datawarehouse, including their own. This system is being pilotedin four districts. As a next step, inconsistencies within andbetween the data sets are to be addressed, and standardizationwill be achieved through a piecewise harmonization of thevarious data sets. This approach is in contrast to that adoptedin South Africa, where a minimalist data set approach wasadopted. In this case, a maximalist approach has beenadopted as a strategy to include all stakeholders by capturingall data across all programs in the shared data warehouse,with a view to streamlining and reducing it at a later stage.Since the essential data is included as subsets of the full datasets, the essential data will, as in South Africa, be madeavailable to all user groups.
These experiences illustrate the importance of an attractorwhich allows a standard to emerge, and the fact that it is notalways easy to do this. They also illustrate different ways inwhich an attractor may be created, although the commonpattern is the creation of an attractor as a solution to a veryspecific problem or objective. Once the initial problem issolved, the process of developing the information systemmoves naturally forward, to address the next problem, theattractor gaining momentum and support, and becoming anincreasingly important factor in the process.
The experiences from Mozambique show that in centralizedsystems, starting a standardization process through local,small-scale experiments is difficult if one is unable to con-vince (translate and enroll) central authorities. The positiveexperiences gained in other countries were obtained throughclose collaboration with central authorities. So while theactivities in South Africa started at the bottom of the system(clinics in townships, then province, and finally reaching thenational level), in other countries (Botswana, India at the statelevel) they started at the top. However, in these countries,activities have also followed a bottom-up strategy in the sensethat a single, limited issue was addressed (MDGs in Vietnam,pooling data in Botswana, etc.), in a pilot site (before beingscaled up), and an attractor was created by translating andenrolling human and nonhuman actors into a growing actor-network.
We will now explore more deeply HISP experiences inEthiopia to provide some richer illustrations of challenges andopportunities involved in the creation of an attractor thatbecomes a new standard in a country where existing struc-tures are not shaken up by radical change as occurred in SouthAfrica.

Braa et al./Health Information Systems in Developing Countries
392 MIS Quarterly Vol. 31 No. 2/June 2007
Ethiopia
Ethiopia is a federal republic, consisting of 11 relativelyindependent regions with borders drawn along widelyaccepted ethno-linguistic lines. The regions are divided intozones, which are divided into woredas (district, the basicadministrative unit in Ethiopia; there are 580 in all). Ethiopiais, even more than most developing countries, characterizedby stark contrasts and uneven development between rich andpoor and urban and rural areas, as well as between the capitaland the rest of the country.
The overall HIS in Ethiopia is poorly developed. Formats fordata collection have evolved over time as a result of decreesfrom the Ministry of Health (MoH) and from vertical programmanagers and agencies. When new reporting formats havebeen issued, the old often continue to be used since they are“owned” by a different agency, causing inconsistencies andduplication. The information unit at the MoH has tried tocreate some order by issuing an overall compilation ofrequired formats, but these efforts have not improved thesituation.
The government has recently initiated a fast-track implemen-tation of e-governance solutions supported by a project tonetwork all woredas in the country, with the health sector asone targeted area. The general assumption is that this willrequire one all-encompassing standardized system. As onekey actor at the federal level said, “We want to give thecontract to one company who will then be responsible foreverything, regardless of the costs.” This approach by acentral ministry is consistent with that found in many othercountries, and is in contrast to the South African case, and inthe experimental, bottom-up approach described for threeregions in Ethiopia (see below).
In an attempt to overcome the rigidity of the federal forms,different methods have been used at a regional level to collectregion-specific information. Some regions have printedrevised versions of the centrally defined forms to which theyhave added the additional data items to be collected, whileothers have used the centrally defined template and haveadded additional forms. In this way, each region has devel-oped its own distinct system of formats and procedures forcollecting, analyzing, using, and reporting data internallywithin the region and from the region to the federal level. Thede facto data standards at each level are thus defined by theunsystematic array of “hard-coded” paper forms that areactually in use. It is very difficult to change these standardsfor a number of reasons, including the lack of coordinationbetween programs, the absence of a strong vision for an inte-grated information system, and the difficulties in accessing
and communicating with all parts of this vast country, parti-cularly the more remote rural areas. In Exhibit 2 we highlightsome of these problems in a description of a federal workshopwith participants from four regions.
The problems highlighted demonstrate the top-down and all-inclusive approach to standardization common among minis-tries and central agencies. It also demonstrates the enormousvariety and heterogeneity of needs, interests, and opinionsamong stakeholders, and accordingly the challenges involvedin implementing such an approach.
HISP initiated activities in Ethiopia in early 2003. Initial ap-proaches to the federal level were rejected on the ground thatdevelopment and implementation of HIS would be carried outby their own experts, and that the ministry’s priority was thedevelopment of a national HMIS strategy. Subsequently theAddis Ababa Health Bureau (AAHB), which has the auton-omy to plan and execute its own development programs,accepted a proposal to utilize the DHIS software, mainlybecause the AAHB had difficulties with the existing paper-based HIS.
The HISP group, based at Addis Ababa University, developeda DHIS software prototype in parallel with a systematizationof the rather complex datasets. The prototype demonstratedinconsistencies and problems in the current reporting formats.While such inconsistencies had been known but not actedupon previously, the process of computerization made theseproblems more transparent and triggered action. The proto-type and findings were demonstrated at a workshop in March2004, attended by health workers and managers from theHealth Bureau, sub-cities, facilities, and some participantsfrom MoH. The health bureau decided on a city-wide projectand formed a committee to develop new standards andreporting formats. Subgroups reviewed the forms from eachprogram area and over the next 2 months all data formatswere revised and a set of uniform reporting formats wereagreed upon and compiled in a book.
Having agreed on integrated data sets, the database for cap-turing and managing this data was finalized, computers werepurchased, and the DHIS installed. Training and facilitationfollowed and a technician provided support across all sites.During 2004-2005, the information system was implementedin the 11 sub-cities, 5 city hospitals, and 23 larger healthcenters. Three city-wide workshops were conducted, eachresulting in a range of modifications. In July 2005, the resultsof the first full year of data reporting were assessed at a work-shop. The achievements were regarded as significant and, asa result, new programs such as pharmacies and drugs nowwanted to be included in the “unification” and standardizationprocess. Another area in which significant progress has been

Braa et al./Health Information Systems in Developing Countries
MIS Quarterly Vol 31 No. 2/June 2007 393
Exhibit 2. The Difficult Process of Gaining Agreement on a Uniform Integrated Dataset
A 3 day federal workshop was convened (July 2004) to address the key information needs of the health services. The ideawas to present a minimal indicator/data set that would provide a basis for developing the information system. This wasmeant to represent the information needs of a variety of programs, and would serve as the standard for reporting in theregion. However, the workshop did not agree on the suggested data set for a number of reasons.
1. Most participants, who were representing the range of vertical programs and services, didn’t find “their” data in theproposed data set. They all wanted the data for their vertical program to be included in the dataset, but this wouldhave violated the minimalist approach that was perceived to be the correct avenue to follow. The proposal lacked aconceptual framework in which such additional information needs could be accommodated, and thus the participantsfound the proposed data set was far too limited.
2. The workshop arrived at a consensus on the need to reduce the number of data elements, but not on where or howmuch to cut. Said one speaker, “Reporting diagnosed diseases on the ICD format represents the major burden. Sincethe facilities are not able to diagnose correctly using these codes, this reporting format needs to be reduced dras-tically.” Another responded that “reporting diseases using ICD is required internationally.“
3. Agreement was also not reached on which areas to include in the standardization process: “The HIV/AIDS pandemicwill have impact on the entire health system in Ethiopia and it is crucial that the reporting of HIV/AIDS data is includedin the federal system” (federal level HIV/AIDS coordinator). To this, someone responded, “The federal data standardswe are discussing here should be what is common for the 3500 health facilities in Ethiopia. The HIV/AIDS programsare so far only implemented in a few places. We cannot ask facilities to report on activities in which they are notinvolved. Besides, HIV/AIDS requires much more data than we can include here, and should therefore not be includedbut rather be part of a separate system.”
4. The necessity of having one standard system (one set of paper forms, one software system) was emphasized by afew speakers, whereas others strongly opposed this and stated that the regions as well as the programs needed tobe able to develop according to their own needs, but within the federal framework of data standards. There was,however, no shared understanding at the workshop as to how to best balance these opposite positions
5. The problem of being able to accommodate changes in an information system was raised by several participants: “Weare all the time being given new reporting requirements by the federal level. I am sure this will continue in the future.So what do we do when we have our new federal formats? Are they also going to be changed all the time? And howwill that be possible?”
made is in the implementation of the ART program forHIV/AIDS patients. In a recent development (2006), twoHISP team members together with two doctors have devel-oped and implemented a simple but effective, free and opensource electronic patient record system in the ART clinics oftwo hospitals. The reporting requirements for ART patientsare complex. It is a requirement that statistics provide theoutcome (regimen effectiveness) for every monthly cohort ofnew ART patients, which is increasingly difficult to managein a paper based system as each cohort needs to be monitoredfrom their starting date. By providing these reports at the“touch of a button,” the system gained instant success andwithin 2 months of its implementation has been requested byfour additional regions; an attractor is being created.
We see thus that in Addis Ababa, the electronic infrastructurereaches down to all administrative units, hospitals, and healthcenters, and even to electronic records for HIV/AIDS patients.This is in sharp contrast to the situation in other regions. Thestandards and database solution created in Addis Ababa havecreated strong interest in other regions and Addis AbabaUniversity has signed agreements to undertake similarprojects with four additional regions; an attractor is beingcreated here as well.
In the Oromia Region, the HIS reform process started aftersome key actors from the Oromia Health Bureau participatedin the workshop in Addis Ababa. This region is the largestand most populous region in Ethiopia. It comprises one-third

Braa et al./Health Information Systems in Developing Countries
394 MIS Quarterly Vol. 31 No. 2/June 2007
Addis Ababa Oromia BenishangulLevels
Region
Zone
Woreda(District)/Sub-city
HealthCenter
PatientRegistration
Legend Databaseimplemented
Database beingdeveloped
Paper reportingforms
Paper patientregistry/records
Dataflows
Addis AbabaAddis Ababa OromiaOromia BenishangulBenishangulLevels
Region
Zone
Woreda(District)/Sub-city
HealthCenter
PatientRegistration
Legend Databaseimplemented
Database beingdeveloped
Paper reportingforms
Paper patientregistry/records
Dataflows
Figure 2. Uneven Development of HIS Infrastructure Across Regions in Ethiopia (Simplified)
of the total surface area (bigger than Italy) with a populationof 25 million and 1,458 public and private health facilities.The major challenges in Oromia are the vastness of theregion, the poor infrastructure, and the lack of human capa-city. While drawing on the Addis Ababa experience in termsof the database development, the implementation process inthis region varies across the zones. In two zones, training oncomputer basics and the use of DHIS application has beenprovided and the database application has been implementedin some woredas. In the remaining zones, the plan is to firsttrain all zonal offices in the use of the DHIS database beforeextending to the woredas, which are in the deep rural areas.This strategy thus emphasizes horizontal extension across
zones, before gradually reaching down to the woreda level(vertical extension).
In the Benishangul-Gumuz Region, one of the poorestregions, stretching 2,000 kilometers along the borders ofSudan, and populated by several smaller ethnic groups, theHIS relies on a paper-based system of reporting up to theregional level for most zones (Mengiste 2005). Figure 2 high-lights the two important issues that emerge from this case:first, the use of gateways at different levels of the hierarchy,and the level of the gateway being influenced by access totechnology; and second, the different types of gateway in use,again depending on access to technology.

Braa et al./Health Information Systems in Developing Countries
MIS Quarterly Vol 31 No. 2/June 2007 395
In these three regions, we see how a federal structure withindependent regions facilitates variety, innovation, andregional standards—in our view a requirement for successfulhealth care infrastructure standardization and development.It is, however, necessary, as in South Africa, to developshared core national essential data sets in order to enablemonitoring of, for example, health status and health servicesdelivery across all regions and woredas in this vast country.The cases highlight the extreme heterogeneity found in devel-oping countries such as Ethiopia regarding user needs andhuman resources as well as the basic infrastructures requiredby a computer-based information infrastructure. The dif-ference in the implementation processes between regionsreflects the need to accommodate the unevenness betweenregions. Robust, flexible, and scalable approaches, wherepaper- and computer-based information infrastructuressmoothly interoperate and where the computer-based systemsgradually replace the paper based ones, are needed in contextslike this.
In the case of both the general HIS standardization and thespecialized solution for ART patients, we see that an attractorhas been created in Addis Ababa and thereafter spread toother regions, thus showing a similar pattern to the earlyphases of the standardization in South Africa. Furthermore,in both cases we see a bottom-up initiative that is increasinglygetting involved in national-level negotiations as the spreadof standards between regions needs to be compatible withnational policy. Despite initial conflicts related to the role ofregional bottom-up initiatives in the national standardizationprocess, an agreement has been reached between the HISPgroup and the MoH to cooperate in the national task force todevelop national HIS standards. In the case of the ART solu-tion, however, future developments are less certain as thereare multiple international and national actors involved—andsignificant funds.
We will now look briefly at experiences from a country thathas not been involved in the HISP project and which suc-cessfully built an information infrastructure for health. Theprocess used here will be contrasted to that used in the bestpractice case presented above.
Thailand
Thailand has a population of 64 million people and is dividedinto 75 provinces and 795 districts. The HIS in Thailand maybe regarded as a best practice among mid-income countriesand uses an extensive information and communication tech-nology infrastructure that reaches all districts. Data onindividual patients is captured electronically in most health
facilities and standard data sets are submitted upward throughthe system to the central level, from where feedback and keyinformation for the management of the health services isaccessible through the web (www.phdb.moph.go.th). Thehealth system works well, as indicated by the HIV/AIDSsituation. HIV prevalence has dropped from 4 percent in1990 to 1.3 percent in 2004, with the number of new infec-tions reducing from 43,000 to fewer than 20,000 per annum.Eighty thousand people are on ARV therapy, for under $300per year.
According to the 1997 constitution, every Thai has the rightto health care. From the inception of the universal coveragescheme in 2001, there was a tremendous push to improve dataquality in order to justify the decentralized distribution offunds based on capitation costs (paid per capita) for preven-tion and health promotion and for direct costs for hospital andhigh cost patient care. The National Health Insurance Schemehas established a system of contracting units (CUPs) in eachdistrict, consisting of a hospital and their network of clinics,which are then paid for the services they are renderingaccording to the data submitted. The actual payment, qualitycontrol, and accounting are decentralized to the provincelevel. The CUPs are provided with ICT network access andcomputers as part of their payment.
Two sets of standard national data are identified: one coverscommunity services and is made up of 18 subsets includingimmunization, family planning, disease surveillance, chronicdiseases, etc.; the other covers hospital services and consist of12 subsets including inpatients, outpatients, patient payment,referral, etc. Each of these 30 data subsets are specified as afile format to be sent to the national level as e-mail attach-ments.
Health facilities use various software applications for theprimary capture of data and report electronically to the CUPsusing Internet or USB memory sticks. Feedback from thecentral level and access to information is generally web-based, but numerous paper-based reports are also produced.As more and more districts get adequate web access, inter-change of data and information between local and centrallevels is increasingly robust and scaleable. As long as theprovinces report the required standard data sets and files, theprovinces are free to collect and process the additional infor-mation they need and can use the software of their choice.
While standard software applications have been distributed tothe CUPs for collating and transmitting the standard data files,a variety of other software applications have been developedin the provinces in order to pursue their particular informationneeds. Infrastructure and socio-economic conditions differ
Braa et al./Health Information Systems in Developing Countries
396 MIS Quarterly Vol. 31 No. 2/June 2007
between provinces and between cities such as Bangkok andthe rural areas. While freedom for local innovation enablesmore advanced provinces to develop solutions according totheir potential, less advanced provinces benefit from sharingsoftware solutions developed in other provinces. Standardsare regularly revised through an ongoing HIS developmentprogram that has broad participation from all of the main roleplayers in the process.
We see the approach to standardization followed in theimplementation of this highly successful information infra-structure as basically the same as the one in South Africa.The first version of the standard and the infrastructure wasbuilt in order to solve one very specific problem: the modelfor financing the health services. The data required for thispurpose turned out to be useful for other purposes as well.Based on user experiences and new needs, the infrastructureand standards have been extended and modified; it hasevolved as a complex adaptive system.
Discussion
The aim of this article is to suggest a strategy for developingflexible IS standards to improve the HIS in developing coun-tries. Using complexity theories to interpret the outcomes ofthe action research project, we propose a strategy whose twomain components are to create an attractor that emerges as anew standard and which evolves into a system of standards,and second, to suggest that the individual standards must becrafted in a manner which allows the whole complex systemof standards to be adaptive to the local context. Furthermore,the strategy is based on two principles, which we call theprinciple of flexible standards, and the principle of integratedindependence. This strategy, we argue, while being rathergeneral, is of particular importance when addressing the com-plexity caused by the uneven development of infrastructure indeveloping countries. We illustrate how this approach is sup-ported by obtaining rich information from minimal data, howradical change can be achieved through taking small steps,and how gateways and a focus on data standards (as opposedto technical standards) are the important components whenaiming at scaling national HIS in developing countries.
Creating Attractors
The real take-off for the South African pilot project cameabout when users were offered a simple software applicationto support a minimum data set. At this point, an attractor wascreated, which, through its success, enrolled additional users.
In the other countries where attractors have successfully beencreated, this has happened by pursuing a strategy to rallyscarce resources around solving a single specific, but largeproblem, shared by many. In Addis Ababa the problem wasa fragmented HIS, and the solution was to standardize thedata sets by solving incompatibilities and overlaps, estab-lishing a uniform infrastructure to collate data, and presentinginformation in the form of indicators. A similar solution inBotswana made data available to users by establishing aDHIS data warehouse at the district level. The successfulsolutions, consisting of software and data sets, have beensuccessful because they have been simple (easy to adopt;accommodate changes with ease) and have supported experi-mental development strategies. When users adopt the solu-tions, it demonstrates that systems are working properly seenboth from an organizational and technical perspective. Aworking solution providing benefits is indeed powerful in thesense that it attracts more users and other stakeholders. Thisis illustrated by the instant success of the simple solution tomanage ART for HIV/AIDS patients in Addis Ababa.
The cases demonstrate how this strategy might be adoptedwith success in different contexts. In principle, one caninitiate a top-down or a bottom-up approach and develop asolution in support of work tasks, provided user needs areaddressed. However, the cases as well as literature on HIS(AbouZahr and Boerma 2005; Shaw 2005) have shown thatin order to attract interest from both local and national actors,it is important to start with a focus on key priorities of thehealth services. The starting points (i.e., the initial problembeing addressed) will largely determine the next steps to betaken, and which actors should be enrolled. HIS standardshave national importance and the role and involvement ofhealth authorities will always be significant. However, as wehave illustrated above, governments in developing (as well asdeveloped) countries may easily become too ambitious intheir aim at developing uniform standards. In South Africa,this tension between local need for flexibility and the need forcentral control has been managed through the application ofthe hierarchy of standards (Figure 1), which dynamicallycombine flexibility as a right and adherence to the standardsof the level above as a duty (Jacucci et al. 2006). This isdiscussed below as the principle of integrated independence.
The Principle of Flexible Standards
A national HIS needs many interdependent standards—acomplex system of standards. Individual standards easilyarrive at lock-in states, which may result in the whole systembeing locked-in, a complex non-adaptive system. However,it is important to craft standards and their relations so that

Braa et al./Health Information Systems in Developing Countries
MIS Quarterly Vol 31 No. 2/June 2007 397
they emerge as a complex adaptive system that can adapt toa changing environment and thereby contribute to the sustain-ability of the HIS. That can only be achieved if the individualstandards adapt to the changing environment and each other,which can only be achieved if the standards themselves areflexible.
What makes a standard simple (or complex) is partially itstechnical complexity in terms of the number of elements. Butthe complexity of a standard is also determined by itsconstituting actor network (i.e., the data elements, the userpractices supported, the technological components imple-menting the standards, the people and organizations respon-sible for maintaining these components, the users of thestandard, standardization bodies involved, etc.) and the linksof various kinds between all of these actors. Simplicity andflexibility can be achieved by making these actor networkssmall and simple. That is partly achieved by definingindependent standards for different use domains and geo-graphical areas, and partly by limiting their functional scope.This mechanism decreases the technical complexity of thestandards but, more importantly, it also decreases the organi-zational complexity in terms of the use practices that need tobe analyzed and the organizational complexity required toinvolve all stakeholders.
Two forms of flexibility can be identified: use and changeflexibility (Hanseth et al. 1996). A standard’s total flexibilityis the sum of these two. Use flexibility refers to the ability touse a standard in a number of different environments, or fora number of different purposes. The “need to know” prin-ciple, which emphasizes the importance of collecting essentialinformation rather than “nice to know” information, is anexample of how use flexibility helps to get maximum infor-mation out of minimum data, that is, using existing dataelements in new combinations to address new informationneeds, rather than adding new data elements or reportingformats into the standard (see Exhibit 1). Change flexibility(and scalability) is achieved through the classical principle ofmodularization. This principle is crucial across all engi-neering disciplines; it should be no surprise that it also appliesto standards. Rather than one complex standard coveringeverything one should make several small and simple stan-dards and define simple interfaces—gateways—betweenthem. The DHIS software has become popular and gainedmomentum primarily because of its change flexibility. Dataelements and indicators are handled as individual components(records) and may be added, deleted, and edited by the user.The software also allows the data collection tools to be custo-mized to the need of the individual reporting unit, such as ahospital or health center. These functionalities have made itpossible to focus on the standardization process of the
individual data elements, allowing for differences betweenprovinces and use areas. In contrast, in other countries, as forexample India, it has proven very difficult to change the paperformats which are often “gazetted” and appear to be cast instone.
Standards should be modularized horizontally and vertically.Vertical modularization corresponds to traditional layering insoftware engineering where one layer offers services to thelayer above. Separate standards are defined at each layer.This principle is beautifully demonstrated by the seven-layeropen systems interconnection (OSI) protocol model. In ourcase, the separation of the data layer from the rest (thetechnical layers) has been found to be extremely important inorder to, on the one hand, identify the data that can be col-lected in the various health care institutions and, on the otherhand, transfer this data by available infrastructural services(electronic in some areas, physical in others).
Horizontal modularization means that rather than going forone “universal” standard for a domain, one makes severalstandards—one for each part of the domain—and interfacesare defined between them. The classical interface betweenstandards is a gateway, a piece of software that links togetherdifferent sub-infrastructures into an integrated one, by trans-lating between data representations, formats, and protocols.In the computer communication community, gateways havebeen regarded as an anomaly, something you need when youhave failed to achieve a shared standard (see, for instance,Stefferud 1994). In our view, gateways are just as importantas standards in order to build and maintain flexible andsuccessful infrastructures. We use the concept of gateways ina broader meaning, seeing them as boundary objects betweenactor-networks (Bowker and Star 1999; Star and Griesmer1989). Gateways, then, also include objects that link andtranslate between paper based and electronic infrastructures,or between incompatible electronic infrastructures. Theobjects representing such gateways will be hybrids (Latour1993), composed of humans, procedures, computers, andspecialized software.
The typical gateway in the cases of South Africa and Ethiopiais between paper and computers. This gateway consists of anumber of procedures for collating the paper forms receivedfrom the paper-based infrastructure and translating them tothe required electronic format so that it can be transmitted inthe electronic infrastructure. Gateways also include the pro-cedures for analyzing the data and producing different reports(i.e., from computer back to paper and the paper-basedinfrastructure), feedback to those who collect the data, andother stakeholders. The paper–computer gateways take manyforms and are rather complex in terms of people, procedures,and the paper- and computer-based tools involved.

Braa et al./Health Information Systems in Developing Countries
398 MIS Quarterly Vol. 31 No. 2/June 2007
Another gateway is that between electronic systems, theelectronic record systems for HIV/AIDS patients and theDHIS in Addis Ababa being a typical example. In this case,the relevant patient-related data elements are mapped to thecorresponding DHIS standards. The HIV/AIDS data is trans-lated into aggregated monthly data and provided in a formatappropriate for import into the DHIS. Similar gateways arein use in all districts in Thailand; in South Africa similargateways exist between the tuberculosis control program dataand the DHIS. These will become increasingly important inthe next few years, particularly in relation to HIV/AIDSpatients.
Without gateways we are trapped. We need to developinfrastructures based on single, universal standards, but incountries like Ethiopia this is impossible. In most other cases,universal standards are beyond our capacity or will be totallyinflexible if built. Establishing a fragmented infrastructurecomposed of a range of small ones which are not connectedis not a viable option. An appropriate blend of standards andgateways allows infrastructures to evolve by maintainingorder at the edge of chaos.
The Principle of Integrated Independence
According to Kumar and van Hillegersberg (2000, p. 23),“Integration has been the Holy Grail of MIS since the earlydays of computing in organizations.” With the diffusion ofthe Internet and other computer communication technologies,tighter and more integration has been enabled—anddemanded. Improved integration of information systems isalso at the center of the efforts presented in this article toenable smoother coordination and control of organizationalprocesses and health care delivery. But integration may causeless independence—and less flexibility. The case of SouthAfrica demonstrates that both integration and independenceof data standards have been achieved between provinces (i.e.,geographical areas) and health programs (i.e., functionalareas). A sort of integrated independence has emergedthrough the interaction between and within different sub-systems and the overall HIS environment. The way theseagents of the overall HIS in South Africa have negotiated,adapted, and changed follows the dynamics of independenceand interdependence of a complex adaptive system by com-bining simple and flexible standards and gateways. Whilethere has been no central control or linearity, the standardsdeveloped through the HIS-processes have been developedthrough conscious design efforts, although by a very hetero-geneous network of designers. In the South African case, a
large information systems development project that hasevolved over more than 10 years, the loose and flexiblecoupling between the evolving variety of designers andowners of the (sub)systems, such as the national level, pro-vinces, health programs and the HISP group, is a significantfeature.
We now summarize three key aspects that are linked to thisstrategy, namely rich information from minimal data, enablingradical change through small steps, and effective scaling ofhealth information systems in a complex environment.
Rich Information from Minimal Data
Flexible standards must, we have argued, be simple and easyto change and at the same time support a wide range of workpractices. One of the outcomes of applying this approach tothe data set standard is the finding that we can get rich infor-mation from minimal data. A focus on the must-know ratherthan nice-to-know information, as illustrated by the emphasison indicators and the minimal essential data set, can beextremely powerful in that it allows a simple, well-chosendata element to be used for several purposes. In addition, ex-isting data can often be used for new purposes by innovationin the development of indicators, rather than adding new ones.These initiatives can stimulate transformation and improve-ment of work practices without changing the standards.
Developing a minimal dataset can best be achieved by meansof the bottom-up approach to standardization, in combination(of course) with top-down implementation of best practices innew areas and micro–macro consultation and learning. Asshown in the South Africa case, that means that a very simpledraft data set is implemented. Based on user experience, onecan develop it so that a wide range of work practices aresupported without extending it or with minimal extensions.The data set is then extended only when this is absolutelynecessary. The traditional top-down approach to standardi-zation usually leads to huge sets of data where “need to have”has not been separated from “nice to have” data. And whilethese data sets have a huge array of data, often only a smallportion of the data is actually used meaningfully, negating thepurpose of having a large data set in the first place. Even if,as is described in the Botswana case, a shared data warehouseis developed, the long-term strategy is to integrate data setsand to make the essential data from each data set available toeverybody. By making the availability of both useless anduseful data transparent, the process toward the reduction ofeach data set by emphasizing “need to have” is initiated.

Braa et al./Health Information Systems in Developing Countries
MIS Quarterly Vol 31 No. 2/June 2007 399
Radical Change Through Small Steps
The strategies described in the cases are not just for standardsdevelopment, but also for radical change of complex systemswhether these are systems of standards, infrastructures, healthcare systems, or others. This interpretation of the strategyallows one to achieve radical change through small steps.
Radical change is often an aim when introducing IT solutionsinto organizations. In the days of business process reengi-neering, the recommendation was to design the new organi-zation and its ICT solutions together. That did not work inindustrialized countries, and it will not work in developingcountries, because it does not work in the world of complexsystems. Accordingly, new solutions, including standards,need to be designed so that they support existing practices andthen these practices can be modified incrementally. Thestandards need to be modified in parallel with the changes inpractice, by following the strategy and principles describedabove.
We have seen this approach used in the development of datastandards (the minimum data set in South Africa), and in thedevelopment of the DHIS software. What emerges throughthe analysis of this practice is the use of gateways as amechanism to effect changes in small steps that are appro-priate and synchronous with the process of infrastructuredevelopment. The use of gateways is thus in reality a set ofprocedural standards that accommodates change in smallsteps, but which can bring about radical change.
The change is radical in the sense that it brings about possi-bilities, and new ways of doing things, which previous prac-tices, and particularly the BPR (business process reengi-neering) style processes did not achieve. The advantage ofthis approach is that it is sensitive to the needs of a complexadaptive system, and allows the systems to interact and adaptas the changes are introduced.
Scaling Information Systems inDeveloping Countries
Heterogeneity, as illustrated through the uneven developmentof economy and infrastructure between and within regions, isa key characteristic of developing countries. One particularlyimportant requirement that we address through HIS standardi-zation is to achieve full data coverage within an area (district,province, country). This has been termed the dilemma of “allor nothing” (Braa et al. 2004), and is important when, for ex-ample, the aim is to address equity across population groupsin South Africa, or to implement the “health for all” insurance
scheme in Thailand. As discussed earlier, this problem areacan be analyzed within the framework of scaling. Using theself-similarity between branches and subbranches of abroccoli as a metaphor, CAS sees scaling as the replication ofthe similar in a network (Eoyang 1996). However, it is in thislatter perspective that the scaling of IS in developingcountries provides a stark contrast to the typical industrializedcountry where the “similar” infrastructure is relatively evenlydistributed. We demonstrated how in Ethiopia, the HIS hadto scale differently in the various regions.
We can summarize our experience in suggesting that there aretwo important strategies that need to be followed in order toscale information systems in this context. First, focus on datastandards and information rather than on technical standards.The focus in South Africa and Addis Ababa on essential dataand indicator sets is the case in point here. Second, acceptthat there will always be technically incompatible subsystems.Make them compatible in terms of data by building gatewaysbetween them. Scaling HIS in, for example, Ethiopia is alongone axis about replicating data standards and informationhandling procedures throughout the hierarchy of healthservices covering the country. While technical standardscannot be uniformly replicated across the uneven hetero-geneous infrastructure, data standards can be replicated.From a standards perspective, the focus needs to be on thecontent/message rather than the container/messenger. How-ever, along another axis, scaling of HIS in Ethiopia is aboutreplicating—establishing and maintaining—effective andseamless data flows which are appropriate throughout thecountry. The use of gateways helps us achieve this.
Conclusion
Many developing countries are currently engaged instrengthening their national HIS. This trend is reinforced bythe launch in 2005 of the Health Metrics Network, a globalinitiative to support such efforts, and which is supported byWHO, the European Union, and a number of internationalagencies (http://www.who.int/healthmetrics ). The challengeof coping with fragmentation, multiple data sources, and lackof standards is regarded as a key issue. An important contri-bution of this article is to provide a strategy to standardizeHIS and information infrastructures which are appropriate forthe context of developing countries.
In proposing a strategy for the development of informationinfrastructures for the health care sector, two issues related tocomplexity are of particular importance, and both are specificfor developing countries. First, there is uneven development

Braa et al./Health Information Systems in Developing Countries
400 MIS Quarterly Vol. 31 No. 2/June 2007
between rich urban and poor rural areas, characterized by theextreme differences in health service delivery and the avail-ability of basic infrastructure. Second, there is the importantrole played by vertical programs (like HIV/AIDS programs),funded and partly managed by international donor organiza-tions, in increasing complexity and HIS fragmentation.
Our strategy contains two main aspects. First, create anattractor by building an actor network. In our cases, wedescribe how the use of a simple set of data standards (inSouth Africa), a data warehouse (in Botswana), and a soft-ware program that made the data available to all user groupsaddressed a problem for a specific group of health workers.The creation of attractors enrolled and aligned a user group byproviding the users with benefits (i.e., the solution mustsupport existing work practices), and the standards were ableto accommodate changes as the user base expanded. Thecases also show that creating attractors in national priorityareas, such as equity in South Africa and the universal cover-age scheme in Thailand, are powerful attractors to drivechange at the national level. Similar attractors are required ata global level to address workable solutions in the informationsystems arena to support initiatives to combat the HIV/AIDSepidemic and the attainment of the MDGs.
The second aspect is to ensure that the emerging system ofstandards remain adaptive, a complex adaptive set of stan-dards. This is done through a number of mechanisms, in-cluding paying attention to use and change (modularization)flexibility, and the use of gateways to link different com-ponents/standards. Scaling of standards in developing coun-tries is enabled by flexible gateways between both computersand paper-based systems and between different computer-based systems and by emphasizing the data standards ratherthan the technical standards.
The limitations of this study relate to the fact that theprinciples discussed, and the proposed strategy, have emergedas reflections on processes in the various countries in whichHISP has operated. The applicability of these concepts needsto be tested outside the HISP network, and in differentcontexts, and as an explicit approach to strengthening infor-mation systems. The case studies used here reflect mainly oninitiatives in strengthening public health services; spacelimitations have restricted detailing experiences in forexample hospital information systems. Aspects requiringfurther research thus relate to the explicit use of theseapproaches as components of interventions in new contexts,and a reflection on how these principles can be applied, ordiffer, in hospital contexts, and in contexts outside of thehealth sector.
Acknowledgments
We wish to express our appreciation to health workers in the clinicsand health facilities, often in remote areas, working under extremepressure, and their managers in districts, regions, and ministries ofhealth, who have contributed to the development of these concepts.We hope that this paper will make a small contribution to improvingtheir lives as health workers. We also wish to thank the reviewers fortheir most helpful comments and suggestions for improvement.
References
AbouZahr, C., and Boerma, T. “Health Information Systems: theFoundations of Public Health,” Bulletin of the World HealthOrganisation (83:8), 2005, pp. 578-583.
Arthur, W. B. Increasing returns and Path Dependence in theEconomy, The University of Michigan Press, Ann Arbor, MI,1994.
Axelrod, R. M., and Cohen, M. D. Harnessing Complexity:Organizational Implications of a Scientific Frontier, Free Press,New York, 1999.
Benbya, H., and McKelvey, B. “Toward a Complexity Theory ofInformation Systems Development,” Information Technology &People (19:1), 2006, pp. 12-34.
Bowker, G. C., and Star, S. L. Sorting Things Out: Classificationand its Consequences, MIT Press, Cambridge, MA, 1999.
Braa, J. “A Data Warehouse Approach Can Manage Multiple DataSets,” Bulletin of the World Health Organisation (83:8), August2005, pp. 638-939.
Braa, J., and Hedberg, C. “The Struggle for District Based HealthInformation Systems in South Africa,” The Information Society(18), 2002, pp. 113-127.
Braa, J., Monteiro, E., and Sahay, S. “Networks of Action: Sustain-able Health Information Systems Across Developing Countries,”MIS Quarterly (28:3), 2004, pp. 337-362.
Callon, M. “Techno-Economic Networks and Irreversibility,” in ASociology of Monsters: Essays on Power, Technology and Domi-nation, J. Law (ed.), Routledge, London, 1991, pp. 132-161.
Capra F. The Web of Life: A New Scientific Understanding ofLiving Systems, Harper Collins, London, 1996
Chilundo, B., and Aanestad, M. “Negotiating Multiple Rationalitiesin the Process of Integrating the Information Systems of Disease-Specific Health Programmes,” Electronic Journal on InformationSystems in Developing Countries (20:2), 2004, pp. 1-28.
David, P. A. “Understanding the Economics of QWERTY: TheNecessity of History,” in Economic History and the ModernEconomist, W. N. Parker (ed.), Basil Blackwell, Oxford, UK,1986, pp. 30-49.
David, P. A., and Shurmer, M. “Formal Standards-Setting forGlobal Telecommunications and Information Services,” Telecom-munications Policy (20), 1996, pp. 789-815.
Day, C., and Gray, A. “Health and Related Indicators,” in SouthAfrican Health Review 2005, P. Ijumba and P. Barron (eds.),Health Systems Trust, Durban, South Africa, 2005.

Braa et al./Health Information Systems in Developing Countries
MIS Quarterly Vol 31 No. 2/June 2007 401
De Kadt E. “Making Health Policy Management Intersectoral:Issues of Information Analysis and Use in less DevelopedCountries,” Social Science and Medicine, (29), 1989, pp. 503–14.
De Vries, H. J. Standardization: A Business Approach to the Roleof National Standardization Organizations,” Kluwer AcademicPublishers, Boston, 2003.
Dooley, K. “Complex Adaptive Systems: A Nominal Definition,”unpublished paper, Arizona State University, October 1996(available online http://www.eas.asu.edu/~kdooley/casopdef.html; accessed October 2005).
Egyedi, T. M. “Standards Enhance System Flexibility? MappingCompatibility Strategies Onto Flexibility Objectives” in EASST2002 Conference: Responsibility Under Uncertainty, EuropeanAssociation for the Study of Science & Technology, Universityof York, York, UK, July 31-August 3, 2002.
Eoyang, G. “Complex? Yes! Adaptive? Well, Maybe...,”Interactions (3:1), 1996, pp. 31-37.
Gladwin, J., Dixon, R A., and Wilson, T. D. “Implementing a NewHealth Management Information System in Uganda,” HealthPolicy and Planning (18:2), 2003, pp. 214-224.
Greenbaum, J., and Kyng, M. (eds.). Design at Work, LawrenceErlbaum, Mahwah, NJ, 1991.
Hanseth, O. “Gateways—Just as Important as Standards. How theInternet Won the ‘Religious War’ about Standards in Scan-dinavia,” Knowledge Technology and Policy (14:3), Special Issueon IT Compatibility, 2001, pp. 71-89.
Hanseth, O., and Lundberg, N. “Designing Work Oriented Infra-structures.” Computer Supported Cooperative Work (10:3-4),2001, pp. 347-372.
Hanseth, O., and Monteiro, E. “Inscribing Behaviour in InformationInfrastructure Standards,” Accounting Management and Infor-mation Technology (7:4), 1997, pp. 183-211.
Hanseth, O., Monteiro, E., and Hatling, M. “Developing Informa-tion Infrastructure: The Tension Between Standardisation andFlexibility,” Science, Technology and Human Values (11:4),1996, pp. 407-426.
Heeks, R. “Failure, Success and Improvisation of InformationSystems Projects in Developing Countries,” The InformationSociety (18), 2002, pp. 101-112.
Holland, J. H. Hidden Order: How Adaptation Builds Complexity,Addison-Wesley, Reading, MA, 1995.
Hughes, T. P. “The Evolution of Large Technical Systems,” in TheSocial Construction of Technological Systems, W. E. Bijker, T.P. Hughes, and T. Pinch (eds.), MIT Press, Cambridge, MA,1987, pp. 51-82..
Jacucci, E., Shaw, V., and Braa, J. “Standardization of Health Infor-mation Systems in South Africa: The Challenge of LocalSustainability,” Information Technology for Development (12:3),Summer 2006, pp. 225-239.
Jayasuiriya R. “Managing Information Systems for Health Servicesin a Developing Country: A Case Study Using a ContextualistFramework,” International Journal of Information Management(19), 1999, pp. 335-349.
Jeppsson, A., and Okuonzi S. A. “Vertical or Holistic Decentrali-zation of the Health Sector? Experiences from Zambia and
Uganda,” International Journal of Health Planning and Manage-ment (15), 2000, pp. 273-289.
Kimaro, H. C., and Nhampossa, J. L. “Analyzing the Problem ofUnsustainable Health Information Systems in Less-DevelopedEconomies: Case Studies from Tanzania and Mozambique,”Information Technology for Development (11:3), 2005, pp.273-298.
Kumar, K., and Hillegersberg, J. V. “ERP Experiences and Evolu-tion: Introduction,” Communications of the ACM (43:4), 2000,pp. 22-26.
Latour, B. “We Have Never Been Modern,” Harvard UniversityPress, Cambridge, MA, 1993.
Mengiste, S. “Challenges and Opportunities of ImplementingDistrict-Based Health Information System in Ethiopia: A CaseStudy from Benishangul-Gumuz Region,” in Enhancing HumanResource Development through ICT. Proceedings of the IFIP 9.4on Enhancing Human Resource Development through ICT, A. O.Bada and A. Okanoye (eds.), Abuja, Nigeria, May 26-28, 2005,pp. 256-267.
Okuonzi, S. A., and Macrae, J. “Whose Policy Is it Anyway?International and National Influences on Health Policy Develop-ment in Uganda,” Health Policy and Planning, (10), 1995, pp.122-132.
Pettigrew, A. M. “Context and Action in the Transformation of theFirm,” Journal of Management Studies (24:6), 1987, pp. 649-670.
Pettigrew, A. M. “Contextualist Research: A Natural Way to LinkTheory and Practice,” in Doing Research that is Useful in Theoryand Practice, E. Lawler (ed.), Jossey-Bass, San Francisco, 1985,pp. 222-249.
Plsek, P. E., and Wilson, T. “Complexity Science: Complexity,Leadership, and Management in Health Care Organisations,”British Medical Journal (323), September 2001, pp. 746-749.
Romer, P. M. “Endogenous Technological Change,” The Journalof Political Economy (98), 1990, pp. 71-102.
Sahay, S., Miller, J., and Roode, D. (eds.). “Information Flows,Local Improvisations and Work Practices,” in Proceedings of theIFIP 9.4 Conference on Socio-Economic Impact of Computers inDeveloping Countries, Cape Town, South Africa, May 24-26,2000.
Sahay, S., and Walsham, G. “Scaling of Health Information Sys-tems in India: Challenges and Approaches,” in EnhancingHuman Resource Development through ICT. Proceedings of theIFIP 9.4 on Enhancing Human Resource Development throughICT, A. O. Bada and A. Okanoye (eds.), Abuja, Nigeria, May 26-28, 2005, pp. 41-52.
Sandiford, P., Annett, H., and Cibulskis, R. “What Can InformationSystems Do for Primary Health Care? An International Perspec-tive,” Social Science and Medicine (34:10), 1992, pp. 1077-1087.
Schmidt, S. K., and Werle R. Coordinating Technology: Studies inthe International Standardization of Telecommunications, MITPress, Cambridge, MA, 1998.
Shapiro, S., Richards, B., Rinow, M., and Schoechle, T. “HybridStandards Setting Solutions for Today’s Convergent Telecom-munication Market,” in Proceedings of the 2nd IEEE Conferenceon Standardization and Innovation in Information Technology,

Braa et al./Health Information Systems in Developing Countries
402 MIS Quarterly Vol. 31 No. 2/June 2007
E. J. Iversen (ed.), IEEE Computer Society Press, Los Alamitos,CA, 2001, pp. 348-351.
Shaw, V. “Health Information System Reform in South Africa:Developing an Essential Data Set,” Bulletin of the World HealthOrganisation (83), 2005, pp. 632-639.
Stacey, R. D. Complexity and Creativity in Organisations, Berrett-Koehler, San Francisco, 1996.
Star, S. L., and Griesemer, J. R. “Institutional Ecology, ‘Transla-tions’ and Boundary Objects: Amateurs and Professionals inBerkeley’s Museum of Vertebrate Zoology, 1907-39,” SocialStudies of Science (19:3), 1989, pp. 387-420
Stefferud, E. “Paradigms Lost,” Connexions, The InteroperabilityReport (8:1), 1994.
Susman, G., and Evered, R. “An Assessment of the ScientificMerits of Action Research,” Administrative Science Quarterly(23:4), 1978, pp. 582-603.
UN. United Nations Millennium Development Goals Declaration,United Nations General Assembly, New York, September 2000.
UNDP, Human Development Report 2003. “MillenniumDevelopment Goals: A Compact Among Nations to End HumanPoverty,” United Nations Development Programme, 2003(http://hdr.undp.org/reports/global/2003/).
Walsham, G. Interpreting Information Systems in Organisations,Wiley, Chichester, England, 1993.
WHO. Design and Implementation of Health Information Systems,World Health Organisation, Geneva, 2000.
WHO. Information Support for New Public Health Action at theDistrict Level, WHO Expert Committee report, World HealthOrganization, Technical Report Series No. 845, Geneva, 1994.
WHO. Report on the WHO/UNAIDS Workshop on StrategicInformation for Anti-Retroviral Therapy Programmes, Depart-ment of HIV/AIDS, World Health Organization, Geneva,June/July 2003.
Wilson, T., Holt, T., and Greenhalgh, T. “Complexity Science:Complexity and Clinical Care,” British Medical Journal (323),September 2001, pp. 685-688.
About the Authors
Jørn Braa is associate professor at the Department of Informatics,University of Oslo, Norway. He has been heavily involved in theestablishment and expansion of the HISP project for 10 years. Hisresearch interests focus on strategies and conditions for actionresearch, and health information systems in developing countries.
Ole Hanseth is Professor in the Department of Informatics, Univer-sity of Oslo. His research focuses mainly on the interplay betweensocial and technical issues in the development and use of large-scalenetworking applications. He is also visiting professor at theDepartment of Information Systems, London School of Economics.
Arthur Heywood is a medical doctor who has worked in healthinformation systems in a variety of developing countries around theworld, was a founder member of HISP and has particular interest inusing information for action to improve primary health care servicedelivery.
Woinshet Mohammed is a lecturer at the Department of Infor-mation Science, Addis Ababa University (AAU), Ethiopia.Currently, she is a Ph.D. student at the Department of Informatics,University of Oslo. Her research interests include informationsystems, database design, and implementation in general, and healthinformation system in particular.
Vincent Shaw is a medical doctor who has been involved in thedevelopment and support of health services in the Eastern CapeProvince of South Africa since mid-1999. He is currently a Ph.D.student at the Department of Informatics, University of Oslo. Hisresearch interests include district hospital information systems, andorganizational development.

APPENDIX 5
Shaw, V. (2007, 9 - 12 January 2007). Considering the Options for Hospital Management
Information Systems. Paper presented at the Helena 12th E-Health Conference, 2007,
Bamako, Mali.

� ���
������������� ���������������������������������������������
�
����������� ���
�������������������������������������������������� �������������
���������
�
��������� �� �� � ������ ����� � �� �������� ���������� �� ������ �������� ���� ������� ��
�������������������� ���������������������������� ��������� �����������������������������
����������������������������� �� ����� ��������� �� ��������������������� ���������� ����������
������ ����� ��� ���������� ������� ��� �� �������� ����� ��� ���� ����� ����� � �� � �����������
������������������������������������������������������������������������������������ ���
�� ���������������� ���� ������������������������������������������� ����������� ���� �����
����� �� � ������� ���� �� ��� ������������ ��� �������� ������ ��� �� �������� ���� ����� ����� ��
���������� ������� ��� �������� ����� � ��� �� �������� ������ ��� ������� �� �������� �� ������ ����
����������������������������!����� �� "���������� ������������������� �������������������
��#�� ���� ������� ��� ������� ������������ �� �� �� �������� ����������� ��� ���� � �� ���� �� ��
�� ��������� "�� ���� ����� ����� �� ������� $�������� ������ ��� ��� ������� ������ ���� �����
�������% �� ��������� ��������� ��� ��� ���� ���� ����� ��� ������������ ��� ��&���� ������� ����
������������ ���������� �����
�
���� � ��� �
���� ��� �����!���!����� ������!����������!��
����������������������������������������"��#������
������!����������� ������������������!�����
�����!����������������� �����������!���$���������
�����������������$��%���&'��������(��������� �������
��!!�����������������!!���������(�������
��()�����!��%*'������������������������������ ��
(�����(������������������ ������� �����������()
�����!��%+'��,!���!�������������!��������(������
��������������������������� ����������������������
�������������!����������!������������ �����
������������- ��(� .��������� ��(������������%/'��
,����������������������� ����������������0����
�����������������������������������!���������
��!��������������(�����������������������!�����
�����!��!���!���������%1'���
�
2�����������������!����������!������!��������
����������������������� ��������������$���������
�������������!��������345�����������(���
(�� ����������������������%6'���������������������
�������������������������������������������������%3��
7'���������������������������������������������������
���� ������������������!����������!�������������
������������ ��������������$����,����������������
��������������!����8��������������!�������
����������������������������������������������
(��� �������������$�����������������!�������
�����!�������������!� ��������������!���������
���� ����������������!�����������������������
�����
�
,����������������������!������$������������
�!���!����� ����������!� �!���������!�����
�����!�9:���;, <�����������������������������
=��������������������� ����������������������
�������������������;�����
��! �!����"#!��#!���$!��
,����������������������������� ��� ��������������
������������������������������������
�����!����������!���������!�������!����������
����������8��������������������->����.�������!�����
�����!������ �������������������(��!���������
- ����.��,���������������,?�����������������������
(�����������������������@����� �����A��������
�������� ��%�4'����������!� ���������������� ��
����������!����������������������������
�����!����������!�������������������������������
%��'���������������� ��8�����������������
�$��������������,�?���� ���������,�?�(����
�����!����������!���������������?�������������
������������������������������������!���������������
�������!������8�����������������������������
�����$����
�
,����!����������!����� ������������!�������
����������� ���8��������������������������� �
���(��!������������ ��������� ������������������
9����%�&���*'��������9�(��<�������������!����"�
������������ �������������!�������� ������
��������������������!����������������!�����
�����!�(��������������������������������?���������
������������������������������������$��9�������
�$�������������������!���������������������� ��
����������<��������� ����������������!�������
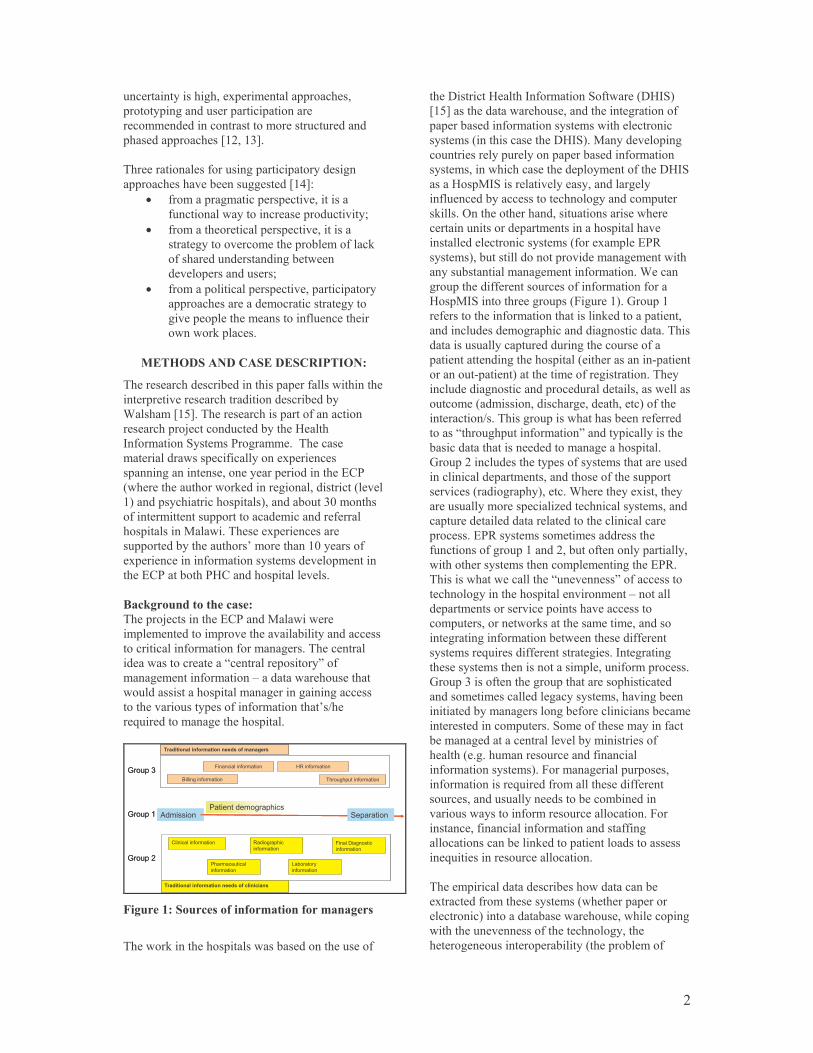
� &��
���������������� ����$����!���������������
���������� ������������������������
����!!��������������������!������������������
���������������%�&���*'���
�
?���������������������� ����������������� ��
�������������(������ ������%�+'B���
•� ���!���� !������������������������
������������������������������������C��
•� ���!���������������������������������
����� �����������!���������(��!������"�
�������������������� �(�������
�������������������C��
•� ���!������������������������������������
���������������!������������ �����
���������������!�����������������������
�������"��������
�!�� ��������!�!����#�� ��
?�����������������(��������������������������������
������������������������������������(���(��
����!�%�/'��?�����������������������������
�����������D��������������(������:�����
,����!����� ����!���� �!!����?�������
!���������������������������$����������
������ ����������������������������������=��
9�������������������"�������� ���������������9������
�<�����������������������<�����(����*4�!������
��������!���������������������!��������������
������������;�����?������$�������������
����������(������������A�!���������4���������
�$�����������������!����������!���������!�������
����=����(����:���������������������
�
%��&��'������������
?������D������������=�����;���������
�!���!����������!�������������(���������������
����������������!���������!� �����?����������
�����������������-�����������������.����
!� �!���������!�����E������������������
���������������������!� ������ ���� �������
����������������������������!��������A�F���
��0���������!� ����������������
�
����������������� ����������
��������
�������
��������
���������������������� �������������
����������������
��������
��������������
��������
�������� ��������������������������
���������������� �����������������
���������������������� ��������� ��
������������������ � ���������
���!
���"
���#
����������������� ����������
��������
�������
��������
���������������������� �������������
����������������
��������
��������������
��������
�������� ��������������������������
���������������� �����������������
���������������������� ��������� ��
������������������ � ���������
���!
���"
���#
�
(�'��)���'���������������������������
�
?������"��������������������(������������������
�������������:�����,����!����� �������9�:, <�
%�/'������������������������������� ���������
�����(���������!����������!������������������
�����!��9�����������������:, <��;������������ �
������������������������������(���������!�����
�����!��������������������������!������������:, �
���:���;, ������������������������ ����
�����������(������������������� �������!������
�"���������������������������������������������
���������������������!���������������������
�������������������������!��9�����$!����=G�
�����!�<��(������������������������!� �!���������
�����(�������!� �!���������!������������
�����������������������������������!����������
:���;, ������������ ������9#� �����<��H�������
�������������������!���������������"���������������
��������������!� ����������� �����������?����
�������������������������� ����������������
�������������� �������������9�������������)�������
��������)������<���������!������� ����������?����
���������� �������������������������������������
�����!��9�!�������������� ������������<��������
����������F���?���� ���������������(�������������
�����-����� ����������!����.��������������������
(������������������������!� ������������
H�����&����������������������������!��������������
����������������!������������������������������
���������9���� ����<�������������������$����������
����������!�����������8�����������������!������
��������������������������������������������
���������=G������!����!���!��������������
������������� ����������&��(�����������������������
����������������!���������!���!����� �����=G��
?����������������������-����������.�������������
�������� ������������������������!����E��������
�����!������������������������������������
��!�����������������"���������!����!���������
���� ���� ������!�����(�����������������������
�����!����0��������������������� �����,��� ���� �
�����������!�����������������!�����������!����������
H�����*�������������� �������������������������
�����!���!����������� ��������!������� �(����
���������(��!� ������� �(����������������(��!��
����������������!�������� �!�����������!���������
(��!� �������������������(��!�������������
������9�� ����!����������������������
�����!����������!�<��#���!� ���������������
�����!����������0���������!��������������������
����������������������������(����!(��������
�������������������!��������������������#���
����������������������!�������������� �
�������������(�����"���������������������������
���0������������������������������
�
?����!����������������(�������������(��
�$����������!������������!��9����������������
����������<���������(������������������������ �
����������������������������������� �������
������ ����������������(������9�������(��!����
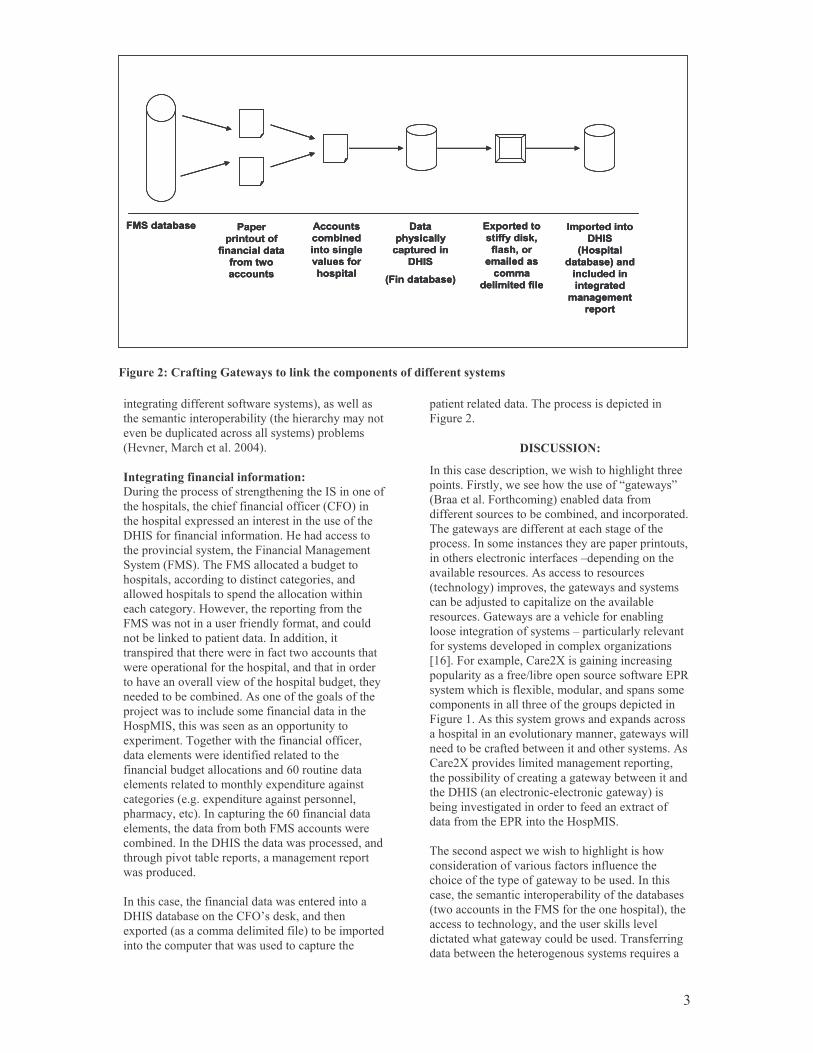
� *��
���������� ��� �
����������
������������
�������
��������
��������
������ �
��������
��� ����
�������
����
��������
������ ���
����
���������� !
"#���� ���
������ ���$%
����%��
��� ���
�����
� ���� ���
������ �����
����
�������
������� !���
����� ���
��� ���� �
����� � ��
� ����
���������� ��� �
����������
������������
�������
��������
��������
������ �
��������
��� ����
�������
����
��������
������ ���
����
���������� !
"#���� ���
������ ���$%
����%��
��� ���
�����
� ���� ���
������ �����
����
�������
������� !���
����� ���
��� ���� �
����� � ��
� ����
���������� ��� �
����������
������������
�������
��������
��������
������ �
��������
��� ����
�������
����
��������
������ ���
����
���������� !
"#���� ���
������ ���$%
����%��
��� ���
�����
� ���� ���
������ �����
����
�������
������� !���
����� ���
��� ���� �
����� � ��
� ����
(�'��*��������+���,��������&�������������������������������
���� ���� ������������������������!�<�����������
������!��������������(������9�������������!������
�����(��������������������������!�<����(��!��
9:�������;����������&44+<���
�
������������������������������
����� ��������������������� ������ �����, �����������
����������������������������������������9�#�<����
�������������$�������������������������������������
�:, ������������������!������:��������������
�������������������!������#�������;� �!����
����!�9#; <��?���#; ����������(�� ������
����������������� ���������������� ����������
���������������������������������������������
������� �����:�������������������� ����!�����
#; �����������������������������!������������
����(�����"�����������������,��������������
������������������������������������������������
������������������������������������������������
������������������������������������(�� ���������
����������(����!(�������������������� �����������
���D��������������������!��������������������
:���;, ����������������������������������
�$����!�����?� ��������������������������������
������!�����������������������������������
��������(�� ����������������14������������
���!���������������!��������$���������� �����
��� ������9�� ���$���������� ����������������
���!�������<��,��������� �����14������������
���!����������������!�(����#; ��������������
��!(������,�������:, �������������������������
����� ���������(�������������!� �!�����������
��������������
�
,��������������������������������������������
�:, ���(�����������#�A�����"����������
�$�������9�����!!�����!���������<����(���!�������
�����������!��������������������������������
������������������?��������������������������
#� ����&���
���� ��� ��
,������������������������������������� ��� ���������
��������#������������������������������- �����.�
9I��������#������!�� <���(����������!�
���������������������(����!(����������������������
?��� ��������������������������� ���������
���������,����!�����������������������������������
�������������������������������E�������� ��������
���(������������������������������������
9�������� �<��!������������ ��������������!��
���(���D���������������8������������(���
�����������H������������������������(��� �
���������� ��������������!��E��������������������
���������!�����������������!���$��� ��8������
%�1'��#����$!��������&J���� ���� ��������� �
�����������������F��(�����������������������=G�
�����!�������������$�(����!�����������������!��
��!��������������������������� ������������������
#� ��������������������!� ���������$�����������
��������������������������!������ �����������
��������(���������(������������������������!������
���&J������������!�����!� �!������������ ��
���������(��������������� �� �����(�������������
�����:, �9������������)����������� ����<����
(��� �������� ������������������������$��������
������!�����=G����������:���;, ��
�
?����������������������������� ��� ����������
��������������������������������������������
���������������������� ��������(��������,�������
�����������!��������������(���������������(����
9�������������������#; ��������������������<������
����������������� ����������������"�����������
������������ �����������(��������?��������� �
���(����������������� �����������!����0�������

� +��
������� �����������������������-!� �(���
���!�.��?���������������0����������E�����
��?�:���(�����������������������������
�������������!��(������������(��-�!������.�
9I�������:������������&44*<��?���������������
����������������������������������������������
����������������������������������!���������!�
������������������(���������!����������������?�:�
��(����������������������!�������������
���� ��8������������������������� �������������
(���������������� ������������������������ ������
������(���������� ����� ��������������
��������!�������������E����������(��������������
����������������!��������(��������������?����
��������������������������������������-���)�����!�
�������.���������������(��!���������������
:���;, A���?���-!� �(��.����!�������������
�����������(�������"��������������������������
������������������������E�������� �!!����������
���(���������������������������� ����������(��
����������������������������!�������������E��������
���������)(�����������!���������������������
������������������������
�
?������������������������������� �������
����������������������������,���������(����������
����������������������9(����(�� ������
�$���������<�������������������������������������
�:, �������������������������������������������
?���������������������$�������������������!�����
������(�����������(����������������������� �14�
������!��������!�����#; � ��������������������
������������������������������!��������������
�����������14�������!��������������������������E�
�������$�!������344�������!���������*4���������
�������?���������������������������������
�������������������������9��!�����������<����
��!��������,����������������������������������
��?�:�������������������������������������
������������������!!���������������������
9�������������������������(�����8������
���!����������<���������������������������������
9��������� ��������<�����������(����������,������
��������� ��������������$���������������������
��������������������������� ��������!��
����������������������������$��������������(��
���������,������������������������������(��
���������!����!������������������(��� ���������
��!����������������,������� ���������!��������
���������������$����� �-�� ���.���������������������
�������"����������������������"��������������������
�����(����������������������� ������$!�������
������������(�����(��������������!�����������
�������9������"����������<�����������������������
?���� �����(�������D�����������������������������
�����������!����������������!����������!�������
������� �������������� �������� ������������
����������"����������������������������"����
�����������$��������������!�������(��!��!����
��!���������������?����:, ������������(����
��������������� ������������������������� �
��������%�/'�����������������������������������
���� ��(����������������� �����������������
���������"����E�������������� ���������
����������������!������������������������!�
�������!����������������������������������� �
�"���������!������� �����������������������������
�I������������������"�����$������������
�����!������������� ����������!����������!��
���� ������������������� ��8����������� �����
������� ������������������������ ���� �(��������
����������������!�������������$���������
�������!�������������������?�����"����������
����������� �(����������� ��������������!��
�����(��������!������� ��������������
����������,������������������, ����� ��������
����������������������������������������������
������������� ����������(�������������
�������(������ ��������������$�������������������
�����!������������������!����(���������������� ��
����������������%�6'��?��������������������
�� ��� �����������������������$������9��
������������!� ����������������!�����<�������
��(�������$����!���������������(����������
����������������������������������������������
�����������(������������������!����(��
��!���������������������� ��������(����������
�����������0��������������������������������!�����
�
� ��" �� ��
,�������������������������"������� �����������
!������������ ��������������$��������-���������!�
�������.���������������"����������"�9����������������
�� �������� ��������� �����������!��������!���$�
�������!���<������������������(�����������
G��������������������������������������
����������������� �����������(���������!�����
�����!�����(�� ���������������(��!����
������������������!������� ����������������
�������!�������������������� �����:���;, �
���(���������������!��������������!�����
�����!������ ����(����������������������� �����
����:���;, �����(�������� � ������(�������
�������������!������(�����������������������
�����������������������������������!����������!���
������������������������������������!��������� �
�������������������!�������������������������������
������������������(�����!!�������������������
���� �����:���;, ��:�����������������������
���� ��� ����� ������(�������������������������
�����!��������(���������������������������B�����������
�������������������������������� ������������(���
9����������!����(����������� ������������������
����������������������������<�������"���������������
����������9���������(���������!� ��������� ��<��

� /��
�����������!��9 ��������<����������(��
�����������
��-� ."!�+�!���
?���������������� ����"������ �� ���������������
(�� :;, � ��������� ��� ���� ��������� ���;���� ���
���� =��� ������ !� ����� ��� ���� !� �!���� ���
���� ���������� ��� ������� !�������� ��� ������ ����
������(����� ����� ��� �������� ���� ���� ���D�����
�����������
�
�
����������
���� :������� ��� ���>�� K���(�� �����������
�# ������� �������������� ��!������
��������� ����������� ���"� 9� ��<��
&44���)/9*�)�+<B����*+6)*6&��
&�� K���(�� �� >�� ��� :�� ?����� ����
'����������� ���(� ����(����������
�������� �� ������ (���� ���������
L������ ��� ,����!����� ����!��� �777��
))9�<��
*�� :������� ���� ��� ���� )��������
��������������* ���� ������� ���
�� ������� �� �������! �#����� ;, �
M��������� &4419 ������ ,����� ���
������<��
+�� ;��������� =��� +��� �����# ����� ���
������� ������� �� ���������� ��������� ���
"�� ������ ����� �� ���� ����� ���
(� ��������� "��������� ! �����������
����� ��� ���������� ��� �� ������ ���
��(����� ��� #�� K���� =�������� &44+��
�$����������&7)�*7��
/�� =���� ����� H�� ��� =�� ;��������� ,�� ��
,�������� ! ��������� ������� ����� ��
���� ��������� �� -���� ./01�!211.��
;������� ���� ,����!����� ��� ;���������
&44*��0*9+<B����*11)*64��
1�� K�����D������ ��� L���� ������ ��� K��
H������� ���� ����� �� 3������ !
4��������� �� �������� ������
���� ����� ����� �* ��� ������� ����� ��
�� ������� I�������;������ L������� &44*��
1*2B����314)31*��
6�� ������ ������� I��� ��� ���� (���� ���
������ �� ������ ��� �� � ���
5� ����������������:����������������
&44/��*/9+<B����&+*)&/���
3�� �!�"���� L�� ��� �� >������� 4��� �����
��� (��� �� ������� �������� ����������
&44&�����(��� %������&44/� �7�>���!(��'C�
����(��� ���!B�
����BFF�������� ���8F����F�������F&44&F
�����)������4�������
7�� ;�����)� ������ ���� 6������� ���
3��� ���� �� ��������� ��� ������
(������� �77+�� ��������� ��� ���� ������ �
:����� ����!��� ������ :�����
�� ��8����B�H�������
�4�� ������� ;��� �� ���� ����� "���������
)����� ,���� "������� �� ��� +�����
(�������7�� ��� "��������� "����� ��
������� ���*"�������������8� �����
���� �����"����������� ��I��� �����
H�������"��=���������77&��?��;��H���
:���B�>�������������+6)/3��
���� N������� ;��� "��������� (����� �
3�������� 4���� �7� ,����!�����
?������� �� �����������!������771��39�<B�
���&7)+&��
�&�� ���������� >��� ��� ����3���������� �����
������� ������731�������� ��B�?�"���"�
#��� ��
�*�� ������ H�I��� ��������� �� ���� �����
)�&��� ���� ���� ��������� ,I;�
����!��L��������73&��*)9�<B����+)*���
�+�� H����(�!�� L�� ��� N�� ;������ � ���
(������*��������3����������������
3�������9�����3�����������:���������
3���������� ������* 3�������� ���
3��������� ��� ������� ��� ��� >!��"��
=�������� �77*�� K������� =��(�!�
���������B�:���������>�L��
�/�� I���L��������:��(�� ��"�����������
�������,�������������� ���������� �
�������+������?��� ,����!����� ��������
&44&��)4B������*)�&6��
�1�� ?��� L��� :�L������� ��� >�� �����������
(�� ��� ������� ������� ����� � ��
(� ���� +������� ����� ���
��!!���������� ��� ���� ��;�� &44/��
049/<B����*1)++��
�6�� I��� L��� ��� ���� ���������� ������
���� ����� ����� � �� ����������
(�������!����������������������������
;, �M���������#������!�� ��
�
������������������������
�������� ���
�����!��������,����!������
�������������������
���)(�$��434�I���������
4*�1�������>�����
?��B�9O+6<�&&3+4�+*�
#$B�9O+6<�&&3/&+4��
=)!�������P������� ��
�


APPENDIX 6
Shaw, V., Mengiste, S., & Braa, J. (2007). Scaling of health information systems in Nigeria
and Ethiopia - Considering the options. Paper presented at the IFIP 9.4, Sao Paulo,
Brazil.

Shaw, Mengiste, et al Scaling of Health Information Systems in Nigeria and Ethiopia
Proceedings of the 9th International Conference on Social Implications of Computers in Developing Countries, São Paulo, Brazil, May 2007
SCALING OF HEALTH INFORMATION SYSTEMS IN NIGERIA AND ETHIOPIA - CONSIDERING THE OPTIONS
Vincent Shaw (Email: [email protected] ) Department for Informatics, University of Oslo and University of Western Cape Shegaw Anagaw Mengiste (Email [email protected]) Department for Informatics, University of Oslo and University of Western Cape Jorn Braa (E-mail [email protected] ) Department for Informatics, University of Oslo and University of Western Cape Abstract: This paper addresses the IFIP 9.4 conference theme for papers that take stock of the
development of ICT in the health sector, and in particular how infrastructure and human resource factors influence the implementation of e-development initiatives. Using case studies from the Health Information Systems Programme in Nigeria and Ethiopia, the interdependencies between three spheres are identified as being important in scaling health information systems. The three spheres that are explored are the volume of data collected, human resource factors and access to technology. We draw on concepts from mindful innovation with technology to illustrate that a cultivation approach is appropriate to bringing about change. We suggest that a balance needs to be achieved between the three spheres if scaling initiatives are to succeed, and identify a number of factors that can be used to achieve and maintain the balance. Three flexible standards are identified as being critical strategies to global health information scaling initiatives, namely an essential data set, a scalable process of information systems collection and collation consisting of gateways between paper based systems and hardware and software which can be interfaced with one another, and a cultivation approach.
Keywords: Health information systems, developing countries, scaling, district health information software, health information systems program.

Shaw, Mengiste, et al Scaling of Health Information Systems in Nigeria and Ethiopia
Proceedings of the 9th International Conference on Social Implications of Computers in Developing Countries, São Paulo, Brazil, May 2007
SCALING OF HEALTH INFORMATION SYSTEMS IN NIGERIA AND ETHIOPIA - CONSIDERING THE OPTIONS
1. INTRODUCTION
The scaling of information systems (IS) is a field which has been explored for a number of years in relation to the internet (Monteiro, 1998, 2000) and with respect to the effects of globalization (Rolland & Monteiro, 2002). In the health sector, scaling of health information systems (HIS) is a “pre-requisite and not just a luxury” because in order to make sense of for example immunization coverage data, data from all facilities and services in a region, province, or country are needed (Braa, Monteiro, & Sahay, 2004, p. 341). Yet, despite this imperative for sustainable information systems (IS), this field of study has not been explored in depth. In this paper, we explore the choice of solutions in scaling HIS in one region from each of Ethiopia and Nigeria, and draw lessons for scaling of IS in general. The selection of these countries is purposeful – they represent the two most populous states in Africa, and together represent almost 30% of the sub-Saharan population. Scaling HIS in these contexts is about scaling of large scale systems so as to achieve an appropriate coverage of the population to make meaningful sense of the data. We address the request in the call for papers that papers take stock of the development of ICT in the health sector, and in particular how the infrastructure and human resource factors influence the implementation of e-development initiatives.
Although scaling of HIS has been alluded to in three papers related to the Health Information Systems Programme (HISP) network (Braa, Hanseth, Heywood, Mohammed, & Shaw, Forthcoming, Braa, Monteiro, & Sahay, 2004, Sahay & Walsham, 2005), little detail exists about the choices when implementing (and scaling) large scale HIS. Sahay and Walsham (2005) describe the tension between globalization and localization, and the need to consider which parts of a system are scaleable and which require local customization. This challenge is central to the scaling of large HIS in complex environments, and is the focus of our research. We address this by exploring the role that human resources and technological components play in influencing the type and volume of data that can be collected and processed as HIS are scaled.
IS should be designed in a manner that allows them to be scaled through an evolutionary process (Braa et al., Forthcoming). In this paper we build on the concept of cultivation of IS by drawing on the concept of “mindful innovation of IT” (Swanson & Ramiller, 2004). Mindfulness, is characterized by an openness to novelty, alertness to distinction, sensitivity to different contexts, implicit or explicit awareness of multiple perspectives, and orientation in the present (Weick, Sutcliffe, & Obstfeld, 1999). We suggest that for successful scaling of HIS, mindfulness is required to balance the available human resources, access to technology and the type and volume of data collected by the HIS. By paying attention to these spheres and their interdependencies, rational choices can be made regarding which aspects of the IS can be unproblematically scaled and which require specific attention and local adaptation.
This paper proceeds as follows. The literature review addresses the scaling of HIS, and the use of mindfulness as an appropriate strategy for cultivation and scaling of HIS in complex organizations. In section three the methodology is presented. Section four describes the case of HIS development in Jigawa State of Nigeria and Amhara Region of Ethiopia. The discussion section follows and lastly concluding remarks and acknowledgements are presented.

Shaw, Mengiste, et al Scaling of Health Information Systems in Nigeria and Ethiopia
Proceedings of the 9th International Conference on Social Implications of Computers in Developing Countries, São Paulo, Brazil, May 2007
2. THEORETICAL CONSIDERATIONS
2.1. Scaling of Health Information Systems: The scaling of information systems can be viewed along two axes (Table 1). The horizontal axis reflects the replication of processes across geographic spaces, or across new functional areas. (Braa et al., Forthcoming). Scaling along the vertical axis occurs through increasing the “depth” of penetration of the health system, or increasing the technological sophistication of the IS. Sahay & Walsham (2005) point out that scaling is not only about the technical aspects, but also about the people and processes, and escalating complexity. Not only does scaling require the implementing team to be cognizant of the needs that should be addressed by the scaling process – technical as well as human resource needs, but they also need to be aware that as scaling occurs, complexity (linked to “institutional practices (and) politics” (ibid, p. 51) is likely to increase. Building on this understanding, a third dimension to scaling IS is presented as the extent to which the system is rooted in people and work practices, and which describes how well the system is working (Table 1).
As IS are scaled horizontally or vertically, heterogeneity is likely to increase (Sahay & Walsham, 2005). Flexible systems are required to accommodate differences and changes (Braa, Hanseth, Heywood, Mohammed, & Shaw, Forthcoming). Flexibility is achieved in different ways. Along the horizontal axis, common data standards are used to provide uniformity across the geographic scope – for example the “essential dataset” (EDS) (Braa & Hedberg, 2002). The EDS is “a set of the most important data elements, selected from all primary health care programs, that should be reported by health service providers on a routine basis” (Shaw, 2005 p.632). Using the concept of the “hierarchy of information needs”, the local users can expand the essential dataset to address their specific needs, while still reporting on the essential data required at the central level. In this way a dynamic balance is achieved between the local and the global information needs (Jacucci, Shaw, & Braa, Forthcoming; Rolland & Monteiro, 2002; Sahay & Walsham, 2005). The data standard is thus a “flexible standard” that allows “integrated independence” – the ability to experiment and develop local indicators while maintaining the data standard (Braa et al., Forthcoming).
Along the vertical axis, the challenge is to seamlessly integrate the flow of information between incompatible systems represented by the geographic periphery, and different technological systems, while also accommodating the need for change. To do this, gateways are used. Gateways are of the following types: paper-to-paper, paper-to-computer, and computer-to-computer, and will typically consist of simple software solutions and/or procedures. Utilizing gateways in various combinations accommodates flexibility and heterogeneity in that sub-systems of the IS can be changed or replaced without affecting the flow of information through the whole system. As access to technology in the periphery improves, computers can easily replace paper-based systems without negatively affecting the whole. Gateways provide flexibility as they are replaced and adjusted as sub-systems change.
Despite these insights, there is a need for practical guidance on strategies to effect scaling of IS. The cultivation approach is presented in the next section as an approach that is sensitive to the ever changing dynamics of the health sector environment.

Shaw, Mengiste, et al Scaling of Health Information Systems in Nigeria and Ethiopia
Proceedings of the 9th International Conference on Social Implications of Computers in Developing Countries, São Paulo, Brazil, May 2007
2.2. Scaling HIS as a cultivation process: The study of complexity within health organizations suggests that adaptability is an important characteristic (Begun, Zimmerman, & Dooley, 2003). It recognizes the ability of organizations to accommodate changes in their environment through a process of adaptation. This can be seen as a survival mechanism, and explains how organizations gradually adopt new ways of working as for instance technology changes. Change that occurs through incremental steps is appropriate in organizations because it accommodates change with minimal disruption to the existing processes (Bergqvist, Dahlberg, & Ljungberg, 2002).
The distinction between cultivation and construction dates back to Aristotle. For example, cultivation is seen as helping nature produce more perfectly things she could produce of her own accord, while construction entails reforming nature to produce things not found (Mitcham, 1994). “Another version of this distinction might contrast technological actions that are in some way in
Axis Horizontal Axis (Dimension 1) Vertical Axis (Dimension 2)
Aspect of the health IS
Data standards - what data?
Geographic scope Depth of penetration of the health system hierarchy
Technology standards (sophistication of the technical components)
Explanation The message.
From whom does the message come? Both geographic scope and spread across different programme areas.
How is the message communicated between levels, or from one system to another?
Essential data set One facility State/Region Paper based systems
Pharmaceutical data
Additional facilities till whole state included.
Zone/Gunduma Stand alone computer
Notifiable diseases
Additional states till whole country included.
LGA/District Networked computers
Health clinic and hospital
Community
Other types of data, e.g. survey data
One country
Individual patient record
Internet based IS
Dimension 3: The extent to which the system is “rooted” in the social system, information use & ownership – this drives the imperative to scale HIS vertically and horizontally
Table 1: Understanding the different aspects of the Health Information System
Increasing sophistication
Increasing sophistication

Shaw, Mengiste, et al Scaling of Health Information Systems in Nigeria and Ethiopia
Proceedings of the 9th International Conference on Social Implications of Computers in Developing Countries, São Paulo, Brazil, May 2007
harmony with nature with those that are not” (ibid, pp 211). By “replacing” nature in this quote with a social systems perspective on IS (e.g. Braa & Hedberg, 2002), we might say that cultivation as a strategy in this context will entail being in harmony with the social systems and building on the resources already there, although in a “progressive” bottom-up perspective of change. Not only has cultivation has been used to describe an approach to organizational change in which people are central to the information system (Bergqvist, Dahlberg, & Ljungberg, 2002), but it has also been used as an appropriate strategy for effecting change in information infrastructures (Aanestad 2002; Hanseth 2002). However, in considering the scaling of HIS in India, the bottom-up cultivation approach that was initially adopted needed to be complemented by a top-down strategy that provided legitimacy for further scaling (Sahay & Walsham, 2005), and similarly in South Africa (Braa, et al, Forthcoming). Yet, even when the systems are officially accepted, access to resources do not necessarily improve, and the further scaling of information systems has to occur within the existing resource constraints. This is often the dilemma of those involved in the implementation (and scaling) of HIS – how to accommodate the increasing demands (the “all or nothing” imperative (Braa, Monteiro, & Sahay, 2004, p. 340) or face the risk of the system being replaced by yet another alternative system that is perceived to be more useful.
Weick, et al (1999) has used the concept of mindful innovation to describe the adoption of IT in high reliability organizations (HRO’s) like naval aircraft carriers and nuclear power stations. These organizations utilize “complex processes to manage complex technology” (Weick, et al, 1999, p. 83) because the consequences of failure in an environment that is vulnerable and subject to unexpected changes are devastating. Organizations wishing to survive in these conditions must be able to adapt to unexpected changes. Adaptive responses to the unexpected requires mindfulness, as characterized by a pre-occupation with failure, a reluctance to simplify interpretations, a sensitivity to operations, a commitment to resilience and a reliance on expertise over formal authority (Swanson & Ramiller, 2004). Mindfulness enhances the cultivation approach for scaling HIS by suggesting a number of specific characteristics that should be incorporated in the approach to scaling HIS. Three of these are summarized in Table 2. Using empirical data from Ethiopia and Nigeria, the importance of paying careful attention to these characteristics, especially as they relate to the complex interactions between the skills and capacity of people in utilizing technology to communicate and process health information, is demonstrated.
Characteristic Brief description and application to HIS
Preoccupation with the possibility of failure
Through constantly being aware that IT projects are prone to failure, a pro-active awareness of opportunities that can be harnassed to support the successful scaling should be encouraged. (we use empirical data to demonstrate how an “awareness of the possibility of failure” can be used to guide which aspects of the IS can be unproblematically scaled and which require specific attention and local adaptation.
Commitment to resilience
It is impossible to identify every possibility that might arise during scaling of HIS – therefore improvisation will be required to complement plans, adaptation will be necessary, and effectiveness required rather than efficiency.
Sensitivity to operations small faults can cause major consequences if not addressed. This is the processes of local customization to ensure that systems and procedures are locally appropriate. It also entails responding to seemingly small problems before they create larger problems.
Table 2: Brief description of some characteristics of mindful innovation
Shaw, Mengiste, et al Scaling of Health Information Systems in Nigeria and Ethiopia
Proceedings of the 9th International Conference on Social Implications of Computers in Developing Countries, São Paulo, Brazil, May 2007
3. METHODOLOGY:
The empirical basis for this study is derived from the large scale and on-going HISP action research project which is engaged in the design, development and implementation of HIS in many developing countries including Ethiopia (Braa et al., 2004) and Nigeria. We have purposefully selected a single state/region from each of these countries based on the in-depth knowledge by the authors, and because the scaling of HIS in the two regions present similarities and differences which allow interesting comparisons to be presented.
The principle author’s involvement in Nigeria began in 2003 at the initiation of the 5 year, Nigerian Partnerships for Transforming Health Services (PATHS) project funded through the British Department for International Development (DFID). The project is active in 5 of the 37 Nigerian states. He has in the last year spent about 90 days in Nigeria in these two states, supporting the improvement, and scaling of primary health care IS. The second and third authors have been involved in IS development in Ethiopia since 2003 when HISP activities began through a collaboration with Addis Ababa University and the University of Oslo. The second author, an Ethiopian national and member of the HISP-Ethiopia team, has provided support to the RHB’s, and in particular to the Amhara Region.
Data sources accessed during project activities includes on-site observations, notes made in a diary kept specifically for the purpose, photographs, documents, tools and project reports. The research data has been analyzed in the interpretivist research tradition as described by (Walsham, 1993).
4. CASE DESCRIPTION:
In the case descriptions we initially provide a background perspective on the development of the state and the health system, and then describe particular aspects related to the development of the HIS. In each case we have tried to detail aspects related to the three spheres under consideration, namely the data collected, the technology, and the staffing.
4.1. Background Jigawa is a new state, having been created out of the Kano state in northern Nigeria in 1991(Table 3). It is the sixth Nigerian state to introduce Sharia Law. The state is divided into 27 local government authorities (LGA’s), and state and local government councilors are democratically elected. As in the case of Amhara Regional State, considerable effort is being directed towards decentralization of services.
The two case study sites have remarkably similar indices (Table 3). Both have poorly developed infrastructure, and (in terms roads, electricity, telecommunications), although in recent months access to electricity and telephones has increased remarkably in the periphery of Amhara Region State. Human capacity is poor in both states, and immense geographical distance (e.g. one of the zones is located at a distance of more than 700 km from the regional capital) hinders communication and supervision.

Shaw, Mengiste, et al Scaling of Health Information Systems in Nigeria and Ethiopia
Proceedings of the 9th International Conference on Social Implications of Computers in Developing Countries, São Paulo, Brazil, May 2007
Health services are poorly developed in both states. In Jigawa, the maternal maternal mortality rate is estimated to be 1,700/100,000 live births in Northern Nigeria (Kano State Economic Planning Committee, 2004; Shiffman, Okonofua, & Ved, 2006) – several times higher than that for Nigeria. It is estimated that in Amhara Regional State, basic services are provided to only about 60% of the population (Ministry of Health, Ethiopia, 2005).
A key difference between the two case study sites is that in Amhara Region, access to ICT has increased dramatically in the last few months as part of a governmental initiative, while in Jigawa outside of the main centers ICT infrastructure is extremely week. However, in Jigawa the staffing levels are higher (even if skills are low), while in Amhara the staffing levels are extremely poor. These differences have required different approaches to the development of the HIS, as is discussed below.
4.2. Information systems development in Jigawa – limiting the dataset In Nigeria, the PATHS project has been supporting health systems development through targeted program support, particularly to maternal and child health programs, malaria and tuberculosis and sexually transmitted infections. Supporting the HIS has been integral to these initiatives (Figure 1). HMIS development occurred in Jigawa and 2 other states as a parallel process based on the South African experience of HIS development using the DHIS software (Braa & Hedberg, 2002). Three aspects of the HIS development are highlighted. First, 8 of the 27 LGA’s were identified to serve as pilots - allowing the implementation team to gain experience and learn lessons in the initial implementation. Secondly, an EDS was developed for use across the PATHS states. The process of developing and gaining acceptance of the EDS did not occur without controversy. Major 1 Obtained from various sources, including data used in the DHIS for population data
Jigawa Statistics1 Amhara Statistics
23,154 km² Surface Area 161,828.4 km2
4,9M vs 131,5M for Nigeria Population 2005 est 19M vs. 74M for Ethiopia
49% Population under age of 15 years 44%
22% for women and 51% for men Literacy Rate (2002) 22% for women and 46% for men
US$290 vs. $1,188 Nigeria average Gross per Capita Income (2001) US$100 vs. $120 Ethiopian average
Table 3: Selected Statistics for Jigawa State, Nigeria and Amhara Regional State, Ethiopia

Shaw, Mengiste, et al Scaling of Health Information Systems in Nigeria and Ethiopia
Proceedings of the 9th International Conference on Social Implications of Computers in Developing Countries, São Paulo, Brazil, May 2007
opposition to the EDS was received from senior Federal Ministry of Health (FMoH) officials who were advocating use of over 1000 data elements and a software product that provide little benefit to its users. Eventually, through high level negotiations, an agreement was reached that an EDS of 127 data elements, which could provide data on 74 indicators, would be used as a pilot in the PATHS states only. Subsequently (in 2005) a slightly modified version has been used as the standard across the country. Thirdly, the DHISv1.3 software was adapted to the Nigerian context, and used at the state level for data capture and analysis of monthly facility reports.
In the absence of technology, reliance is made on paper based IS for data collection and onward transmission, from facility, through local government authority level, and up to state level (Figure 2). Data capture occurs at state level. Gateways are used at two levels. A paper-paper gateway transfers data from patient registers to monthly reports (facility level), and a paper-computer gateway is used at the point of data capture (state level). Data is captured by two staff in the HMIS unit. The achievement of a 68% data coverage for the last 12 months (as at August 2006) is significant given the constraints (unreliable access to electricity, lack of funds for generator fuel and pressure on data capturers to perform other tasks), and only the PATHS states can claim similar data coverage rates.
Project initiated
Sept 2003
2 Computers purchased
Nov AugJan 2006Jan 2005Jan 2004
Capture of facility data on 127 data elements initiated
May
58% data submission rate
60% data submission rate by 8 LGA’s
68% data submission rate
Meetings and workshops with LGA M+E officers held on approx. quarterly basis
Pilot in 8 LGA’s and 188 facilities Expanded to remaining 19 LGA’s and 320 facilities
Course: Use of information
Target: Facility and LGA staff
Provided by: Int consult & Nat consult & State HMIS Officer
1 additional computers “obtained”
HMIS officer obtains laptop
Process
Milestones
Technology
Training Course: Use of information
Target: Facility and LGA staff
Provided by: Nat consult & State HMIS Officer
HMIS officer and Nat consultant exposed to training on DHISv13 in Nigeria and in SA, and can now provide basic and advanced training to new data capturers
Figure 1: Timeline of initiatives in Jigawa, Nigeria

Shaw, Mengiste, et al Scaling of Health Information Systems in Nigeria and Ethiopia
Proceedings of the 9th International Conference on Social Implications of Computers in Developing Countries, São Paulo, Brazil, May 2007
A strength in Jigawa is that staff exist at each level, and have received training related to the HIS (Figure 1 and Table 4). Through these processes the in-country teams have developed capacity to continue basic training on their own. International support is available to support the more sophisticated aspects of the software, and of HIS implementation. Institutionalization of training initiatives is to be strengthened through establishing links with a local university.
Jigawa, Nigeria Amhara, Ethiopia
State/ Region
Zone (Amhara only)
District level
Level to which database is to be scaled
Health facility
Patient register
LGA (Jigawa only)
DHIS v1.3 DHIS v1.4
11 Zones
119 Woreda’s6 Gunduma’s
Still to be
created
27 LGA’s
508 facilities
Population 4,9 million
1074 facilities
Population 19 million
Database used to collate paper forms
Paper registers for patient data
Summary form for data communication
Legend
Database used to collate paper forms
Paper registers for patient data
Summary form for data communication
Legend
Database used to collate paper forms
Paper registers for patient data
Summary form for data communication
Legend
Figure 2: Data flows demonstrating the use of gateways between incompatible systems

Shaw, Mengiste, et al Scaling of Health Information Systems in Nigeria and Ethiopia
Proceedings of the 9th International Conference on Social Implications of Computers in Developing Countries, São Paulo, Brazil, May 2007
Hierarchical level
Numbers of staff
Staff involved in the HIS
Access to computers and electricity
Facilities 508 At least one person in each facility participated in training on use of information
Seldom have access to grid electricity. May have solar panels, which often are non-functional. Rely on paper based data collection, but paper itself is in short supply.
Local government
27 One PHC Coordinator (political level) and an Monitoring and Evaluation Officer2
Grid electricity is unreliable.
Almost no computers at this level.
State Ministry of
Health
1 State HIS Officer, and 2 data entry clerks
Grid electricity is unreliable, and more often than not reliance is on a generator which usually only runs “when certain senior officials are in the office”.
Three computers and one laptop
Table 4: Overview of access to staff and computers in the Jigawa Health System
4.2.1. Summary: The phases in the HIS strengthening initiatives in Jigawa are presented in Table 5.
Phases three through five require specific mention. Phase three is a consolidation period. A number of workshops have been convened where existing data (even if incomplete) is used as a means to encourage LGA’s to ensure that at least 90% of their facilities report. Interestingly, the ability to present and analyze data has created huge interest amongst program managers at the State and Federal levels as, for the first time, comparative data has been presented across the five 2 In reality, there are more people involved at this level, as many of the vertical programmes have their own “M+E officers” – reflecting the constant battle between integration and verticalization (fragmentation) of services, especially in an environment which has a large donor driven component
Phase Time period Activity Comment I Sept 2003 -
Jan 2005 Pilot in 8 LGA's EDS defined,
data flow improved, new process of data capture using DHIS1.3 at state level introduced, intense training provided
II Jan 2005 - Jan 2006
Horizontal scaling across geographic areas (LGA's)
EDS held static and data capture maintained at state level, increase in volume of data (additional LGA's), intense training by local team (demonstrating some capacity been developed)
III Jan 2006 - Aug 2006
Consolidation period Efforts directed at improving adherence to data flow and improving data capture process Efforts to encourage use of information Advocacy meetings with senior managers
IV Nov 2006 Conversion DHIS13 – DHIS14
All else held static – training to be provided on new version of DHIS
V Jan 2007 onwards
Decentralizing data capture to gunduma
Still to take place, but has been discussed, and planned for about 18 months.
Table 5: Phases in HIS Strengthening Activities

Shaw, Mengiste, et al Scaling of Health Information Systems in Nigeria and Ethiopia
Proceedings of the 9th International Conference on Social Implications of Computers in Developing Countries, São Paulo, Brazil, May 2007
PATHS states. The upshot of this has been that HISP-Nigeria has now been asked to implement DHISv1.4 and provide training to all remaining states in Nigeria!
Phase four involves the conversion from DHISv1.3 to DHISv1.4, and is currently underway. During 2003/04 a new improved version of the DHIS software, called DHISv1.4, was being tested in South Africa, Botswana and Zanzibar. In Nigeria though, the introduction of this more powerful and efficient version was delayed till late 2006, because at the time the team had limited capacity to absorb new initiatives. In August, Kano state began to use the DHISv1.4, and as implementation proceeded smoothly, training is currently being done in Jigawa (and offered to other states to attend as well). The process of transition to DHISv1.4 reflects the cultivation processes used so successfully – not only in that piloting in one region is initiated before larger scale implementation, but the translation to a newer version of the same software is also a cultivation process.
Phase five is still to be enacted, namely the decentralization of data capture to gunduma level. Ideally data capture should occur at the LGA level. But, in this case 27 computers accompanied by generators, UPS systems, and secure and dust free abodes need to be provided, as well as training and support to the 27 HIS Officers. This is not achievable given the current access to resources. Rather, the plan is to scale to gunduma’s, and to provide an additional 6 computers, and generators, and to locate these at hospitals (where power supply would be more regular and a secure and dust free environment is more likely to be found). Each would capture data from about 85 facilities. Training on the use of the DHIS software will draw on those LGA HIS officers who are dedicated and reliable. New HIS officers from facility staff will be identified to support the LGA level. Scaling in this way potentially trebles the pool of data capturers, and also shifts the responsibility one step down the hierarchy in a manner consistent with resource availability.
4.3. Information systems development in Amhara Region State - increasing the data volume
The flow of information is similar to that in Nigeria (Figure 2). However, prior to the project initiation, the Woreda Health Offices compiled summary reports (using the health facility reports), and the aggregated report was submitted to the zonal office, which sent it to the ARHB (Amhara Regional state Health Bureau) and then to the FMoH. During the aggregation process, the identity and details of the original facility data was lost, making it impossible to trace data back to a single facility. Data capture occurred at the Regional level. Prior to the initiation of the HISP project, the existing HIS has been a one way reporting system designed to report data to higher levels and vertical programs without any feedback to the lower levels. An EDS was developed over an 18 month period (up to December 2005) using a participatory approach and with support of the RHB. Standardized reporting formats were developed, and the DHISv1.4 was customized for implementation at regional and zonal levels. The new reporting system brought about changes to the flow of information – facility reports would be captured instead of aggregated data. This created a tenfold increase in the volume of data, as instead of monthly reports from 119 woreda’s, 1047 monthly facility reports were to be captured. As a result, there was a need to decentralize data capture to zonal, and possibly woreda level.
A survey of access to staff, computers, and internet was conducted (Table 6). This shows how access to computers, telephone and electricity both at zonal and district levels has improved remarkably in the last few months, although surprisingly the level of internet connectivity both at zonal and district level remains low (but is likely to be addressed through a large World Bank and

Shaw, Mengiste, et al Scaling of Health Information Systems in Nigeria and Ethiopia
Proceedings of the 9th International Conference on Social Implications of Computers in Developing Countries, São Paulo, Brazil, May 2007
International Monetary Fund (IMF) funded project - WoredaNet). A critical problem though is the lack of assigned HMIS staff to specifically do HMIS related activities, and they do not have the skills and training with regard to modern information and communication technologies.
Zone
Districts (Woredas)
Districts with access to telephone & electricity
Districts with computers
Districts with internet (Dial-up) access
Districts with assigned personnel for HMIS
North Gondar 18 16 10 2 None (not even at Zonal level)
South Gondar 10 9 8 1 2 Wag Hemra 4 3 3 None (not even at zonal
level) 0
North Wello 9 9 7 1 2 South Wello 18 14 11 1 None (not even at
Zonal level) Oromiya special zone
5 3 2 None (Not even at zonal level)
0
North Shoa 20 18 18 None None (not even at Zonal level)
East Gojam 15 11 7 1 None (not even at Zonal level)
Awi zone 6 4 4 None (not even at zonal level)
0
West Gojam 13 12 9 None (Not even at zonal level)
None (not even at zonal level)
Bahir Dar Special zone
1 1 1 None (not even at zonal level)
0
Totals 119 100 80 6 4
Table 6: Analysis of access to computers, internet and staff in Amhara Regional State
To address the skills gap, a two week training course for staff from the 11 zones was conducted in May 2006 by the HISP-Ethiopia team. As many trainees had very limited computer literacy skills, the first three days were devoted to increasing their familiarity with MS Office applications, (specifically MS Excel and MS Access since they are linked to the DHISv1.4 for report generation and data analysis). The remainder of the training focused on the principles of data capture in DHISv1.4. At the end of the training, trainees were provided with installation CD’s, and were instructed in the installation procedure for the software. However, shortly thereafter the HISP team started to receive phone calls from zonal health departments requesting support on the installation process. In July 2006, when a team of three HISP members (including one of the authors) conducted follow-up on-site training in the zones, they found that none of the trainees had managed to successfully install the software in their computers. This was due to the low computer literacy of the trained staff who had difficulty grasping the installation procedure. As the HIS focal person in one of the zones indicated:
“…the training given for us in May 2006 in Baher Dar was good, but for most of us with less background and knowledge even on basic computer applications, the complex instructions and dialogue boxes popping up during installation of DHIS software makes it very difficult for me to successfully install and use the system.”

Shaw, Mengiste, et al Scaling of Health Information Systems in Nigeria and Ethiopia
Proceedings of the 9th International Conference on Social Implications of Computers in Developing Countries, São Paulo, Brazil, May 2007
We see in this example, how, the balance between the human resources (numbers, and skills levels) and the technology needs to be managed, otherwise the technology will not be used to its full potential. An alternative option that is now under consideration, instead of trying to achieve homogenous scaling to all levels at the same time, would be to scale to those woreda’s that have the capacity to absorb the training and which have the technology available. We thus allow uneven development to occur, but through a cultivation strategy.
4.3.1. Summary: In Amhara Region then, we can discern three phases to the HMIS strengthening activities (Table 7).
Phase Time period Activity Comment I June 2004 -
Dec 2005 Period of consultation and buy in EDS defined, data flow changed with
huge increase in data volume II Jan 2006 -
current Vertical scaling of data capture to zones
Training and support for data capturers
III Oct 2006 – Jul 2007
Vertical scaling of data capture to selected districts
Training and support for data capturers
Table 7: Summary of HIS Implementation in Amhara Regional State
5. DISCUSSION:
We see in these examples, an interesting interplay between what we have termed the three spheres of the IS, the data sphere, the technology sphere, and the human resource sphere. These are presented in a model (Figure 3). The three spheres are interlinked with one another in complex ways, and understanding and being sensitive to the complexities of these inter-linkages is important in “innovating mindfully” with technology. The oval shapes represent an assessment of the capacity of each state in relation to the three spheres. Jigawa and Amhara Region differ in their human resource capacity and access to technology and this has had implications on the volume of data that they can effectively manage, and the process for strengthening the HIS.
In Nigeria, centralized data capture was initiated because of the absence of ICT infrastructure in the periphery, and despite the presence of sufficient staff there. However, data capture of 508 facility reports in a central office is not an easy task. It was kept manageable by limiting the EDS to a small number of data elements. Decentralization (scaling along the vertical axis) is proceeding “cautiously” as ICT infrastructure improves. In Amhara, the process was driven by the need for disaggregated data (increased depth of penetration of the hierarchy) resulting in an explosion in the volume of data. Given the relatively good access to ICT, decentralized data capture was possible, despite the limited availability of staff. However, the implementation plan had to be re-assessed because efforts at improving staff capacity were hindered by their limited ability to absorb the training. As HIS implementation proceeds, so the capacity in each of the spheres changes (skills improve, access to technology improves, and data volume may increase), and a never-ending spiral results as the balance is maintained. As the process spirals the HIS is scaled.
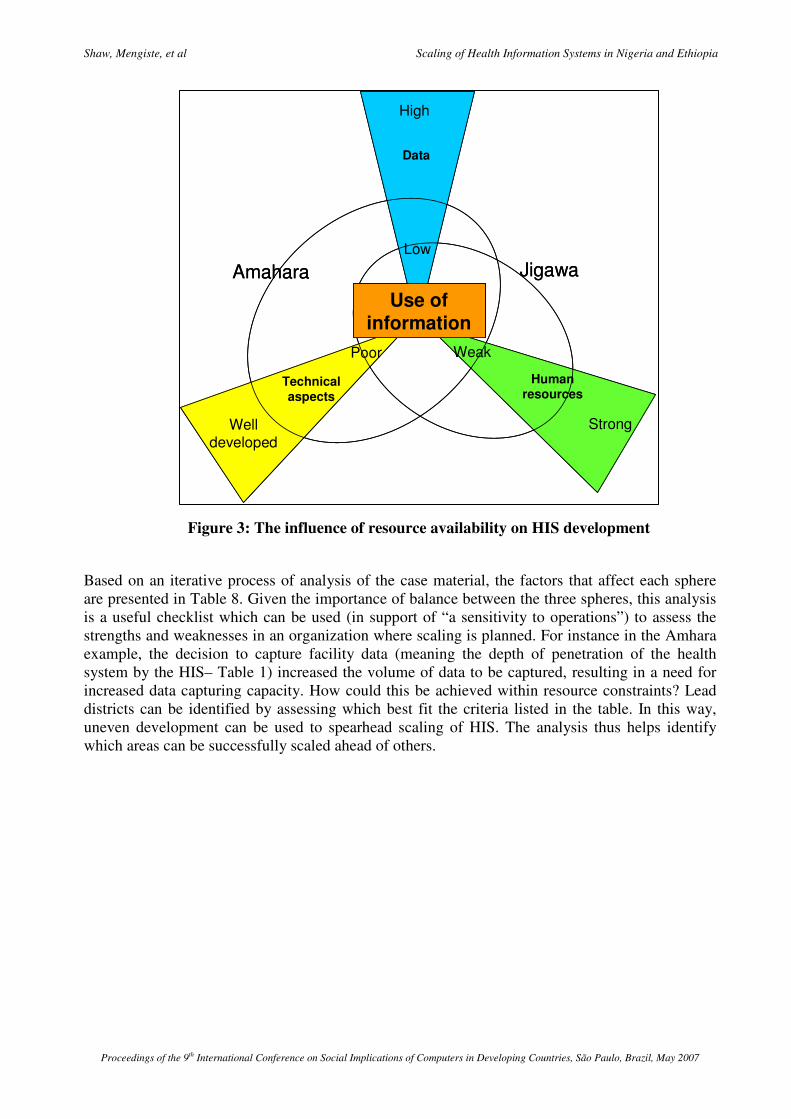
Shaw, Mengiste, et al Scaling of Health Information Systems in Nigeria and Ethiopia
Proceedings of the 9th International Conference on Social Implications of Computers in Developing Countries, São Paulo, Brazil, May 2007
Based on an iterative process of analysis of the case material, the factors that affect each sphere are presented in Table 8. Given the importance of balance between the three spheres, this analysis is a useful checklist which can be used (in support of “a sensitivity to operations”) to assess the strengths and weaknesses in an organization where scaling is planned. For instance in the Amhara example, the decision to capture facility data (meaning the depth of penetration of the health system by the HIS– Table 1) increased the volume of data to be captured, resulting in a need for increased data capturing capacity. How could this be achieved within resource constraints? Lead districts can be identified by assessing which best fit the criteria listed in the table. In this way, uneven development can be used to spearhead scaling of HIS. The analysis thus helps identify which areas can be successfully scaled ahead of others.
Figure 3: The influence of resource availability on HIS development
Data
Low
High
Strong
Weak
Human resources
Technical aspects
Poor
Well developed
JigawaAmaharaUse of
information
Data
Low
High
Strong
Weak
Human resources
Technical aspects
Poor
Well developed
JigawaAmaharaUse of
information

Shaw, Mengiste, et al Scaling of Health Information Systems in Nigeria and Ethiopia
Proceedings of the 9th International Conference on Social Implications of Computers in Developing Countries, São Paulo, Brazil, May 2007
SPHERE CONTRIBUTING FACTORS Volume of data, affected by: Extent of integration from vertical programs (Jigawa) Geographic scope (e.g. In Jigawa, 8 of 27 LGA's piloted)
Data components
Granularity of data (penetration of hierarchy from national to community and individual levels – the Amhara example) Numbers of staff (Jigawa and Amhara) Skills level of staff (Amhara) Ability to provide support (Jigawa and Amhara)
Human resources aspects
Ability to train and build capacity (Jigawa) Scalable processes integrated in the information system (Jigawa and Amhara) Software appropriate and scalable (Jigawa and Amhara) Access to computers (Jigawa and Amhara)
Technical aspects
Access to internet (Amhara)
Table 8: The Factors Contributing to Each Sphere
The concept of utilizing lead districts to spearhead scaling and HIS development warrants further exploration. Development of the HIS and local commitment, the level of its use and quality of data, will typically proceed at an uneven pace between districts. Local champions and otherwise favorable conditions in individual districts may typically lead to “best practice” districts. An effective scaling strategy needs to support these lead districts and actively use these best practices in the horizontal scaling of the HIS to other districts. More concretely we have seen how best practices have turned into “attractors for change” (Eoyang, 1996) by creating support and interests and thereby sufficient momentum and “critical mass” to bring about changes also in other districts.
A cultivation approach, characterized by mindful innovation is required to maintain the spiral as HIS are scaled. In order to minimize the risk of failure then, careful attention to the context is required, and in particular to the ability to accommodate and absorb change (a sensitivity to operations). Inefficiencies may need to be accepted because of imbalances between the three spheres (in the case of Jigawa the inefficiency of centralized data capture, in Amhara the need for a reconsideration of the decentralization strategy). Further examples are summarized in Table 9.
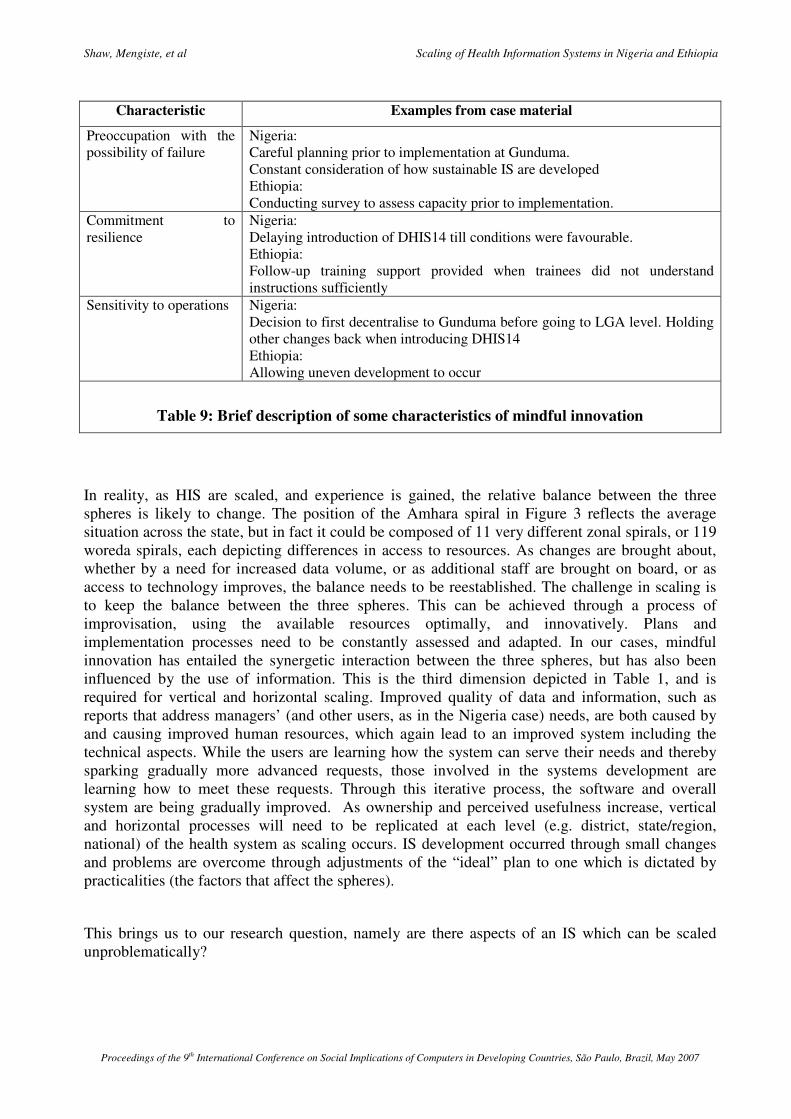
Shaw, Mengiste, et al Scaling of Health Information Systems in Nigeria and Ethiopia
Proceedings of the 9th International Conference on Social Implications of Computers in Developing Countries, São Paulo, Brazil, May 2007
Characteristic Examples from case material
Preoccupation with the possibility of failure
Nigeria: Careful planning prior to implementation at Gunduma. Constant consideration of how sustainable IS are developed Ethiopia: Conducting survey to assess capacity prior to implementation.
Commitment to resilience
Nigeria: Delaying introduction of DHIS14 till conditions were favourable. Ethiopia: Follow-up training support provided when trainees did not understand instructions sufficiently
Sensitivity to operations Nigeria: Decision to first decentralise to Gunduma before going to LGA level. Holding other changes back when introducing DHIS14 Ethiopia: Allowing uneven development to occur
Table 9: Brief description of some characteristics of mindful innovation
In reality, as HIS are scaled, and experience is gained, the relative balance between the three spheres is likely to change. The position of the Amhara spiral in Figure 3 reflects the average situation across the state, but in fact it could be composed of 11 very different zonal spirals, or 119 woreda spirals, each depicting differences in access to resources. As changes are brought about, whether by a need for increased data volume, or as additional staff are brought on board, or as access to technology improves, the balance needs to be reestablished. The challenge in scaling is to keep the balance between the three spheres. This can be achieved through a process of improvisation, using the available resources optimally, and innovatively. Plans and implementation processes need to be constantly assessed and adapted. In our cases, mindful innovation has entailed the synergetic interaction between the three spheres, but has also been influenced by the use of information. This is the third dimension depicted in Table 1, and is required for vertical and horizontal scaling. Improved quality of data and information, such as reports that address managers’ (and other users, as in the Nigeria case) needs, are both caused by and causing improved human resources, which again lead to an improved system including the technical aspects. While the users are learning how the system can serve their needs and thereby sparking gradually more advanced requests, those involved in the systems development are learning how to meet these requests. Through this iterative process, the software and overall system are being gradually improved. As ownership and perceived usefulness increase, vertical and horizontal processes will need to be replicated at each level (e.g. district, state/region, national) of the health system as scaling occurs. IS development occurred through small changes and problems are overcome through adjustments of the “ideal” plan to one which is dictated by practicalities (the factors that affect the spheres).
This brings us to our research question, namely are there aspects of an IS which can be scaled unproblematically?

Shaw, Mengiste, et al Scaling of Health Information Systems in Nigeria and Ethiopia
Proceedings of the 9th International Conference on Social Implications of Computers in Developing Countries, São Paulo, Brazil, May 2007
6. CONCLUDING REMARKS:
Considering the factors depicted in Table 8, we cannot say with absolute certainty that there was any single factor that was able to be scaled “unproblematically” – the nature of the local context, and the access to resources, required specific adaptations to be made for each of the factors. But, drawing on the case descriptions, and similar accounts in the literature (Braa et al., Forthcoming; Braa et al., 2004; Rolland & Monteiro, 2002), it is clear that certain strategies are central to successful scaling. The first is the concept of the EDS (and which will not be further elaborated here). The second is in the technical sphere, and is depicted in Figure 2 - a scalable process of information collection and collation consisting of gateways between paper based systems and hardware and software which can be interfaced with one another at various levels of the hierarchy as access to technology changes, and which can accommodate heterogeneous (uneven) development across geographic areas. The third represents the cultivation process – or the spiral itself – which includes improvisations and a variety of ways to develop, facilitate and motivate increased information use, local champions, commitment and ownership. We have seen that the development of lead districts, good examples and attractors for change are crucial elements in the cultivation and scaling strategy These three strategies have been identified as “flexible standards” (Braa et al., Forthcoming), and as can be seen in Table 1, they support the scaling process (and the changes that accompany scaling) across geographic scope and depth of penetration of the hierarchy of the health system. We would thus conclude that “flexible standards” are strategies that can be scaled on a global level, but that for the successful scaling of HIS, it has to be accompanied by a local cultivation process that balances the spheres of volume of data, access to technology, and human capacity.
7. ACKNOWLEDGEMENTS: We wish to pay tribute to all our counterparts working in the remote regions of Jigawa and Amhara, and those in the administrative offices at the district, or regional levels who have supported our efforts at improving the IS.
8. REFERENCES: Aanestad, M. (2002). Cultivating Networks: Implementing surgical telemedicine. University of Oslo, Oslo, Norway.
Begun, J. W., Zimmerman, B., & Dooley, K. (2003). Health Care Organizations as Complex Adaptive Systems. In S. M. Mick & M. Wyttenbach (Eds.), Advances in Health Care Organisation Theory (pp. 253-288). San Francisco: Jossey-Bass.
Bergqvist, J., Dahlberg, P., & Ljungberg, F. (2002) Scalability through Cultivation - designing IT support for co-ordination work. Retrieved 13 November, 2006, from http://citeseer.ist.psu.edu/cache/papers/cs/23947/http:zSzzSzwww.dahlberg.sezSzpubzSzmaster.pdf/scalability-through-cultivation-designing.pdf
Braa, J., Hanseth, O., Heywood, A., Mohammed, W., & Shaw, V. (Forthcoming). Developing Health Information Systems in Developing Countries - the flexible standards strategy. MIS Quarterly.
Braa, J., & Hedberg, C. (2002). The Struggle for District Based Health Information Systems in South Africa. The Information Society, 18, 113-127.
Braa, J., Monteiro, E., & Sahay, S. (2004). Networks of Action: Sustainable Health Information Systems Across Developing Countries. MIS Quarterly, 28(3), 337-362.
Eoyang, G. "Complex? Yes! Adaptive? Well, maybe..." Interactions (3:1), 1996, pp. 31-37.
Hanseth, O. (2002). From systems and tools to networks and infrastructures - from design to cultivation. Towards a theory of ICT solutions and its design methodology implications. Retrieved 2 September, 2005, from http://heim.ifi.uio.no/~oleha/Publications/ib_ISR_3rd_resubm2.html
Shaw, Mengiste, et al Scaling of Health Information Systems in Nigeria and Ethiopia
Proceedings of the 9th International Conference on Social Implications of Computers in Developing Countries, São Paulo, Brazil, May 2007
Jacucci, E., Shaw, V., & Braa, J. ( Forthcoming). Standardization of Health Information Systems in South Africa: The Challenge of Local Sustainability. Information Technology for Development, ( ).
Kano State Economic Planning Committee. (2004). Kano State Economic Empowerment and Development Strategy (K-SEEDS).
Ministry of Health (MOH) [Ethiopia]. 2005. The Health Sector Strategic Plan (HSDP III). Addis
Ababa, Ethiopia: Ministry of Health.
Mitcham, C. (1994). Thinking through Technology. The Path between Engineering and Philosophy. The University of Chicago Press, Chicago. 397 pages.
Monteiro, E. (1998). Scaling Information Infrastructure: The Case of the Next-Generation IP in the Internet. The Information Society, 14(3), 229-245.
Monteiro, E. (2000). Monsters - From systems to actor-networks. In K. Braa, C. Sorenson & B. Dahlbom (Eds.), Planet Internet. Lund, Sweden: Studentlitteratur.
Rolland, K., & Monteiro, E. (2002). Balancing the Local and the Global in Infrastructural Information System. The Information Society, 18, 87-100.
Sahay, S., & Walsham, G. (2005, 26-28 May 2005). Scaling of Health Information Systems in India: Challenges and Approaches. Paper presented at the International Federation for Information Processing Working Group 9.4 Conference, Abuja, Nigeria.
Shaw, V. (2005). Health information system reform in South Africa: developing an essential data set. Bulletin of the World Health Organisation, 2005(83), 632 - 639.
Shiffman, J., Okonofua, F. E., & Ved, R. (2006). The State of Political Priority for Maternal Mortality REduction in Nigeria and India [Electronic Version]. Retrieved 14 November 2006 from http://paa2006.princeton.edu/download.aspx?submissionId=60071.
Swanson, E. B., & Ramiller, N. C. (2004). Innovating mindfully with technology. MIS Quarterly, 28(4), 553-583. Walsham, G. (1993). Interpreting Information Systems in Organizations. Chichester, England: John Wiley and Sons.
Weick, K. E., Sutcliffe, K. M., & Obstfeld, D. (1999). Organizing for High Reliability: Processes of Collective Mindfulness. Research in Organizational Behavior, 21, 81-123

APPENDIX 7
Shaw, V. and J. Braa (Forthcoming). "Developed in the South" - an evolutionary and
prototyping approach to developing scalable and sustainable health informatin systems.
Development Informatics and Regional Information Technologies: Theory, Practice and
the Digital Divide. J. Steyn, IGI Global. Vol 3: ICT's for Development in Africa: Theory,
Practice and the Digital Divide.


� ��
������������������������������������������������ �������������������� ����
����������������������������������������������������������������������������������������������������������
���������������������������� ����������������������������������������������������������������������������
���������������������������������������������������� ����������������
��������������������������������������������������������������������
�
�����������
����������� ������������������������������������������������
� ������
����������� ���������
�
���������
������������ ����������� �������� �������������� ������������������������
�������������������������������������������������������������������������������
�������� �����������������!�������������������������� ����"����������������������
��������"���������������������������������������������������������������������������
�������� �������������#������ �������������������#��������$�������������
���������!�������"�
������������������������������������������ ��#������������������������������
����������������� ��������� ������������������������������������������������ �
����������������������������� ����������������� ��������������������� ������������
������������������������������������������� �������"�
���������������#����%������� ������������ �����&������� ��������'�����
(��������������������������������������#�� �� ������������������������������
���������#�����������������������)�������������� ���������������������������������$
������������� ��������� �'������ ���������#�����������*��������������� ����� ����
������������������ ��������� ���������������� �����������"����������������������
� ��������� �������������������������������������������� ������#������������
���������������������������������������������������������� ���������������
�������� �������������������������������������"�
�
�
��������� ��� ����������� �� �������� �� ��� � +���������� � �������� ���
,�������� ������������������-���������(���������������+�������+�����"�."�
'����� ����������"�/���0-� ���1� ���+���������� ��� ����-���������(��������
�������+�������+�����"�

� 2�
������ ������
������������ ����������� ��������������������������������"�������������������
���������������������������������������������������������"������������� �
� ���������������������������������3���4���#�� ���� �������������� ������
�����������������������������3��� ���������'������5�����������������32%%644��
�������������������������3���������6674���������������������3 ���������5�����
,��������,��������8������32%%644"������������������������������ �������#�� �
�� �����������������!�������������������������� �����39�����&������&��#�����
5���������:�'��#��2%%;<����������6624"������������������������������"���������������
���������������������������������� ������������ ����������������������������
������������������������������������������������������������ �������������#�����
� �������������������#�������������������������������!��������39�������2%%=<�
'��������'��������:�9�������2%%=<�����>�����?����������2%%64"����������������#����%�
������ ������������ �����&������� ��������'�����(���������3&�'(4���#�� ����������
� ������������������������3&�'+4���� ���������������������������������
��������������������������������������� ����������������� �������������3&�'4"��
������������ ���������$�����������������!��������������������������
������������ ��#����������������������������������������������� ��������� �
����������������������������������������������� ������������������������������ �
���������������� ��������������������� ���������������������������������������
���������������� �������"�&�'+��������������������������� � ������������-�
•���������������������������� ������������������������3�'+4���������������
�� �������������� ���������������������"������������������������
���������#���������������������� ����������������������"�@������������
����������������������������������������������������������������������
������������������������������������A���������������������������� �����������������
�����������������������!���������������� ���������$������������������������
����������������"��������������������������������� �������������������
����������������������������������������������������������������������� �
���������������������������������������� �������������������������������������
��������"�&�'+����������������������������������������������������&�'����
��������������� ����������������������!����������������������������������
���������<�
•����������)�����������������������������������������#�������� ������������
� ��������������� ������������������*���������������#������������������ �
��������#���������������������������������� ����������������������<��
•����������������������������� ���������������������������������������������A�
������#��� ��������������������#������ �#�������������������������������
��� ���������#����������������������������<��
•�@������������������������������������ ������� ������������������������������#�����
� ����� ������������������������������ �����������������������������
� ��������������������������������������� ����� ������������������� �
��������������)���"��
����������������������� ��������������������������������������������������
�������������� ��������� ���������������������� �������� �������������������
������3(����������&�����������!�������6664"���������������������������������
��������#���� �������������� �������������������������������������������������"���
������������������������������������������������������������� �����������������������
����"�@����#�������������������������������������������������������������� �
� 0�
������������������������������������������� ��������������������������
����������������"�������������������� �� ����������������������������#��������������
������������B �������� ���������������� �����������������������������#�����
������� ��������������������� ���������� ����������������������������������C3(��
��������&�����������!�������666��'������9"�"2"24"�D �����������&�'+��������������
�����"�������������)������� �&������� ��������'���������$'������� ������������
����������������� ����������������������������� ������������ �3��$4���������������
���������������� �������"�����������������������������������������������������
��������������������������#�� ���������������������������������3���������660<�
'�� �������"��2%%=4���� ������� ����������������������� ���������� ��������"�
&�#��������#����������������������� ������������������������� ���������������������
�������3���������2%%%<�&�����:�9�����2%%%4������������������������� ����� �����������
���������������������� �����������������������"������������������������������������
��������������������������39�����:�5�E�������2%%F<�.��������&������:�>�������
2%%F4�������� ��������������������������������������������������3.����������
�666<�'������2%%;<�8������:�'�������6664"����������������������������������������
������������������������ ��������������������������������������������������
B#���� ���C���������������A�����������������������������������������������������������*������
#����������������������������������������������#������������������������#�����
��������������������3,���������2%%=<�����8���:��#����2%%=4"��
�����������&�'(����������������$������������������������������� �������������
�����������3&�'+4���� �#�������������������������������#���������������������
������������������������������������������������ ������ ����������������������� �
������������ �#��������������������������� ������������������"����������
����������������������������������������������������������������������
������������&�'������������������������������������������������������������#�������
��������������"������������������������������������������������������#��������������
� �&�/G��+'����������������������� �������������������#�������������������������
�������"���������� ����������������������!�����������������������������������������
&�'(���#�� ����������������� �������������3&�'4������� ��������#���������� ������
�������������������������������������� ����������&�'"��
�������������������������� ����#"�������������������������������������
��� �������������&�'(���#�� ������������#�� �������������������"������������������� �
������������#����������������������� ����������������� �&�'���� ����������������
�������������������������������� ��������������������� ��������� �#����3+&�'4�
���������������������������� ����������������������#�� �����������&�'+�����������
������������������������ ������������� ����"�����������������������������#��
�����������������������������������������#���������������������������������
����������#�������������������������������� ����������#�� ��������������
���������&�'"�
�
����������� ��� �����������������
���� ������ ����� #���� �� ���������� � � ���� &�'(� ��#�� �� ��� �� ���� ����#��� ��� ��
����������� � � ���� ����������� �� �#������ ����� ������ ���� ������������ ��� ��������������
������������������������ �#�������������������������������������� ������������ �
�������� ������������"�
�

� 7�
� ������������������ !�"�#�#�����$�
����&������� ��������'�����(���������3&�'(4���#�� �#������������������D��������
� ��������667�39�����5��������:�'������2%%74"���������������������� �����������
� ���������������������������������������'������ ������5�!����*����?���������
��!����3��������H�!����4��9��#����5���#������������H���������������/�����"�����
&�'(���#�� ��� ������������&�'�#�������������������������� ���� ����������"�
���� ������������������������������������ ������������������ �#����3@�''4"�
'��������������#�� �#�� ����������#�������������������������������������������������
��������������� �������������3&�'4�#����������������������������������������
� �������������� ������������������������������"��������������#�� ��������������������
��������������������������� ������������ ��������������� �����������������#������ ���
������B����� �����������������������������C����������������� ������!������ ������
����������������������������&�'"�@���������������#�� �������������������
����������������������������������������������������������������������������� ���
�����������������������������35+�I4��������������������������������� �����
���������������#������������������������&�'��������� �#���������������������
�������"�
&�'(�'������ �����3&�'($'�4�#����������#�������#����� ��������667�����)����
����������������#����������#�����������������������D��������� ��������#I�
+���������� ����������&���������D��������� �8���������I�'������� �(������&������
39����:�&��������2%%%4"������������������ �#������������������������)�����������������
����8�������������#���������������������� �����������������������������������
����������������������������������'������ ����"�&�'($'�������������������� ���
��� ����$����������������������#������������������������ ��&�'���'������ ������
5���#���9��#�������������H�������>�����������������"����������������������������
������������ ��������������������� ��������� �#����3+&�'��"0����+&�'��"74�3���
����#4�#����������������������������������������������������������������3(&�4����
������������������������������������ ��� ����������� �����������������������������
���������������"��
>��������������+���������� �� ���������D��������� ����������&�'($������������
����������������������� ������ �� ��������'�����$���������������������
����������<������#��������������������������<�������������������
�������!�����#����������������������������������@�''�����������"�����������
����=������� �������������������������������� ���������� ����������������'� �����������
������������������� �&�'�����#�������$�������������"�'�����666������������������
������������������#��������������B&�'($��#�� C� ���&�'���������������� �������
�������������������������������� ���������������5�!����*������������!�����
������5��������?�����������/�����"��
������������������� �����&�'(���#�� �����B��#�� �� ������C��9�����������32%%74�
��������������������&�'���*�������B��#�� C������������������������������������
��������"�'��������������������������������������������������� ��#�3������
�������������� ���������������4�#��������!�����3�� ���4�� �����������������������
���������� ���&�'�3 �������������������������������������������4��������������
������������ �#��������������"��
�
� ���� !����%���&!�'���(���%�%(����)�����!*�&��%����)��!+%���
8�������������������������������� �� ������������� ��������������������
�������������������������������&�'(���#�� �39�����5��������:�'������2%%744"�������
��������#�������������������67%I�����#���� ���������� �#��������������������

� =�
�����#���������������������������������������������3?����:�����������6604"�����
������������������������������ ������������������#������������ ������������
������� ���������������������������)������'���������������;%I����J%I"����� ����
������������������������������������)����#��������#�����#�� ���#���#����� ���������
�����������������#���������������������#�����#������������ ������������������������
����������������������39)�� ���?���:�E�����6J;<�'���������6;64"�����������
���)������ ������#������������������������������������������������#�� �����
������������������������#�� ������3���������:�E�����66�4"������������ �� ��������
������������������������������#������������������������������������������������ �
�������#��������������������������������������������������������'������������)����
#������������������� ����������������� ���������������� ���������#������'������
39�����5��������:�,��������66=4"��
9������������������� �� ������������ �� ���������������������� �������������
�������� �������������������3��� ������������������������� ��������� �
���������������� ����������������6624���������������������������� �����������
������������������������ ������������������������� ������������������ ���������
3+������6J24"����������������+����3�6J24�����������������������������
3����������������������������������������������������������4�������������������
������������������������������������"�'���������������������������������������������
3E������������"���66J<�5���:�5���������2%%%<�'��� �����������:������ ����6624"��
������� ����#�������'������������������������������ ����#���������������
����������������#�������������������������������������������������������������� �
����������������������������������������������������������������39�����&������
&��#�����5���������:�'��#��2%%;<�E������������"���66J4"�
��������������������������� ���������������������������������������������������
�������������������3���������:�5������6604-���
•�������������������������������<��
•�������������������������������������� ���� �� ��������������������#���
����������������<��
•� �������������������������������������������������������������������������������������
������������������� �������������#�#�� ������"�
��������������������#����� ����#��#��#������#���#�������������������������������
������������������� ���� �������������� ���&�'+�������������&�'������������ �
�������"�&�#�����������������������������������������������������������&�'�������������
����������39�����5��������:�'������2%%74"����������������������������������������������
��������������������� �#���#���������������������������!��"�&������#�� �������
����������������������������������������������������������"�D������������������ ����
����������������������������������� ��������������������������"�����������B�������
�����C������������3��������07�4"�@����������������������������������� ������������� ��������
����������������������� ��������� ������������"�
�
� �,����&%����'�"��
��������������#�������������������#������������'��������8������32%%=4��������������
�������������#�����������������������������������!�"�+��#���������� ��������
� ���������������������������������������������� ��������� �����������������
���������������������*���������������� �B��������������#�� ��������������������C�
3���������704"�������������������#�� ������� ������������������ �#�����
� �����������������������������������������������"�����������������������������
� ������������� ����������������������� �6�(&�� ������������76���������������=%%�

� F�
������� ����������������������������������������������#�������������#�������������������
�����������������#�����������"������������������������������������������� ����������
���������������!���������� ��������������������������������������������������������
����� ���39�����5��������:�'������2%%74"�'����������?�����3�66F4������������
��������������������������������� $���������"�'��������������������������������� �
���������������#�������������� �����������������������������������������������
�������������������������� ����������3?������66F���"�0F4"�
9����������������������#������������������������������"����������������
��������� �������������������������39���*�����+���������:�>)��������2%%2<�,������:�
5��������2%%24�������������������"�'��������8������32%%=4���������������������
�����������������&�'($�������������#���������������������#������������������
�����������"���������������������������������������������������������� �������������
����������������������#����������������������������������������������������������#����
������� ������������ ��*������������������������������������������� ������������������
3� ���������������������������������������������������������������������� �
������������������������������� ����� �����&�/G��+'���������4"��
D������������� ��������&������� ��������'�����(����������������������
?��������������������������#������������������������������������������ ��
�����������������#�������� �#��������������������������������������� ������
��������� ������������������������������������� �������������3'��#��5�������:�
9�����2%%;4"������������������������������������������������������#��������
������������������������������� ����������������������������������������� �����
�������������������������������A����������������������������������������������#����������
����������������������������������������������� ����������������������������
����"��������������� ����������������������A�#�����#���������#������������������
���������������������������������������������� �����������"��
������������������������������#�����#����������������������������������
���������������� ��������������� ��������� �����������������������������������������
������39�����&������&��#�����5���������:�'��#��2%%;4"�+�����������3������
�� �������������������4������������������������� ���������������������������
#����������������������3 ����������� ����������������������������$��������
���������!�������������������������� ����#�������������������������������� ��#�� �
����4������������� ����������������"�9������������������ �������� ��������������
������������ �������������������������������������������������������������������
��������#����������������������������������#��������������������#�����
������������� ��#�� �����"��
+�����������������������������������������������������#����������������������� �
&�'��������������� ��������#�������������������������������������������#����������
����������������������"�����������������#�������������������������#���������
��������������������� �����������������������������������������������������������
���������������������������������*������������������"�����������������#����������
&�'+���'������ ������5���#��������������������� �����������������������������#�������
������������������������������������������������������&�'+"��
�
,�"����"��-��.������/���.�� �����#.����������"��"�#�
�##����"�
������������#����������&�'+��� ������������3'������ ������5���#���������������
H��������������������� ����������������������>������4������������������������� �����
&�'(������������������������������������������� �� �#������������������������

� ;�
�������������&,����������������������������������� ����#�������� ��������#�� ���
��������&�'+�����������#���������&�'+����&�'����������������������������
�������������������&�'�����������������������������������������!�������������������
�����������������������������������"��
�
� ,��"� �%������ ��'�%����+�%���!$!���&�+�'�0��!��!*!&�($!���
�
����������������� �������������������� ��������������������
8�����&�'+���'������ ��������������������������������������������������� �������
�����������3,����������"��2%%J4������������ �������������������������&�'+���� �����
������������������������ �����+&�'"�����+&�'������������������������������������������
��������������������39����:�&��������2%%24"������ �#��������������������������
���������������������������������� �������������������������������������������
��������39�����5��������:�'������2%%74�����������������������������������������
������������*�����������!���������� ������������������#�������������"�5���� ������������
+&�'������������������������� ����������'������ ����������5'������������
�������������������������� ���"�8�����������#�������������/9������������.���������
���������������"��������������� �#�����������#�� �����������#�������������(�+�
�����������+&�'2"%�����������������������#���������#��$���������� ����
������������������������������������� �����+&�'��������"�8��������������������
� �+&�'2"%��� ���������������� ������� �������� ����������������������������
���#��G?�����������B�����I������������������������*��������������������������� ���
��������������B�����$ ���C����@�''"������������������������������ �������������������
����'������������������������������������������?���������������/����������
���������������������������������������#�� "������������������� ������������
������������ �+&�'��"0����+&�'��"7����������������� ����"�
����+&�'��"7�����������������������������������������������!���������������������
���������������������������"������������������������������������������#������������
����������������?������������������������������������ �������������'����� ���"�8���������
� �#�����������������@�''�3������������������������� ������������������������ �#����
�� ���#���4�����������������*�����5'���������5'�?����������8���#����������
��� �����"�����������������������������������������������B��������C�@�''�
������������������������������������������������ �8���#����5'�� �����������������
��������'������ �����39����:�&��������2%%24"��
�������������������������������������������������� �#������������������-�
•������ �#��������������#����������#�� ������ ��������������������������������
� �������������������������������������������������� ����������� �����������#�
����������������������������������� �#��������������������������"��
•������ �#�������������������� �� �������"�
•������������������������������������� ������ ����������������������������������
����"�,����������������� �����������������#���������������������������������
�������������������� �������������3��'4��������
•�,�������������������������������������������������������������������������
������������������#�� ���#��������������������������������������������"��
•�����+&�'�����������������+����8��������#������������������������ ��������������
� ��� ������ �#�������������������������� ���������������"��
��������������+&�'������������������������������������!�������������#�� ����������
������������"�������!���������*���������#�����������������������������������@�������-�

� J�
��������������
��������������
1�!(���%��������%�2
��!$%3(!�$��!�������2
������������
� �����!���"���
����%�!������+!��4$��� &)5�0!!�&)5�
6����!�&)5������&&)5���%&)5�!��7
�������� ���#
�������� ���$
�������� ����
���*!)������+!�
�������� ���#
�������� ���$
�������� ���%
�������%+��%���&� %!���� )
�� ��������� !����������%+��%���&���%�+
������� ��!���������"����������#�����������$������
�4� ��������������������������A������������������������������������
������������������� ���������������������������������������������A�
��������������������#������������������������#������#����������������
�������� ���������������������������������� ���������������������������
��$�������������"���������������������������������������������� �������������
������������������������������3������������������������#��������!��4�����
���������������������������������"�������������������������������������
���������������������������������������������3 ��������������$�������
���������� ���������������������������������������������� ������������$
������������������������������������������������������������� ��������$
�����������������������������������������4"�
�4� @�������������������������������������� ���������������������"�+����
�������������������������������������������� �������������������
#������������������ ����������!�������"�+� ��������������������#���
������������������������� ����������� ������������"�,�����������
���������������������������������������������3�������#�� ������������
������4"�'�������������������������������B������������C����#�� ���
���� ���������������������������$��������� ��*����������������������
��������� ��������� ���������"�'���$�����������������������������������
��������� ��*�����"�@��������� ���������������������� �#����������
������!���������������������� ����������������������� ��������"�
�

� 6�
�!����( %��
+��&%��
8�(%&���
+%�!+�
���(!
�&&��'�
���(!
�������(!
�&&��'�9�.�:�$;%6�!�
(%&��
.�&�0%�
�&&
�%�!�%��
< ,�
+���!+
9��:%;���
=�#!$;�
�� %�(%��<
+�$!�
�!�%��+
�%�!�%��3
>��+���!+
���+0����
"�?� �
�%;!�%��<
+!&!��!��
�����%!+
�%�!�%��3 �&&
9�$;%��< �&&
�%;!�%��3 �&&
��'�0��!�
-����%���&%�)�
!@(��+%��
���&)�
(�����)(!+�
�'� "��%��
(%&��+
"�*�,�
�+!��%��
��&&3���
���*!)�=�
���%��
'����%��+
.�&�%3
&������!�
!��;&!$!���&%!���
+��%+'���%���
+��*!) .�A����!*%+%���
�'� "��,����
"��8�;!�%�+
�.��$���&!5�
�!;3;�+!��
�!(���+5�����
����.���&!5�
���(+ ���
*%!0!�
�
���!�+!��
+��(!��'�
�+!�����++�
(�����$+
#"��
�++!��%�&�
���+!�
"�+(%��&�
���+!�
����+(����=�
�.�
-��%&%�)��!$%3
(!�$��!���
���+!�
#.����"��
����
���%���&�
�!��%��)�
+!�*%�!+
"�+(%��&�
�!*%��&%+��%��
(�����$
-%����%�&�=�
%+��%���
"!�&� �
�@(!��%���!�
�!*%!0�
���+!�+
����!��%�!&�
+��*!%&&���!�
����+!�
"���!�*%�!+�
$�((%��
�����!�%��
#&���%���=�
B����!�&)�
�!(����
���+!�
.�++�
����%���%���
��$(�%���
���+!�
���%3
�!���*%%��&
� !��()�
���+!�
���%�%���&�
+!$%3
(!�$��!���
����
��*%���$!��
�&� !�&� �
����+!�
�� ��&�
!�&� �
����+!�
�CCD �EEE �EE, �EEF�CCG �CCC �EE� �EE� �EE8 �EEH �EED �EEG
#��%!���
.���&!
������% &����"�������������������������������������!����
�&��'������"��������������������������������
@������2������������������������ �����+&�'�� �#����3 �����������������4"�����������
� ���������������+&�'�� �#��������������������������������������������������� �����
����������'������ ����������������� ���������������3����������� ������ ������
����������������������������#������3���������2%%7<���������:���������2%%7<�
5��������9�����:�9)����2%%=44������������������������� ������������������ �������
���������� ����������3����������������� ��������������������������������+&�'4�#��
�����"������������������� �#�������������3�"�"��������������������������� �5'�?�����
������������������������������������� ���������#����
������2%%%����2%%0�������������������������5'������ ����������4������
����������������������������������������������� ������������+&�'��������"�
������������������� ���������������������������� ����� ������ ������������������������
������������������+&�'�����������"�@��������������������������������
������������������ �#��������#���������������� ������ �����������$�����������
��� �����������������+&�'"�'����������������������� �������������������3����������� ���
���� �����*���� ��������������������������5���#��A���������4�����������������������
� ������� ��������������������+&�'�������������� �������������������������������
'������ �����������������������+�����'�����������,��������'�������H�����"��
8����� �� ������� ���� ��� � � ���� � �#���� �� '����� � ����� ��� ������ ���� ������ ���
���������� ������������ ������ ���� ������� ������ #��� ���������� ����������� ��� ����
��������������������� ������� �����+&�'�� �#������������ �'������ �����������-�
•�����5�!����*���������������� ���#�������#��������� ���������������(���������
��������� ���������������� ���B�����$���������������C������������#������ ����

� �%�
�������������� � ������������������������������?�����A����������������������
������������8���#�K��������������"�����������������������������������
'�����3����4��(���������35�!����*��4��5��������,�������������"�
? ������������#��������������������������������'#������3��!���4���������
3�����(�����������4��E�����3E����� �������4"��
•��������� �����+&�'���?����������������������D��������� �����������
��������������+?9��'� �#���� ������� �������������������&�/G��+'����$
,�����������������"�'���*������������������ ���������������������� ���������
������ �������������'������ �������������������������������������������� �����
+&�'"��
•���2%%;������&�'($'�������#����*��������������������������� �#���� �������
&5�'���H�����"�������������������������� ��� �����������#��������� �������
��������������� ���������������������"����� �����������#�����������������
����������������+&�'������#�����*������������������B���������#��C�
���������������������������"�
•���E���������������������������������������� ���5��������3��54�������������
��������������������������������������������� �������� �&�/�����������������
��#���������$���������������������������"��������������#���������� ������� ����
������������������������������������ ��������� �#����������������������
'������ ����"���������*���� �������������������������������� ������������������
���#����������������������������������������� �����+&�'"��
��'������ ����������������� �������������������������������������� �������������
����������� ��������3 �������������������������������3(&�4�������&�������������
?����������&������������ �������������������������4��������� ����������������
+���������� �&������3+�&4�#���������������������� �L���������,������������������
��������"���������������������� ���������� �������#����������������� ���������������
������ ���������������������������+&�'��"0�����������������������������������
&,���� ���������������������3(������� �@������04"�8�������������������� �
+&�'��"7�����#������������������������������������+&�'��"0��������������������
����������������+&�'��"7�3(����2�� �@������04���������������������������������������
������������ �����L,'��������3(����0�� �@������04"��

� ���
����#(%�
�����&)������!�
*�������
+,��
,���
���������
����#(-
�&
�����
�����!�
�&.�
����#(%�
��/��&
����#(-
����
0�������
'����������!�
*��������
+,��
,���
# �+!���< #�(!�3;�+!���!(���+�
'��$�*��%��+�+����!+���!��+!��
���(�����!�� !�B����!(���I
��� �������������&�����
1����#(%��������������������
��������������!��!�� �����
�������"�����"��������&�����
+,���������
# �+!���< #�(!�3;�+!���!(���+�
'��$�*��%��+�+����!+���!��+!��
���(�����!�� !�B����!(����;���
%��!����%���0%� �� !� "�� �+�
;!!��!''!��!�2
����������������������������
���������!��!�� ������������
"�����"��������&�����+,��
�������
# �+!�,�< "��8������
0��! ��+!��&&�0+���!��%����'�
B��� ���+!�I
��������&�������������
�������������������"� ���
�����!�"�������������
������������ ��������&������
�� ������������"����+,��
����
�����
�����!�
�&.�
�����
�����!�
�&.�
)������!�
*�������
+,��
,���
������' &�������������������������������!�����������
8���������+&�'�#����#��������������������#������������� ��������� �� ����������
����������������������������� �����������������������+&�'��"7"�������������������
���������������������������"��������������������������������#��������������������
�� ����������������������������������"�+������������������������������������������"�
@����������������������������B������>����9����C�����������������(&��+�����������
������������������������(&������������#����������&���������������������������������
�� ������������������������������������"�������������������������������������������������
(&�����������������(&�����������������������#��������������� ���&�������
5�������"�8�������������� ���������#������������������������� ������ ���������
#����������������������������������������������������������"���������������� �
�����������(&����������������������������������������������������������������
�������������������������������������������������������������������������������
�#���� ����� �������������"������������� ������������������������� �������L,'�
����������� ������������������� ����������������#����� ������������������������
��������� �����"����#�� ����������������������������� ��������� ����������������
��������������������� ��������������������������������� ����#������������
��������� ���������"�����$��������� �������������������������� ���������
�������"�������������+&�'����������� ��������������������� �������� ����������������
��������������� ����������������������������������������������������������
����������� �������������� ����#�� �������������������#����������������������������
�����������������������������������������"������������������� ����������������������

� �2�
������( "���"���)���*+!�����������,����
"�� ���;�+!��@(��+%����*!���E�)!��+
3
#
$
%
-
4
5
6
7
8
#3
#887 #888 $333 $33# $33$ $33% $33- $334 $335 $336 $337
.%&&%��+��'��!����+�%������;�+!
3
%3
53
83
#$3
#43
.%&&%��+��'�(��%!���!������!�+��+��!(�!+!��!��;)�
���!�����!�����
�����������������&��� '�������
#��%!��
�������!�+
4�%� ���@%+7
���;�+!�
�!����+
4&!'���@%+7
���#��� ��������������� ������������������������!��������������*�����������������������
����������� ���������"����������������� �������������������������������"�
����������� �������� ��������������������������������������������������� �����
� �#����3#�������������������������������������������������� ���������������������
����������������� ������� ����� ������ �#���4���������%������������"�����������
B��!���C������� �����������������,������3�6664������������������������� �����@�''�
������������#�������������������������������� �������������B���������C������������
������ ������������������������� �#���"�����������������������������������#������
����������������������������������� ������������� �����������������������!��������������
���#���������������������� �������������������������!��������������������������
����"��
���������������� �����B��!���C��������������������������������� �#��������������
B���������C39�����&������&��#�����5���������:�'��#��2%%;4"����������������������� �
�#�������������������������������#�������������� �&�'�����������#��������3����
������������������������� ������������4"������������� �����B���������C�#������
����� �������� �����������������3�"�"����������������� �������������4"�����+&�'�����
��������� �#��������������������������������������������������������������������#�����
��������� ���������������������������������������#������������������"�����������
��������������������B���������C"�����B���������C�#�������������������������������������
������������!����������������"��������������������������������������������������3#����
������������ ����+&�'��"0����+&�'��"74�����������������������������������������
�������#���#������*��������������������#���������� �����"�@������7���������������
���������������������������3�������������������������4�#���������������� ��������
����������������� �� ���������������������3�666$2%%24"��
�
��
�
�

� �0�
� ,��"�$����!+����!���(��%�)���%&�%���
8���������������������� ���������������������������#�� ����������� ���������������#�
����#���������������������������������������� �����������������������������5���#�"�
��������������������������������� ���� ������������������ ��������������������������
�����!�������������������������3��I4���������������������������+&�'"�����������#��
��������������������������������������������� ������������ �����������������������
����������������� ��������������������#��������������������������������
���� ������������������������������"�������������������������������*�������� �����������
��������������� �������� �������������������������*�������� �����"�8�������������
��������������������������������� ����#�������� ��������#�� ���������������� ��������
����������������"�>�������������� ����������� ��������������� ��������������
�����������������������������"�
�
�������������/�����!��)�����������������9"�����
+��������� �������������$���������������� ������������������� ��������������������
� ���������������������������������5���#����2%%=����������������� ����������������
����������#��� ���#��������������������B� ������������C��������������#���������
������������������"�����������#���������������������������������������#����������
������������!�����"��������#�� �����������������������5'�?�����#�� ������#�������������
������������ �#������������������������3�"�"�������������������3�"�"�7%5���
������������7%���������������������4�����������������������#��������������
������������#��4"���������������#���� ����������������������������� ���������
���������������5'�?������������������������������#������������ �������������"�
��������������������������������������� ���������������������������������������
���#������������������������"�����������#������������������ ��������� ���� �������������
���������3���#�������������������� ��������������������������������#���������4�������
����������#�������������� ���� �#���������������3�������������� �����&�'(�����4����
B�������������C��� ����������+&�'�#������������#����������������������� ���������������
3������*���� ������������� ����������������������������������#�������������������� �
+&�'�7�(������5�������������� �#������������������������������ ��������������
������������������������ ��������������������������������������,/��������4"�����#��
�����������������������������3?(,4���������������� �����#���"�,������������������������
B������������!����C��������� �����+&�'���������#����������#���������������
����������� ����3������������� ��������������������4������#��� �#����������� �
���������������������������������������#��������������������������������������
����������������������!��"�����B�������������C��������������������+&�'������
����������� ���������������������������������������������� ���������������������"���
������� ����������5'�?������������������������������������������������������������������
�������!��"�������#�������������������������� ������������ ��������������������������
���� ��������3�"�"��������������������������� �������������������������������#��������
#���������������������4����������������"�@����������� �����#�������� ����������������
��������� ��������������!����������������������������=%M�� ���������������#���������
�������� ��������#�������������� ��������*���������������B���C� �������"�
&�#�������������������������#�����#�����������#��������"�������������������#��
����#���������������������������������+�������� ����"��������D'9����������������
�����������8���#�6J����������������������������� ������ ������ �#�������������"��8��
��������������������������������������� �������������#��������������������������
8���#�2%%%�����#�������������������������������������������������� ����������������"��

� �7�
?�����������������������&�'(���������������#�����������������������������
����������� �����������������+&�'�� �#����������������������������������������
������ ��������5'�� ����6;��6J�����2%%%�3���������������������� ���5'�� ����6;�
�����������4"�� ��������������������������������#����������������������������������
��������������������������������������"�9���������������������������������#����
�������������������������������������������#�������� �#���������������������� �����
����#���"�9����������� �#������B����������������C����������������������������
�������������������������������������������B ������C�������������������������������
���������� ����"��
�
&��' ��������"�������������"��!&�����������������
-.!��!��/��������0����)�������������������������������!�����������1&�������
��!��������!����������!�����������!������1&������#�����!��!��������������������
����������������������!��1&������������������������������)��������������������
��������������������������������2�31/4�������1%,,%0
�
������ �������������������������������������������������#����������������������
3��I4������������������������������������������������������ ��������������"�������������
������ ����������� ������������������������������������������������������������������
������#����������������#������ �����������������������������"�?��������������������
� ������������#���������������������������� �������������#�������������������
��������������������������������#���������!������������������A��� ���������������������������
��������������������������������#����������������+�,������������������������������
�����)�������������#�������������������������#����������+��������������������������
���������������� �������� ��������������N��
������������������������������ �#�����������������������������������������������
������������!����������� ������������-����������������������#��������������������
� �������������������������#����������������������3��������������&�'($'������4��
����������"���������������� ��������������������� ����������3����������4�A�������
�������������������������������������� ��������#���#�� ����������������*���#����
������������������������ ������������������������� ������������"�D�����������������
���������������� ������������������B����������������������������#��������O"C�����
#��������#���������������������� ���������������������������������#�������
������������"�&�����������������������������3��������������������������������
�������4�������������#��������������������� �����A���������������������������������
�� ������������� ����������������������"�9�����������������#��������������� � ���������������
������������������#�����������"��
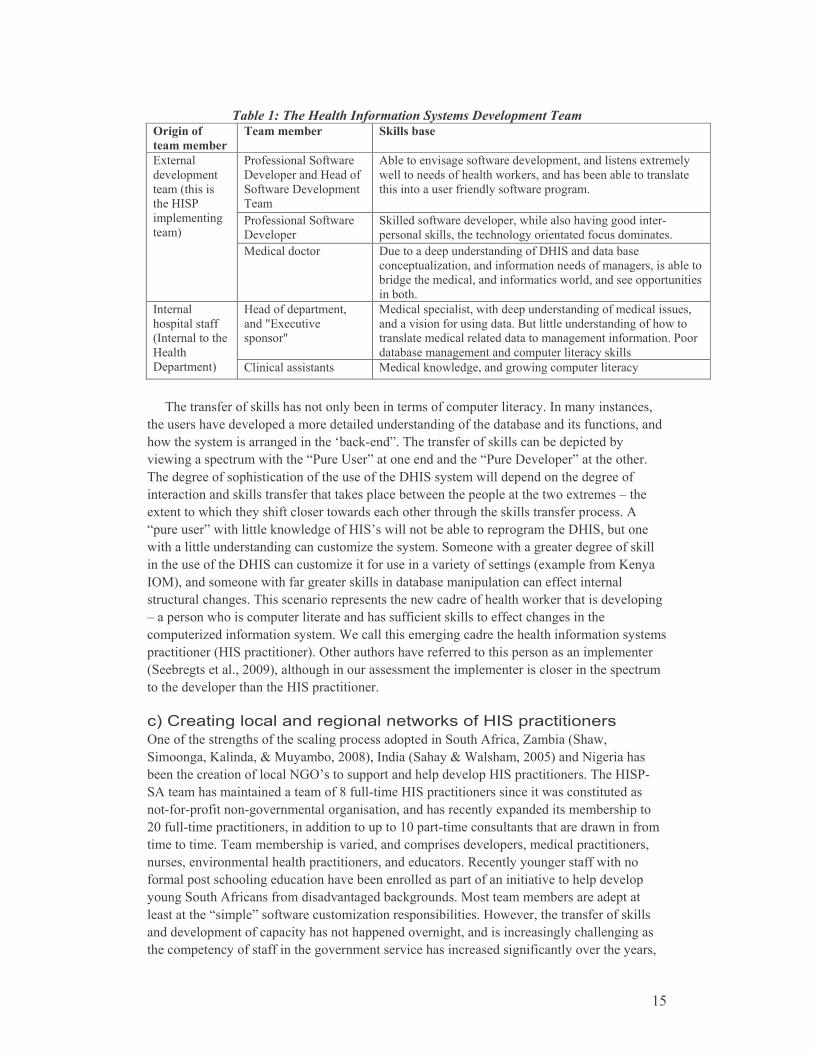
� �=�
������������������� �������� ������������������ �������
������� ��
�����������
����������� �����������
(�� ������'� �#����
+������������&����� �
'� �#����+����������
�����
���������������� �#����������������������������������
#������������ ��������#�� ������������������������������
�������������� �������� �#�����������"�
(�� ������'� �#����
+���������
' ������� �#���������������#������������������������$
������� ����������������������������� �����������"�
?�������
�����������
�����3������
����&�'(�
�����������
����4�
5�������������� +������������������������ �+&�'�������������
����������!���������� ������������� �������������������
������������������������ ��������#������������������������
������"��
&����� ������������
���P?���������
����P�
5�����������������#�������������������� ��������������
���������� �����������"�9��������������������� ���#����
������������������������������������������ �������"�(����
�������������������������������������� ����
�������
���������� �
3��������������
&������
+��������4� �������������� 5������� �#�������������#���������������������
�
������� ���� � �������������������������� ������������������"��������������
�������������������������������������������������� ������������������� ����������
��#��������������������������Q��� $��C"�������� ���� � ����������������������
���#�������������#��������B(����D��C�����������������B(����+��������C�������������"�
������������ �������������� ��������� �����+&�'������#������������������������ �
������������� ������� ���������� �����������#����������������������#����������A�����
���������#������������ ����������#��������������������������� ������� ��������"���
B��������C�#����������� �#������� �&�'I�#��������������������������������+&�'���������
#��������������������������������!����������"�'������#���������������������� � ����
���������� �����+&�'����������!����� ������������������� �������3�������� ����E����
��54�����������#���� ����������� ����������������������������� �����������
���������������"�������������������������#�������� ��������#�� ��������������������
A��������#������������������������������ ������ �������� ����������������
���������!���� ������������"�8������������������������������������� �������������
������������3&�'������������4"��������������������� ���������������������������������
3'�������������"��2%%64������������������������������������������������������������
�������������������������&�'������������"�
�
���/�������������������������������"����������������
���� ������������� ���������������������������'������ ������H������3'��#��
'��������E�������:�5��������2%%J4�������3'�����:�8�������2%%=4���������������
����������������� ����������I���������������������������&�'������������"�����&�'($
'��������������������������� �J� ���$�����&�'��������������������#��������������
��$ ��$��� ����$������������������������������������������������������������
2%� ���$��������������������������������������%�����$�������������������������#��� ����
������������"���������������������������������������������������������������������
�����������������������������������������������"�,���������������� �#������
���������������������������������������������������� �����������������������������
�����'������ ����� ������������������� �����"�5����������������������������
������������B�����C�� �#����������!�����������������"�&�#������������� ���� � ����
��������������� �������������������������������������������������������������
��������������� ��� ������������������������������������� ����������������������

� �F�
����������������� ����������������������������������������"�&�'($'��������
��������#���������������#�������������#��#��������� ����������������������3#�������
#������������������� �������������4��������� ������������������������������#����������������
�����������"��� ������������������������#������ ����� ������ �������� ��&�'($'������
2%%0������������������������������������������������������������#������ ���������� �
�����������������������������2������ ��������������������������2� ������������������"��
���������������2%%0��������� �������������&�'��������������������������� ������
B��������������C����������������������������������B���������������C� ����
&�'($'��#�������������������������������"��������������#���������������������������
����������������� ����B��������C����&�'�������������A�������������������������������
����� ������������������"��
��H������������������������������3#�������������������������� �#����
�����������������4������*��� ���������������������+&�'� �����������������#�������
�������������������� ��������������������������������������������������������
5������� �&�����"�&�����������������������������������������������������������������
��?��������������������������8&��?������������������������#���������+&�'"�8�����
����� ���������������� ���������� ����$ ������!�����������������#���B�����
��������C�&�'��������������������������#������������� �����������������
���������������A��������� ��������������������������������#�������������
����������������������������"��
������#�� ������������������������������ ���������������������#� ��#�������
������� �������������������������������������������������������(�+�����������
����������������������� �����3'������ ����$�D��������� �8�������������D��������
� �(�������<�5�!����*���A�D����������?�������5�����<���!����A�D��������� �+�����
'�����<�?��������A�D��������� ����������D��������� �����������4"������������
������ �������������������������������� �����������������"������������������������
�������#������������� $����������������������������� �����(�+�#��������D��������� �
���"�&���������������������������������������������������� �����+&�'2����������"�&��
�����������������������������5,'���������������������������B'������� �����C�
�������������������������������������������������� ���������������#�� �������
&�'+����������"��������������#��������&�'($��������������������#��������������������
���������#��������B������B����������������#����������������������������������
���������������������������� ���� ����#�� "�'������������(�+������� ����>'?�� ���������
��������������� �����#�� ��������������� ����������������������������������&�'�������
�������������������������#�������� ������������������������ �����������������������
��������#����&�'+������� �������������&�'($������������"��������������������������
������������� ���������#�� ���������������������������� �������������
�������������&�'+���������������������������������������B��#�� �� ������C�
���������39�����5��������:�'������2%%74"�
�
� ,,�"�� !*!&�($!������� "��$(&!$!����%���
����������������� �������������������������������� ������������������������
� �����������������������������"���'������ ���������������������������������������
������������� ������������������������������������������������������������"������
�����������������������������������������������������#�����������!������������������
�����"�����B���������������C�����������������������������������������������������
�������������������������������������������������������������������������������"���
'������ �����������������������66;����#������������� ���������������#���������������
2%%��39����:�&��������2%%24"�+�������������������������3������;%M�#������������� �

� �;�
���� ��������������������������6%M�#�����0������� �������� ����������������4"���
����������������#������������H���������������������������������������������
(��������$#����������������������"������������������������#�������!�������
����������������������������������������� ��������3���������� ����������������������
� ��������� ����������������������� �����������������#���#������*�������������
��������5�&����������������������� �&�'+�������������$������������������4�#�������
��� ������������� ������������������������������������������"�����������#��
�������������������2%%;�����������������#�����������������������������2%%J"�
����������������������������������#��������������������������� ����������������������
�������������������#��������������������� ������������ ����������������"�����'�����
� ���������������������������������$������������������!���������������� ���������������
�������������"���>������������������������������������������#����������������������
�����������������������������������������=�������"�
������������������������������� ��������� �������������������������"�����������
���� ���������#������� �#���������������������������3>��I4�3�������������#����=$2%M�� �
����>��I���������4�#�����������������������"�'�� ��� ���������#����������������������
�������#������� ���� ������������>���������A����������������#���������������������������
��������������� �����#�����������������#���������������� �����&�'�����#���������
�������������������������������������� ������������������������ ���������������#�������
�#���������������������"����#���������������#��������������!�������� ��������������
����������������#������������������������>��������"�(�#����������������>���������#��
���������������������������#������������������� ���������������������#�������������
����������"��������������#���7$F���������������#���������!��������������������������������
����� �������#����������3'��#��5�������:�9�����2%%;4"�� �������������� ��J�����������
�����#���������������������������������� �����>��I"�8�������������#���������������
���������!����������������������>����������� ����2������� �������������#�������������
���������������������������������������������� �>��I�3���������!��4�������������������
�������������������#�����#����������� �������������� ��������������������������������
�����������#����������������������������������� ���������������"��
&�#������������������������������#������������ ��������������������� �������������
����������������������������������������������������� � �������������������������������������"�
@�����������������#�� ������ ����.���#��'����������������������#�������� ����������������
>�����������=2M�� ����������!�������������������������������7������� ����������
����������;2M�� ��������������!���������������������"�'����������#�������!���
�������������� ���2%%F������=��������"FM�� � ���������������������� ���=2"=M�� �����
���������"���������������������������������������������������������������������
��������������������������������������������������������#����� ����#������������
�����������������������������������������������������#�������� ���������� ������
�������� ������������������� ��������"��

� �J�
����
:'�/:'�/ :'�/ :'�/
$-;6
�
��(!��HEE5EEE�(�(
,38�(!��+���!
J�.�(�(���*!���!
��(!���EE5EEE�(�(
��3�F�(!��+���!
��(!���H5EEE�(�(
8E3FE�(!��+���!$-;6
�
$-;6
�
$-;6
�
������' &��������������5�������!!�����
����������������� ��������������������������������������������������������� ��������
������>��I"�������������������������#�������������������������� �B���������C�
����������������>����������"������������������B��������!��������C�������������������
� �&�'"�������������������������������������������� � �������������������� �����������������
� ����������������� �������������������������� ��������������������������������3���
@������=4"�'���� ���������3 ������������������ ����������������������27�������������;�������
#�� 4���������������������$������������������� ������������������"�5���������������
����������������������9����?����������������������39?��4� ������������������� ���������
#��������������#��������������������������"�������������������������*�����������
�������!��������#��������������������������������?����������������������3�?��4�
��������"�����B�������������������C���������������������������������������� ����&�'�
�������������������"������������� ���������������)��������������� �����������������
�����������������������������6��������������������� ����&�'+������������������������=�
��������)�����������"������ ��������� ��������������#�����������������������������
���)����� ���"�
������#������������������������������ ��������B�����������������������C����������
���9����������2%%7����07%4���������������������������������������������"�9��������
B��������!��������C����������������B�������������������C��������#��������������
����������������������������������������������������������������������������������������
����������������������������������������"������������ ������ �������������� ������� �
����������� ������������������������������������������������������ ������������������
������������������ ������������������������������������������ ���������������
� ������������������������"�
���������*���� ��������������������������������������������������������*���������
#��������������������������������������������"�&�#�������������������������������
���������������������������#��������������� ���� ����������������������� ��������
��������������������������*�����������������������������������������������������
�������������� ������������ � ������������������������������������������ �������� ���������
���������������������� �������� �������������������������������������������������
��*�������������*������������"�

� �6�
������( �����������6��7���8�����9��)��������������������
8�����/����� � ��������
���������� ���� ����������������������������� �&�'��������������� ����������� ����
� ������ �#���"�8��������������#�����#�������������������������������� ���������
��������#��������������������#������������������ ���������������������"������� ����
#������!������ ���������������������������������������&�'+���� ����"��
�
� 8����'�0��!� !*!&�($!���%����((�����'����&%�������++��0��
��$�%�+�
����������������������������������������������#��B�����C"����������������������
�������������������������������"�+� �������������������������������������������
����������������������������������������"�'����������������������������������
����������������������������������������������������� ���������������������
������������*�������� �������� ������� ��������� �����&�'�3������������� �#����
�������4�������������������������������������A��� ����#�������������������
���������������� �������������� �������#���������������������������������������4"�
9������������������#�����������������3 ����������������������������������4�����������
�������������������������������������#���������� ������3 �����������������������������
���������!�������������������������������!���������������������������������
����4������������������������������&�'�������������3����������4������� ����
�����$����������������������!�����������������"��
������ �������� ������������������������� ��� ���������������������&�'�3���������
������������� ����������������� ���������4��������������������"��������������
�����������#���������������� ���������������������#��������������� ��������������� �����
����"����������������� ���������������*�������������������������&�'�������������������
#��������B�������������������C���������"�������������������������������#�������
������������������������������� ���������#�����������������!����������� ������������� ����
���������������������������� ��������������������"��
�����������������#�����#����������������������������������������������������
� ����������� ����� ������ �#����������������������3(&�����������������������������
���������������������4"������������������������������������������� ���������������
��������������������������������������������#�����������������������������
���������������������� ����������������������������������������������"���������#�����
���� ����������������������������������������� ��������� ������������������ �����
�����#�������������#�� �#����������������������������������#���������������
������������������!��������������������������������������������!���������������"�@���
�����������H�������������������������#���������������������������� �����+&�'��"7�
��������������������������������������������#����������#������������������������
������������������ �����������������������������������������������3@������F���#���#�

� 2%�
�� ������������ ������������&5�'������#����������������������������4"�8���������
������������#������������� ���#��#����������!���������� ����������������������
�������������H���������������#������������������������#�����������������������������
�������������������������"��������������������������������������������������
������������������������������������������������������������3��������������4��������
�������������������� ��������#��������������� ��������"��
����&�'(�������������������������������������������� �������������3������
���� ������������������������������� �������������#���������3��������� ��������44�
������� �������������������$�����������3�����������������4����������������
������ ����� ���&�/G��+'�� ������������"�8������������������������������� ����
�������������� �&�'������������� ���������������������������#�������������
�����������������������������������������#������������� �������������������� ����
�������������������������������"�
�
� 8�� !*!&�(%���+�+��%��;&!�+)+�!$+�%���'�%���
8���������������������������������%�������������������������#�����������������������
� ��������������������������������&�'+����������� ��������������������������������
� ������������������� ������ �#�������� ������������������������"����������#���� �
������������������������� ����������� �������������#����������������������
������������������#���� ��������������������������������������������������
������������������"�����B����C������������������������������������� ��������
�������������"�9���������9�����������32%%;4�#��������������������� �������������
�� ���������������������� �#��"��������������$�����������#�������������!��������
���������������������������������������������� �������������������������������
� �������� ������������������3#������ ����������������������4��������������3#�����
����������������������������4"�������������!������ ������������������#���������
����������������������������������������������������������!���������������� ����"�
����� ��������������������� ������������������������������������������������
3������������������������ ��������#��������������������������������#����������
������4������������������������ �����#��������������!����������� �����������������������
�������������������������������5���E���"������������������� ��������� �� �#���������
������������������������� ���������� ����������������������������������������������� �
������� ������� ����"��
�� ���������� ��������������B���������C����������������������� ��������������
���#��� �������������"�8�����������������������������������(&���������������
��������������������������������#�������������B���$������������C������#��������
������������������������������ �����������������������+&�'��"7"���������������������
� ����������������� ����������������$�����������������������������������������
������������ �����+&�'����������#�������������������������#���������*����������������
���������� �����������#� ������ �����������"��
>�����������������������������������������������B��!���C������������������ �����
�������������������������"������������������������������������������������ �
#�� ���������B'����C��������������������B���������C����������������������������������
B�����C����������������������������������������"���������������������������#���
� ������������ �#����#����� �����������������������������������������)����������� �
#��������������� ������������������� ����������������������� �����������#���� ���
��!������������������#$��#�� ������������"�'� �#�������������������������������
���������������������������B�����C������������������ �����������������������������

� 2��
��������� ���������������#�������������������������������� ����������������
��������� ����"��
D����!�������@�''������������ � �������������������� �#���������������������
�������������������������������������������������������� ��������������������� �
����� �#������� ����"�5���������������� �������� ���������#����������������#��������
������ ���������������������������������������������������#��������������� �B�����C2�
��������������������� ����"�8���������&�'(���#�� ��������������������������
�������������������������������������������������������������������� �����������
������������������������"��
�������������������������������������������������#������� ����������������������
���������������������������������� �����������"���������������������������&�'(�
��#�� ���������������������&�'+����)��������������� �������������� ����������
#��������������������A����������������������������������� �����$������������$�������$
����#��������������������������������������������������������������������������
�� �� �����������"�������#��������������������������������������������#��������
������������������������������"������������������� ���������������������
3���������������������H������ ��������4�������� ����#���������������#����� �
�����������������������������������������"�����Q������������I��������������'+�
������!��������������������������#���������������������������������������!�������
�� ������"�� ������#��������������������������������������������� ��������������#�������
��)��������������������������������������������������#����������������������������
�������������� ��������������"�������������������������!��������������������������
�����������#��������������������������������������#��������������� �����&�'�������
������������#����������������� ��� ���"������������������B��������������������������
���C�3������� ������������������������������ �����4��#����������������������������
�����������!�������������������������"�&�����������������������������������������������
������ ������������������������������������������������������������������� �����
����������������������������������� �����"���������#�����������������������
���#�������#�������������������������� ����"��
D����!�������B�������������������C�������������������� �&�'������������������
����������������������������������"����������������������&�'+��������� ��������
������#�����������������������������������������"�������������������������������������
������������������� ���������������*�������� �������� ������������������������
&�'������������ �������������#���������"���������������������#�� �������������
������������ �&�'�39�����5��������:�'������2%%74��� ���������������������������������
������"���������������� ���������������������������� �������������#���������
�������������������������#�������� ��������������������������������!������� ����� �&�'�
����������� ���"��������������������������#�� �� ������������������ ��������
�������������������������������������������������� ���������� ����������� �
� ����"��
8���������&�'�����������������������#���������������������������������������������
�������������������� ������� �������������#�� "���������������� ����������������� �
�������#�� ��������������&�'��������������#�������������� ���� �����������������
�#������� ������������������������������������������������� ����������� ��� ���������
��������������������������������������������������������������� "�'�������������������
� ����������������9����������32%%74����������� ������������������� �������"�����&�'($'��
����������������� ��������������������������������� �������������������������
����������&�'�����������������������>��������H����������������"���������������������
�������&�'($'�������� ��������������������������#���������������������$�����������
� 22�
�������������������������������������������������������������������H�����"�
����Q��#�� �� ������C���������� ������ ���� ������������$������������������ ��$�������
���������������������������������������������� �&�'$������������������
��������"��
�
H������� �����.�����
����������%������� �&�'������������#������������������ �������������������������
� �&�'"��������������������� �$������������#�������������������������������#�����
����#����������������������������������������� ����������������������� �������
�����#�������� �������������������������������������������������������� �� �
���������������"���������������������������������H������#������������������������
�������� �&�'����������������#��������������� ������ �#������������������
�������#�������������� �������������������������������� �����"�(�������������� ������
������������������������������������������� �����������#���������������������������
����"�'������������>������������������������������������������������������� ���������
������������������������������������������������������7�������"���'������ ���������
&�'+�� ����������� ��������������������������������������������������������
����������������������� ������ ����"������������������������������������#�
�� ����������������������������*��� ���#���������������� ��������������� �������
�������"��
�����������#�����#��������� �#�������������������� ���������������� ������
��������#����������������#������������� ���������� �������������� ���������������
���������������������#������������������������#������������ �������� ��#����
��������������������&�'"��
���������������������������#������������!����������������� �����&�'(���#�� ����
����������������������������������������������������������� ���������������*�����
������������ ���� �������������������-�
•�&������� �������������3������������ �#���4���������� ��������������������������
������������������������������������<�
•����������!������ ����������������������������������������&�'+�����������������������
������� ����������#�������������������������������<�
•�����������������@�''������������ ������������������� �����������������!�����
����� �������������� �Q�����I<��
•�&������� ��������������������� ������������������������������������������
�����������<�
•����������!������ ������$�����B��#�� �� ������C��������������������$
�������������������������������������������������������������������
����������������������������������������������� ���������� �&�'������������"��
��������������������������������������������� � ������������&�'+�����������
�������#��������������������������� ������������������"��
�
�� ������
�"� '�����-�+&�'������ ���.���#�����������2%%J"�
2"� D����C�����B������������������������3�����4�����C�3�������������
������4�
�

� 20�
��-��������
9������&"��:�5�E�������9"�32%%F4"���#������������������������� �� ��������
'�����+���������"������������&��������������!����:3�4���2$07"�
9���*�����."��+���������("��:�>)��������@"�32%%24"�'������������������������������$�
����������������� �����$���������#�� "���,����������0�����������2%%F��
����
����-GG�������"��"��"���G�����G�����G�G2067;G����-!'!!'!###"��������"�
!'!���!'!�����"�� G����������$�������$����������$������"�� �
9)�� ����"��?���("��:�E����5"�3?�"4"�3�6J;4"�5��!��������"�������8�
������������5��������"������������������"�
9��������"�32%%=4"�8&����#�$�����������������������"�4������������;����
������ ������������<'3J4��=F;$=FJ"�
9�����."��&�������"��&��#������"��5���������8"��:�'��#��/"�32%%;4"�+���������
&������� ��������'�������+�����������������$����� ���������������
�������"�6��=��������'��!����������
9�����."��:�&���������"�32%%%4"�"�����!���"�������8)����������5��������������
������ &��������������*+!�������1�(���������������������,�'�20"�
9�����."��:�&���������"�32%%24"�����'�������� ���+�������9����&������� ��������
'�������'������ ����"�&���������������������<����0$�2;"�
9�����."��5��������?"��:�,�������?"�'"�3�66=4"�������������� ����"�
�������������>�����-����� ��������������������������������������
�������"������������&�����������"�����!�����>3�4���=$20"�
9�����."��5��������?"��:�'������'"�32%%74"����#�� �� ������-�'���������&������
� ��������'����������+����������������"�6��=��������%<304��
00;$0F2"�
���������9"�32%%74"�������������������������������"������8�!������������
������������?��������5��������1�D��������� ��������������#��"�
���������9"��:���������5"�32%%74"������������5��������,�����������������
(������ ���������������� ��������'������ �+����$'���� ���&������
(��������"�*���������@���������������������������"�����!���
5���������%,324���$2J"�
����������"�32%%%4"�����5��������"����8���"��������5��!����������������
���������������-��� ����D��������(��"�
+������"�9"�3�6J24"�'��������� ���� ��������,�*��������+����������"��46
������@�������%�3�4��7$0�"�
?�����5"��:����������,"�@"�3�6604"�?�������/��������� �������,�������$�
������������������'����������"������7���������(>324���2�$�72"�
?�������"�3�66F4"��������R�S�N���������R�8����������"""��������������'3�4��0�$
0;"�
����������."��:�E����5"�3?�"4"�3�66�4"�"�������;��2 5��!���������������
���!����������"�&����������.-�>�#�����?��������������"�
����������."��:�5�����E"�3�6604"�'����������-�'���������(�������������+����
(��������������(������������/����"���+"�'�������:��"������ ��3?�"4��
�������!����"����� ������!���������������"�&���������"."-�>�#�����
?��������������"�
&�������"��:�9�����E"�32%%%4"��������!��������P,� �'������P"����"���������
3?�"4������5��������"����8���"��������5��!����������������
����������������3��"�7�$==4"��� ���-��� ����D��������(��"�
.��������?"��&�������"��:�>�������E"�32%%F4"������������$��� ��������������
�����������'��������"������������&��������������!����:3�4��=$��"�
� 27�
.����������,"�3�6664"�5������&������� ��������'����� ���&������'�����������
+���������������-������������������������������ ����#�� "�
�������������@�������������������6�����������:��00=$076"�
E��������5"��'�������&"��"����� � �����E"��"�����������"��"��+����$����������
�"��:���������+"�3�66J4"����������(��������������&������� ����������
� ����-���?����������������������(��������������$� ����������"�5��!����
��!!�����5��!�������;��2/5�5;0�A30�$�74��006$0=J"�
5�����'"��,���������"��,������+"��:�8��������"�32%%64"�+��������������
���)�����������������������-�(������� ������������!����"������������
&�����������"�����!������B324��6=$�%;"�
5����9"��:�5���������&"�32%%%4"�(������������������������� �����������������
�������E����������+������"�������������6������@�������:,3�%4���%27$
�%0%"�
5��������."��"��9�����."��:�9)�����"�32%%=4"�����������!����������*�������
��������������������5�!����*��"�465��)����������C3�%J4"�
��������5"�3�6624"���� ������������������,������9������� �������������
� ������������R���'"�9��������:��"������ �3?�"4��&��������&�������
���"�����!���� &��!���!�������?������������������&���������3��"�
7;$=J4"���#�+����-������5�����#�&���"�
��������5"�3�6604"�'��$'������� ����-����������������+����"�5���������������
����56�'>324"�
��������5"�3�6674"�����,����� ������������������������������������� ��"�
@��������&����;������������&�����������"�����!�����������%"�
(����������&�����������!����"�3�6664"���������!������������������
����������������� �D�������7�#�����������������!!��������
�!��������������������������1�8��������+"�"-�(����������&������
�����!����"�
,���������."�32%%=4"�@�������������������� ������������������������?�������"�
5�������������������56�(<3=4��=�$=;"�
,�������?"�'"�3�6664"�&��5��������������4�$���"�'�������������� ����-�
�1,�����"�
,������."��'��#��/"��&���������"��'�������"��/������'"��/������E"�������"�32%%J4"�
� �������� ���(�������&����������"���("�9�����:�."�,���$,������3?�"4��
������������������7�����%,,<�3��"�7204"�+����-�&������'���������"�
,�������E"��:�5��������?"�32%%24"�9�����������>���������������������
� ������������� ��������'����"�&���������������������<��J;$�%%"�
'������'"��5��������?"��:���������5"�32%%64"��� ���������(����������
�������������������-�&�������$� �����������������"�@�����������
���������������������������������,3=4��066$7�7"�
'������'"��:�8��������"�32%%=��2F$2J�5���2%%=4"���������������������������
������������� 5�������������!!�������1�(��������������������
�����������@��������� ���� ��������(�������8�� ���������6"7�
�� ����������)����������"�
'���������"�3?�"4"�3�6;64"�5��!�����"�������6�����;��2"�'��� ������'#���-�
���������������"�
'��� �����("��������&"��:������ ���,"�?"�3�6624"�8�������� ��������'�����
��� ���(�������&����������R��������������(���������"�����������������
6��������'(3�%4���%;;$�%J;"�

� 2=�
'����������"��5������9"��9��������("��@������&"��8�� ���9"��.�!��������"�������"�
32%%64"��������5,'���������������#�� "��������������@��������
6�����������������3@���������4���%"�
'��#��/"��5�������'"��:�9�����."�32%%;4"�����������������������������������
����������*����!��85��������������!�����1�(���������������������@�(�
6"7�6���������������� ��������'������������������ ������������
+������������������'���(������9��!��"�
'��#��/"��'���������"��E�������("��:�5��������'"�32%%J��;$6�5���2%%J4"������
5�����������������������?����������������������!�������5&1�(�����
����������������'�$� ������� ������2%%J�8����� ���������"�
'��������E"��'��������'"��:�9��������"�32%%=4"�&�������������-������������������"�
4������������;���������� ������������<'3�%4��;22"�
'�� ����"�5"��,�������."�E"��'��������"�."��E��������?"�5"��'������@"�?"��'������."�?"�����
��"�32%%=4"��������������������������������� �������������������� �&�/$
� ���������������E���"��������������@��������6������������������
A(3=4��07=$0=="�
'������>"�32%%;4"������������!���������������������������-��������������������
��������������������������������������������������������"�
�����������&�����������"�����!������'3�4��2;$7J"�
����."��8���&"�."��:��#�����"�32%%=4"�&��������������'�������+��������'�����
�������������������'����"�5�������������������56�(<3=4��0F$77"�
����>�����?��������"�32%%64"�?�����1����������$������� ����-��������������
�����"�&��?������'A'36FF24��707"�
8��������"��:�'������'"�3�6664"���'� ���+������$>�����������������������-�
(���������������������"�6��=��������%'3�4��06$FF"�
�
�