Embed Size (px)
Citation preview
A Comprehensive Analysis of Corporate Financial Information
Through Integrated Case Studies
By
Tanner Henderson West
A thesis submitted to the faculty of The University of Mississippi in partial fulfillment of
the requirements of the Sally McDonnell Barksdale Honors College.
Oxford
May 2017
Approved By
___________________________________
Advisor: Dr. Victoria Dickinson
___________________________________
Reader: Dean Mark Wilder
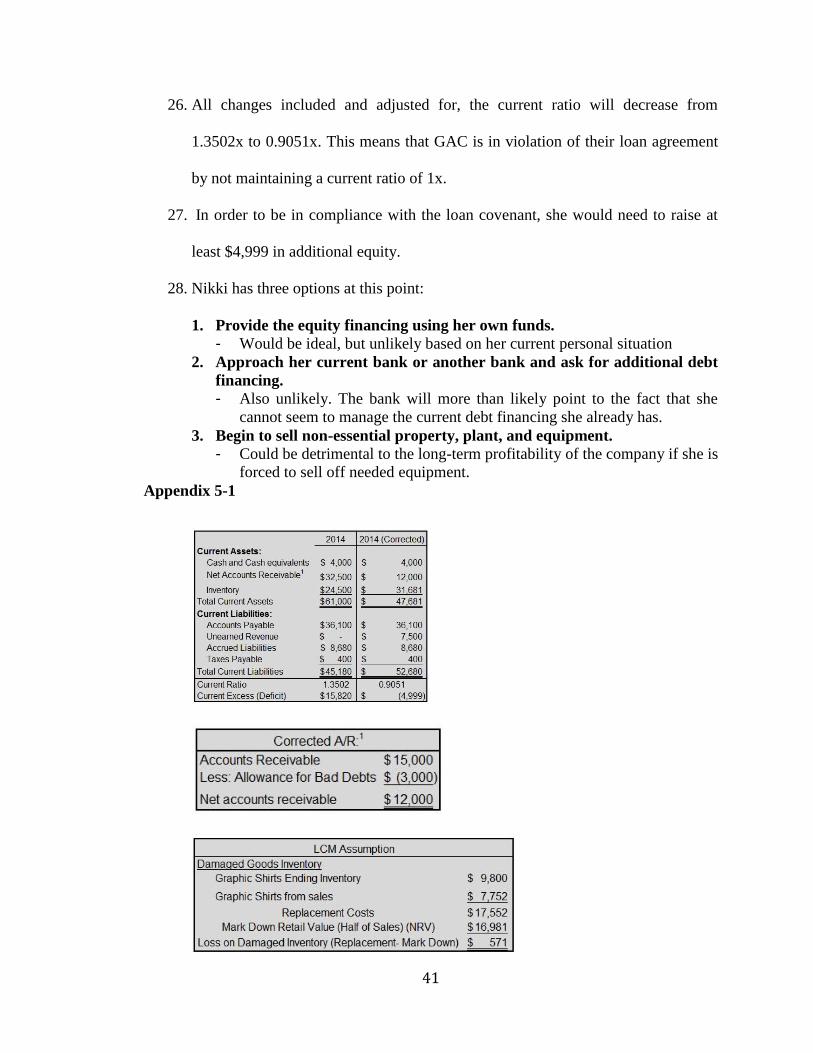
ii
Abstract
TANNER WEST: A Comprehensive Analysis of Corporate Financial Information
Through Integrated Case Studies
(Under the direction of Dr. Victoria Dickinson)
This report is an analysis of thirteen case studies concerning various topics in accounting.
The purpose of this report is to analyze, explain, and evaluate specific concepts in
accounting through the thirteen case studies. These case studies were prepared over the
course of the 2015-2016 academic year through the ACCY 420 honors course.
Accounting concepts covered throughout the cases include: pensions, tax research,
financial reporting, and long-term liabilities. Each case study includes the executive
summary, the questions responses, and additional calculations. Some case studies are
about real world companies while others involve fictional companies and accounting
scenarios. The ultimate goal of this report is to explain and discuss specific accounting
concepts through real and fictitious scenarios in a manner that anyone could reasonably
understand.
iii
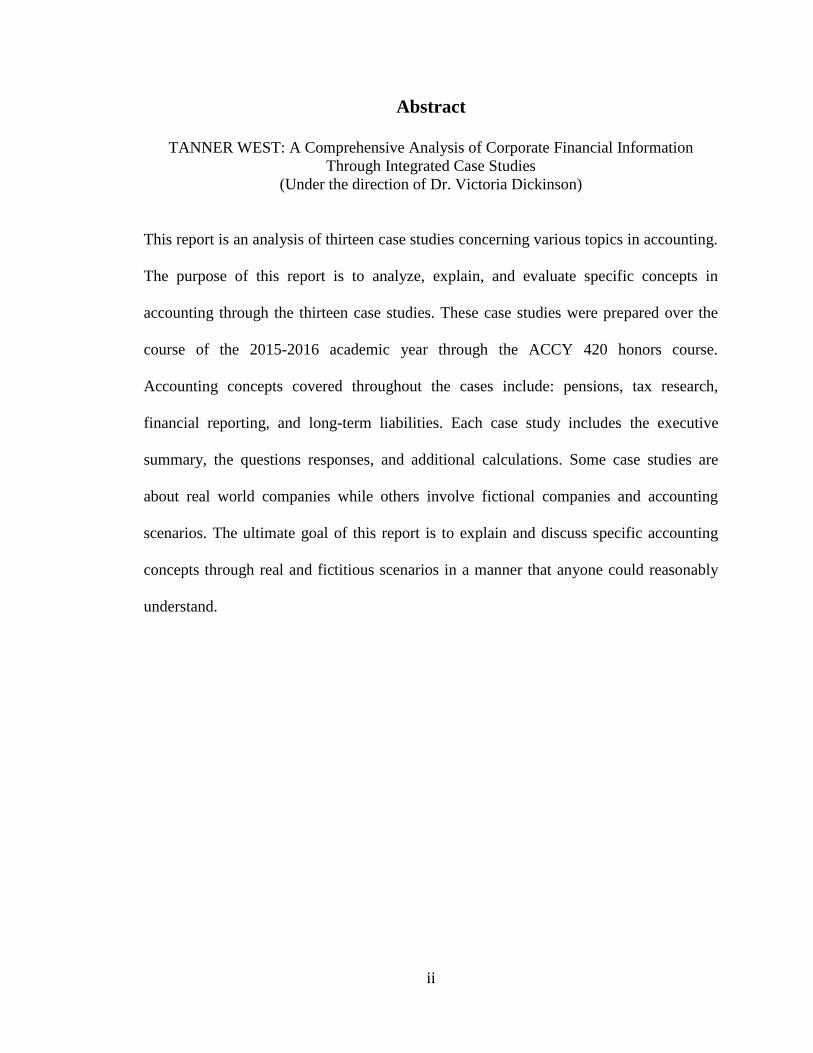
Table of Contents
Case One: Glenwood Heating, Inc. & Eads Heater, Inc. – Financial Analyses…...……...1
Case Two: Molson Coors Brewing Company Analysis – Profitability ……..……….….10
Case Three: Golden Enterprises, Inc. – Statement of Cash Flows.…………………...…19
Case Four Pearson, plc – Accounts Receivable…….……..……………………………..27
Case Five: Graphic Apparel Corporation – Inventory…………………………………...34
Case Six: Planes and Garbage – Depreciation and Fraud ……..………………………...42
Case Seven: Construct – Environmental Liabilities …………………………………….46
Case Eight: Rite Aid Corporation – Long Term Debt…………………………………...50
Case Nine: Merck & Co., Inc. and GlaxoSmithKline plc – Shareholders’ Equity………58
Case Ten: State Street Corporation – Marketable Securities..…………………………...62
Case Eleven: Groupon – Revenue Recognition ……….......……………………….........67
Case Twelve: ZAGG, Inc. – Deferred Income Taxes …………...……………………....77
Case Thirteen: Johnson & Johnson – Retirement Obligations………………...………...83

1
Case One
Glenwood Heating, Inc. & Eads Heater, Inc. -Financial
Analyses
2
Executive Summary
The goal of this financial analysis is to help the user/reader decide which firm to invest in
based on a fair and honest judgment of the 20X1 fiscal year financial statements and
information. This report uses the following financial tools to help make judgments about
the firms:
Balance Sheet
Statement of Retained Earnings
Income Statement
Statement of Cash Flows
Comparative Ratio Analysis
Appendices, worksheets, and calculations are included in the back of the report.
This report discusses the financial statements and managerial decisions of Glenwood
Heating, Inc. and Eads Heater, Inc. Both firms began in the same year and are within the
same industry and region. These two firms have made the same accounting and
managerial decisions except for the following:
Estimation of Allowance for Bad Debts
Inventory System
Depreciation of Long-Term Assets
Operating vs. Financing Leases
This report recommends investing in Eads Heater, Inc. and discusses reasons for
investment on three different levels:
Financial outlook- effect of accounting and managerial decisions
Strategy- stability of eight year lease
Future considerations- what to consider in the coming years
The report explains why Eads Heater, Inc. seems to underperform in some regards while
excelling in others. It also looks at the future outlook of the firm based on predetermined
decisions. Ultimately, this will help the user/reader see that Eads Heater, Inc. is the most
stable firm with the highest long-term profitability.
3
Financial Outlook
Income Statement
Eads Heater, Inc. total expenses (not including income tax expense) are $17,836 more
than those of Glenwood Heating, Inc. This can be attributed to three differences:
Estimation of bad debts
Depreciation of long-term assets
Added interest expense from payment of leased equipment
Eads Heaters also uses LIFO instead of FIFO causing an $11,800 increase in Cost of
Goods Sold (COGS).
These factors are responsible for the lower net income seen in the income statement of
Eads Heater.
Statement of Cash Flows
Eads Heater, Inc. has more cash for the following reasons:
Higher depreciation expense
Lower accounts receivable
Lower inventory
Lease payable
These all stem from previously mentioned accounting and managerial decisions made by
Eads Heater, Inc.
Investors should expect to see net income and profitability increase while cash flow will
decrease in future periods as a result of the financed lease agreement. However, “cash is
king”.
Financial Ratios
Eads Heater, Inc. appears to be less liquid because of its LIFO inventory valuation as
well as its estimation of bad estimates.
The firm appears to be less profitable because of a lower net income as result of
previously mentioned reasons.
4
Eads Heater will always have a higher debt ratio as a result of its leased equipment
depreciation and its subsequent payment schedule*.
Times interest earned will increase as interest expense decreases as a result of paying off
the leased equipment. See Appendix 1-3
Strategy
The leased equipment is the single greatest distinguishing financial factor that separates
the two firms. By agreeing to an eight year lease agreement, Eads Heater has the
following advantages:
Secured source of equipment at a known cost
Value for yearly payment of leased equipment i.e. appears at long-term asset in
balance sheet
Increased long-term profitability
Initial higher cash flows
The most important of these is the stability that comes with knowing expected costs of
equipment over the next eight years.
This outweighs the following disadvantages of the leasing the equipment:
Lower solvency
Initial lower profitability
Lack of mobility within lease
Future Considerations
The investor should consider the following when considering Eads Heater, Inc. for
investment:
The firm will become more profitable throughout the life of the lease.
LIFO inventory valuations negatively affects net income and positively affects
cash flows.
Overestimation of bad debt makes the firm seem less liquid, and it also
understates net income and overstates cash flows.
Double-declining depreciation negatively affects net income and positively affects
cash flows.
5
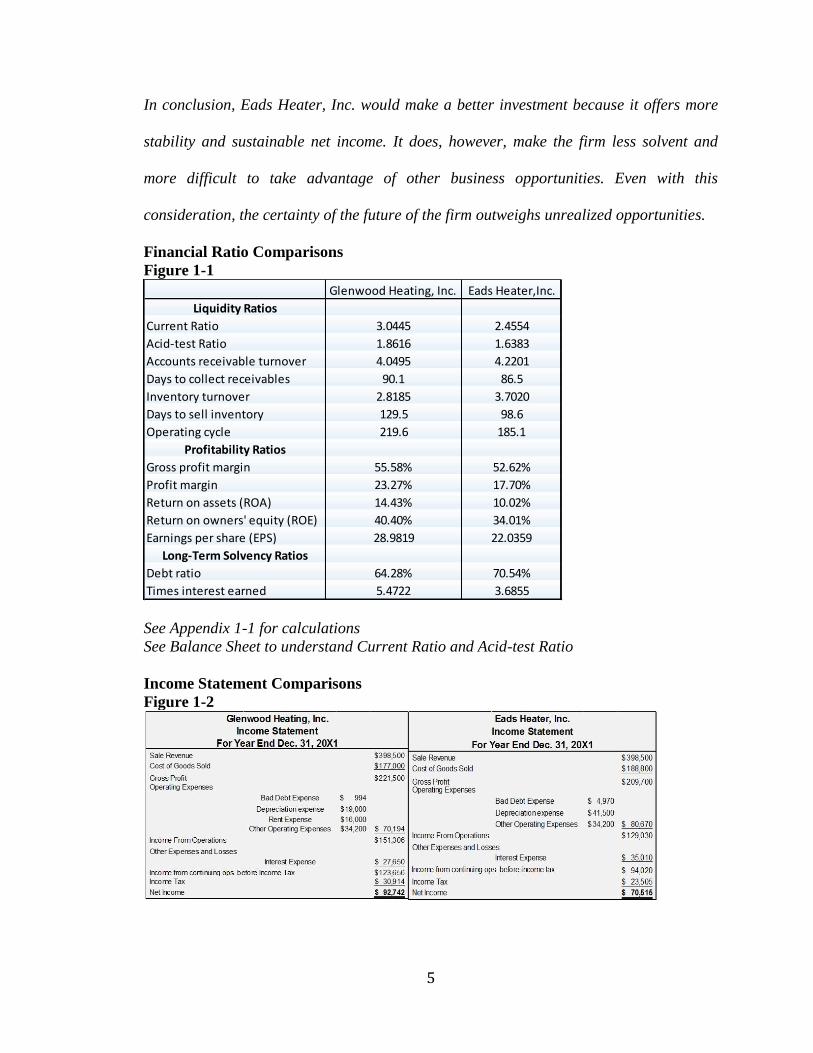
In conclusion, Eads Heater, Inc. would make a better investment because it offers more
stability and sustainable net income. It does, however, make the firm less solvent and
more difficult to take advantage of other business opportunities. Even with this
consideration, the certainty of the future of the firm outweighs unrealized opportunities.
Financial Ratio Comparisons
Figure 1-1
Glenwood Heating, Inc. Eads Heater,Inc.
Liquidity Ratios
Current Ratio 3.0445 2.4554
Acid-test Ratio 1.8616 1.6383
Accounts receivable turnover 4.0495 4.2201
Days to collect receivables 90.1 86.5
Inventory turnover 2.8185 3.7020
Days to sell inventory 129.5 98.6
Operating cycle 219.6 185.1
Profitability Ratios
Gross profit margin 55.58% 52.62%
Profit margin 23.27% 17.70%
Return on assets (ROA) 14.43% 10.02%
Return on owners' equity (ROE) 40.40% 34.01%
Earnings per share (EPS) 28.9819 22.0359
Long-Term Solvency Ratios
Debt ratio 64.28% 70.54%
Times interest earned 5.4722 3.6855
See Appendix 1-1 for calculations
See Balance Sheet to understand Current Ratio and Acid-test Ratio
Income Statement Comparisons
Figure 1-2
6
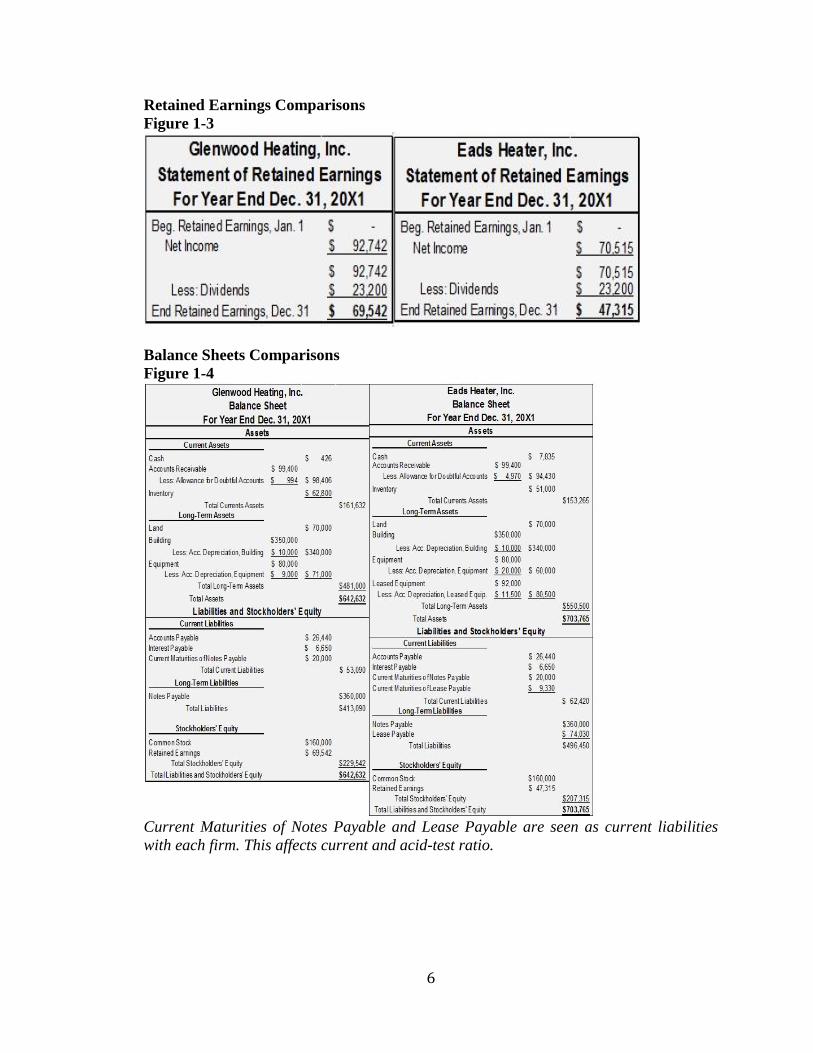
Retained Earnings Comparisons
Figure 1-3
Balance Sheets Comparisons
Figure 1-4
Current Maturities of Notes Payable and Lease Payable are seen as current liabilities
with each firm. This affects current and acid-test ratio.
7
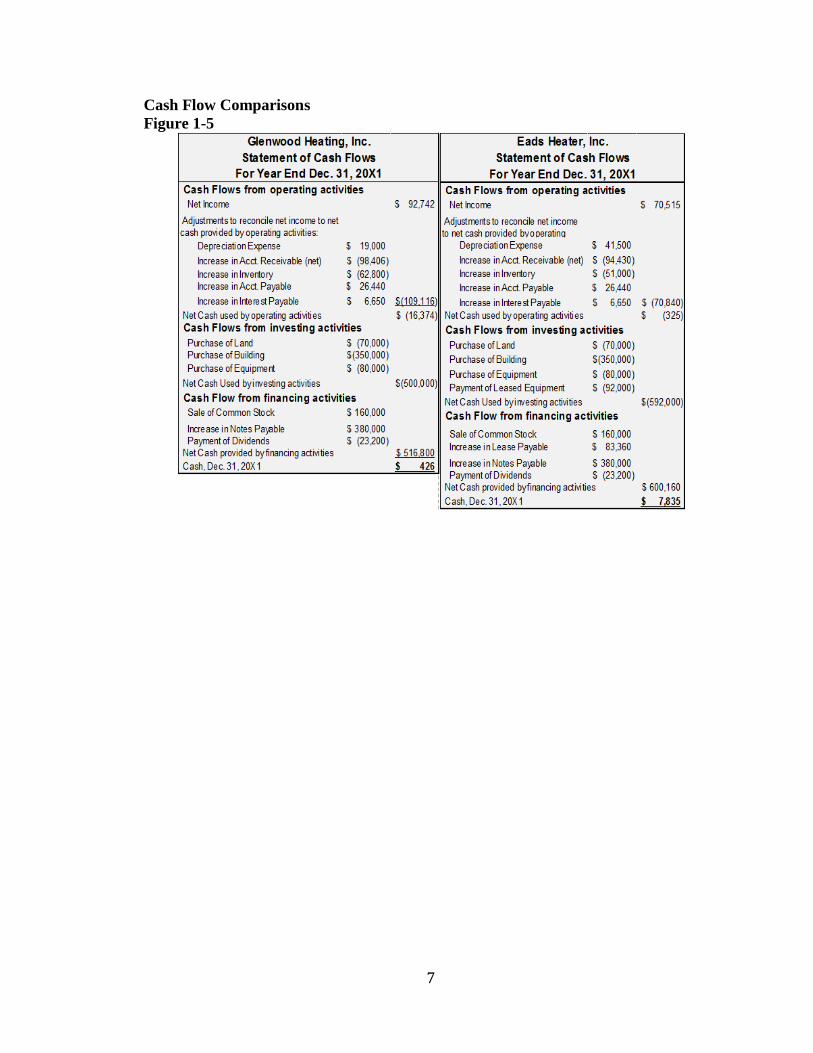
Cash Flow Comparisons
Figure 1-5
8
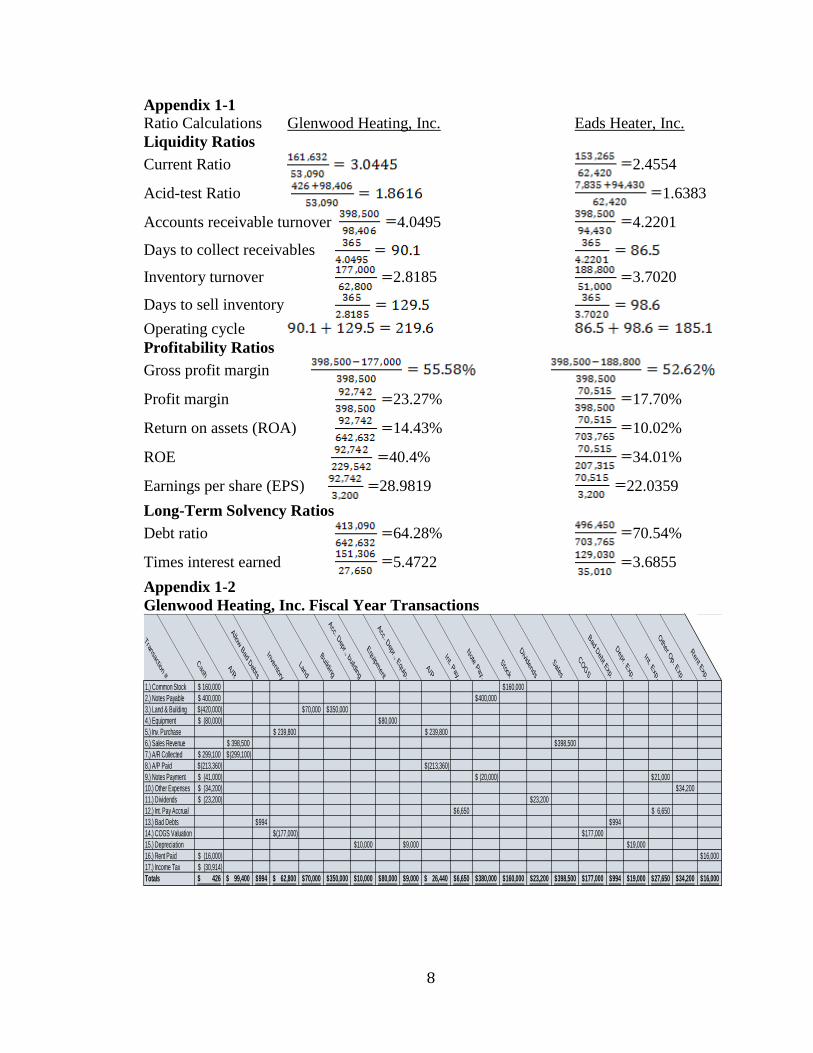
Appendix 1-1 Ratio Calculations Glenwood Heating, Inc. Eads Heater, Inc.
Liquidity Ratios
Current Ratio 2.4554
Acid-test Ratio 1.6383
Accounts receivable turnover 4.0495 4.2201
Days to collect receivables
Inventory turnover 2.8185 3.7020
Days to sell inventory
Operating cycle
Profitability Ratios
Gross profit margin
Profit margin 23.27% 17.70%
Return on assets (ROA) 14.43% 10.02%
ROE 40.4% 34.01%
Earnings per share (EPS) 28.9819 22.0359
Long-Term Solvency Ratios
Debt ratio 64.28% 70.54%
Times interest earned 5.4722 3.6855
Appendix 1-2
Glenwood Heating, Inc. Fiscal Year Transactions
Tran
sactio
n #
Cash
A/R
Allow Bad Debts
Inventory
Land
Building
Acc. D
epr., b
uilding
Equipment
Acc. D
epr., E
quip
.
A/P
Int. P
ay.
Note Pay.
Stock
Divid
ends
Sales
COGS
Bad Debt E
xp.
Depr. E
xp.
Int. E
xp.
Other O
p. E
xp.
Rent E
xp.
1.) Common Stock 160,000$ 160,000$
2.) Notes Payable 400,000$ 400,000$
3.) Land & Building (420,000)$ 70,000$ 350,000$
4.) Equipment (80,000)$ 80,000$
5.) Inv. Purchase 239,800$ 239,800$
6.) Sales Revenue 398,500$ 398,500$
7.) A/R Collected 299,100$ (299,100)$
8.) A/P Paid (213,360)$ (213,360)$
9.) Notes Payment (41,000)$ (20,000)$ 21,000$
10.) Other Expenses (34,200)$ 34,200$
11.) Dividends (23,200)$ 23,200$
12.) Int. Pay Accrual 6,650$ 6,650$
13.) Bad Debts 994$ 994$
14.) COGS Valuation (177,000)$ 177,000$
15.) Depreciation 10,000$ 9,000$ 19,000$
16.) Rent Paid (16,000)$ 16,000$
17.) Income Tax (30,914)$
Totals 426$ 99,400$ 994$ 62,800$ 70,000$ 350,000$ 10,000$ 80,000$ 9,000$ 26,440$ 6,650$ 380,000$ 160,000$ 23,200$ 398,500$ 177,000$ 994$ 19,000$ 27,650$ 34,200$ 16,000$
9
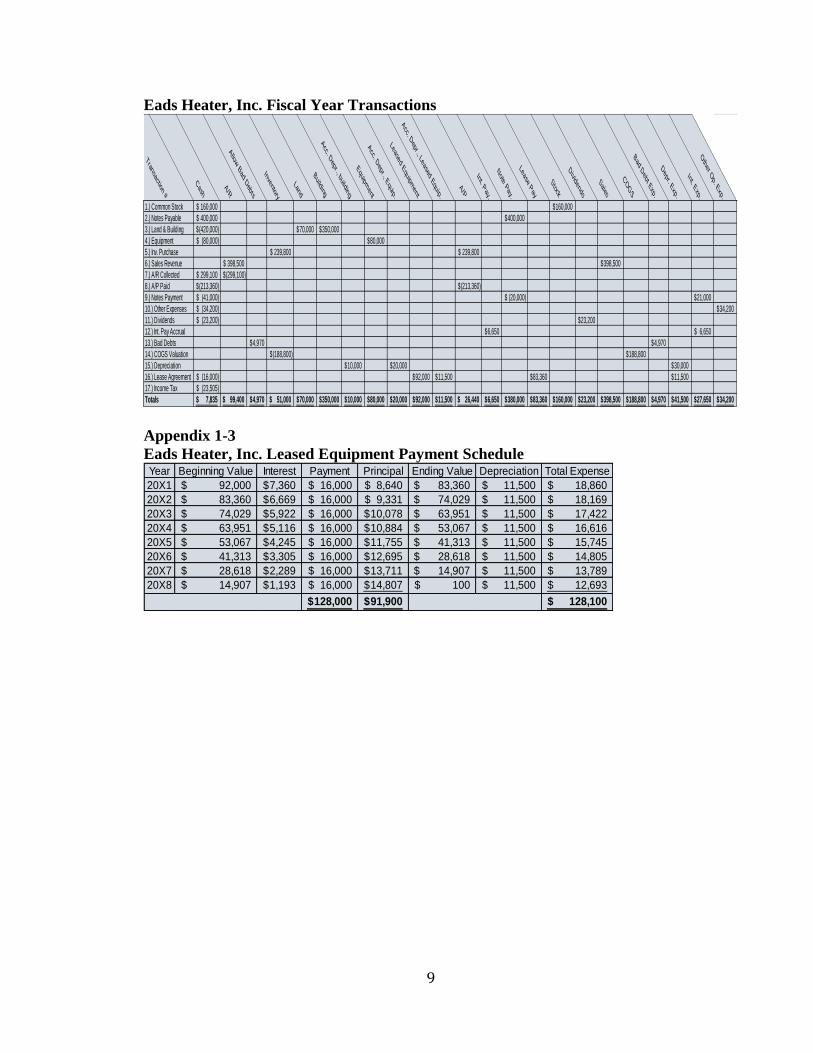
Eads Heater, Inc. Fiscal Year Transactions
Tran
sactio
n #
Cash
A/R
Allow Bad Debts
Inventory
Land
Building
Acc. D
epr., b
uilding
Equipment
Acc. D
epr., E
quip
.
Leased Equipment
Acc. D
epr., L
eased
Equip.
A/P
Int. P
ay.
Note Pay.
Lease Pay
Stock
Divid
ends
Sales
COGS
Bad Debt Exp.
Depr. E
xp.
Int. E
xp.
Other O
p. E
xp.
1.) Common Stock 160,000$ 160,000$
2.) Notes Payable 400,000$ 400,000$
3.) Land & Building (420,000)$ 70,000$ 350,000$
4.) Equipment (80,000)$ 80,000$
5.) Inv. Purchase 239,800$ 239,800$
6.) Sales Revenue 398,500$ 398,500$
7.) A/R Collected 299,100$ (299,100)$
8.) A/P Paid (213,360)$ (213,360)$
9.) Notes Payment (41,000)$ (20,000)$ 21,000$
10.) Other Expenses (34,200)$ 34,200$
11.) Dividends (23,200)$ 23,200$
12.) Int. Pay Accrual 6,650$ 6,650$
13.) Bad Debts 4,970$ 4,970$
14.) COGS Valuation (188,800)$ 188,800$
15.) Depreciation 10,000$ 20,000$ 30,000$
16.) Lease Agreement (16,000)$ 92,000$ 11,500$ 83,360$ 11,500$
17.) Income Tax (23,505)$
Totals 7,835$ 99,400$ 4,970$ 51,000$ 70,000$ 350,000$ 10,000$ 80,000$ 20,000$ 92,000$ 11,500$ 26,440$ 6,650$ 380,000$ 83,360$ 160,000$ 23,200$ 398,500$ 188,800$ 4,970$ 41,500$ 27,650$ 34,200$
Appendix 1-3
Eads Heater, Inc. Leased Equipment Payment Schedule Year Beginning Value Interest Payment Principal Ending Value Depreciation Total Expense
20X1 92,000$ 7,360$ 16,000$ 8,640$ 83,360$ 11,500$ 18,860$
20X2 83,360$ 6,669$ 16,000$ 9,331$ 74,029$ 11,500$ 18,169$
20X3 74,029$ 5,922$ 16,000$ 10,078$ 63,951$ 11,500$ 17,422$
20X4 63,951$ 5,116$ 16,000$ 10,884$ 53,067$ 11,500$ 16,616$
20X5 53,067$ 4,245$ 16,000$ 11,755$ 41,313$ 11,500$ 15,745$
20X6 41,313$ 3,305$ 16,000$ 12,695$ 28,618$ 11,500$ 14,805$
20X7 28,618$ 2,289$ 16,000$ 13,711$ 14,907$ 11,500$ 13,789$
20X8 14,907$ 1,193$ 16,000$ 14,807$ 100$ 11,500$ 12,693$
128,000$ 91,900$ 128,100$
10
Case Two
Molson Coors Brewing Company Analysis- Profitability
11
Executive Summary
The goal of this analysis is to look at financial concepts that might help investors make an
assessment of the Molson Coors Brewing Company’s profitability based on given
financial statements and computational performance ratios. This report will specifically
address the following:
Basic income statement analysis
Income based on persistence of existing income statement accounts
Operating profit vs. non-operating profit
Net operating assets
Return on net operating assets and other performance ratios
All supporting data and case study answers can be found at the end of the report.
The report makes every effort to show investors how they can better compare this
company to other companies and to itself over time. In addition, the data analysis looks at
how operations can generate future expected cash flows for investors and how operating
income can be the life blood and provide sustainable growth for the firm.
General remarks and recommendations When looking at a firm’s financial statements, it can be difficult for investors to
differentiate between the financing decisions and the actual operational success of the
firm, particularly with a multinational firm like Molson Coors. To further examine this,
one can focus on two things primarily: persistence and operational significance. When
looking on the income statement a line item will either fall into one of four categories
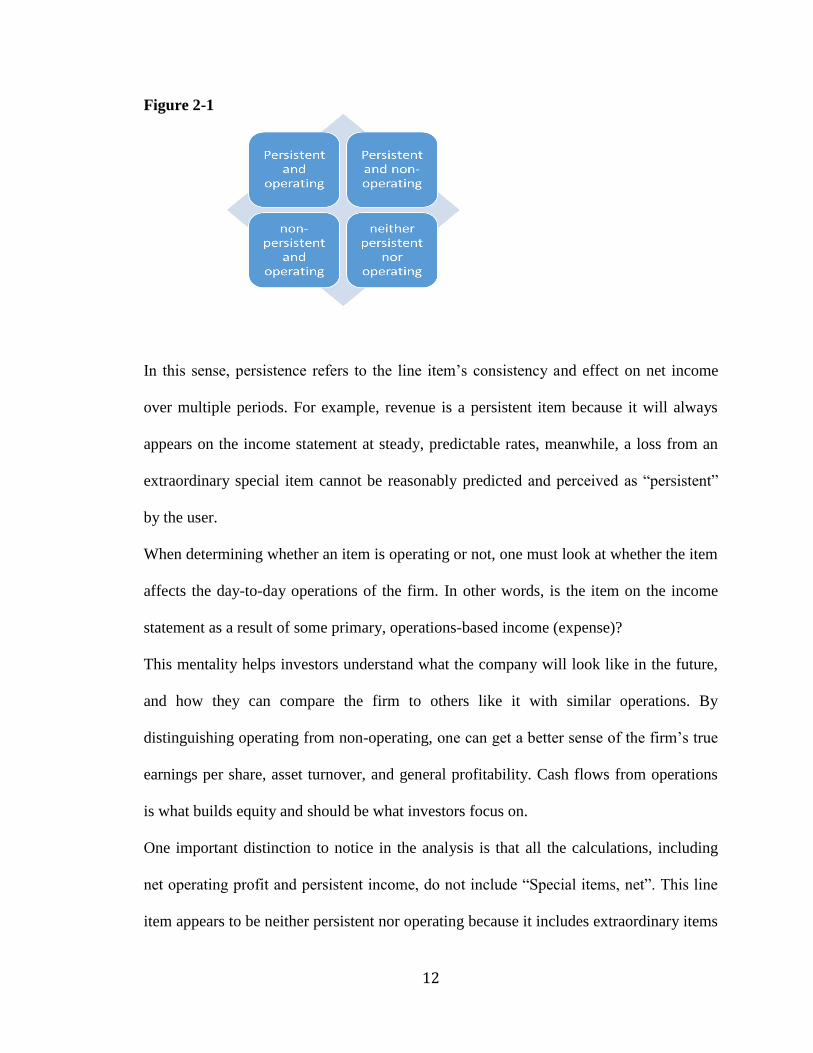
demonstrated below (Figure 2-1):
12
Figure 2-1
In this sense, persistence refers to the line item’s consistency and effect on net income
over multiple periods. For example, revenue is a persistent item because it will always
appears on the income statement at steady, predictable rates, meanwhile, a loss from an
extraordinary special item cannot be reasonably predicted and perceived as “persistent”
by the user.
When determining whether an item is operating or not, one must look at whether the item
affects the day-to-day operations of the firm. In other words, is the item on the income
statement as a result of some primary, operations-based income (expense)?
This mentality helps investors understand what the company will look like in the future,
and how they can compare the firm to others like it with similar operations. By
distinguishing operating from non-operating, one can get a better sense of the firm’s true
earnings per share, asset turnover, and general profitability. Cash flows from operations
is what builds equity and should be what investors focus on.
One important distinction to notice in the analysis is that all the calculations, including
net operating profit and persistent income, do not include “Special items, net”. This line
item appears to be neither persistent nor operating because it includes extraordinary items
13
that do not occur with frequency or consistency, and arguably, none of the sub-items
listed in note 8 seem to be directly related to continuing operations. The firm does not
consider the item to be a part of core operations, yet it is still part of operating expenses.
This could be seen as a lack of faithful representation on the part of the firm.
Lastly, investors can gain clearest insight into the firm’s profitability based on its
“RNOA” or return on net operating assets. By dividing net operating profit margin by net
operating asset, investors can get a better picture of the firm’s ability to produce given
current on-hand assets required for operations without financing. This is a rawer indicator
of the company’s performance than ROA or RNOA with persistent net income.
Answers-
A. revenues, operating expenses, other operating expenses/revenues, income tax,
income from discontinued operations, income from non-controlling interests
B. FASB considers parts and subsections of financial statements to be more
informative for users than the whole. So, GAAP does not allow firms to report
summary accounts by themselves i.e. (total assets, nets assets, total equity, etc.)
C. Persistent income shows what factors determine current income and what users
can expect from the firm in subsequent periods. It helps users and serves as the
enhancing quality of comparability.
D. Comprehensive income is the change in equity from non-owner sources.
It is different from net income because it includes unrealized holding gains/losses
on securities, certain pension adjustments, and certain foreign currency translation
gains/losses.
14
E. In this case, net sales is sales minus the excise tax on the principal product, beer.
Beer carries an excise tax because it serves as a sin tax. Molson Coors reports
these separately to comply with GAAP and show the subsections of the overall
classification of “Net Sales”.
F. The firm includes the following: infrequent or unusual items, impairment or asset
abandonment-related losses, restructuring charges and other atypical employee-
related costs, and fees on termination of significant operating agreements and
gains (losses) on disposal of investments
ii. They believe these special items represent charges that are not part of the core
operations. However, they do believe that they may be recurring. I think that this
is a fair classification. I find concern in that the overall “special items, net” is
considered to be part of operating expenses. For example, I am not sure that some
of the unusual or infrequent items can be considered as part of operating income
(loss). I am not sure how they can be part of operating expenses, yet still not
contribute (detract) from core operations.
G. “Other income (expense), net” refers to unusual gains/losses from non-operating
assets, foreign transactions, and currencies purchases among other items. Those
unusual gains/losses are part of non-operating expenses (income). While “Special
items, net” refers to employee-related charges, asset impairments or
abandonments, unusual or infrequent items, and termination fees. These are
classified as part of operating expenses, yet somehow they are not considered to
be part of “core operations”.
15
H. i. Comprehensive income= $760.2M
Net Income= $567.3M
Comprehensive Income attributable to Molson Coors is $192.9M more than Net
Income.
ii. The statement of comprehensive income includes all income (loss)
classifications from non-owner sources including foreign currency translations,
unrealized gains/losses, reclassification of derivatives, pensions, amortization of
net prior service costs, and ownership shares of unconsolidated subsidiaries’ CI.
They are all non-owner sources and are not included on the income statement.
I. Non-persistent income statement items:
Special items, net- recurring with varying amounts
Income (loss) from discontinued operations- cannot reasonably expect for
this item to recur
Other income (expense), net- year-to-year amounts vary drastically
J. i. Current effective tax rate- 12.83%
ii. Persistent effective tax rate- ~13% based on company’s foreign operations and
the existing effective tax rate.
K. $721,770,000 = estimated persistent income
16
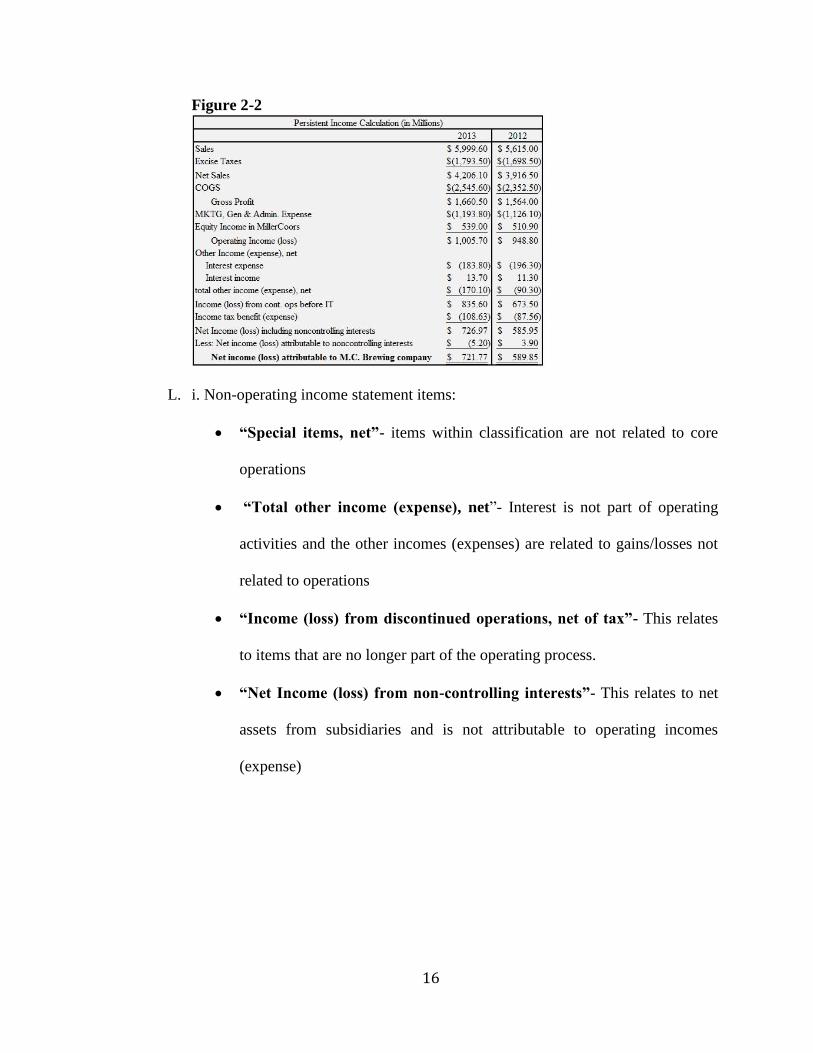
Figure 2-2
L. i. Non-operating income statement items:
“Special items, net”- items within classification are not related to core
operations
“Total other income (expense), net”- Interest is not part of operating
activities and the other incomes (expenses) are related to gains/losses not
related to operations
“Income (loss) from discontinued operations, net of tax”- This relates
to items that are no longer part of the operating process.
“Net Income (loss) from non-controlling interests”- This relates to net
assets from subsidiaries and is not attributable to operating incomes
(expense)
17
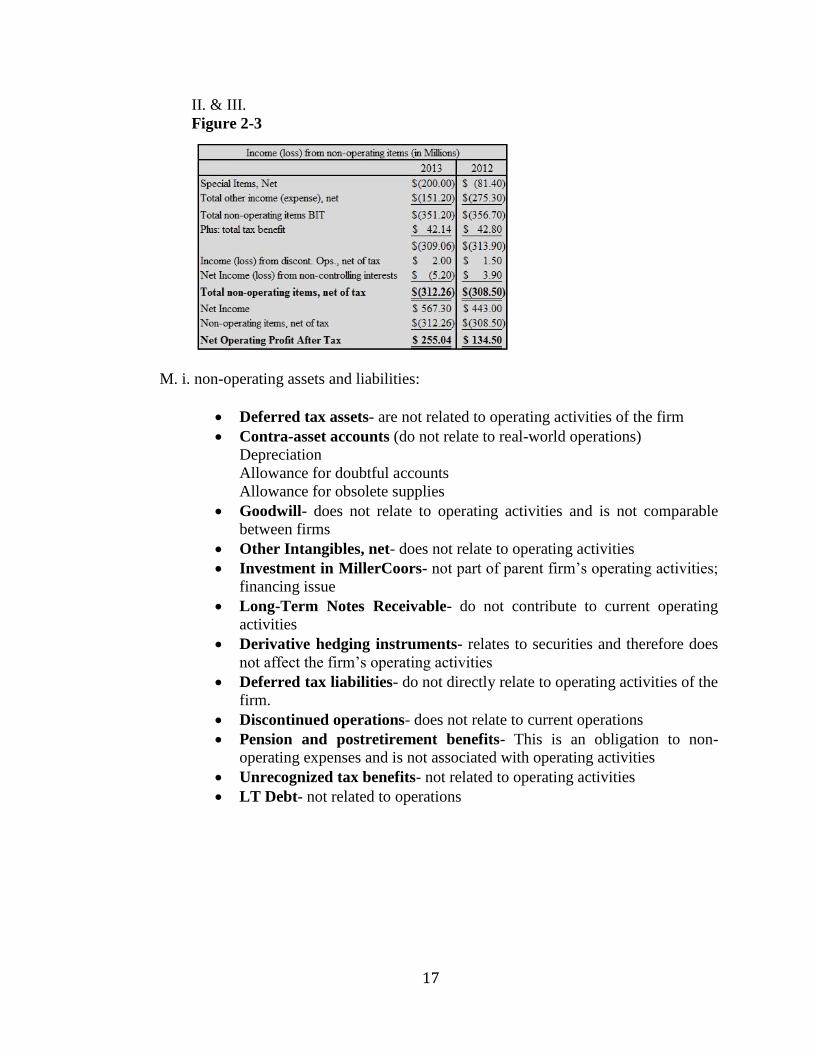
II. & III.
Figure 2-3
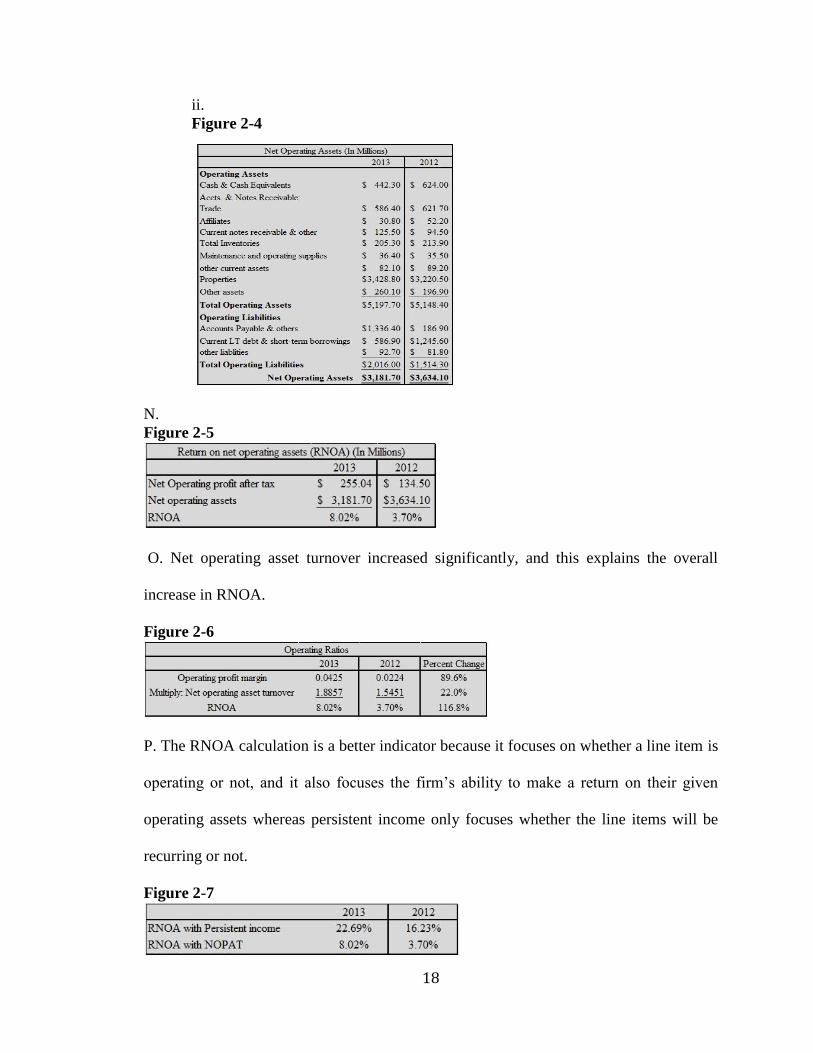
M. i. non-operating assets and liabilities:
Deferred tax assets- are not related to operating activities of the firm
Contra-asset accounts (do not relate to real-world operations)
Depreciation
Allowance for doubtful accounts
Allowance for obsolete supplies
Goodwill- does not relate to operating activities and is not comparable
between firms
Other Intangibles, net- does not relate to operating activities
Investment in MillerCoors- not part of parent firm’s operating activities;
financing issue
Long-Term Notes Receivable- do not contribute to current operating
activities
Derivative hedging instruments- relates to securities and therefore does
not affect the firm’s operating activities
Deferred tax liabilities- do not directly relate to operating activities of the
firm.
Discontinued operations- does not relate to current operations
Pension and postretirement benefits- This is an obligation to non-
operating expenses and is not associated with operating activities
Unrecognized tax benefits- not related to operating activities
LT Debt- not related to operations
18
ii.
Figure 2-4
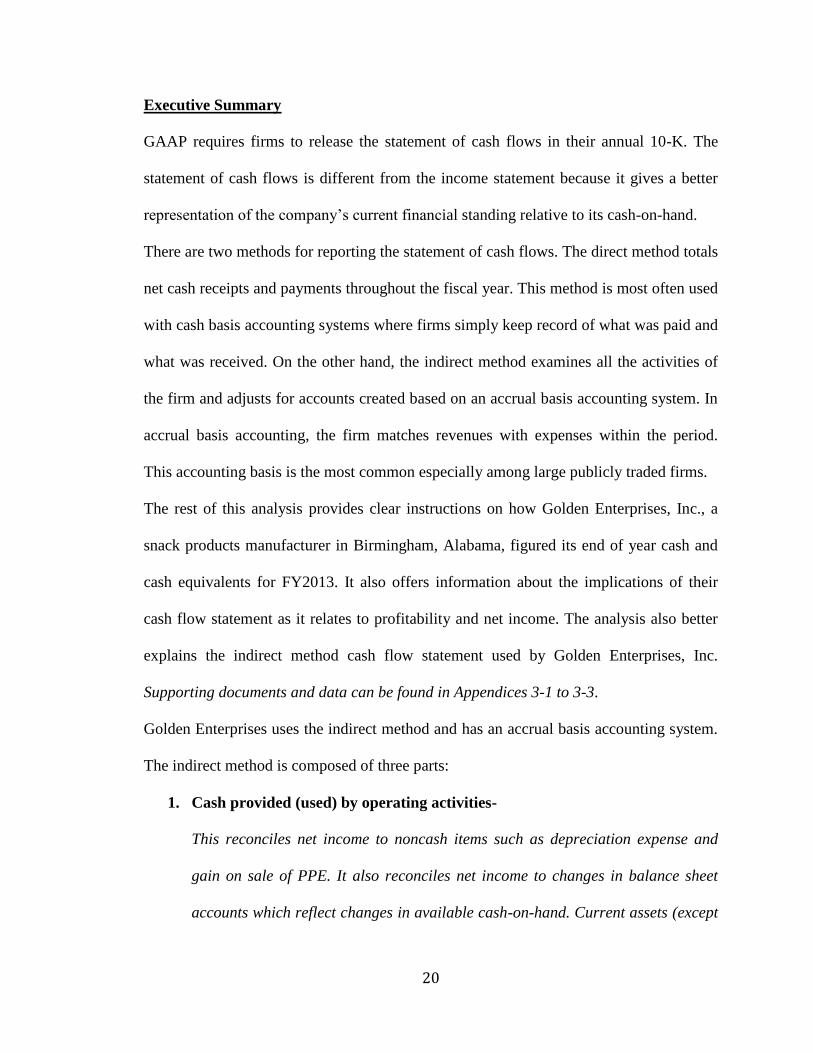
N.
Figure 2-5
O. Net operating asset turnover increased significantly, and this explains the overall
increase in RNOA.
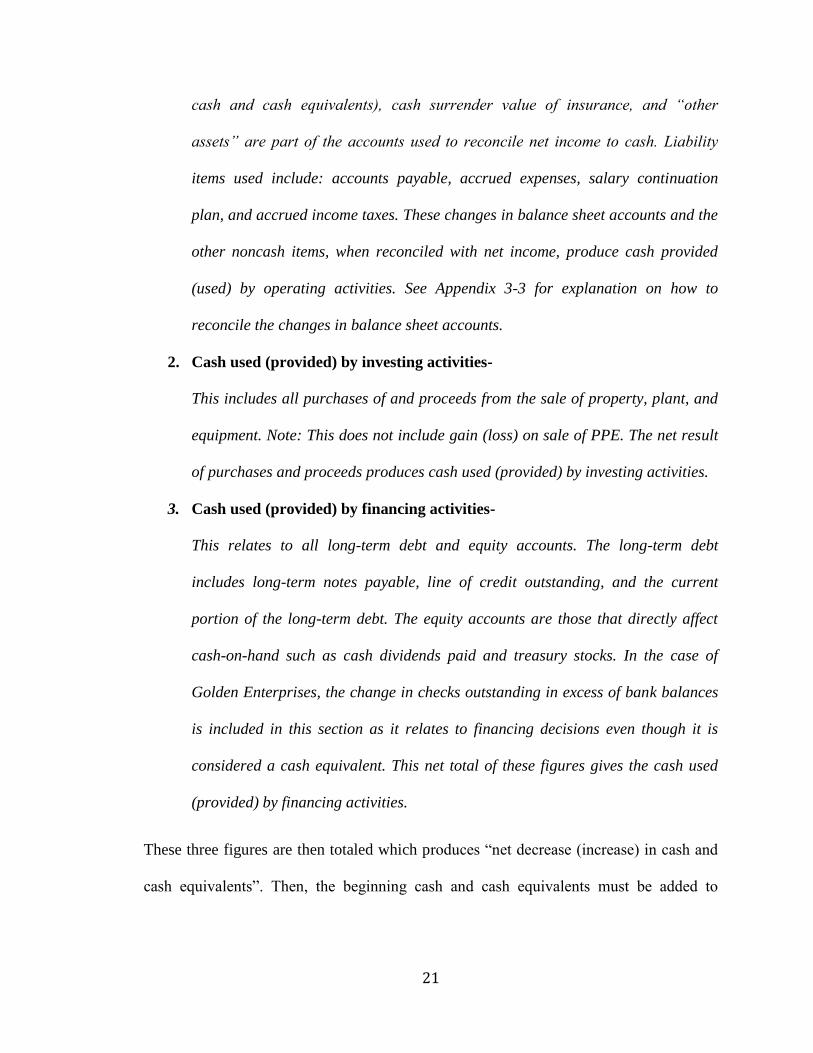
Figure 2-6
P. The RNOA calculation is a better indicator because it focuses on whether a line item is
operating or not, and it also focuses the firm’s ability to make a return on their given
operating assets whereas persistent income only focuses whether the line items will be
recurring or not.
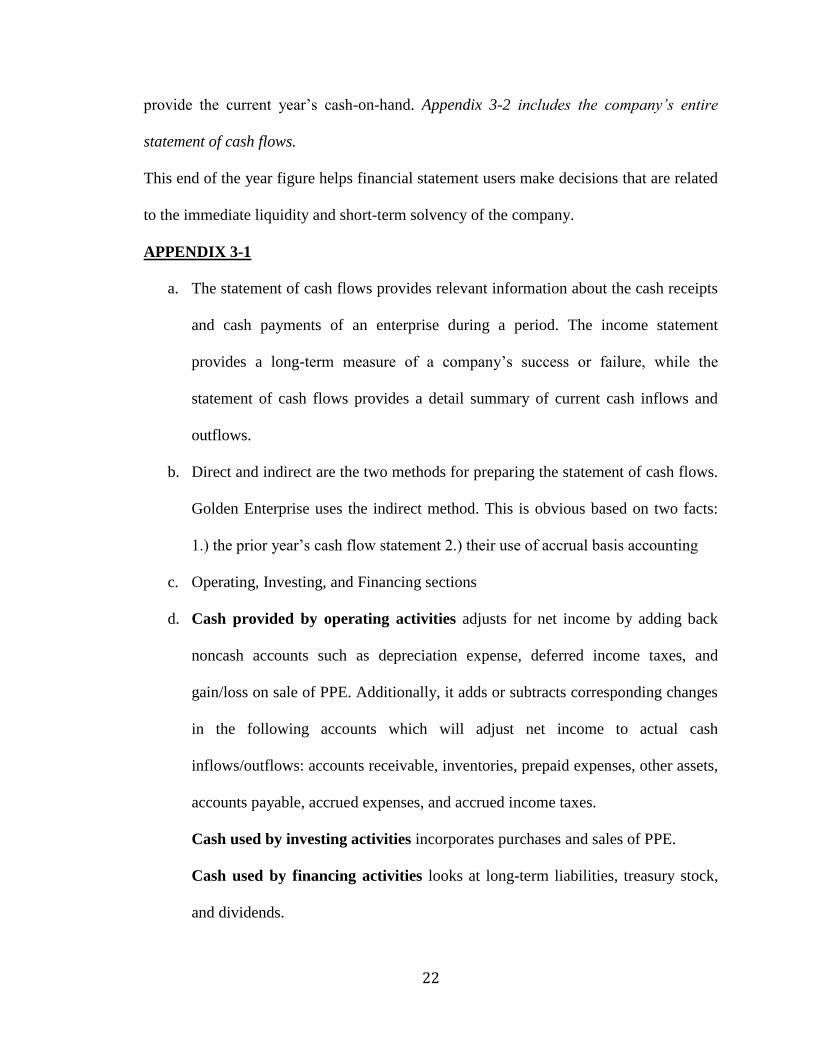
Figure 2-7

19
Case Three
Golden Enterprises, Inc. - Statement of Cash Flows
20
Executive Summary
GAAP requires firms to release the statement of cash flows in their annual 10-K. The
statement of cash flows is different from the income statement because it gives a better
representation of the company’s current financial standing relative to its cash-on-hand.
There are two methods for reporting the statement of cash flows. The direct method totals
net cash receipts and payments throughout the fiscal year. This method is most often used
with cash basis accounting systems where firms simply keep record of what was paid and
what was received. On the other hand, the indirect method examines all the activities of
the firm and adjusts for accounts created based on an accrual basis accounting system. In
accrual basis accounting, the firm matches revenues with expenses within the period.
This accounting basis is the most common especially among large publicly traded firms.
The rest of this analysis provides clear instructions on how Golden Enterprises, Inc., a
snack products manufacturer in Birmingham, Alabama, figured its end of year cash and
cash equivalents for FY2013. It also offers information about the implications of their
cash flow statement as it relates to profitability and net income. The analysis also better
explains the indirect method cash flow statement used by Golden Enterprises, Inc.
Supporting documents and data can be found in Appendices 3-1 to 3-3.
Golden Enterprises uses the indirect method and has an accrual basis accounting system.
The indirect method is composed of three parts:
1. Cash provided (used) by operating activities-
This reconciles net income to noncash items such as depreciation expense and
gain on sale of PPE. It also reconciles net income to changes in balance sheet
accounts which reflect changes in available cash-on-hand. Current assets (except
21
cash and cash equivalents), cash surrender value of insurance, and “other
assets” are part of the accounts used to reconcile net income to cash. Liability
items used include: accounts payable, accrued expenses, salary continuation
plan, and accrued income taxes. These changes in balance sheet accounts and the
other noncash items, when reconciled with net income, produce cash provided
(used) by operating activities. See Appendix 3-3 for explanation on how to
reconcile the changes in balance sheet accounts.
2. Cash used (provided) by investing activities-
This includes all purchases of and proceeds from the sale of property, plant, and
equipment. Note: This does not include gain (loss) on sale of PPE. The net result
of purchases and proceeds produces cash used (provided) by investing activities.
3. Cash used (provided) by financing activities-
This relates to all long-term debt and equity accounts. The long-term debt
includes long-term notes payable, line of credit outstanding, and the current
portion of the long-term debt. The equity accounts are those that directly affect
cash-on-hand such as cash dividends paid and treasury stocks. In the case of
Golden Enterprises, the change in checks outstanding in excess of bank balances
is included in this section as it relates to financing decisions even though it is
considered a cash equivalent. This net total of these figures gives the cash used
(provided) by financing activities.
These three figures are then totaled which produces “net decrease (increase) in cash and
cash equivalents”. Then, the beginning cash and cash equivalents must be added to
22
provide the current year’s cash-on-hand. Appendix 3-2 includes the company’s entire
statement of cash flows.
This end of the year figure helps financial statement users make decisions that are related
to the immediate liquidity and short-term solvency of the company.
APPENDIX 3-1
a. The statement of cash flows provides relevant information about the cash receipts
and cash payments of an enterprise during a period. The income statement
provides a long-term measure of a company’s success or failure, while the
statement of cash flows provides a detail summary of current cash inflows and
outflows.
b. Direct and indirect are the two methods for preparing the statement of cash flows.
Golden Enterprise uses the indirect method. This is obvious based on two facts:
1.) the prior year’s cash flow statement 2.) their use of accrual basis accounting
c. Operating, Investing, and Financing sections
d. Cash provided by operating activities adjusts for net income by adding back
noncash accounts such as depreciation expense, deferred income taxes, and
gain/loss on sale of PPE. Additionally, it adds or subtracts corresponding changes
in the following accounts which will adjust net income to actual cash
inflows/outflows: accounts receivable, inventories, prepaid expenses, other assets,
accounts payable, accrued expenses, and accrued income taxes.
Cash used by investing activities incorporates purchases and sales of PPE.
Cash used by financing activities looks at long-term liabilities, treasury stock,
and dividends.
23
e. In this case, cash equivalents are the checks outstanding in excess of bank
balances.
f. Not all of the accounts on the income statement are related to accrued or deferred
revenues and expenses. Some of the revenues and expenses are matched with cash
paid in and out of the firm during that corresponding period. Net income is
included because it does contain those revenues and expenses that are matched by
their cash flows for the period. The rest of the operating activities section is about
adjusting for those revenues and expenses on the income statement that are not
related to cash flows.
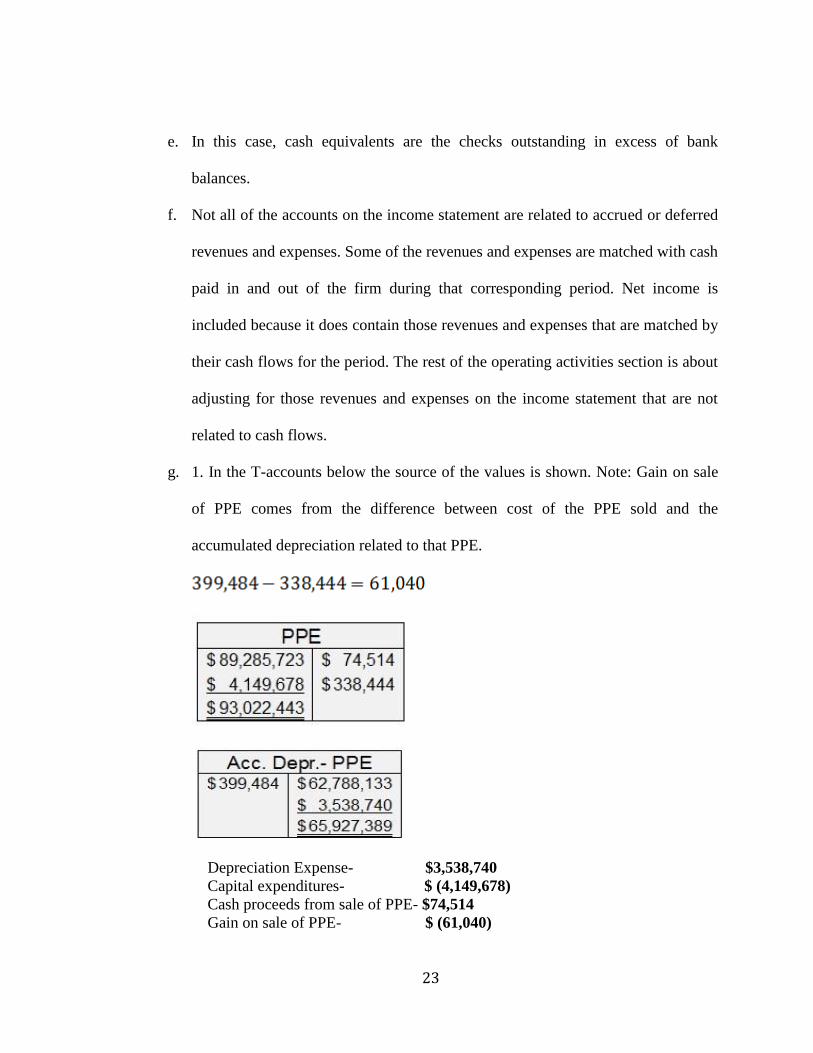
g. 1. In the T-accounts below the source of the values is shown. Note: Gain on sale
of PPE comes from the difference between cost of the PPE sold and the
accumulated depreciation related to that PPE.
Depreciation Expense- $3,538,740
Capital expenditures- $ (4,149,678)
Cash proceeds from sale of PPE- $74,514
Gain on sale of PPE- $ (61,040)
24
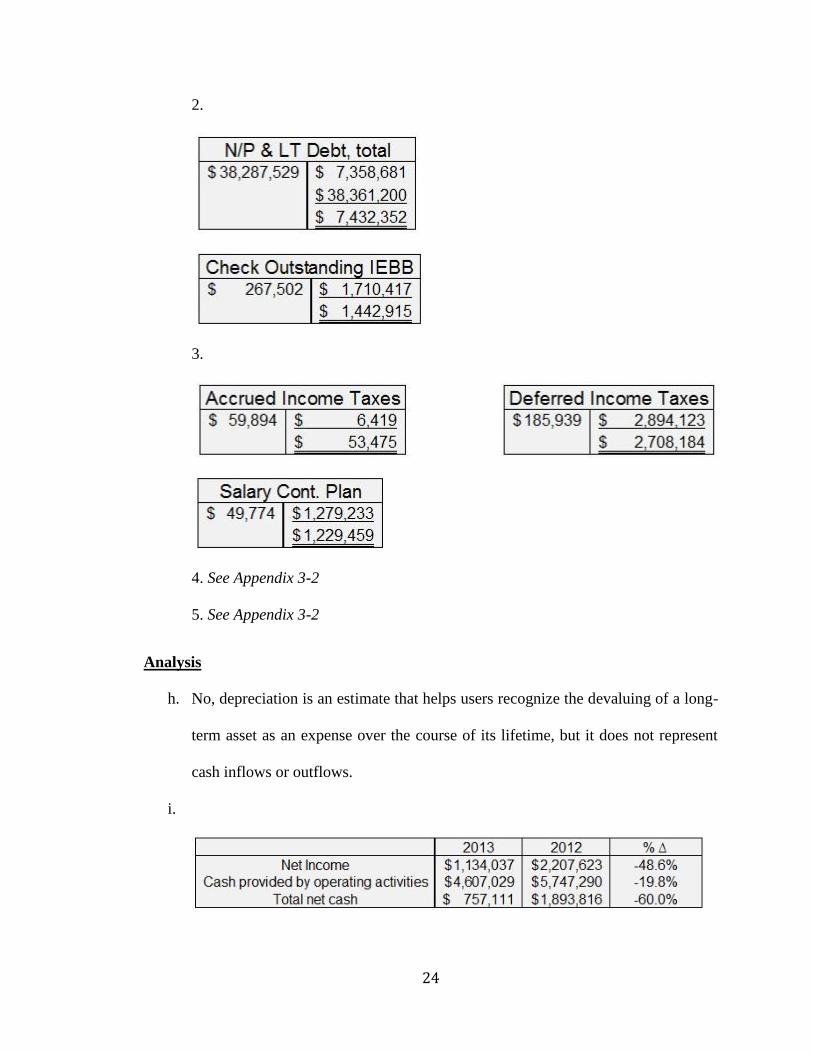
2.
3.
4. See Appendix 3-2
5. See Appendix 3-2
Analysis
h. No, depreciation is an estimate that helps users recognize the devaluing of a long-
term asset as an expense over the course of its lifetime, but it does not represent
cash inflows or outflows.
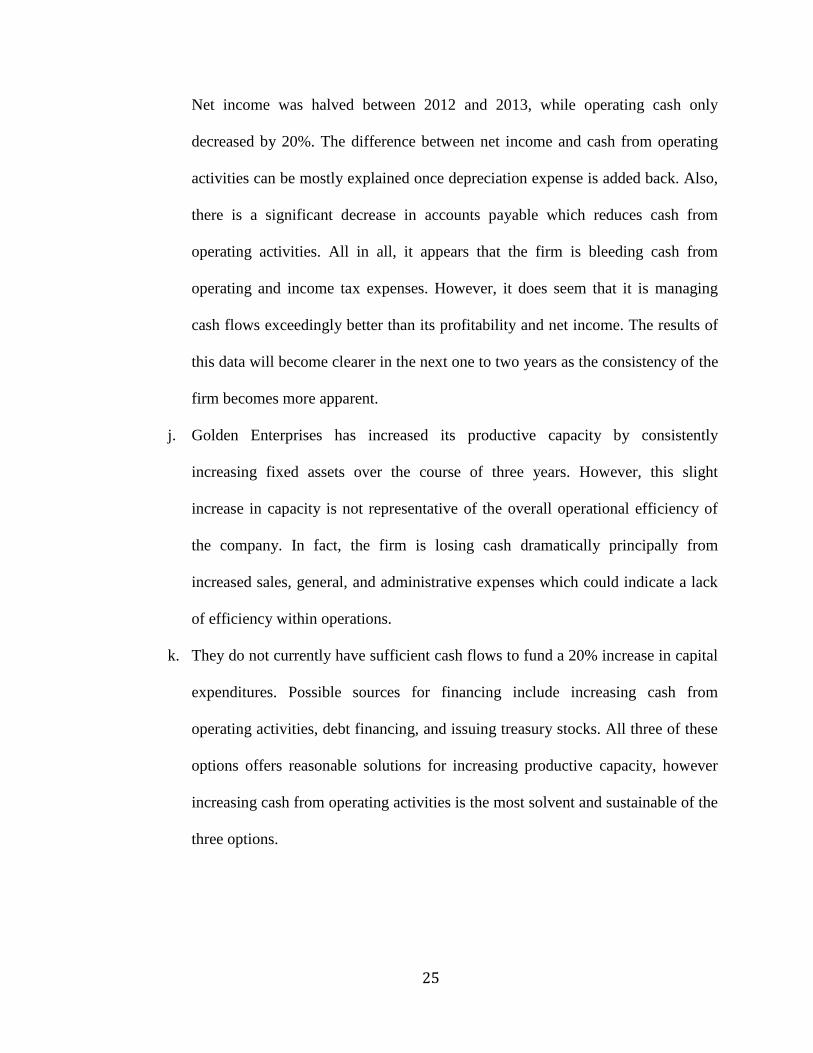
i.
25
Net income was halved between 2012 and 2013, while operating cash only
decreased by 20%. The difference between net income and cash from operating
activities can be mostly explained once depreciation expense is added back. Also,
there is a significant decrease in accounts payable which reduces cash from
operating activities. All in all, it appears that the firm is bleeding cash from
operating and income tax expenses. However, it does seem that it is managing
cash flows exceedingly better than its profitability and net income. The results of
this data will become clearer in the next one to two years as the consistency of the
firm becomes more apparent.
j. Golden Enterprises has increased its productive capacity by consistently
increasing fixed assets over the course of three years. However, this slight
increase in capacity is not representative of the overall operational efficiency of
the company. In fact, the firm is losing cash dramatically principally from
increased sales, general, and administrative expenses which could indicate a lack
of efficiency within operations.
k. They do not currently have sufficient cash flows to fund a 20% increase in capital
expenditures. Possible sources for financing include increasing cash from
operating activities, debt financing, and issuing treasury stocks. All three of these
options offers reasonable solutions for increasing productive capacity, however
increasing cash from operating activities is the most solvent and sustainable of the
three options.
26
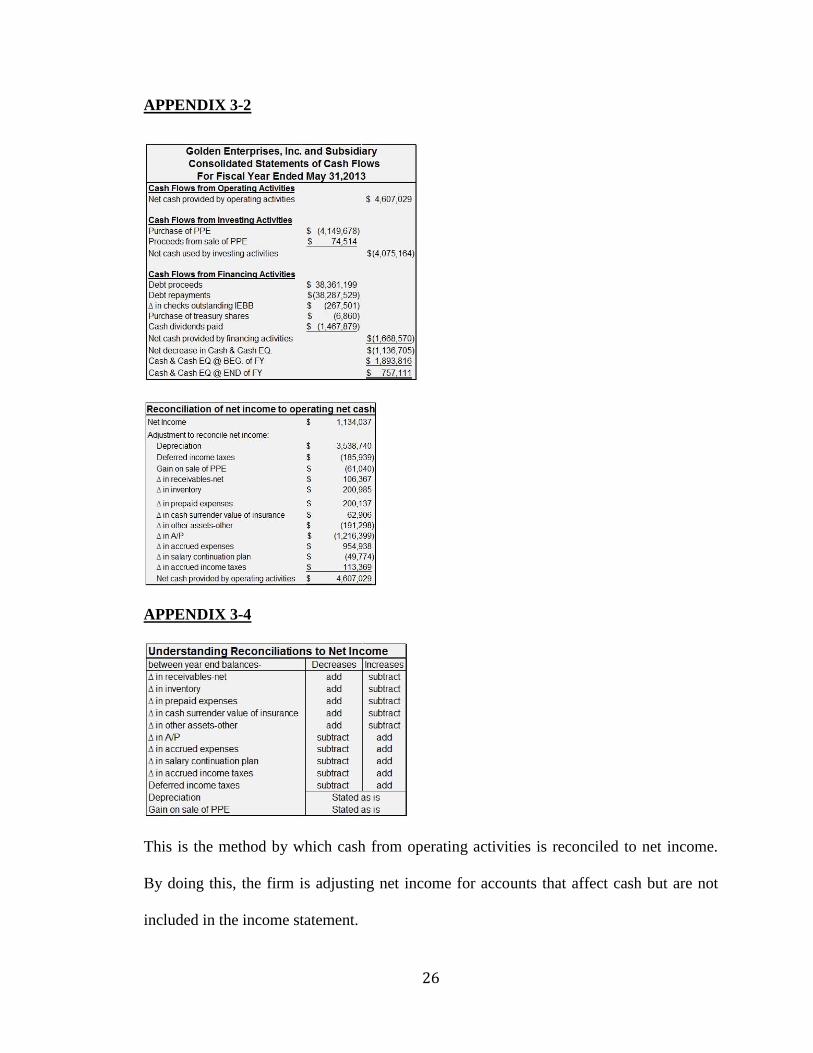
APPENDIX 3-2
APPENDIX 3-4
This is the method by which cash from operating activities is reconciled to net income.
By doing this, the firm is adjusting net income for accounts that affect cash but are not
included in the income statement.

27
Case Four
Pearson, plc – Accounts Receivable
28
Executive Summary
This report follows a step-by-step analysis of the “trade receivables” account for fiscal
year 2009 of Pearson, plc, a publisher and education materials provider.
Initially, it is important to establish an understanding of accounts receivable and its
effect on the financial statements. The report also discusses the effects of allowances
(provisions) for bad and doubtful debts and sales returns. Items A-E discusses these
accounts and different methods for estimating bad debts and sales returns.
Next, in Items F-H the report focuses on Pearson’s financials and the associated t-
accounts and journal entries for trade receivables, provisions for bad and doubtful debts,
and provisions for sales returns. Note that in Item G-ii the adjusting entry for provision
for sales returns includes a debt to Sales. This is not usual practice because typically the
adjustment includes a debt to “sales returns & allowances” which is a contra-equity
account. We see that in Note 22 is says that “Sales” is reported net of the estimate and
that there is no contra-equity account.
In Items I-K, there is an analysis and judgment of the quality of the firm’s estimates and
its collection performance compared with another firm within the same industry. By
looking at the receivables’ bad debts relative to their past due status, we can make a
better estimate of what receivables are likely uncollectible. In Items J & K, there is an
analysis of the Pearson’s accounts receivable turnover and average collection period.
These two performance analyses tell us the firm’s credit sales to accounts receivable ratio
and the average number of days it takes for them to collect on a credit sale. Based on
these items, there can be judgment on their performance year-to-year, and Item K

29
continues this by comparing Pearson’s average collection period to McGraw Hill’s, a
leading competitor.
All in all, through this report, we can see an obvious underlying importance to how firms
handle receivables and how that can affect the bottom line. From a financial reporting
standpoint, there is a precedent to reliably and faithfully represent estimates that will give
users a better view of what cash the firm expects to actually collect on.
a. An account receivable is an oral promise from the purchaser to pay for the goods
and services sold. Trade and nontrade receivables are other names for accounts
receivable.
b. A note receivable is a written promissory note to pay a certain amount by a given
date.
c. A contra account reduces the face value of its related asset account. The trade
receivables’ contra accounts serve as provisions for “bad and doubtful debts” and
“anticipated future sales returns”. The bad and doubtful accounts is an allowance
estimate that relates to accounts receivables that go unpaid, and it reduces the
overall trade receivables value. Anticipated future sales returns is an allowance
account estimate that accounts for reduction in trade receivables due to customers
returning sales items. These accounts allow users to see the net realizable value of
trade receivables.
d. Percentage-of-sales procedure- The adjustment for bad debt expense is figured as a
percentage of net credit sales on account for that period. Managers need to know net
credit sales in order to get the bad debt expense. To get the final account balance for
30
allowance for doubtful accounts, one has to add the estimated bad debt expense to
the beginning account balance.
Aging-of-accounts procedure- The ending balance for the allowance for doubtful
accounts is found by first organizing receivables based on the time until they’re
due. From there, estimated percentages are applied to the coordinating subtotals
which, when totaled, gives the ending balance for allowance for doubtful
accounts. To get the actual adjusting entry made to bad debt expense, one must
subtract the beginning balance for the allowance from the just computed ending
balance.
Aging-of-accounts procedure would be a better estimate of the bad debt expense
because it accounts for uncollectable receivables based on prior data and a more
detailed analysis.
e. By having a stricter credit policy, managers risk the loss of sales.
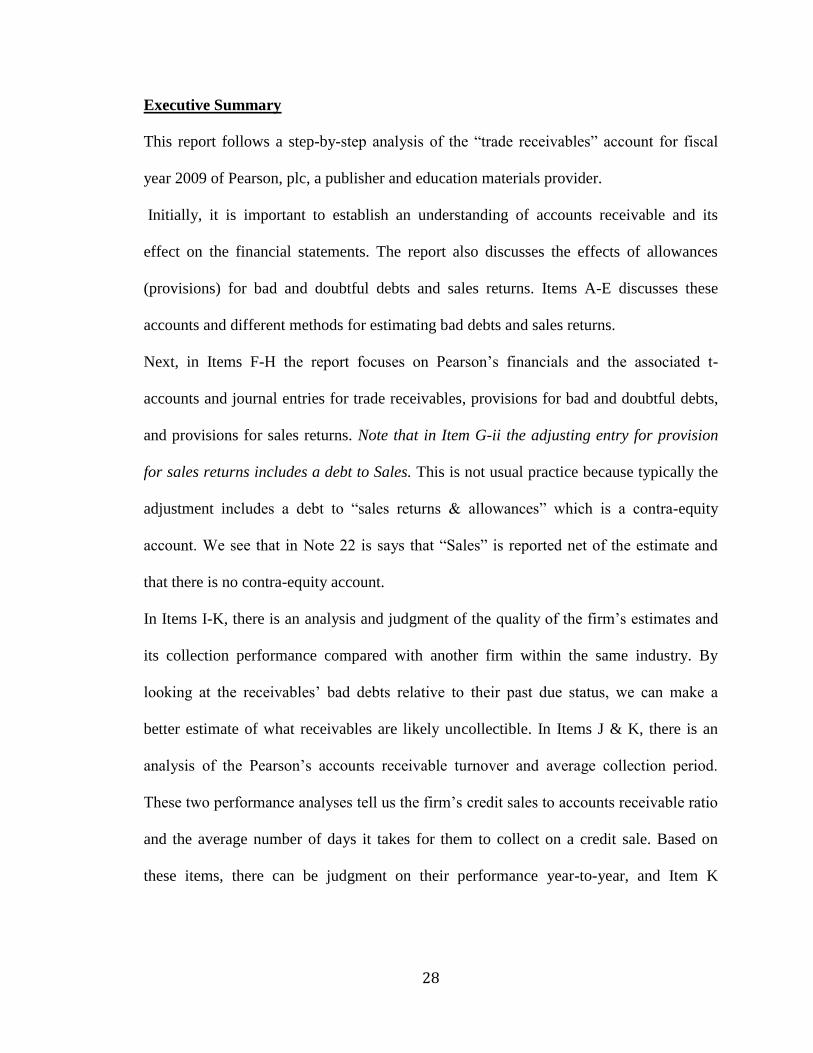
f.
i.
Figure 4-1
A. Exchange differences- reports the change in exchange rates between
point of sale and point of collection.
B. Income statement movements- relates to the adjusting entry for
estimated bad and doubtful debts at the end of the period.
C. Utilised- represents the actual write-offs for trade receivables when
they are deemed uncollectable.
31
D. Acquisition through business combination- represents the acquisition
of another firm and the acquired firm’s provisions for bad and doubtful
accounts.
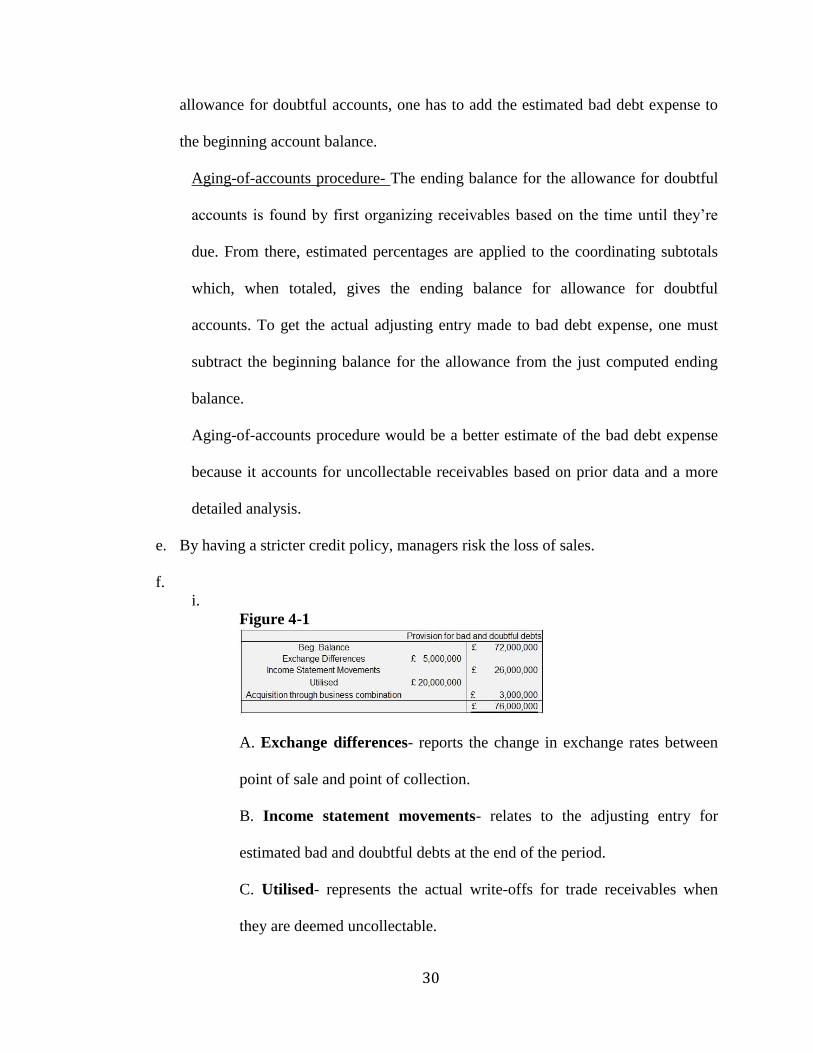
ii.
Figure 4-2
Bad and doubtful accounts expense- Income Statement
Trade receivables- Balance Sheet
Provision for bad and doubtful accounts expense- Balance Sheet
iii. It is included as a contra asset account under trade receivables as a “Less:”
g. i.
Figure 4-3
ii.
Figure 4-4
Sales- Income Statement
Provision for sales returns- Balance Sheet
Trade receivables- Balance Sheet
iii. Sales
32
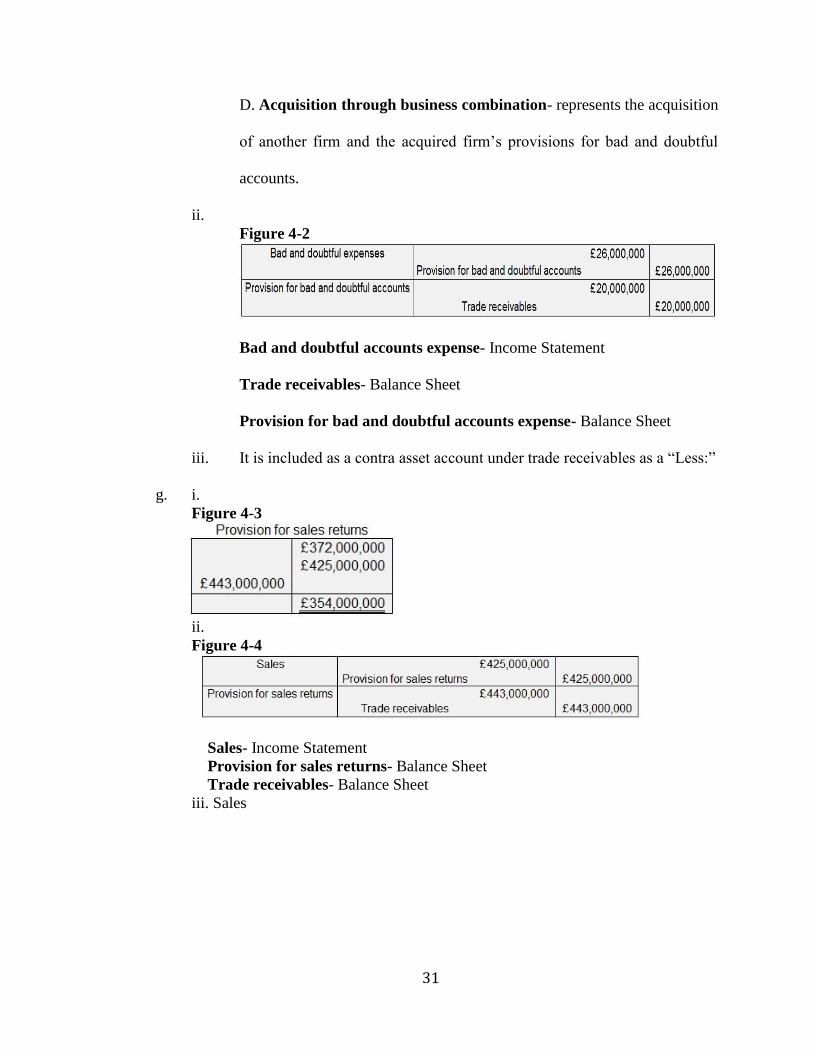
h.
Figures 4-5 & 4-6
ANALYSIS
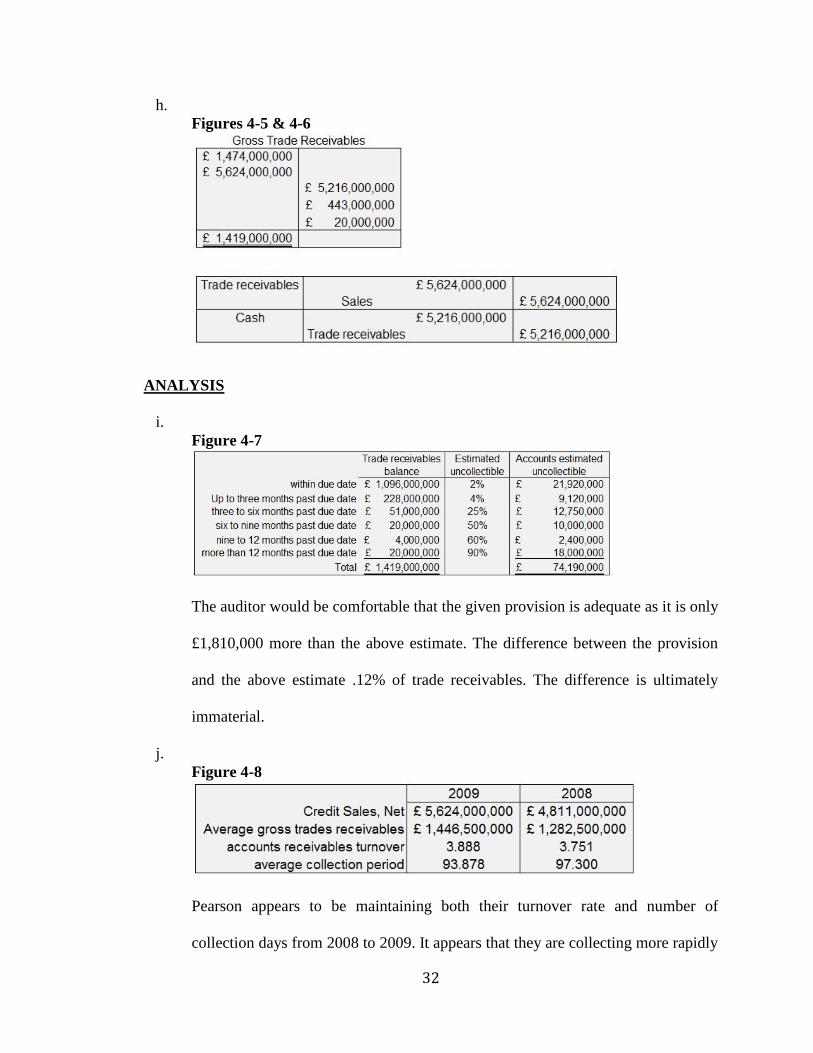
i.
Figure 4-7
The auditor would be comfortable that the given provision is adequate as it is only
£1,810,000 more than the above estimate. The difference between the provision
and the above estimate .12% of trade receivables. The difference is ultimately
immaterial.
j.
Figure 4-8
Pearson appears to be maintaining both their turnover rate and number of
collection days from 2008 to 2009. It appears that they are collecting more rapidly
33
and more efficiently in 2009 compared to 2008. The difference seems to be
immaterial, but one possible reason could be that sales returns and bad debts were
better estimated for 2008 than for 2009.
k. Pearson does seem to be underperforming compared to their competitor. One
immediate solution that would allow Pearson to reduce time to collect would be to
tighten its credit policy and restrict credit sales to more credit-worthy and reliable
customers. However, this often results in reduced sales revenue with time and limits
market expansion. Other possible solutions include:
Charging interest on accounts to incentivize customers to pay their balance
more quickly
Offering cash discounts to customers that pay off their balances sooner
Issuing additional charges to customers that delay payment far past due
date

34
Case Five
Graphic Apparel Corporation – Inventory
35
Executive Summary
Graphic Apparel Corporation (GAC) is a small t-shirt screen printing company and is
owned by a young college student, Nicki. This report will address some of the concerns
Nicki has for the company by looking at it financial statements and correcting
misstatements that might jeopardize the GAC’s loan agreement with the local bank.
Additionally, the report will offer guidance and suggestions for Nicki on how she can
better report financial information and comply with her current loan agreement covenant.
Currently, the company is required to maintain a current ratio of 1.0x per the loan
agreement covenant.
During fiscal year 2014, there were three significant events and transactions that will be
relevant to this report.
1. GAC edited the graphic shirt design and repositioned with new, “edgier” retail
customers. $3,000 in customer accounts, however, will likely be uncollectable as
a result.
2. Nicki secured $10,000 in sales orders in customer shirt orders. $7,500 were part
of cash sales and the remaining $2,500 was part of an informal order placed by
her own sports team.
3. Half of the plain shirts purchased in 2014 had water damage caused by a leak in
the warehouse roof. Nicki repaired many of the shirts through laundering,
however the remaining portion is being used to make the 2014 graphic shirts. She
has sold some of this “refurbished” shirts, and as of the end of the fiscal year,
$15,000 in retail sales worth of these water damaged shirts remains in GAC’s
customers’ stores.
36
The report will focus on these three main events and will address three main topics
regarding GAAP compliance and financial reporting concerns.
1. Revenue recognition
2. Net realizable value of accounts receivable
3. Inventory valuation
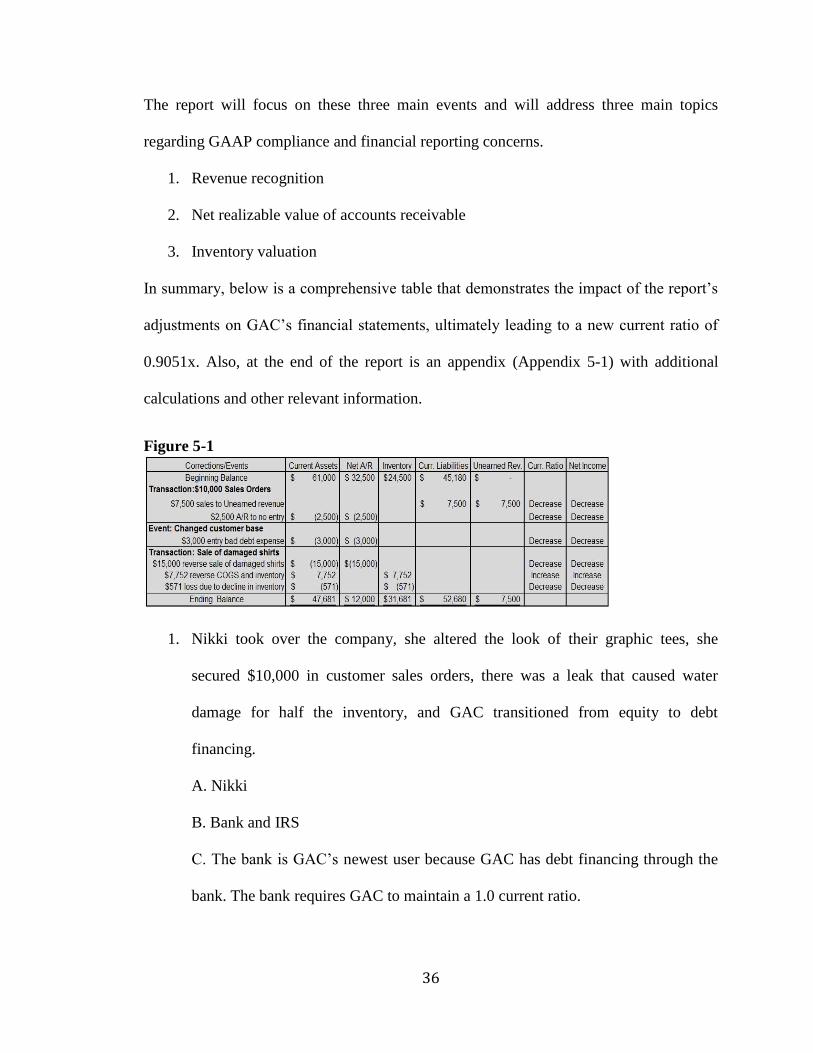
In summary, below is a comprehensive table that demonstrates the impact of the report’s
adjustments on GAC’s financial statements, ultimately leading to a new current ratio of
0.9051x. Also, at the end of the report is an appendix (Appendix 5-1) with additional
calculations and other relevant information.
Figure 5-1
1. Nikki took over the company, she altered the look of their graphic tees, she
secured $10,000 in customer sales orders, there was a leak that caused water
damage for half the inventory, and GAC transitioned from equity to debt
financing.
A. Nikki
B. Bank and IRS
C. The bank is GAC’s newest user because GAC has debt financing through the
bank. The bank requires GAC to maintain a 1.0 current ratio.
37
2. A. Custom graphic t-shirts business is a seasonal fashion merchandising business.
GAC has had some challenge in FY2014 (see 1A.), but they have unusually high
customer sales order and are taking the step in the right direction to expand their
presence within the community.
B. Most sales come from retailers, however they are growing their direct customer
sales. Additionally, Nikki changed the custom graphic tee design, and it caused
them to have to shift retailer customer base from traditional retailers to “edgier”
customers.
C. It forced them to change their customer base.
D. There was a leak in the warehouse roof, and it caused inventory water damage.
3. The revenue principle, according to GAAP, says that firms cannot recognize
revenue until the “performance obligation” has been fulfilled.
4. GAC recognizes revenue from customer orders when the customer makes the
payment. This form of revenue recognition is only appropriate in the following
scenarios:
Construction projects
Completion of production on certain agricultural products and extractive
materials
Cash collection of installment sales
5. When the performance obligation is completed, and the product is transferred to
the customer.
6. According to GAAP, the best method for recognition is to acknowledge sales
once the firm has completed the obligation for the sale i.e. once the shirts order is
delivered. The best argument for this is a situation in which the sale was
38
recognized at the point of payment, the order was delivered, but there was a sale
return, and sales had to be lowered.
7. It would reduce revenue, and the current ratio would be affected because there
would be an increase in current liabilities from the “unearned revenue” account.
See Appendix 5-1 & Figure 5-1
8. Net realizable value
9. Direct write-off method. This is not acceptable because GAAP requires firms to
reasonably estimate uncollectible accounts receivable and report A/R based on
this estimate.
10. Because GAC has switched customer bases, they have experienced new
challenges making it difficult for many of their new retail customers to meet their
stringent payment deadlines.
2014 2013
A/R turnover 7.577 10.968
Days to collect 48.1731 33.27941
11. The allowance method would be a better alternative because it allows the firm to
create a contra asset account based on an estimate of bad debts.
12. GAC should use the allowance method so that they can more reliably report
accounts receivable at net realizable value.
13. This alternative method would decrease the asset account “accounts receivable”.
This also decreases the current ratio because current assets is decreased. See
Appendix 5-1 & Figure 5-1
14. GAC reports sales returns in the month in which they occur. This is acceptable
when sales returns cannot be reasonably estimated or when estimated sales returns
are immaterial.
39
15. In 2014, half of the plain shirts inventory was damaged by the water leak in the
warehouse. The damaged shirts were to produce graphic tees for 2014 that were
sold to retailers. Nikki estimates that $15,000 of her product remains unsold in her
retail customers’ stores at year end 2014.
16. GAAP recommends estimating sales returns based using a contra asset account
for accounts receivables. This more reliably reports the net realizable value of
their accounts receivable account.
17. No, GAC should not use this alternative method in this instance. It is the correct
method, however, the scenario of the water damaged sold shirts falls under ASC
605-15-25 which says that firms should not recognize the sale at all if sales
returns are likely but cannot be estimated. For this reason, they should not
recognize the sale of this damaged inventory at all, until after the returns date has
passed.
18. Estimating sales returns in the form of a contra asset account is categorically the
better method for reporting sales returns when relevant.
19. This method reduces “accounts receivables” which decreases the current ratio
because current assets is lower.
20. GAAP requires inventory to be measured at “lower of cost and market”.
Additionally, if sales are likely to be returns, but returns cannot be reasonably
estimated, then the firm should not recognize revenue and should retain the goods
until return period has passed (ASC 605-15-25).
21. GAC has been measuring inventory at cost alone. This is appropriate when
market price is consistently above or the same as cost.
40
22. They have sold water damaged inventory, and this inventory’s market value is
less than cost. They also have recognized the sale of these damaged products,
even though sales returns are likely but not estimable. As a result, they should
value the damaged goods at inventory and not recognize revenue on sale until
after the returns deadline. Days to sell inventory as more than doubled as a result
of overvaluation of inventory. Inventory should appropriately be reported at
market price.
23. GAC will likely have to markdown the selling price for the damaged shirts below
cost. When inventory is returned or unsold during the season, it is sold to discount
retail stores at half the original selling price. Meanwhile, GAC’s gross profit
percentage is around 48%, therefore if unsold or returned, the graphic shirts will
likely be sold to a discount retail store at below costs. The assumption is that this
marked down value of the damaged shirts represents the net realizable value of
this inventory.
24. They should report all damaged goods in inventory including those that were
“sold” to retailers at market value or net realizable value.
25. There will be a net increase of equity, as cost of goods sold is reduced because the
sale will not be recognized until return period has passed. There is a net decrease
in current assets because accounts receivable is decreased more than inventory is
increased. This results in a decrease of the current ratio. See Appendix 5-1 &
Figure 5-1
41
26. All changes included and adjusted for, the current ratio will decrease from
1.3502x to 0.9051x. This means that GAC is in violation of their loan agreement
by not maintaining a current ratio of 1x.
27. In order to be in compliance with the loan covenant, she would need to raise at
least $4,999 in additional equity.
28. Nikki has three options at this point:
1. Provide the equity financing using her own funds.
- Would be ideal, but unlikely based on her current personal situation
2. Approach her current bank or another bank and ask for additional debt
financing.
- Also unlikely. The bank will more than likely point to the fact that she
cannot seem to manage the current debt financing she already has.
3. Begin to sell non-essential property, plant, and equipment.
- Could be detrimental to the long-term profitability of the company if she is
forced to sell off needed equipment.
Appendix 5-1

42
Case Six
Planes and Garbage – Depreciation and Fraud
43
Executive Summary
This two part report looks at the role of depreciation in various financial statements and
how a firm might use depreciation to mislead stockholders and investors.
The first part looks three different airlines and how they evaluate the useful life and
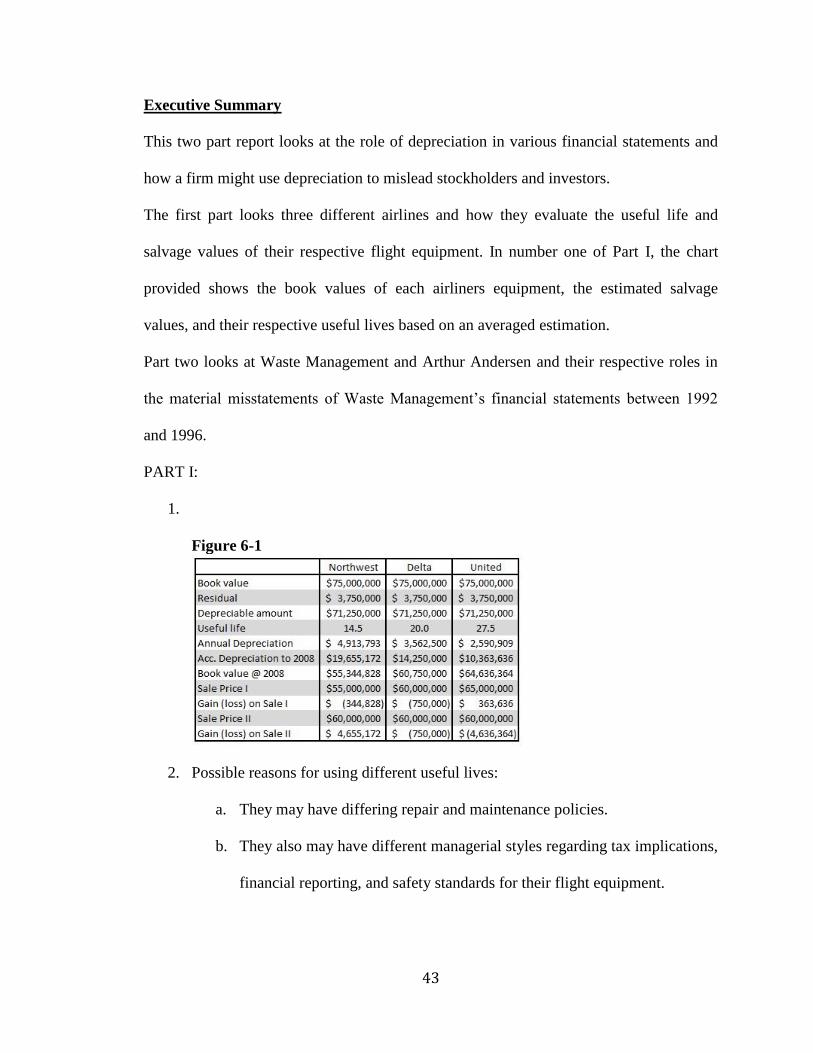
salvage values of their respective flight equipment. In number one of Part I, the chart
provided shows the book values of each airliners equipment, the estimated salvage
values, and their respective useful lives based on an averaged estimation.
Part two looks at Waste Management and Arthur Andersen and their respective roles in
the material misstatements of Waste Management’s financial statements between 1992
and 1996.
PART I:
1.
Figure 6-1
2. Possible reasons for using different useful lives:
a. They may have differing repair and maintenance policies.
b. They also may have different managerial styles regarding tax implications,
financial reporting, and safety standards for their flight equipment.
44
3. Sale price set I is more realistic because it puts the sales price closer to current
book value of the flight equipment for each company.
PART II:
1. Waste management was accused of falsifying financial reports and misleading
investors. Additionally, two members of management were accused of dumping
overinflated stock onto unsuspecting investors. Investors lost over six billion
dollars due to the Company’s misstatements. Under new management, Waste
Management made the largest restatement of financial reports in history, showing
that profits were overstated by $1.7 billion.
2. They extended the useful lives of assets and made unsupported increases to the
salvage values of their garbage trucks. This decreased depreciation expense,
thereby increased current earnings. Additionally, they intentionally failed to write
down or impair the value of landfills and inappropriately capitalized various
expenses.
3. The defendants involved in the summarized SEC complaint received a combined
total of $36,199,370 in ill-gotten gains in the form of bonuses, retirement benefits,
trading, and charitable giving. As a reward for “meeting” earnings projections,
many high level executives at the firm were given accelerated retirement
packages and generous bonuses. Dean Buntrock, CEO and founder, was
particularly brazened and profited greatly from the sale of inflated stocks just a
week before their accounting misstatements went public.
4. Arthur Anderson’s (AA) audit reports of Waste Management’s financial
statements were materially false and misleading. They acknowledged the firm’s
misstatements of net income but failed to enforce restatements and allowed the
45
Company to report these misstated financial statements. As a result, the SEC
brought enforcement actions and administrative proceedings against AA and four
of its partners. AA settled a civil injunctive action and the related administrative
proceedings for a historic $7 million. Three partners paid civil penalties regarding
their involvement in the fraud and were barred from practicing or appearing
before the SEC as accountants. One had the right to request reinstatement after
five years, but the other two partners could request reinstatement after three years.
The fourth partner was barred from practice with a request for reinstatement after
one year. They complied with these settlements but have since been involved in
other scandals and frauds; they no longer have an audit practice as a result.

46
Case Seven
Construct – Environmental Liabilities
47
Executive Summary
This analysis looks at a construction materials manufacturer (Construct) and the financial
reporting of an acquired property that resulted in an environmental liability. In 2007,
Construct purchased a manufacturing facility based in New York City from BigMix, Inc.,
a concrete manufacturer. Shortly after, BigMix went bankrupt, and Construct was
notified that the EPA was launching an investigation into the newly acquired facility
concerning water contamination. The EPA named Construct as a responsible party (PRP)
in 2010 and issued a unilateral administrative order to them requiring them to do a
remedial investigation and feasibility study (RI/FS). Ultimately, Construct became liable
for more than $1.5 million related to a remediation plan.
Through this report, an examination of GAAP and IFRS accounting standards helps firms
identify when they should appropriately report a loss contingency and, more specifically,
an environmental liability. Principally, both GAAP and IFRS state that a loss contingency
should not be reported unless it is both estimable and probable. Per GAAP in the case of
an environmental liability, a firm should recognize the liability at the point that a
remedial action is started (i.e. an investigation or planning stage), and if the costs
associated with the liability are both estimable and likely. The report, in discussing what
costs should be reported according to FASB and IASB, looks principally at ASC 410-30
and IAS 37.
1. In 2007, at the time of the purchase, should Construct record a liability for
environmental liabilities? If so, how much?
Per ASC 450-20-25-2, Construct should not have recorded a liability at the time
of purchase. In terms of IFRS, IAS 37.10 dictates that a contingent liability is also
48
“a possible obligation depending on whether some uncertain future event occurs,
or”. Since Construct included an indemnification provision in the purchase price,
it should have disclosed the possible future contingent liability [IAS 37.86].
2. In 2008, should the company record any liability due to BigMix filing for
Chapter 11? If so, how much?
BigMix’s financial position does not affect Construct’s status regarding, at the
time, a non-existent environmental liability [ASC 450-20-25-3] [IAS 37.10].
3. In 2009, should the company record any liability for the potential
environmental liability? If so, how much?
According to GAAP, two things happened here that creates a liability of $250,000
beginning in 2009: 1. Remedial action was started by the EPA and Construct’s
contracted environmental agency. [ASC 410-30-25-3] 2. There is a reasonable
estimate and probability of minimum costs that the firm could face. [ASC 410-30-
25-10] IFRS says the liability of $250,000 should be reported per IAS 37.15 and
IAS 37.40.
4. In 2010, should the company record any liability for the potential
environmental remediation? If so, how much?
Per GAAP, Construct should recognize $400,000 as an environmental liability,
even though they cannot predict the total costs of the remediation effort [ASC
410-30-25-11]. Additionally, the fact that the EPA issued a unilateral
administrative order means that there must be an “imminent and substantial
endangerment” at the site, meaning additional liabilities and losses is more than
49
likely [ASC 410-30-25-15b]. IFRS says that the $400,000 should be recorded as
part of the environmental liability [IAS 37.72 Appendix C, Examples 2B]
5. In 2011, should the company record any additional liability for the potential
environmental remediation?
GAAP says that the $1.5M implementation costs should be recognized as an
environmental liability for two reasons: 1. The RI/FS formulated a reasonably
estimated remediation cost associated with the site [ASC 410-30-25-15d]. 2. The
firm should be prepared to make adjustments to their estimates as uncertainties
are cleared up [ASC 410-30-25-13]. IFRS defends GAAP in this regard, and
according to IAS 37.40, Construct should recognize the $1.5M implementation
costs in addition to the other previously recognized liabilities.
6. In 2012, should the company record any gain contingency/contingent asset
for the potential settlement?
GAAP uses conservatism in this instance and only allows firms to report a gain
contingency in the form of a disclosure. However, it warns that firms should take
care not to be misleading with the disclosure [ASC 450-30-50]. In this case,
Construct could disclose the gain contingency for $1M. IFRS states that when
income is “virtually certain”, then the gain or “related asset” may be recognized
[IAS 37.31-35]. A 75% chance of income should not be considered virtually
certain, therefore the $1M lawsuit should only be disclosed at the time of
issuance.
50
Case Eight
Rite Aid Corporation – Long Term Debt
51
Executive Summary
In this analysis, one can begin to dissect Rite Aid’s long term debt and the impact their
debt will have on the overall financial solvency of the company. Initially, the analysis
looks at what kind of debt Rite Aid has and the different terms and conditions that come
with each type of debt. Next, the analysis looks at a few specific notes and their impact
on the financial statement from a yearly, transactional level.
Upon examination of those notes, there is a comparison of the effective interest rate
method vs. the straight line method. Each of the two methods affect how interest expense
and discount/premium amortization is recognized over the life of the note and how that
impacts the firm’s presentation of long term debt.
The analysis also looks at how the firm might repurchase notes and how they would
account for that on a transactional level. Lastly, the analysis breaks up the firm’s long
term debt based on solvency ratios.
Through that analysis, it is evident that Rite Aid is heavily reliant on debt financing and
because of their continued operating losses they could see imminent instability as their
debt matures. In addition, they are far less solvent that others in the industry based on the
industry average.
With that assessment and the basis of Standard & Poor’s credit rating descriptions, Rite
Aid most likely has a credit rating of “BB”.
Please note: All calculations and numerical values are in terms of thousands with the
exception of ratios and percentages.
52
a. i. Secured debt is backed by the pledge of collateral, while unsecured debt is not
backed by collateral. Additionally, unsecured debt has a higher interest rate
because it is riskier than secured debt. Rite aid has both of these types of debt.
ii. The parent company, Rite Aid Corporation, guarantees the debt of the
subsidiary, Rite Aid stores, with the parent company’s assets.
iii. Senior debt has higher priority of repayment in the event of the firm declaring
bankruptcy. The term “fixed-rate” refers to the interest, in that it does not float or
change during the life of the bond. Convertible notes/bonds is a type of debt that
can be exchanged for equity or, more specifically, stock in the firm.
iv. Different types of debt with different interest rates could be attributed to Rite
Aids relations with the creditor of the debt, or it could also have to do with the
economic or financial situation of the company or economy at the time the debt
was issued.
b. Rite Aid has $6,370,899 in total debt. $51,502 of the debt is current maturities due
within one year. Current maturities + Long-term debt, less current maturities +
Lease financing obligations, less current maturities= total debt
c. i. The face value is $500,000, and this is seen by the fact that the balance remains
unchanged year-to-year. Additionally, there is no mention of it being issued at
either a discount or premium.
ii. Cash $500,000
Bonds Payable $500,000
iii. Interest Expense $37,500(1)
Cash $37,500
iv. Bonds Payable $500,000
Cash $500,000
(1) 37,500= 500,000 * 7.5%
53
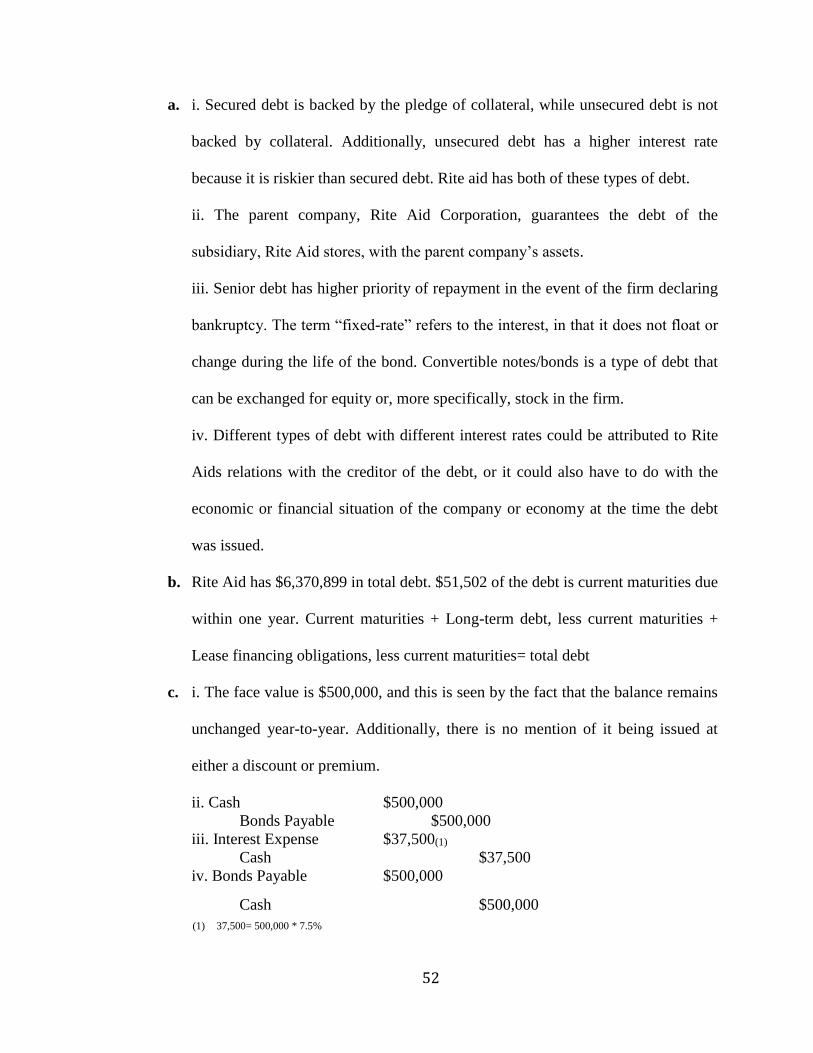
d. i. The face value is $410,000, and the carrying value is $405,951. The difference
is the unamortized discount ($4,049), which is amortized over the course of the
debt until the unamortized discount is equal to 0.
ii. The total interest paid in fiscal 2009 is $38,438(1).
iii. The total interest expense in fiscal 2009 is $39,143(2).
iv. Interest Expense $39,143
Discount on B/P $705(3)
Cash $38,438
v. 9.64 %( 4)
(1) $38,434 = $410,000 * 9.375%
(2) $39,143 = Interest paid (38,438) + Discount on B/P (705)
(3) $705 = ($4,049/ 69mths) * 12
(4) 9.64% = $39,143 / $405,951
e. i. Cash $402,620(1)
Discount on N/P $7,380(2)
Notes Payable $410,000
ii. 10.1212 %( 3)
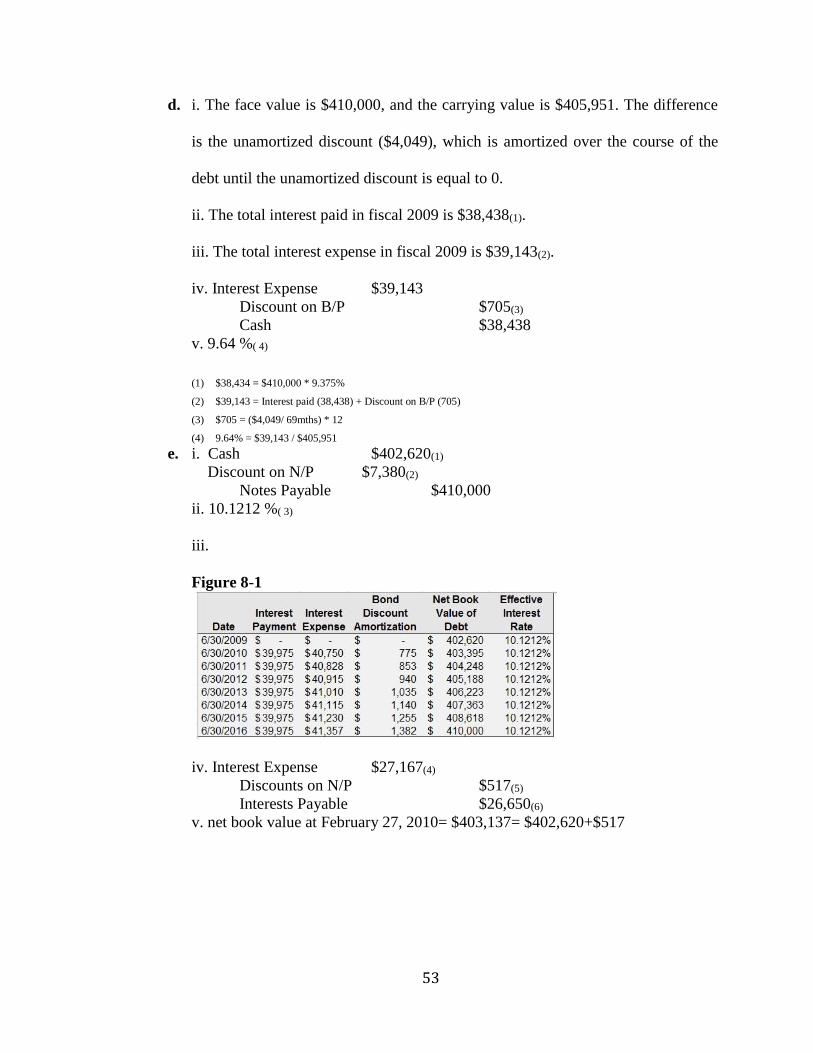
iii.
Figure 8-1
iv. Interest Expense $27,167(4)
Discounts on N/P $517(5)
Interests Payable $26,650(6)
v. net book value at February 27, 2010= $403,137= $402,620+$517
54
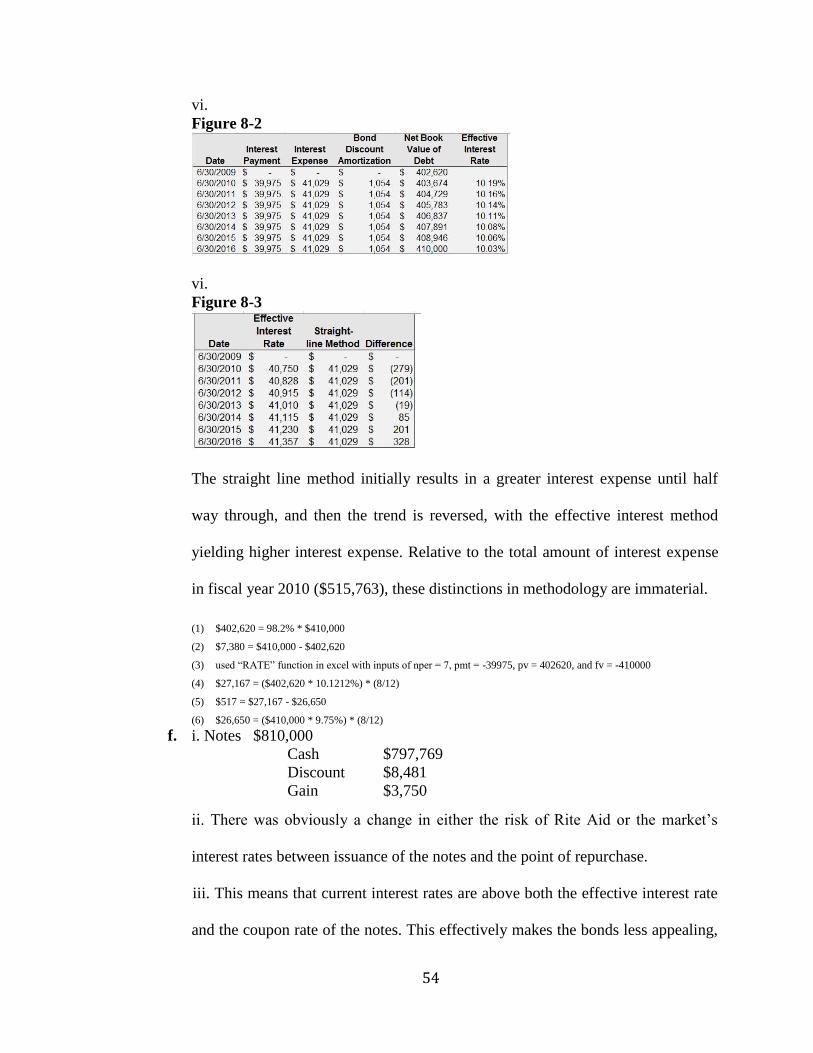
vi.
Figure 8-2
vi.
Figure 8-3
The straight line method initially results in a greater interest expense until half
way through, and then the trend is reversed, with the effective interest method
yielding higher interest expense. Relative to the total amount of interest expense
in fiscal year 2010 ($515,763), these distinctions in methodology are immaterial.
(1) $402,620 = 98.2% * $410,000
(2) $7,380 = $410,000 - $402,620
(3) used “RATE” function in excel with inputs of nper = 7, pmt = -39975, pv = 402620, and fv = -410000
(4) $27,167 = ($402,620 * 10.1212%) * (8/12)
(5) $517 = $27,167 - $26,650
(6) $26,650 = ($410,000 * 9.75%) * (8/12)
f. i. Notes $810,000
Cash $797,769
Discount $8,481
Gain $3,750
ii. There was obviously a change in either the risk of Rite Aid or the market’s
interest rates between issuance of the notes and the point of repurchase.
iii. This means that current interest rates are above both the effective interest rate
and the coupon rate of the notes. This effectively makes the bonds less appealing,
55
meaning that the coupon could buy them back for less than their current carrying
value.
g. Notes Payable xx
Discount xx
Common Stock (par) xx
Add PIC xx
Firms issue convertible notes as an alternative to just paying back the bondholder
with cash. This will decrease liabilities and increase equity.
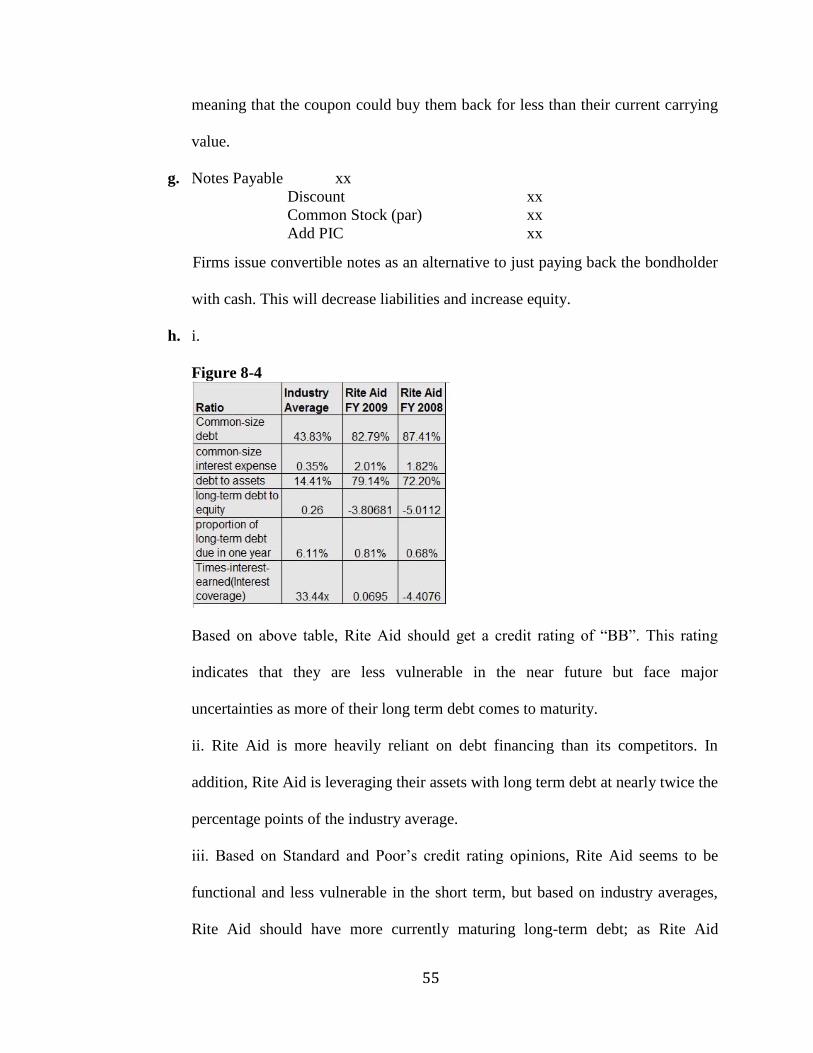
h. i.
Figure 8-4
Based on above table, Rite Aid should get a credit rating of “BB”. This rating
indicates that they are less vulnerable in the near future but face major
uncertainties as more of their long term debt comes to maturity.
ii. Rite Aid is more heavily reliant on debt financing than its competitors. In
addition, Rite Aid is leveraging their assets with long term debt at nearly twice the
percentage points of the industry average.
iii. Based on Standard and Poor’s credit rating opinions, Rite Aid seems to be
functional and less vulnerable in the short term, but based on industry averages,
Rite Aid should have more currently maturing long-term debt; as Rite Aid

56
continues to operate at a loss, they will approach maturity of this long-term and
will be a more risk based on my assessment. This financial situation, for my
assessment, gives them a credit rating of “BB”.

57
Case Nine
Merck & Co., Inc. and GlaxoSmithKline plc-
Shareholders’ Equity
58
Executive Summary
The below report looks in depth at three essential concepts related to Merck, an American
pharmaceutical firm, and GlaxoSmithKline, a British firm:
1. Differences between U.S. GAAP and IFRS reporting in regards to dividends and
stockholders’ equity
2. Differences in financial information between the two firms and across multiple
years.
3. Understanding how firms’ make decisions relating to the equity side of the
balance sheet in regards to dividends, treasury stock, and common stock issuance.
Through an analysis of Merck and Glaxo’s financing activities and equity standing, there
are two facts that can be surmised:
1. Merck pays out more cash dividends than Glaxo relative to operating cash flows,
net income, and stock price in any given year.
2. Glaxo has a higher stock price and more shares outstanding than Merck.
Based on the above information, it seems that Glaxo relies less on cash dividends to draw
in investors, but instead, it can be assumed that it builds shareholders’ trust by showing
growth and innovation. Meanwhile, Merck offers more cash dividends relative to its
operating performance as a way of building shareholder trust.
The analyses in these report offers insight into the inner workings of Glaxo and Merck, as
well as how they draw in investors and what their strategic goals are.
CONCEPTS
a. i. 5.4 billion shares have been authorized to issue by Merck.
ii. 2,983,508,675 shares have been issued as of 2007.
59
iii. $1 per share is the par value of the shares issued as of 2007.
iv. 811,005,791 common share are held in treasury in 2007.
v. 2,172,502,884 (shares issued less treasury stock) common shares are
outstanding in 2007.
vi. Shares outstanding x stock price = $125,157,891,147 or the total market
capitalization at the end of 2007.
b. i. 10 billion shares are authorized for issuance by GlaxoSmithKline.
ii. 6,012,587,026 shares have been issued as of 12/31/2007.
iii. 5,373,862,962 shares are in free issue as of 12/31/2007.
iv. 504,194,158 shares are held in treasury as of 12/31/2007.
v. Share capital represents capital stock or the par value of all contributions from
shareholders. Share premium account represents all additionally contributed
capital. Merck refers to “share premium account” as “other paid in capital”, while
the “share capital” account is referred to as “capital stock”.
c. Companies pay dividends as a way of assuring stockholders that their profits are
real and tangible. It is a way for stockholders to see a real return on investment.
Typically, share price is goes down at two different points. It first goes down at
the ex-dividend date (the date that determines who is eligible for the dividend)
because after that point, new stockholders will be ineligible for the dividend
payment. The share price goes down once more after the dividend is paid out
because cash flows are reduced by the dividend payment.
60
d. Companies repurchase their own shares for various reasons. Typically, companies
repurchase shares for three reasons: to prevent a takeover/buyout, to improve
earnings per share, or to improve return on equity.
PROCESS
e. Dividends declared £3,310,700,000
Cash £3,307,300,000
Dividends Payable £3,400,000
f. i. Dividends declared £2,793,000,000
Cash £2,793,000,000
ii. The total dividends declared in 2007 (£ 2,905,000,000) is different from
dividends in the statement of cash flows (£ 2,793,000,000) because, per IFRS,
firms cannot recognize interim dividends until they are actually paid.
g. i. They use the cost method whereby treasury stock decreases the sum of
contributed capital and retained earnings. Additionally, treasury stock is valued at
market value as opposed to the par value of the stocks originally at issuance.
ii. In 2007, Merck repurchased 26.5 million common shares.
iii. In total, Merck repurchased $1,429,700,000 worth of common shares during
2007 at an average rate of $53.95 per share. The repurchasing of common shares
is a financing cash flow.
iv. Treasury stock is not considered an asset and is instead reported as a contra-
equity account. Recognizing treasury stock as an asset would violate the
economic entity concept of the GAAP conceptual framework.
h. i. Glaxo repurchased 285,034,000 ordinary shares in 2007.
ii. The company paid £3,750,000,000 for ordinary shares repurchased at a rate of
£13.16 per share.
61
iii. This statement is referred to as the “statement of stockholders’ equity” in
terms of U.S. GAAP. The journal entry decreases retain earnings rather than
going in a dividends paid account like it would under U.S. GAAP.
Retained Earnings £3,750,000,000
Cash £3,750,000,000
ANALYSIS
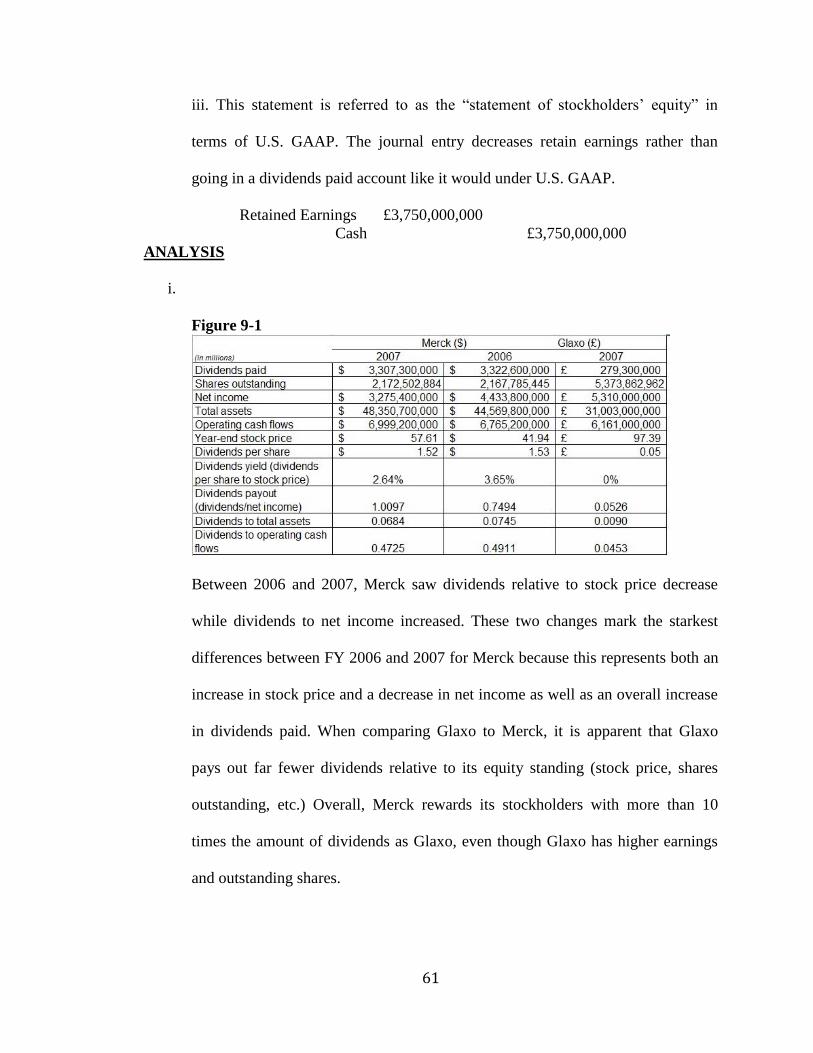
i.
Figure 9-1
Between 2006 and 2007, Merck saw dividends relative to stock price decrease
while dividends to net income increased. These two changes mark the starkest
differences between FY 2006 and 2007 for Merck because this represents both an
increase in stock price and a decrease in net income as well as an overall increase
in dividends paid. When comparing Glaxo to Merck, it is apparent that Glaxo
pays out far fewer dividends relative to its equity standing (stock price, shares
outstanding, etc.) Overall, Merck rewards its stockholders with more than 10
times the amount of dividends as Glaxo, even though Glaxo has higher earnings
and outstanding shares.

62
Case Ten
State Street Corporation- Marketable Securities
63
Executive Summary
This report examines the marketable securities owned and sold by State Street
Corporation during fiscal year 2012. Trading, available-for-sale, and held-to-maturity
securities are the focus of parts a, b, & c. The main distinction between these securities is
in the purpose or motivation of the firm’s acquisition of the security.
Trading securities are short-term investments that are expected to give some kind of
return and are reported at fair market value, and while similar, available-for-sale
securities are different because they are bought with the intention of being sold prior to
maturity date. Held-to-maturity securities are the most distinctive because they are debt
investments that are reported at cost and are purchased with the intention of being held
until the maturity date. The net value of these is adjusted by using valuation accounts that
amortize the premium or discount of the security.
The last part of the report focuses on realized and unrealized gains (losses), the buying
and selling of securities, and the impact of these transactions on the financial statements.
By examining the impact of the gains and losses in these transactions, there is a better
understanding of how these securities can affect the overall perception of the financial
statements to investors.
All in all, firms’ motivations and intentions for buying and selling investment securities
can affect the overall financial statements. Trading and AFS securities are adjusted year-
to-year to match their fair market value. These adjustments represent unrealized gains or
losses that are not reported on the income statement or cash flow statement, but instead,
they are represented as accumulated other comprehensive income in the equity section of
the balance sheet. Held-to-maturity investment securities are typically bonds that are held
64
to their maturity date and are reported at their carrying value or the difference between
cost and unamortized discount or premium. These distinctions and the firm’s intentions
can have major impacts on shareholders’ returns and managerial decisions.
CONCEPTS
a. i. Trading securities are short-term equity and debt investments that are reported
at fair market value and are expected to give a return.
ii. They would debt cash and credit some sort of income statement account which
would be reported as revenue on the income statement.
iii. The company would record an increase in the value of the trading securities
account by debiting that account and crediting an unrealized gain that will appear
on a consolidated statement of comprehensive income.
b. i. Available-for-sale securities are investments reported at fair market value that
are purchased with the intent of selling prior to their maturity date.
ii. This income would be reported as other income or revenues on the income
statement.
iii. If the market value of the AFS securities increased, then the company would
record a debit to that securities account and a credit to unrealized holding loss that
would go to accumulated other comprehensive income.
c. i. Held-to-maturity securities are debt securities that the company holds until the
securities maturity date. The most common type of HTM security is a bond, and
they are held at cost, while being adjusted in their net value by amortizing
premiums and discounts. Equity maturities may never be classified as held-to-
maturity.
65
ii. Market value has no bearing on the reported value of HTM securities.
PROCESS
d. i. $637,000,000 is the balance in the “trading account assets” account 12/31/2012.
This account is reported at its market value.
ii. Trading account assets $85,000,000
Unrealized holding gain on trading securities $85,000,000
e. i. The year-end balance of this account is $11,379 million.
ii. The year-end market value is equal to 11,661 million.
iii. The amortized costs are $11,379 million. The amortized costs represent the
difference between the purchase price of the security and the premium or discount
on the security.
iv. Market value is higher than the amortized costs because the securities are
currently more valuable than they were at the point of purchase. This market
value plays no real significance on the value of the securities.
f. i. $109,682 million. This represents the fair value of the securities.
ii. $1,119 million is the total NET GAIN of the unrealized holding gains and
losses on available for sale securities.
iii. $55,000,000 net gains on sales of AFS securities were realized in 2012. This
would create an increase in the income statement under other revenues. This will
also decrease the investing cash flows of the cash flows but an overall increase in
cash flows.
g. i. Investments- securities AFS $60,812
Cash $60,812
ii. Unrealized gains from investments- securities AFS $67
Cash $5,399
Investments- securities AFS $5,411
Realized gain from sales of AFS securities $55
66
iii. The original cost of the AFS securities sold is $5,411 million. This is based on
the credit made to the “Investments- securities AFS” in part g. ii.
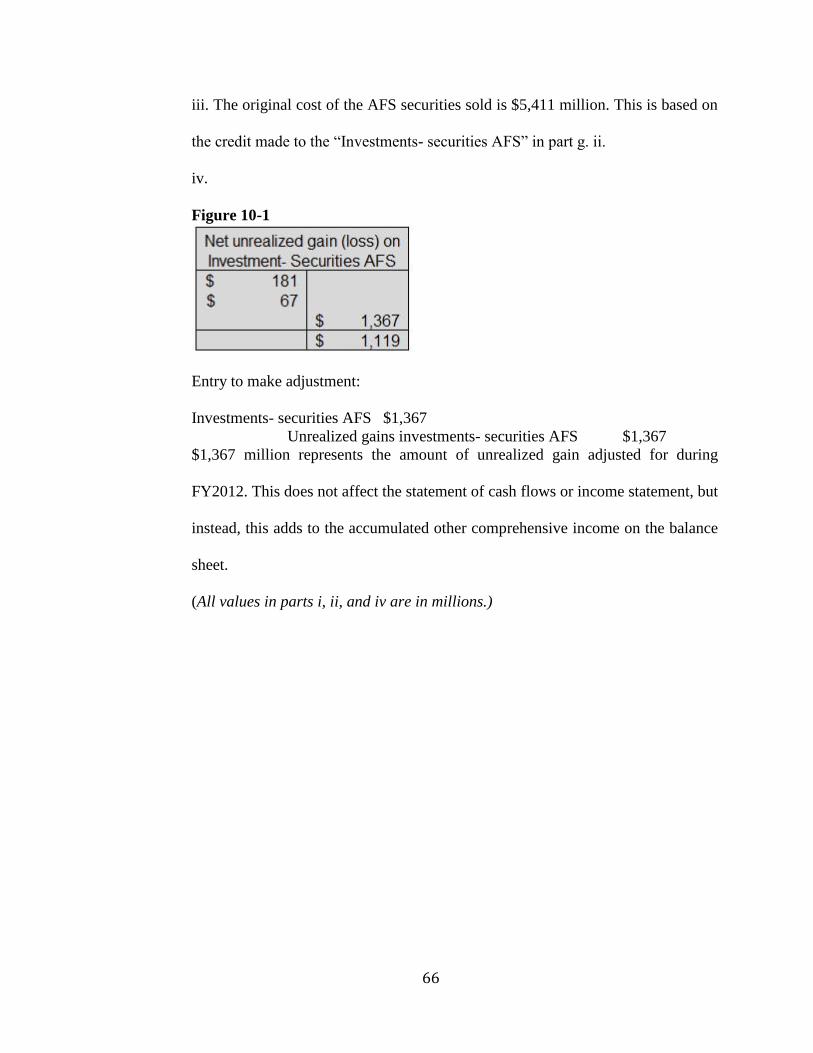
iv.
Figure 10-1
Entry to make adjustment:
Investments- securities AFS $1,367
Unrealized gains investments- securities AFS $1,367
$1,367 million represents the amount of unrealized gain adjusted for during
FY2012. This does not affect the statement of cash flows or income statement, but
instead, this adds to the accumulated other comprehensive income on the balance
sheet.
(All values in parts i, ii, and iv are in millions.)

67
Case Eleven
Groupon- Revenue Recognition
68
Executive Summary
This analysis of revenue recognition primarily focuses on three things to help the reader
establish an understanding of the topic:
1. How to utilize financial statements to make comparisons across companies, time,
and even industries.
2. How to better apply the FASB codification system and GAAP to real-world
problems.
3. How to break down a business transaction to see how to apply GAAP and
rudimentary double entry bookkeeping.
Initially by comparing Wal-Mart, Amazon, and Groupon and their respective business
risks, the reader can better understand what kind of company Groupon is in terms of its
market development, its business model, and its performance alongside its competitors.
Then when looking at how income, revenue, and stock price affects a company over time,
the reader will see the vast implications that revenue recognition has on the life of a
company and its performance in the capital markets. Lastly, the remainder of the analysis
looks at four key topics regarding Groupon’s particular issues surrounding revenue
recognition:
1. How the company performed using its old revenue recognition model.
2. How moving from the gross method to the net method of revenue recognition can
affect overall “perceived” performance.
3. Why companies like Groupon with expansive sales returns policies cannot simply
recognize revenue at the point of sale (POS).
69
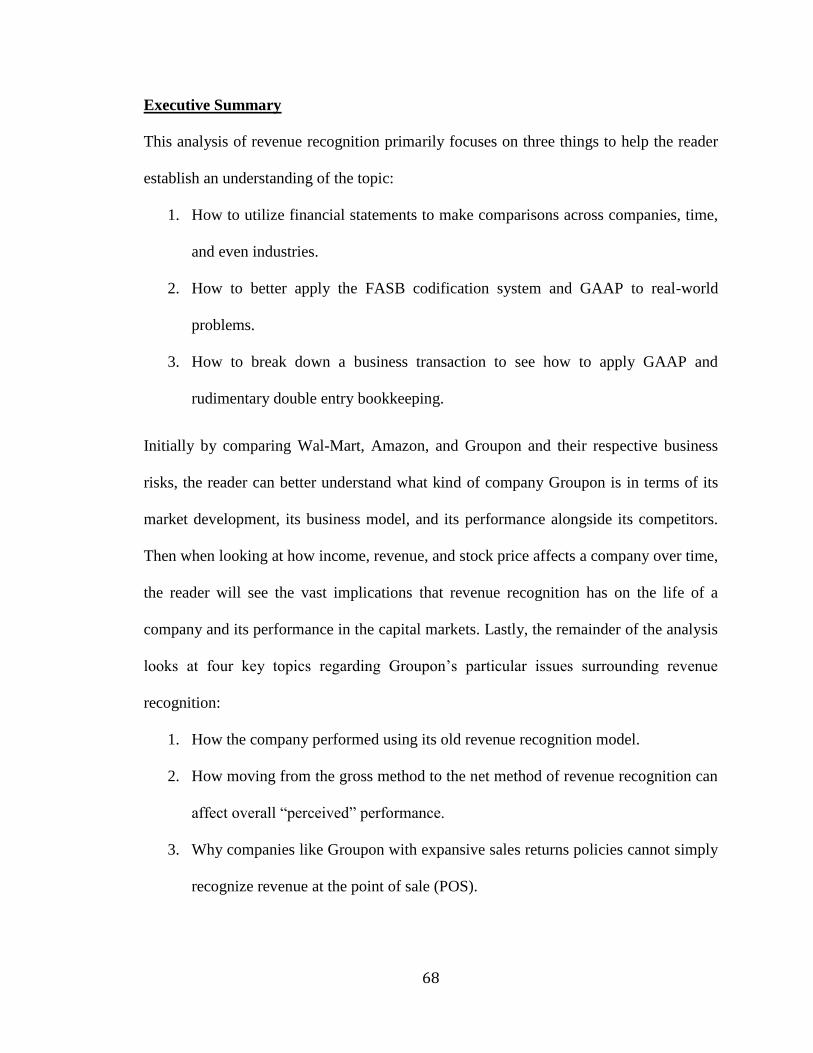
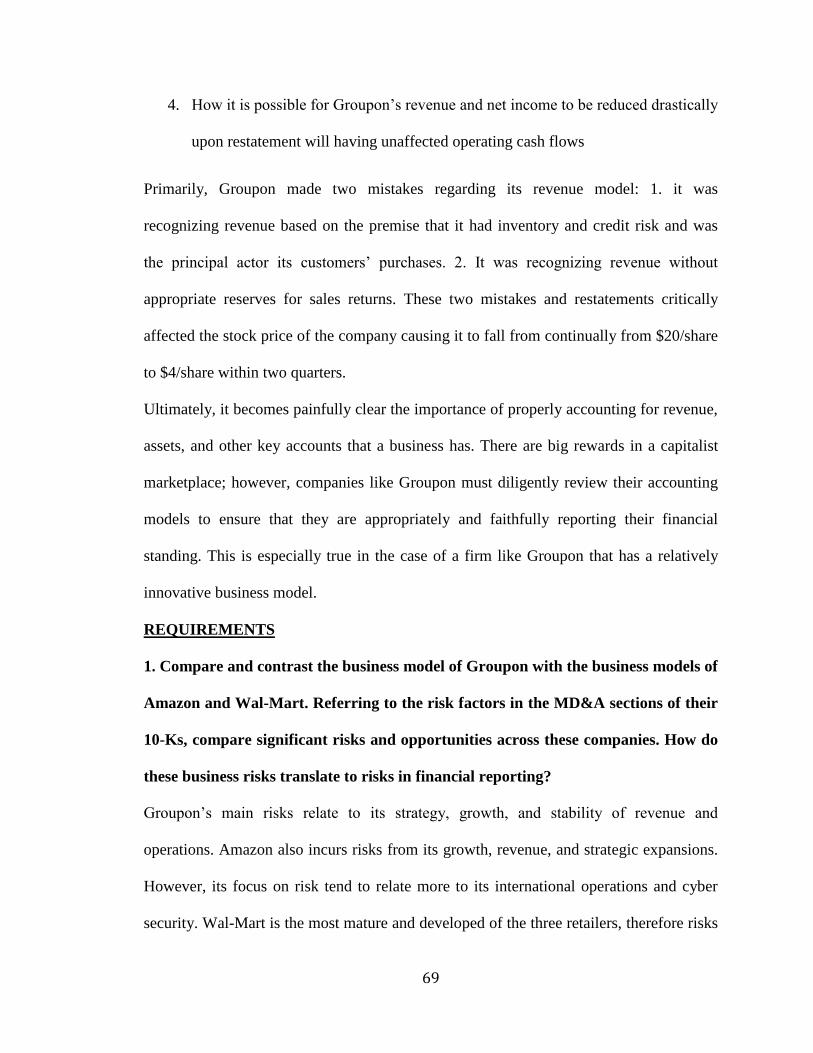
4. How it is possible for Groupon’s revenue and net income to be reduced drastically
upon restatement will having unaffected operating cash flows
Primarily, Groupon made two mistakes regarding its revenue model: 1. it was
recognizing revenue based on the premise that it had inventory and credit risk and was
the principal actor its customers’ purchases. 2. It was recognizing revenue without
appropriate reserves for sales returns. These two mistakes and restatements critically
affected the stock price of the company causing it to fall from continually from $20/share
to $4/share within two quarters.
Ultimately, it becomes painfully clear the importance of properly accounting for revenue,
assets, and other key accounts that a business has. There are big rewards in a capitalist
marketplace; however, companies like Groupon must diligently review their accounting
models to ensure that they are appropriately and faithfully reporting their financial
standing. This is especially true in the case of a firm like Groupon that has a relatively
innovative business model.
REQUIREMENTS
1. Compare and contrast the business model of Groupon with the business models of
Amazon and Wal-Mart. Referring to the risk factors in the MD&A sections of their
10-Ks, compare significant risks and opportunities across these companies. How do
these business risks translate to risks in financial reporting?
Groupon’s main risks relate to its strategy, growth, and stability of revenue and
operations. Amazon also incurs risks from its growth, revenue, and strategic expansions.
However, its focus on risk tend to relate more to its international operations and cyber
security. Wal-Mart is the most mature and developed of the three retailers, therefore risks
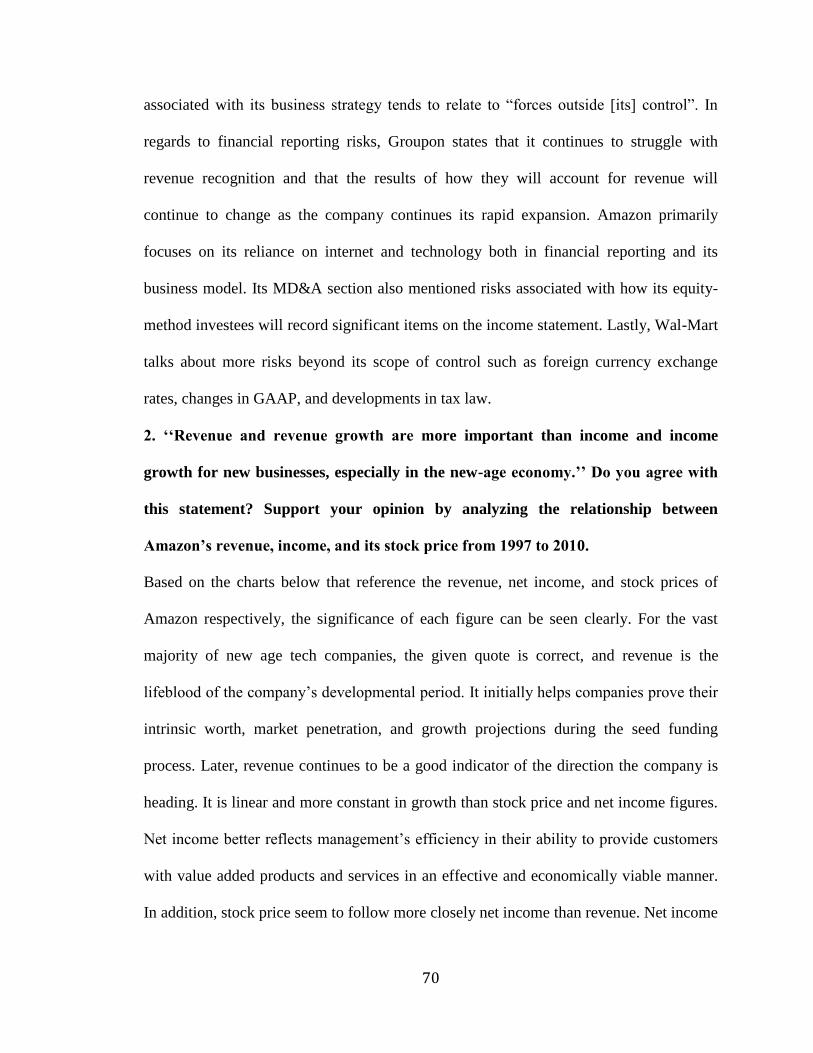
70
associated with its business strategy tends to relate to “forces outside [its] control”. In
regards to financial reporting risks, Groupon states that it continues to struggle with
revenue recognition and that the results of how they will account for revenue will
continue to change as the company continues its rapid expansion. Amazon primarily
focuses on its reliance on internet and technology both in financial reporting and its
business model. Its MD&A section also mentioned risks associated with how its equity-
method investees will record significant items on the income statement. Lastly, Wal-Mart
talks about more risks beyond its scope of control such as foreign currency exchange
rates, changes in GAAP, and developments in tax law.
2. ‘‘Revenue and revenue growth are more important than income and income
growth for new businesses, especially in the new-age economy.’’ Do you agree with
this statement? Support your opinion by analyzing the relationship between
Amazon’s revenue, income, and its stock price from 1997 to 2010.
Based on the charts below that reference the revenue, net income, and stock prices of
Amazon respectively, the significance of each figure can be seen clearly. For the vast
majority of new age tech companies, the given quote is correct, and revenue is the
lifeblood of the company’s developmental period. It initially helps companies prove their
intrinsic worth, market penetration, and growth projections during the seed funding
process. Later, revenue continues to be a good indicator of the direction the company is
heading. It is linear and more constant in growth than stock price and net income figures.
Net income better reflects management’s efficiency in their ability to provide customers
with value added products and services in an effective and economically viable manner.
In addition, stock price seem to follow more closely net income than revenue. Net income
71
and stock price are usually positively correlated, and typically, the market tends
approximate net income with some level of accuracy and precision. See Figures 11-1,
11-2, & 11-3 for comparative graphs of Amazon’s revenue, income, and stock prices.
Figure 11-1
Figure 11-2
Figure 11-3
3. Using the data provided in Figure 11-4, prepare common size income statements
using revenues and cost-of-goods-sold in the original S-1 and amended S-1. Analyze
trends of expenses as a percentage of revenue for 2009 and 2010. Compare and
contrast the following ratios:
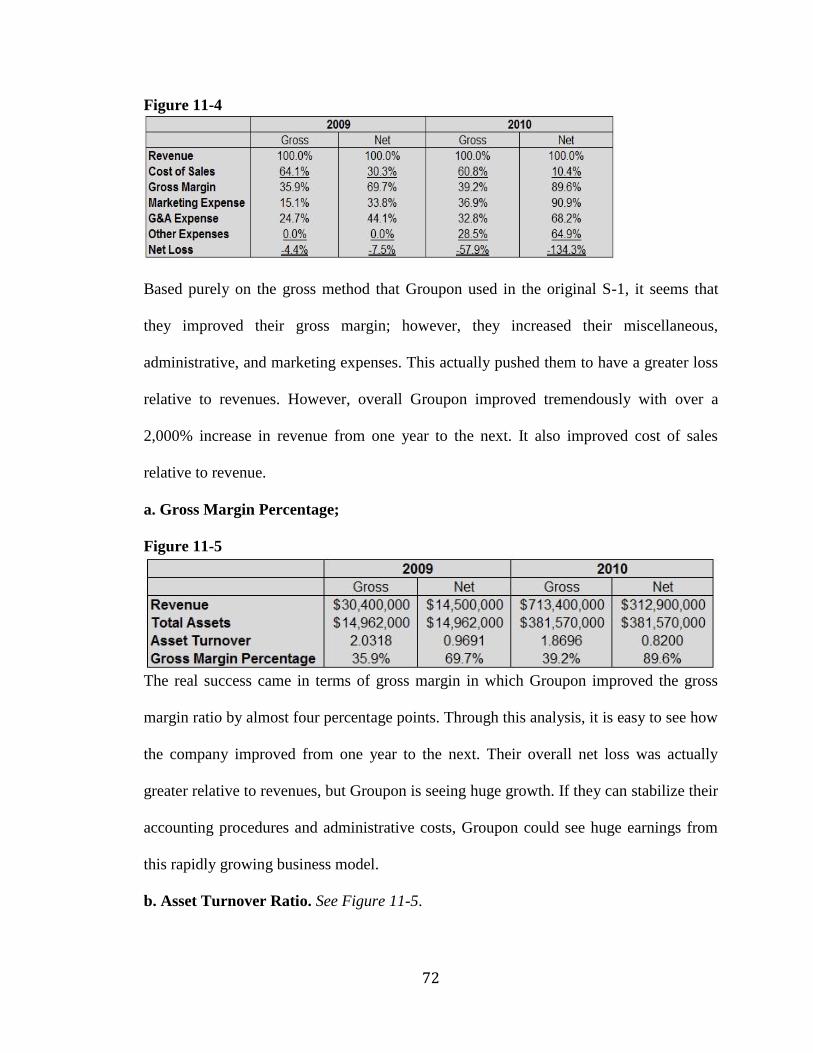
72
Figure 11-4
Based purely on the gross method that Groupon used in the original S-1, it seems that
they improved their gross margin; however, they increased their miscellaneous,
administrative, and marketing expenses. This actually pushed them to have a greater loss
relative to revenues. However, overall Groupon improved tremendously with over a
2,000% increase in revenue from one year to the next. It also improved cost of sales
relative to revenue.
a. Gross Margin Percentage;
Figure 11-5
The real success came in terms of gross margin in which Groupon improved the gross
margin ratio by almost four percentage points. Through this analysis, it is easy to see how
the company improved from one year to the next. Their overall net loss was actually
greater relative to revenues, but Groupon is seeing huge growth. If they can stabilize their
accounting procedures and administrative costs, Groupon could see huge earnings from
this rapidly growing business model.
b. Asset Turnover Ratio. See Figure 11-5.
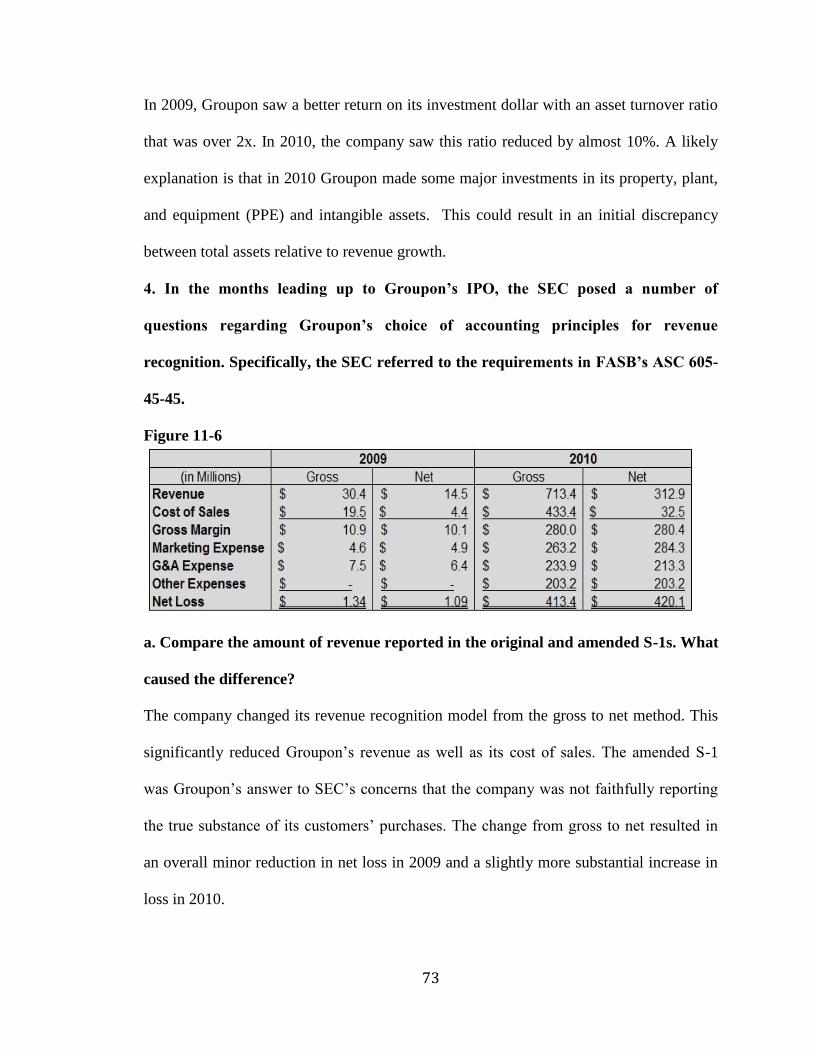
73
In 2009, Groupon saw a better return on its investment dollar with an asset turnover ratio
that was over 2x. In 2010, the company saw this ratio reduced by almost 10%. A likely
explanation is that in 2010 Groupon made some major investments in its property, plant,
and equipment (PPE) and intangible assets. This could result in an initial discrepancy
between total assets relative to revenue growth.
4. In the months leading up to Groupon’s IPO, the SEC posed a number of
questions regarding Groupon’s choice of accounting principles for revenue
recognition. Specifically, the SEC referred to the requirements in FASB’s ASC 605-
45-45.
Figure 11-6
a. Compare the amount of revenue reported in the original and amended S-1s. What
caused the difference?
The company changed its revenue recognition model from the gross to net method. This
significantly reduced Groupon’s revenue as well as its cost of sales. The amended S-1
was Groupon’s answer to SEC’s concerns that the company was not faithfully reporting
the true substance of its customers’ purchases. The change from gross to net resulted in
an overall minor reduction in net loss in 2009 and a slightly more substantial increase in
loss in 2010.
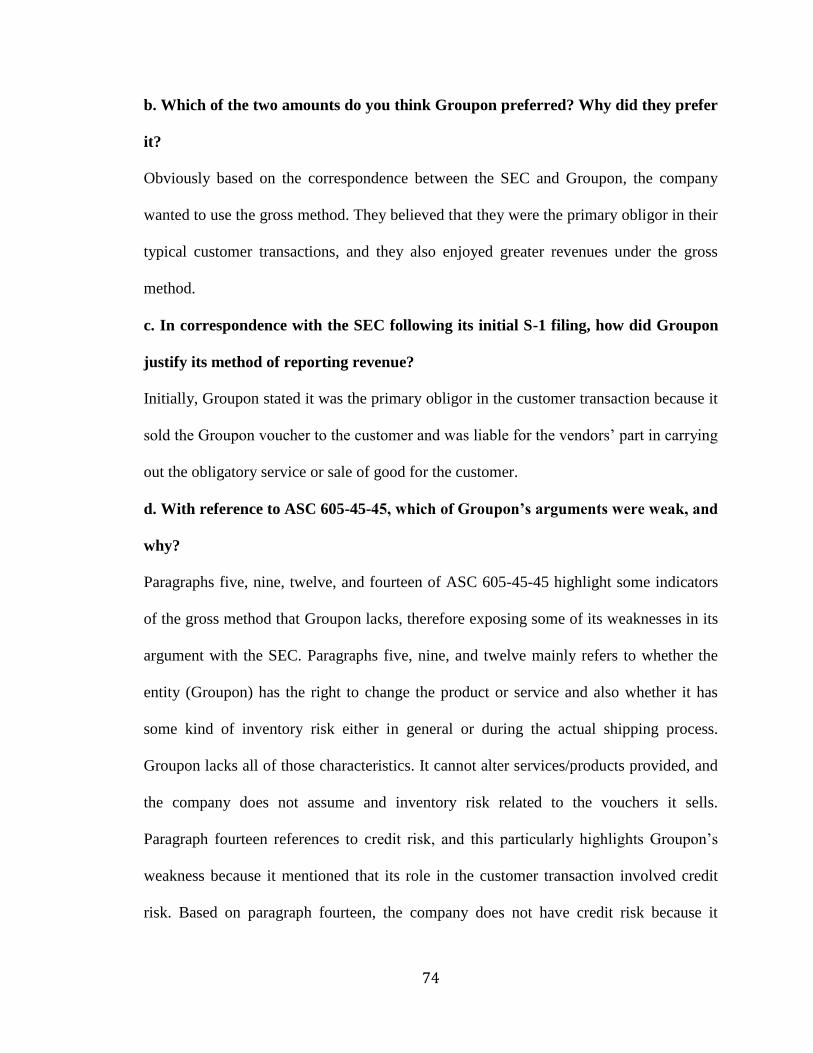
74
b. Which of the two amounts do you think Groupon preferred? Why did they prefer
it?
Obviously based on the correspondence between the SEC and Groupon, the company
wanted to use the gross method. They believed that they were the primary obligor in their
typical customer transactions, and they also enjoyed greater revenues under the gross
method.
c. In correspondence with the SEC following its initial S-1 filing, how did Groupon
justify its method of reporting revenue?
Initially, Groupon stated it was the primary obligor in the customer transaction because it
sold the Groupon voucher to the customer and was liable for the vendors’ part in carrying
out the obligatory service or sale of good for the customer.
d. With reference to ASC 605-45-45, which of Groupon’s arguments were weak, and
why?
Paragraphs five, nine, twelve, and fourteen of ASC 605-45-45 highlight some indicators
of the gross method that Groupon lacks, therefore exposing some of its weaknesses in its
argument with the SEC. Paragraphs five, nine, and twelve mainly refers to whether the
entity (Groupon) has the right to change the product or service and also whether it has
some kind of inventory risk either in general or during the actual shipping process.
Groupon lacks all of those characteristics. It cannot alter services/products provided, and
the company does not assume and inventory risk related to the vouchers it sells.
Paragraph fourteen references to credit risk, and this particularly highlights Groupon’s
weakness because it mentioned that its role in the customer transaction involved credit
risk. Based on paragraph fourteen, the company does not have credit risk because it
75
collects the full amount of the sale prior to paying the supplier (i.e. the airline, cruise
company, etc). Therefore, its argument and basis for using the gross method is materially
weak.
5. Groupon had recognized revenue for the sale of high-ticket items in late 2011.
Purchasers of the Groupons have a right of return, as specified in the ‘‘Groupon
Promise,’’ prominently featured on its website.
e. Assess the U.S. GAAP requirement for recognition of revenue when right of
return exists, specified in ASC Section 605-15-25, in the context of Groupon’s
business model.
The primary issue that Groupon has for recognize the revenue at point of sale (POS)
comes from ASC 605-15-25-1f. This section discusses the need to estimate sales returns
if there exists a right of return policy. Paragraph three expands on this by explaining three
four scenarios in which estimating a reasonable sales return amount might not be
plausible. Groupon’s business model subjects it to three of the four scenarios. The
company lacks historical experience of similar types of sales (ASC 605-15-25-3c), there
are relatively long periods between POS and time to return (ASC 605-15-25-3b), and
there is significant external factors that can affect the viability of fulfillment of
Groupon’s suppliers’ obligations (i.e. weather, long-term global economic factors, etc.)
(ASC 605-15-25-3a). These are just some of the reasons Groupon’s revenue recognition
policy was not complaint with GAAP.
f. Do you agree with Groupon’s accounting? Why or why not?
I understand and see why Groupon would decide to account for revenue in the manner
that it did. However, my empathy and understanding does not outweigh the magnitude of
76
this matter. Ultimately, Groupon was mistaken, and to me, it seemed they were trying to
rush revenue recognition and apply revenue related to the principal entity rather than the
net amount appropriate for an agent (i.e. what Groupon was in their business model).
g. What could Groupon have done differently, and how would the financial
statements have been affected?
From the beginning, Groupon could have recognized revenue net of fees due to the
merchant. They could have delayed revenue recognition until the merchant had supplied
the product or service. Alternatively, they could have changed their sales return policy to
limit it to a certain time period, or they could have removed the “unconditional” clause
from the policy. Obviously, in the first scenario they would have seen reduced revenues
and delayed revenue recognition. This could have hurt matching between expenses and
revenues. As for the alternative, it is difficult to tell if Groupon would have been as
successful without the unconditional “Groupon Promise”. It seems that this sales return
policy provided customers with confidence that Groupon would deliver on the deals it
offered through the site. This became especially important in 2011 when it began offering
more high-dollar vacations, trips, and other services.
6. Groupon’s restatement of 2011 fourth-quarter financials resulted in a reduction
of $14.3 million of revenues and a decrease of $30 million of operating income.
However, its operating cash flow was unaffected. Explain how this is possible.
The actual flow of cash never changes throughout any of these restatements. These
restatements and changes relate exclusively to the presentation of the income statement
and the accrual of revenue.

77
Case Twelve
ZAGG, Inc. - Deferred Income Taxes
78
Executive Summary
This report dissects with relative detail the impact of ZAGG Inc.’s deferred income taxes
on its financial statement. Firstly, the concepts section outlines some of the integral
definitions and ideas related to deferred income taxes and their impact on the balance
sheet and income statement. Next, the process section examines how one can take a
working knowledge of deferred income taxes to extract previously unpresented
information such as net PPE under the tax system’s depreciation expense method. Lastly,
the report analyzes a hypothetical situation in which the statutory tax rate is changed.
The overarching theme in the report is understanding why the tax and book systems are
different and how those differences affect/will affect tax provisions and the overall
performance of the firm. The most common and complicated type of difference in
reporting systems is a temporary difference. This results typically when the book system
is accruing or deferring revenue or expense, while tax is forced to recognize this revenue
or expense as incurred. Most importantly to note, this temporary difference should
theoretically reverse itself down the road as the asset related to it is sold, or the actual
expense or revenue is incurred. This scenario results in a current year deferred tax asset
or liability. This asset or liability represents future tax benefits or payments respectively.
The topic of this report has two important implications for all stakeholders involved: 1.)
By explaining the basic concepts, it can help investors better see where the profitability
of the company actually lies in relation to its current and future tax provisions 2.) It helps
management to understand how they can better do tax planning, bookkeeping, and asset
structuring. The implication of understanding deferred income taxes leads to direct
benefits for both internal and external users.

79
CONCEPTS
j. Book income refers to a firm’s financial income prior to the deduction of its
respective tax provisions. In the case of ZAGG, Inc., the book income is referred
to as the “income before provision for income taxes”. In 2012, this value came to
a total of $23.9 million. Fundamental differences between the tax code and U.S.
GAAP in regards to revenue and expense recognition are what partially creates
the distinction between taxable income and book income.
k. i. Permanent tax differences are differences that arise between financial reporting
income and taxable income. These differences will never be reconciled and will
not show up in the other type of income in the future. An example of a permanent
tax difference would be the interest on municipal bonds that is seen in financial
reporting but is not reported as taxable income because it is and will always be
tax-exempt.
ii. Temporary tax differences are differences in financial and taxable income that
will one day be reconcilable to each other in future periods. An example would be
bad debt expense which is estimated and placed in an allowance account in
financial reporting but is reported on as incurred (cash basis) for tax purposes.
iii. For example, the top statutory marginal tax rate for individual taxpayers in the
federal tax code is 39.6%.
iv. An effective tax rate is equal to taxes paid divided by total income. This rate
effectively determines how much of total income is being paid to the government.
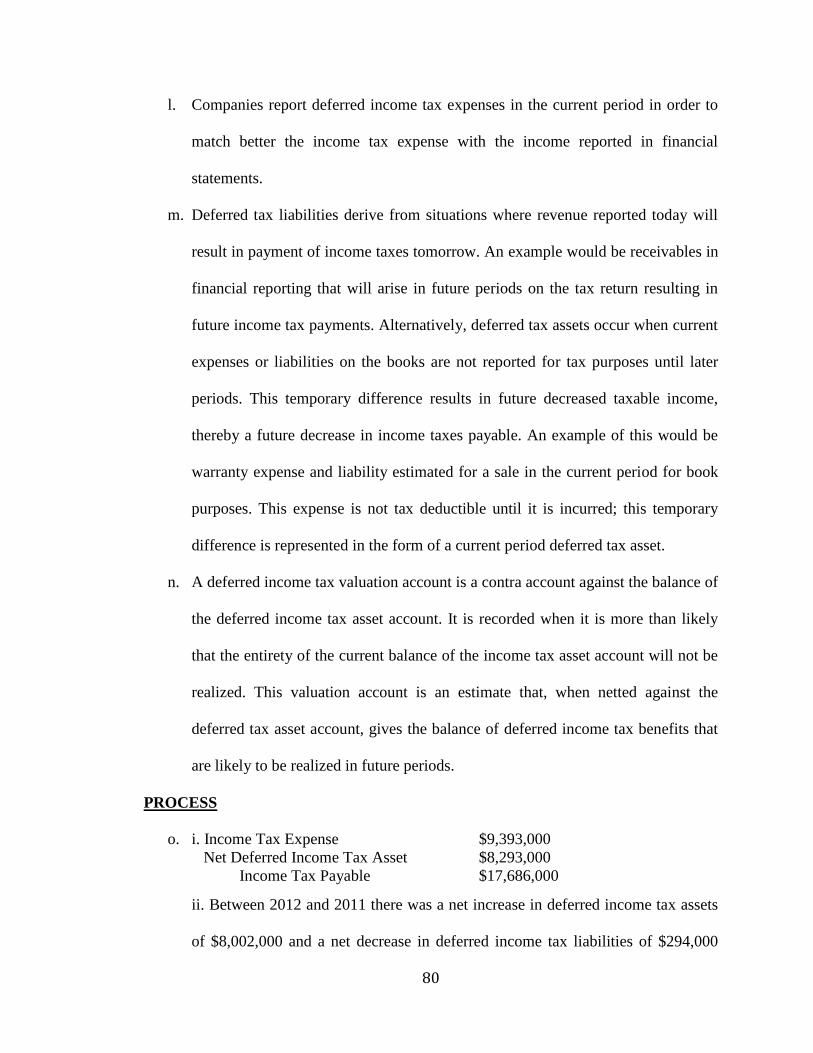
80
l. Companies report deferred income tax expenses in the current period in order to
match better the income tax expense with the income reported in financial
statements.
m. Deferred tax liabilities derive from situations where revenue reported today will
result in payment of income taxes tomorrow. An example would be receivables in
financial reporting that will arise in future periods on the tax return resulting in
future income tax payments. Alternatively, deferred tax assets occur when current
expenses or liabilities on the books are not reported for tax purposes until later
periods. This temporary difference results in future decreased taxable income,
thereby a future decrease in income taxes payable. An example of this would be
warranty expense and liability estimated for a sale in the current period for book
purposes. This expense is not tax deductible until it is incurred; this temporary
difference is represented in the form of a current period deferred tax asset.
n. A deferred income tax valuation account is a contra account against the balance of
the deferred income tax asset account. It is recorded when it is more than likely
that the entirety of the current balance of the income tax asset account will not be
realized. This valuation account is an estimate that, when netted against the
deferred tax asset account, gives the balance of deferred income tax benefits that
are likely to be realized in future periods.
PROCESS
o. i. Income Tax Expense $9,393,000
Net Deferred Income Tax Asset $8,293,000
Income Tax Payable $17,686,000
ii. Between 2012 and 2011 there was a net increase in deferred income tax assets
of $8,002,000 and a net decrease in deferred income tax liabilities of $294,000
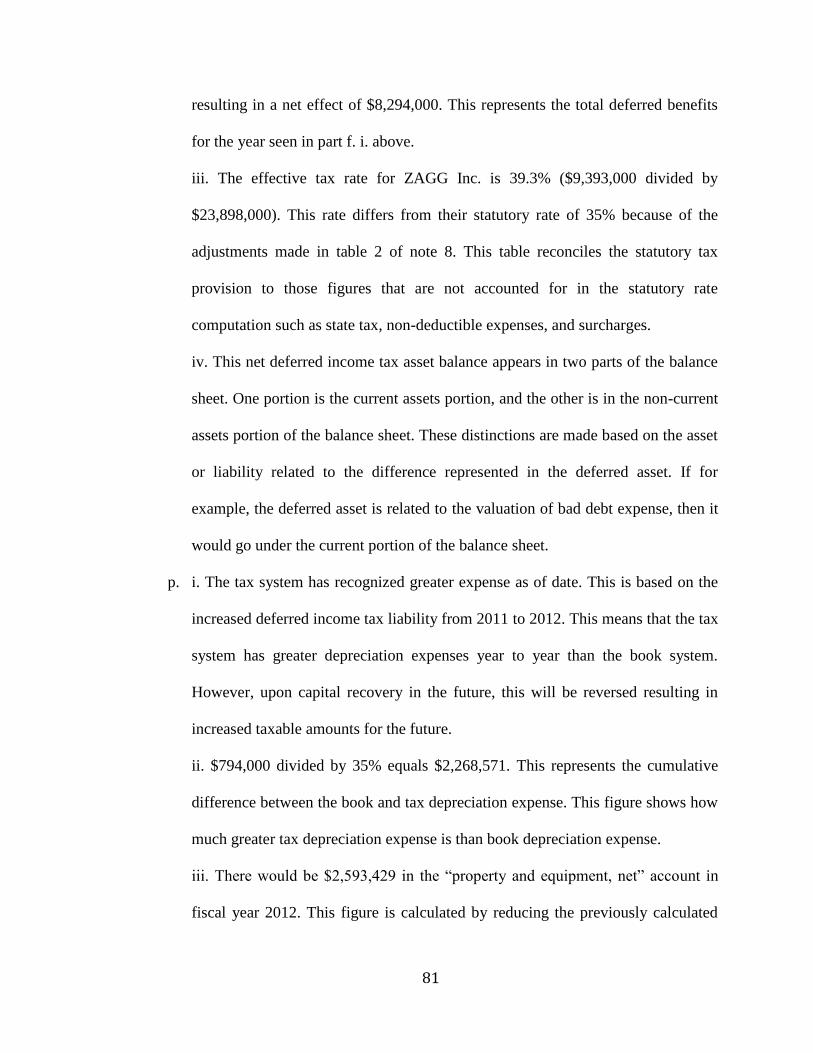
81
resulting in a net effect of $8,294,000. This represents the total deferred benefits
for the year seen in part f. i. above.
iii. The effective tax rate for ZAGG Inc. is 39.3% ($9,393,000 divided by
$23,898,000). This rate differs from their statutory rate of 35% because of the
adjustments made in table 2 of note 8. This table reconciles the statutory tax
provision to those figures that are not accounted for in the statutory rate
computation such as state tax, non-deductible expenses, and surcharges.
iv. This net deferred income tax asset balance appears in two parts of the balance
sheet. One portion is the current assets portion, and the other is in the non-current
assets portion of the balance sheet. These distinctions are made based on the asset
or liability related to the difference represented in the deferred asset. If for
example, the deferred asset is related to the valuation of bad debt expense, then it
would go under the current portion of the balance sheet.
p. i. The tax system has recognized greater expense as of date. This is based on the
increased deferred income tax liability from 2011 to 2012. This means that the tax
system has greater depreciation expenses year to year than the book system.
However, upon capital recovery in the future, this will be reversed resulting in
increased taxable amounts for the future.
ii. $794,000 divided by 35% equals $2,268,571. This represents the cumulative
difference between the book and tax depreciation expense. This figure shows how
much greater tax depreciation expense is than book depreciation expense.
iii. There would be $2,593,429 in the “property and equipment, net” account in
fiscal year 2012. This figure is calculated by reducing the previously calculated
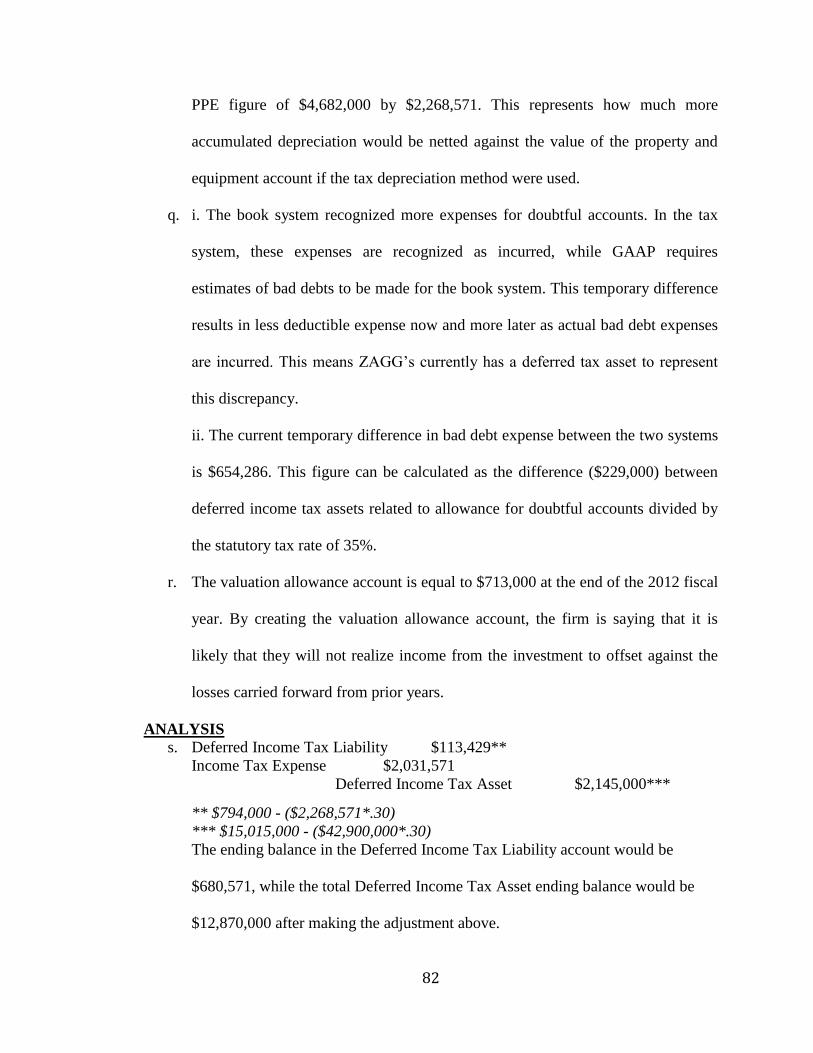
82
PPE figure of $4,682,000 by $2,268,571. This represents how much more
accumulated depreciation would be netted against the value of the property and
equipment account if the tax depreciation method were used.
q. i. The book system recognized more expenses for doubtful accounts. In the tax
system, these expenses are recognized as incurred, while GAAP requires
estimates of bad debts to be made for the book system. This temporary difference
results in less deductible expense now and more later as actual bad debt expenses
are incurred. This means ZAGG’s currently has a deferred tax asset to represent
this discrepancy.
ii. The current temporary difference in bad debt expense between the two systems
is $654,286. This figure can be calculated as the difference ($229,000) between
deferred income tax assets related to allowance for doubtful accounts divided by
the statutory tax rate of 35%.
r. The valuation allowance account is equal to $713,000 at the end of the 2012 fiscal
year. By creating the valuation allowance account, the firm is saying that it is
likely that they will not realize income from the investment to offset against the
losses carried forward from prior years.
ANALYSIS
s. Deferred Income Tax Liability $113,429**
Income Tax Expense $2,031,571
Deferred Income Tax Asset $2,145,000***
** $794,000 - ($2,268,571*.30)
*** $15,015,000 - ($42,900,000*.30)
The ending balance in the Deferred Income Tax Liability account would be
$680,571, while the total Deferred Income Tax Asset ending balance would be
$12,870,000 after making the adjustment above.

83
Case Thirteen
Johnson & Johnson- Retirement Obligations
84
Executive Summary
This report primarily addresses the retirement pension plan of Johnson & Johnson Inc.
(J&J). In particular, the overall economic standing of the company is examined through
the lenses of pension plans and their impact on J&J. Companies establish a separate,
distinct entity to hold the assets and obligations related to the pension plan established for
employees at retirement. The fund both accepts contributions, handles investment
decisions, and manages benefit payments and obligations. J&J’s fund at the end of 2007
had a projected benefits obligation of $12,002m and a plan assets fair value of $10,469m.
This means that the plan is underfunded by $1,533m. This underfunded amount is one of
the main issues addressed in the latter part of the report.
Establishing an understanding of pension plans can help both companies and plan
participants to better plan, and create sound, responsible financial plans for the future.
Primarily, this is seen in the report by looking at the significance of the projected benefit
obligation. Companies enlist the help of “actuaries” to project what future payments the
fund will owe to retiring employees based on many factors including future salaries, life
expectancy, etc. This present value of the projected benefits obligation is then used to
help the company determine how much it should contribute to the fund. The amount of
contributions and overall obligation fluctuates based on interest rates, actual returns on
investments, and other factors.
These issues are complex and make pension accounting one of the most difficult to
manage. It requires firms to look at the future with intent and care. Pension accounting
also requires accountants to further examine what the economic substance of the fund is
85
and how this fund can be most faithfully represented and reported to stakeholders
involved. This is the crux of the issues addressed in the report found below.
All figures found below are in millions unless otherwise stated.
CONCEPTS
a. i. The defined contribution plan is a plan that specifies a certain sum that the
employer contributes to the plan. The employee’s benefits are not specified in the
plan are based many factors including total contributions, length of employee
service, and employee’s age among other factors. A defined benefit plan
establishes the benefits that the employee will receive. The employer’s
contributions are based on the present value of the employee’s future benefits to
be received. Johnson & Johnson has various types of benefit plans; however, they
primarily disclose in the notes of the financial statements their defined benefit
retirement plan.
ii. The retirement plan obligations are liabilities because employers are liable for
contributions to the plan so that it may be fully funded for future employee’s
benefits.
iii. Companies must primarily make actuarial assumptions about the future of
their employees. These assumptions include mortality rates, employee turnover,
interest and earning rates, and future salaries.
b. Service costs are pension expenses related to the present value of future benefits
due to employees. Interest costs represent interest expense related to the liability
of the projected benefit obligation. Actuarial gains and losses arise primarily in
two distinctive ways: 1.) in the different between actual and expected returns on
86
plan assets and 2.) In the amortization of the net gain or loss from previous
periods. Lastly, benefits paid to retirees is the expenses related to payments to
retirees that decreases plan assets and decreases the projected benefit obligations.
c. Actual return on pension investments represents the return of the pension plan’s
investment of assets held for future benefit obligations. The company
contributions to the plan represent actual increased investment into the plan assets
by the company, rather than just a return on the plan’s investment. As stated
before benefits paid to retirees is the plan’s actual payout of benefits to retired
employees.
d. The actual return on plan assets is equal to the fair value change in the beginning
and ending balances of plan assets while adjusting for contributions and benefits
paid. The “return” associated with pension expense is a credit value used to
compute interest expense. It typically decreases the value of pension expense
while increasing the value of plan assets. This is the distinction used to compute
pension expense on a year-to-year basis.
e. There are two primary distinctions between the retirement plans and the J&J’s
other benefit plans: 1.) Most of the retirement plans in the U.S. are funded, while
most other benefit plans are not funded. 2.) Other benefit plans do not have
contributions from plan participants i.e. future benefactors of the plans. A plan is
funded if it has continual contributions from the company, and there is an effort to
maintain funding for the present value of plan assets as compared to the present
value of projected plan obligations.
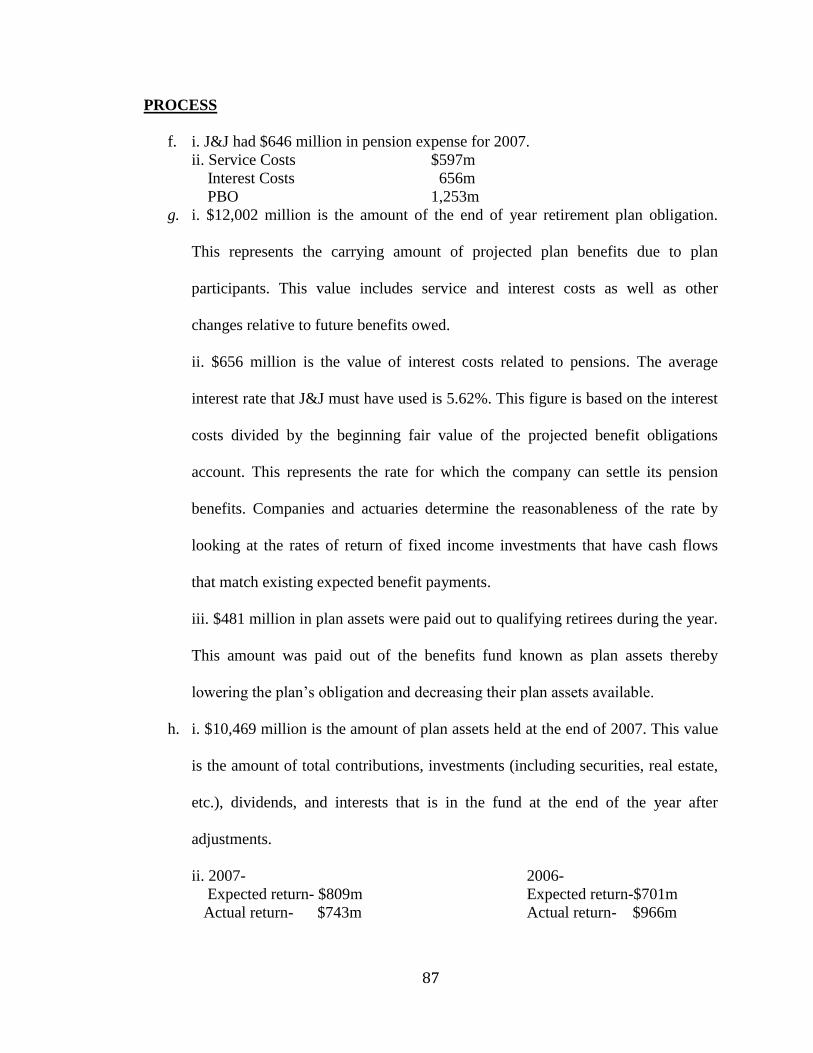
87
PROCESS
f. i. J&J had $646 million in pension expense for 2007.
ii. Service Costs $597m
Interest Costs 656m
PBO 1,253m
g. i. $12,002 million is the amount of the end of year retirement plan obligation.
This represents the carrying amount of projected plan benefits due to plan
participants. This value includes service and interest costs as well as other
changes relative to future benefits owed.
ii. $656 million is the value of interest costs related to pensions. The average
interest rate that J&J must have used is 5.62%. This figure is based on the interest
costs divided by the beginning fair value of the projected benefit obligations
account. This represents the rate for which the company can settle its pension
benefits. Companies and actuaries determine the reasonableness of the rate by
looking at the rates of return of fixed income investments that have cash flows
that match existing expected benefit payments.
iii. $481 million in plan assets were paid out to qualifying retirees during the year.
This amount was paid out of the benefits fund known as plan assets thereby
lowering the plan’s obligation and decreasing their plan assets available.
h. i. $10,469 million is the amount of plan assets held at the end of 2007. This value
is the amount of total contributions, investments (including securities, real estate,
etc.), dividends, and interests that is in the fund at the end of the year after
adjustments.
ii. 2007- 2006-
Expected return- $809m Expected return-$701m
Actual return- $743m Actual return- $966m
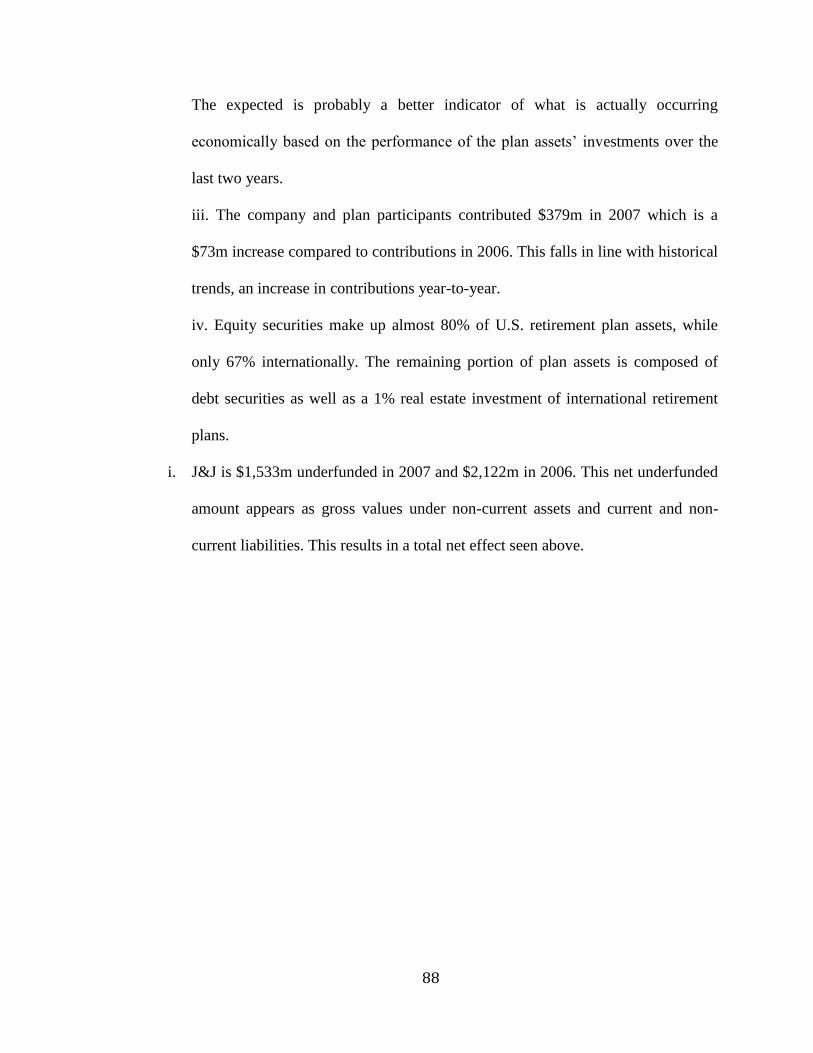
88
The expected is probably a better indicator of what is actually occurring
economically based on the performance of the plan assets’ investments over the
last two years.
iii. The company and plan participants contributed $379m in 2007 which is a
$73m increase compared to contributions in 2006. This falls in line with historical
trends, an increase in contributions year-to-year.
iv. Equity securities make up almost 80% of U.S. retirement plan assets, while
only 67% internationally. The remaining portion of plan assets is composed of
debt securities as well as a 1% real estate investment of international retirement
plans.
i. J&J is $1,533m underfunded in 2007 and $2,122m in 2006. This net underfunded
amount appears as gross values under non-current assets and current and non-
current liabilities. This results in a total net effect seen above.