Embed Size (px)
Citation preview

1
A Comprehensive Method for Extraction and Quantitative Analysis of Sterols
and Secosteroids from Human Plasma
Jeffrey G. McDonald†, Daniel D. Smith, Ashlee R. Stiles, and David W. Russell
Department of Molecular Genetics, University of Texas Southwestern Medical Center, Dallas,
Texas 75390.
† To whom correspondence should be addressed. E-mail: [email protected], phone 214-648-
4817, fax 214-648-8804.
by guest, on June 10, 2018w
ww
.jlr.orgD
ownloaded from

2
ABSTRACT
We describe the development of a method for the extraction and analysis of 62 sterols,
oxysterols, and secosteroids from human plasma using a combination of high-performance liquid
chromatography-mass spectrometry (HPLC-MS) and gas chromatography-mass spectrometry
(GC-MS). Deuterated standards are added to 200 μL of human plasma. Bulk lipids are extracted
with methanol:dichloromethane (MeOH:DCM), the sample is hydrolyzed using a novel
procedure, and sterols and secosteroids are isolated using solid-phase extraction. Compounds
are resolved on C18 core-shell HPLC columns and by GC. Sterols and oxysterols are measured
using triple quadrupole mass spectrometers and lathosterol is measured using GC-MS. Detection
for each compound measured by HPLC-MS was ≤ 1ng/mL of plasma. Extraction efficiency was
between 85 and 110%; day-to-day variability showed a relative standard error of <10%.
Numerous oxysterols were detected including the side chain oxysterols 22-, 24-, 25-, and 27-
hydroxycholesterol, as well as ring-structure oxysterols 7α- and 4β-hydroxycholesterol.
Intermediates from the cholesterol biosynthetic pathway were also detected and included
zymosterol, desmosterol, and lanosterol. This method also allowed the quantification of six
secosteroids, including the 25-hydroxylated species of vitamins D2 and D3. Application of this
method to plasma samples revealed that at least 50 samples could be extracted in a routine day.
by guest, on June 10, 2018w
ww
.jlr.orgD
ownloaded from

3
INTRODUCTION
Sterols play essential roles in the physiological processes of virtually all living
organisms. Members of this lipid class are integral building blocks in the cellular membranes of
animals and have important functions in signaling, regulation, and metabolism [1]. To date, the
majority of studies have focused on cholesterol, the most abundant sterol in mammals that serves
as both a precursor and product to a host of important molecules including steroid hormones, bile
acids, oxysterols, and intermediates in the cholesterol biosynthetic pathway [2-4]. While
cholesterol has gained significant notoriety due to the compound’s negative impact on health,
other sterols, such as plant-derived phytosterols, are thought to offer potential human health
benefits by lowering circulating cholesterol levels [5, 6].
Novel functions for sterols and secosteroids continue to be identified. For example, the
cholesterol metabolites 25-hydroxycholesterol and 7α,25-dihydroxycholesterol have recently
been shown to play important signaling roles in the immune system [7-9]. 24-
hydroxycholesterol has been shown to be involved in cholesterol turnover in the brain which
plays a role in memory [10] and glucose metabolism [11]. Alterations in vitamin D levels
arising from the lack of sun exposure and/or use of sunscreen are postulated to have a negative
impact on health [12, 13]. These findings together with the large number of sterols suggest that
there may be undiscovered roles for sterols in biology and they highlight the need for continued
research into the biochemical pathways associated with these compounds.
The extraction and analysis of sterols in human plasma presents a unique challenge due to
their virtual insolubility, sequestration within lipoproteins, and dramatic differences in the levels
by guest, on June 10, 2018w
ww
.jlr.orgD
ownloaded from
4
of individual sterols. Cholesterol is the most abundant sterol, with circulating levels on the order
of 1 to 3 mg/mL, whereas 25-hydroxycholesterol is a million-fold less abundant at 1-3
ng/mL[14, 15]. The circulating form of sterols in humans is primarily as steryl esters in which a
fatty acid is esterified to carbon 3 of the sterol; however, a small variable percentage of free
sterols also exist. Enzymatically formed oxysterols are typically between 59 to 91% esterified
[15]. This duality poses additional analytical challenges as free versus esterified sterols must
either be isolated or measured separately or steryl esters must first be converted to free sterols.
Other lipids, such as triglycerides, phospholipids, and sphingolipids that are present in the
plasma at concentrations similar to cholesterol further confound the analysis of sterols.
Traditionally, the extraction of sterols has relied on two classic methods, the Bligh/Dyer
or Folch extraction methods [16, 17]. Both make use of a mixture of chloroform and methanol
to simultaneously disrupt lipoproteins and solubilize lipids. An alkaline hydrolysis step is
employed to cleave sterol-fatty acid conjugates; a strong base in alcohol is added to the extract,
which is then often incubated at room temperature, or elevated temperature (60 – 100 °C) for 1-2
hours [18-20]. Hydrolysis also serves to degrade other abundant lipid classes such as
triglycerides and phospholipids, which reduces sample complexity. Alternatively, if the goal is
to measure only free, unesterified sterols, the alkaline hydrolysis step is eliminated. Lastly, solid
phase extraction (SPE) is utilized to isolate sterols from other components. Ideally, cholesterol
could be isolated from the sample as it would simplify subsequent instrumental analysis of other
less abundant sterol species; however, SPE does not yet have the inherent resolution or
reproducibility to quantitatively isolate cholesterol from all other sterols [18, 21]. Although
many variations of these extraction procedures have been reported in the literature, the
fundamental steps of the various methods are the same.
by guest, on June 10, 2018w
ww
.jlr.orgD
ownloaded from
5
Instrumental analysis of sterols and related compounds in plasma has typically focused
on either a single analyte or a limited group of analytes. Historically, these methods have
employed GC and GC-MS for the analysis of select sterols [18, 22, 23]. GC and GC-MS have
limitations with regard to sample composition, injection volume, sensitivity, and mass spectral
scanning functions. Despite these limitations, GC and GC-MS are still widely used for sterol
analysis due to their chromatographic resolving capacity, ease of use, and relative low cost of the
acquisition and operation of the instruments.
Recently, methods have been developed for sterol analysis using LC-MS [24-26]. Like
GC and GC-MS, these methods are typically optimized for the detection of one or two analytes.
In 2007, our laboratory described a method for analyzing a diverse group of sterols and
oxysterols using LC-MS [21]. The method was optimized for detection of 12 common sterols
and oxysterols in a single extraction. Since then, high performance liquid chromatography
(HPLC) has become more widely used in the analysis of sterols and is often coupled to triple
quadrupole mass spectrometers for quantitative analysis to enhance sensitivity and selectivity.
Similarly, improvements in ionization and ion transfer into the mass spectrometer have enhanced
the ability to measure low-level metabolites in biological systems.
Here we report a method for the quantitative analysis of sterols, oxysterols, and
secosteroids in plasma. Using a streamlined extraction procedure and a combination of LC-MS
(electrospray ionization and atmospheric pressure chemical ionization), this method allows for
the analysis of approximately 60 sterols from a single extraction of 200 μL of plasma. The
extraction procedure is flexible and can be tailored to sample type and information sought. Since
many sterols are positional isomers, chromatographic resolution remains crucial for the analysis
of sterols and related compounds as the MS cannot differentiate between isobaric compounds.
by guest, on June 10, 2018w
ww
.jlr.orgD
ownloaded from

6
The instrumental analysis used in this method employs recent advances in HPLC column
technology that provide increased resolution and sensitivity, and the throughput is such that 50
samples can be readily assayed per day. The method lends itself to translational research
involving large cohorts of clinically well-characterized patients and can be adapted to serum,
tissues, or other biological matrices.
EXPERIMENTAL SECTION
Materials. Human plasma samples were obtained from 200 subjects of The Cooper Institute
(Dallas, TX) following protocols approved by the Institutional Review Board of the University
of Texas Southwestern Medical Center. Written consent was obtained from each patient prior to
sample collection. Pooled normal human plasma was purchased from Innovative Research,
(Novi, Michigan) for use as a control sample. Primary and deuterated sterol and secosteroid
standards were obtained from Avanti Polar Lipids (Alabaster, AL) unless otherwise noted. A
complete list of analytes is given in Table 1. Dichloromethane (DCM) and hexane were from
Burdick & Jackson (Honeywell; Morristown, NJ), methanol (MeOH), chloroform (CHCl3),
acetonitrile (ACN), and water were from Fisher Scientific (Fair Lawn, NJ). Dulbecco’s
phosphate-buffered saline (DPBS) was from Mediatech (Manassas, VA). Ammonium acetate
(NH4OAc) and butylated hydroxytoluene (BHT) were from Sigma-Aldrich (St. Louis, MO), 10N
potassium hydroxide (KOH) was from Fisher Scientific, ammonium iodide (NH4I) was from
Acros Organics (Geel, Belgium) and N-methyl-N[tert-butyldimethylsilyl trifluoroacetamide with
1% tert-butyldimethylchlorosilane (MTBSTFA with 1% TBDMCS) was from Restek
(Bellefonte, PA). All solvents were HPLC-grade or better; all chemicals were ACS-grade or
better.
by guest, on June 10, 2018w
ww
.jlr.orgD
ownloaded from
7
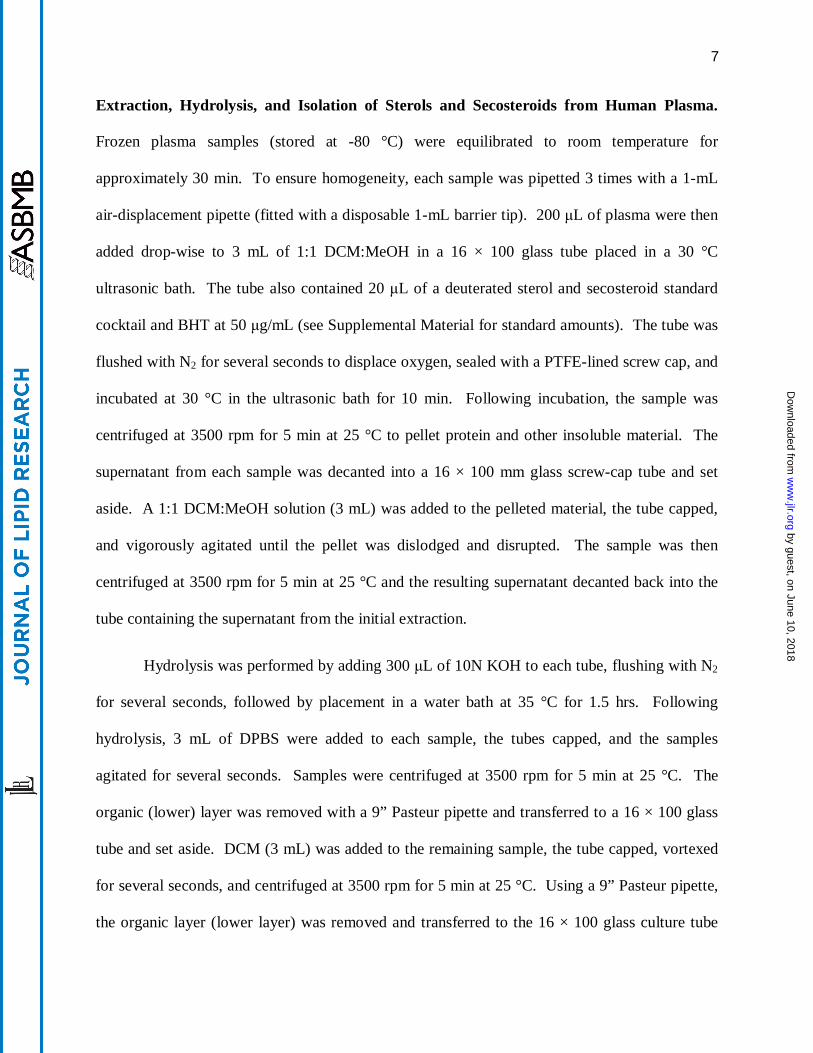
Extraction, Hydrolysis, and Isolation of Sterols and Secosteroids from Human Plasma.
Frozen plasma samples (stored at -80 °C) were equilibrated to room temperature for
approximately 30 min. To ensure homogeneity, each sample was pipetted 3 times with a 1-mL
air-displacement pipette (fitted with a disposable 1-mL barrier tip). 200 μL of plasma were then
added drop-wise to 3 mL of 1:1 DCM:MeOH in a 16 × 100 glass tube placed in a 30 °C
ultrasonic bath. The tube also contained 20 μL of a deuterated sterol and secosteroid standard
cocktail and BHT at 50 μg/mL (see Supplemental Material for standard amounts). The tube was
flushed with N2 for several seconds to displace oxygen, sealed with a PTFE-lined screw cap, and
incubated at 30 °C in the ultrasonic bath for 10 min. Following incubation, the sample was
centrifuged at 3500 rpm for 5 min at 25 °C to pellet protein and other insoluble material. The
supernatant from each sample was decanted into a 16 × 100 mm glass screw-cap tube and set
aside. A 1:1 DCM:MeOH solution (3 mL) was added to the pelleted material, the tube capped,
and vigorously agitated until the pellet was dislodged and disrupted. The sample was then
centrifuged at 3500 rpm for 5 min at 25 °C and the resulting supernatant decanted back into the
tube containing the supernatant from the initial extraction.
Hydrolysis was performed by adding 300 μL of 10N KOH to each tube, flushing with N2
for several seconds, followed by placement in a water bath at 35 °C for 1.5 hrs. Following
hydrolysis, 3 mL of DPBS were added to each sample, the tubes capped, and the samples
agitated for several seconds. Samples were centrifuged at 3500 rpm for 5 min at 25 °C. The
organic (lower) layer was removed with a 9” Pasteur pipette and transferred to a 16 × 100 glass
tube and set aside. DCM (3 mL) was added to the remaining sample, the tube capped, vortexed
for several seconds, and centrifuged at 3500 rpm for 5 min at 25 °C. Using a 9” Pasteur pipette,
the organic layer (lower layer) was removed and transferred to the 16 × 100 glass culture tube
by guest, on June 10, 2018w
ww
.jlr.orgD
ownloaded from
8
containing the initial sample. To maximize extraction efficiency, the same pipette was used for
each liquid-liquid step and the pipette was placed into a separate glass culture tube between
steps. Hydrolyzed samples were then dried under N2 using a 27-port drying manifold (Pierce;
Fisher Scientific, Fair Lawn, NJ).
Sterols and secosteroids were isolated using 200 mg, 3-mL aminopropyl solid-phase
extraction columns (Biotage; Charlotte, NC). The column was rinsed and conditioned with 2 × 3
mL of hexane. The extracted and dried plasma sample was dissolved in approximately 1 mL of
hexane and gently swirled for several seconds. The sample (and any insoluble material) was
then transferred to the SPE column using a 6” Pasteur pipette and eluted to waste. The extract
tube was rinsed with 1 mL of hexane, gently swirled, and this rinse transferred to the column and
eluted to waste. Again, to minimize sample loss, the same Pasteur pipette was used at each step.
Following the addition of sample, the column was rinsed with 1 mL of hexane to elute non-polar
compounds. Sterols were then eluted from the column with 4.5 mL (1.5 column volumes) of
23:1 CHCl3:MeOH into a new 16 × 100 glass culture tube. The eluted sample was dried under
N2.
To prepare the sample for instrumental analysis, 400 μL of warm (37 °C) 90% MeOH
was added and the tube placed in an ultrasonic bath for 5 min at 30 °C. The sample was then
transferred to an autosampler vial containing a 500-μL deactivated insert (Restek, Bellefonte,
PA) and 20 μL of d6-6α-hydroxycholestanol as an internal standard. If particulate matter was
observed in the sample during dissolution, then the vial insert was carefully transferred to a
standard microcentrigure tube using fine-point tweezers and centrifuged at room temperature for
5 min at 6000 rpm in a micro centrifuge. The vial insert was then carefully transferred back to
the autosampler vial and stored at room temperature until analysis.
by guest, on June 10, 2018w
ww
.jlr.orgD
ownloaded from
9
A 50 μL aliquot of the sample was removed and transferred to a new autosampler vial for
analysis by GC-MS. The sample was dried under N2. Derivatization of sterols was performed
by adding 100 μL of 1:1 pyridine:MTBSTFA (1%TBDMCS) with 2 mg/mL NH4I (dissolved
first in pyridine), flushing the sample with N2, capping the vial, and incubation at 70 °C for 30
min. The derivatized sample was dried under N2, dissolved in 150 μL of hexane, vortexed for 5
min, and stored at room temperature until analysis.
Instrumental Analysis. Quantitative analysis of sterols, oxysterols, and secosteroids was
performed using a combination of techniques that included HPLC-MS-APCI, HPLC-MS-ESI,
and GC-MS. Oxysterols were analyzed using a tertiary Shimadzu LC-20XR HPLC system
(Shimadzu Scientific Instruments, Columbia, MD) equipped with an ultrasonic degasser, column
oven and autosampler. The HPLC was coupled to an AB Sciex API-5000 MS equipped with
Turbo V ESI source (Foster City, CA). Oxysterols were resolved with a binary solvent gradient
using a Kinetex C18 HPLC column (150 × 2.1 mm, 2.6 μm particle size; Phenomenex, Torrance,
CA). The mobile phases were (A) 70% ACN with 5 mM NH4OAc (dissolved in water first) and
(B) 1:1 IPA:ACN with 5 mM NH4OAc (dissolved first in IPA for 10-12 hours). Following
preparation, mobile phases were allowed to come to thermal equilibrium overnight at 25 °C.
After injection of 30 uL of extract, the gradient was started at 0% B and ramped to 100% B over
7 min, held at 100% B for 3 min, and returned to 0% B for a 2 min equilibration. The flow rate
was 0.5 mL/min and the column was maintained at 18 °C.
Sterols were analyzed using a binary Shimadzu LC-10ADvp system with a column oven
and CTC LC PAL autosampler (Leap Technologies, Carrboro, NC) coupled to an AB Sciex 4000
QTrap mass spectrometer equipped with a Turbo V APCI source. Sterols were resolved with a
by guest, on June 10, 2018w
ww
.jlr.orgD
ownloaded from
10
two-step isocratic elution using a Poroshell 120 SB-C18 HPLC column (150 x 2.1 mm, 2.7 μM
particle size; Agilent Technologies, Wilmington, DE). The mobile phases were (A) 96% MeOH
with 0.1% acetic acid (AA) and (B) MeOH with 0.1% AA. The autosampler was equipped with
a 5-μL injection loop that was loaded with 15 μL of extract. The elution began at 100% A for
7.5 min, increased to 100% B at 8 min, was held at 100% B for 6 min, and returned to 100% A
for a 6 min equilibration. The flow rate was 0.4 mL/min and the column was maintained at 30
°C.
Both MS instruments were operated in scheduled multiple-reaction monitoring (SMRM)
mode. Transitions for each compound were optimized by flow injection via syringe pump using
a representative solvent flow rate of 1:1 A:B for each instrument. MRM transitions for
oxysterols in ESI mode were primarily optimized for the ammonium adduct [M+NH4]+ or the
protonated molecular ion [M+H]+ generated through the loss of NH3. The transitions included
the loss of one or more -OH groups as H2O, depending on the specific compound. Sterols in
APCI mode were optimized for either the protonated adduct [M+H]+ or the loss of -OH as H2O
[M+H-H2O]+. The transition includes a nondescript, low-mass fragment often at m/z 81, 95, or
109, although there were several exceptions in which fragments of various masses were
generated. A complete list of transitions for sterols and oxysterols and a detailed description of
instrument settings and parameters for both HPLC-MS analyses are provided in Supplementary
Materials.
Lathosterol was analyzed using an Agilent 7890 GC coupled to an Agilent 5975C mass-
selective detector (MSD; Wilmington, DE). The instrument was equipped with a 40-m Agilent
J&W DB-5MS column (180 μm i.d., 0.18 μm film thickness; Folsom, CA). The injection port
was maintained at 300 °C and 1 μL injections were performed using splitless conditions with a
by guest, on June 10, 2018w
ww
.jlr.orgD
ownloaded from

11
purge to split vent at 0.5 min. Hydrogen was used as the carrier gas and was generated with a
Parker Balston H2PD-150 hydrogen generator (Haverhill, MA) at an average linear velocity of
55 cm/s in constant flow mode. The temperature program began at 150 °C for 1 min, then was
ramped at 10 °C/min to 325 °C and held for 6.5 minutes. The transfer line was heated to 300 °C,
the ion source to 230 °C and the quadrupole to 150 °C. Electron ionization was used at 70 eV
and selected ion monitoring (SIM) was used for data acquisition. A complete description of
instrument configuration and settings is provided in Supplementary Materials.
Aliquots of plasma were sent to a commercial clinical chemistry laboratory for
measurement of total cholesterol.
An extensive and detailed discussion of each step of the extraction and instrumental
analysis is provided in Supplementary Material. Here the reader can gain useful tips and tricks
as well as read discussion explaining how and why each step of the procedure was implemented.
Quantitation. Integration of areas under elution curves for LC-MS and GC-MS was done using
Analyst™ 1.5.1 and Chemstation™ software, respectively. Quantitative values were calculated
using isotope dilution and single point calibration through a relative response factor (RRF)
calculation. The RRF standard was run at the beginning, middle, and end of each sample set;
typically 54 samples per set. Deuterated analogs were not available for every analyte, thus a
deuterated compound of similar chemical composition was substituted when necessary. A table
of primary compounds and the respective deuterated analog used for quantitation is given in
Supplementary Materials.
by guest, on June 10, 2018w
ww
.jlr.orgD
ownloaded from
12
RESULTS
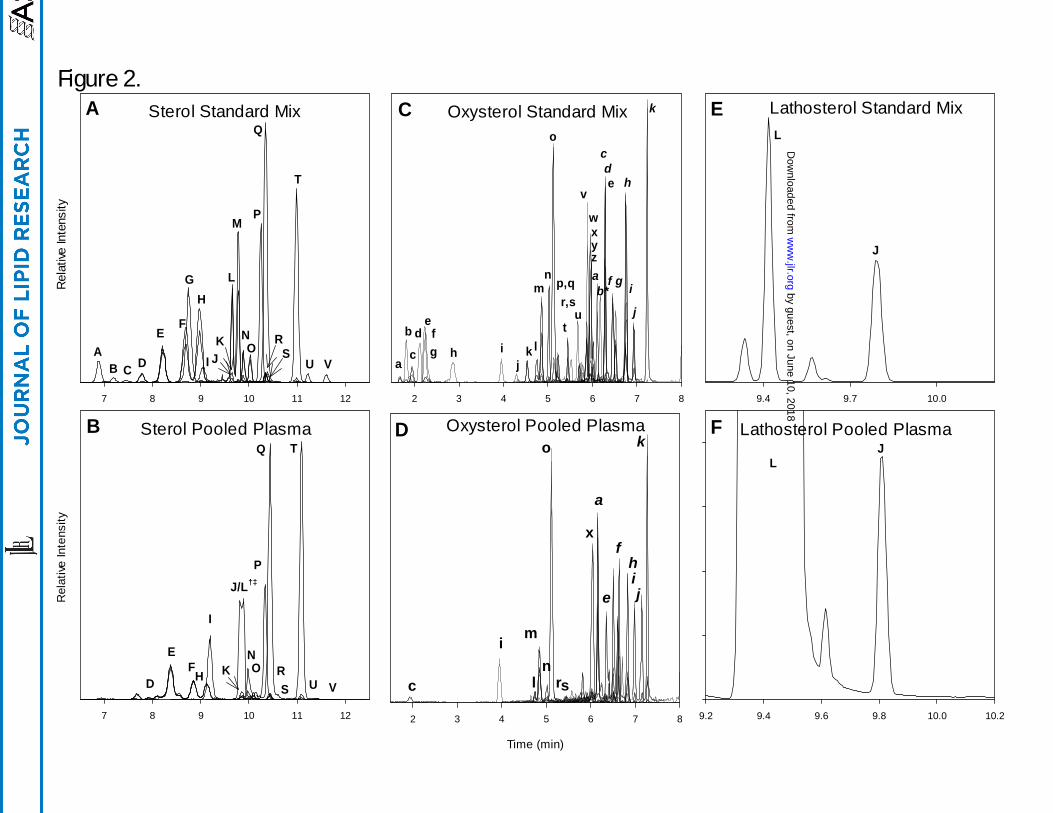
Chromatography. Reconstructed ion chromatograms (RIC) for standard mixes and extracts of
a pooled plasma sample for sterols, oxysterols, and lathosterol are shown in Figure 2A-F. To
improve the clarity of data presented in the figure, deuterated analogs are not included in the
RIC’s. The chromatographic peaks are labeled alphabetically and correspond to compounds
listed in Table 1.
The 22 sterol and sterol-derived compounds routinely detected in plasma by this method
are either resolved, or have unique masses that allow them to be uniquely identified by mass
spectrometry. Sterols are labeled with capital letters and correspond to labels given in Table 1.
Sterols elute between 6.5 and 11.5 min from the HPLC columns. Less polar compounds such as
zymosterol and desmosterol elute early (D, E), and methylated sterols such as sitosterol and
24,25-dihydrolanosterol elute later in the chromatogram (T,U). Use of the core-shell HPLC
column resulted in chromatographic peak widths on the order of 6-8 sec at full width-half
maximum (FWHM). Figure 2E depicts the resolution of lathosterol and cholesterol (L and M),
respectively by GC-MS; however, in a plasma extract the physiological levels of cholesterol
overwhelm the lathosterol signal causing inadequate resolution (Figure 2F). In order to maintain
a common scale, the cholesterol signal in Figure 2B is plotted at 0.1× scale. The split peak
shown in Figure 2B is not an unresolved lathosterol and cholesterol signal but rather the result of
the extreme abundance of cholesterol causing splitting and overload of the HPLC column.
Oxysterols elute between 1.5 to 7.5 min in three general groups as shown in Figure 2C
and 2D. The use of core-shell HPLC columns yielded chromatographic peak widths on the order
of 3-6 sec FWHM. Polar hydroxylated sterols such as 7α,27-dihydroxycholesterol (c) elute in
the first group between 1.5 and 3 min. The 25-hydroxylated vitamin D2 and D3 (i, j) compounds
by guest, on June 10, 2018w
ww
.jlr.orgD
ownloaded from

13
elute with the side-chain oxysterols 24-, 25-, and 27-hydroxycholesterol (l, m, o) between 4 and
5.5 min. The least polar compounds, ring structure oxysterols such as 7α- and 4β-
hydroxycholesterol (x, k), elute in the third group between 5.5 and 7.5 min.
The known enzymatically formed oxysterols are resolved from other isobaric species
with several exceptions, the first being the separation of 7α- and 7β-hydroxycholesterol.
Previous work has shown that 7β-hydroxycholesterol is present in human plasma at
approximately 10% of the level of 7α-hydroxycholesterol [14]. While the two compounds can
be resolved by GC-MS, we were not able to resolve them with the HPLC parameters described
here; therefore, the values for 7α-hydroxycholesterol include any 7β-hydroxycholesterol present
in the sample. The second set of co-eluting compounds of biological importance are 8,(14)-
dehydrocholesterol and 7,(8)-dehydrocholesterol. The origins of 8,(14)-dehydrocholesterol are
not well understood, and it is unclear if the compound is present in our samples. Thus, 7,(8)-
dehydrocholesterol may include unknown quantities of 8,(14)-dehydrocholesterol. The third set
of co-eluting compounds is 24,25-dihydrolanosterol and an unknown compound. 24,25-
dihydrolanosterol is poorly resolved and is further complicated by the very low signal level
observed in most of the human plasma samples analyzed here. The unknown compound has an
isobaric signal, elutes after 24,25-dihydrolanosterol, and with manual integration a reasonable
estimate of the peak area can be achieved. The fourth set of co-eluting compounds is composed
of 20-hydroxycholesterol and 15α-hydroxycholestenone. The origin of these compounds is
poorly understood. Their co-elution does not appear to be of major significance as in the 200
plasma samples analyzed here, only trace-level signals were detected for their MRM pairs
corresponding to the correct retention time.
by guest, on June 10, 2018w
ww
.jlr.orgD
ownloaded from
14
Due to the similar structures of lathosterol (J) and cholesterol (Δ7,8 versus Δ5,6 ) and
considerably disparate concentration levels (cholesterol is 1000× more abundant), the HPLC
method used to resolve sterols does not sufficiently separate lathosterol from cholesterol;
however, the GC-MS method described herein is able to resolve lathosterol from cholesterol
(Figure 2E and 2F). Separation is accomplished through the use of hydrogen as a carrier gas in
conjunction with a very high resolving column. A chromatographic signal for lathosterol is
produced with a peak width of 2 sec at FWHM.
Mass Spectrometry. Representative mass spectra for selected sterols, oxysterols, and
secosteroids are shown in Figure 3. Examples, including 7α,27-dihydroxycholesterol, 25-
hydroxyvitamin D3, and 7α-hydroxycholesterol ionized under electrospray conditions are shown
in Figures 3A-C. The oxysterols are neutral and ionize poorly with electrospray alone;
ammonium acetate is added to the mobile phase, which results in the formation of readily
detectable ammonium adducts. All oxysterols show common features of ionization and
fragmentation with collision-induced dissociation (CID) using mild collision energies (10-20 V).
These features arise from both in-source decay and during CID. Mass spectral features common
to most oxysterols include an ammonium adduct at [M+18]+, a protonated ion at [M+18-NH3]+,
and ions derived from sequential losses of 17 and 18 mass units for each alcohol group
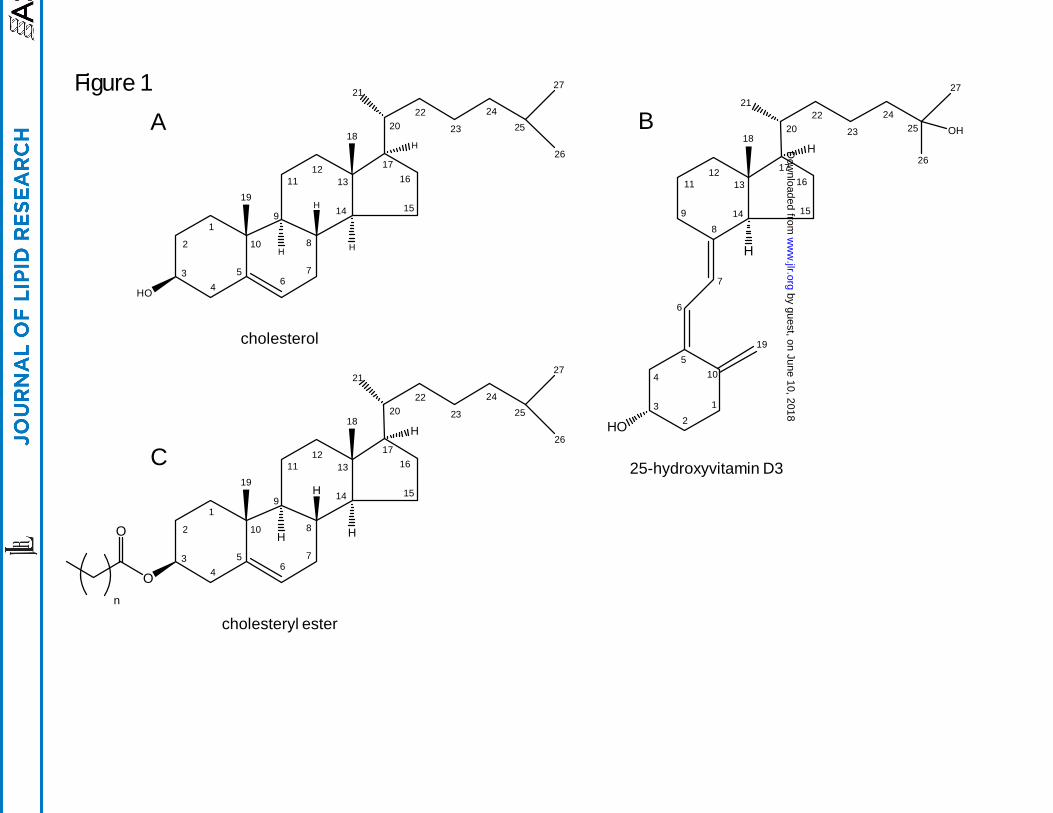
depending on the specific compound. Due to the 4 ring structure and isooctyl side chain found in
all oxysterols (Figure 1), no unique mass spectral information was obtained for isomeric
compounds using CID. High-energy CID (50-60 V) yielded a heavily fragmented collision
spectrum consisting of methylene groups spaced 14 mass units apart with no unique mass
by guest, on June 10, 2018w
ww
.jlr.orgD
ownloaded from

15
spectral information. For quantitative purposes it was determined that mild CID conditions
yielded better oxysterol signal intensity in conjunction with MRM.
Respective mass spectra for two sterols, desmosterol and lanosterol, are shown in Figures
3D-E. Like oxysterols, sterols are neutral but they are less polar and therefore more efficiently
ionized by APCI. The pseudo-molecular ion formed for most sterols is the loss of the alcohol
group as water at [M+H-H2O]+. Because the pseudo-molecular ion is a result of water loss,
there are no additional alcohols to dissociate under mild CID conditions as with the oxysterols.
Therefore, a high energy CID is used (e.g., 50-60 V) to generate a heavily fragmented collision
spectrum. For quantitation, the MRM transition was typically the pseudo-molecular ion and the
most intense fragment ion, usually m/z 81, 95, or 109. Additional sterol mass spectra can be
found at http://www.lipidmaps.org.
The electron ionization mass spectrum for MTBSTFA-derivitized lathosterol is shown in
Figure 3F. The base peak is observed at m/z 443 resulting from the loss of the isopropyl group at
[M-57]· +. A smaller signal is also present at m/z 367, which arises from the loss of the entire
MTBS group with the oxygen at the C3 position along with an additional unsaturation forming at
an unknown location in the sterol molecule. The signal at m/z 443 was monitored with SIM for
quantitation.
QA/QC. The recovery of sterols, oxysterols, and secosteroids from the solvent spike QC sample
showed that for the 10 oxysterols reported in Table 2, recovery was between 99.6% and 109%,
indicating virtual complete recovery. The nine sterols detected had a slightly wider recovery
range between 94.6% and 111% with the exception of 7-dehydrocholesterol at 85%. The solvent
spike gives an accurate measure of the extraction efficiency across a wide concentration range of
by guest, on June 10, 2018w
ww
.jlr.orgD
ownloaded from
16
sterols; however, this standard does not represent the complex chemical matrix found in a human
plasma sample. Interference from this matrix may cause artificially high or low values due to
chromatographic, ionization, or mass spectral issues.
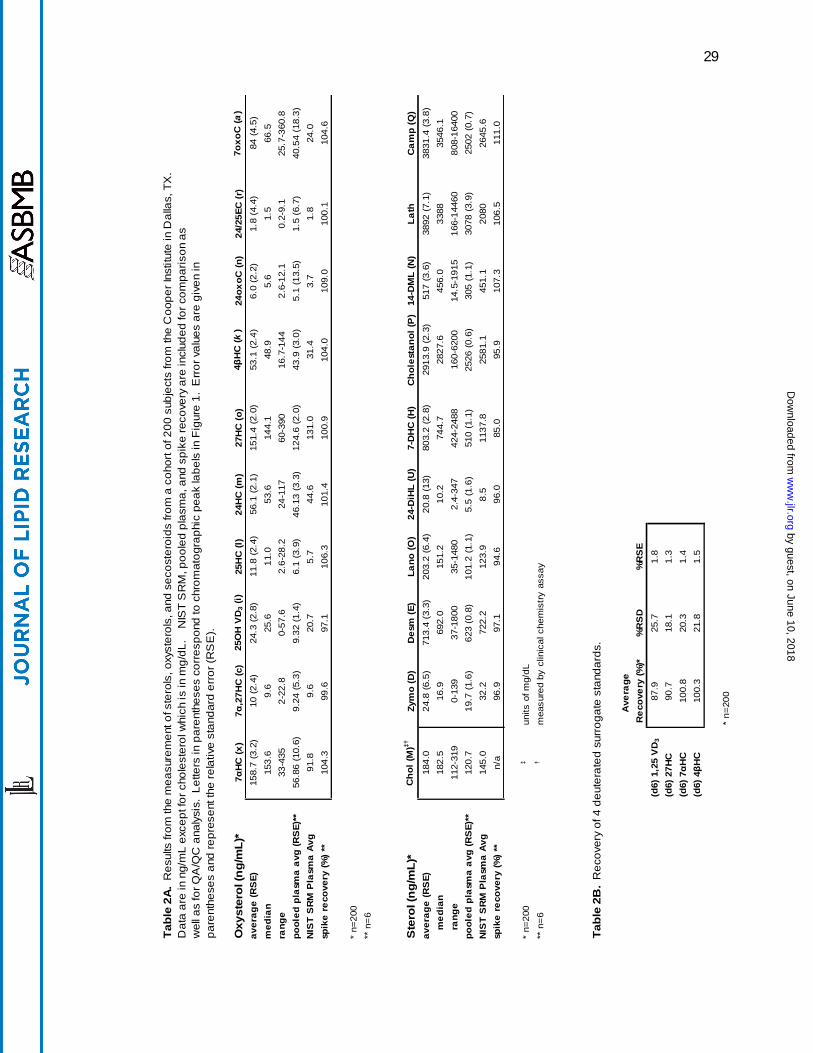
To better assess the recovery of sterols from a plasma sample, we added one deuterated
internal standard to the autosampler vial prior to transferring the final extract. This addition
allowed the recovery of deuterated surrogates in each sample to be determined. We quantified
the recovery of four representative compounds that cover the range of oxysterols analyzed. The
recovery for (d6) 1,25-hydroxyvitamin D3, (d6) 27-hydroxycholesterol, (d6) 7α-
hydroxycholesterol, and (d6) 4β-hydroxycholesterol ranged from 87.9 to 100.8% (Table 2B).
These values, combined with solvent spike recoveries, show that this extraction procedure is
both thorough and robust with excellent recovery values. Additionally, the final dissolution of
the purified dried extract is done in a single step with no additional rinsing. A second rinse step
would cause undesired dilution of the final extract.
With each batch of 50 samples extracted, an aliquot of a commercially obtained, pooled
plasma sample was analyzed to monitor and evaluate day-to-day variation in measurements. As
seen in Table 2A, reproducibility was excellent across extractions done on six different days.
The relative standard errors (RSE) for oxysterols ranged between 1.4 to 10.6 for known
enzymatically formed oxysterols with higher RSE’s of 13.5% and 18.3% for two compounds that
are potentially formed through oxidation and may be partially degraded during base hydrolysis,
24-, and 7-oxocholesterol. The RSE’s for sterols in pooled plasma have less variability and
ranged between 0.6 and 3.9%; however, all sterols reported here are enzymatically formed and
none are oxidation products or known to be susceptible to base hydrolysis. Included in Table 2A
are data from analysis of the NIST human plasma standard reference material (SRM) for use as a
by guest, on June 10, 2018w
ww
.jlr.orgD
ownloaded from

17
reference [15], and for comparison against the commercially obtained pooled plasma used in this
study.
The solvent blank that was included with each batch of 50 samples did not show a
response for any compound measured here. Therefore, there was no evidence of carryover,
cross-contamination, or isobaric interferences originating from the sample extraction.
The instrument detection limit (IDL) was estimated at ≤ 50 pg on-column for each
compound. The method detection limit (MDL) for each compound was estimated at ≤ 1 ng/mL.
Detector response was linear over at least four orders of magnitude from the instrument detection
limit.
Results from Cooper Institute Cohort. Quantitative results for a representative set of sterols
from 200 human plasma samples are shown in Table 2A. The data include average, median,
standard deviation, and range of concentrations measured. For reference and comparison, the
results from the commercially obtained pooled plasma used as a QA/QC sample and the results
from the previously analyzed NIST SRM plasma are included [15]. Lastly, the solvent spike
recovery value is provided showing one metric of our quality control scheme. In Table 2B, the
recoveries of four representative deuterated oxysterol standards are shown.
Discussion
Data. The dataset provided herein includes all compounds that were routinely detected in the
200 samples analyzed from the Cooper Institute. We assayed for approximately 60 compounds,
but only a subset of 22 compounds was routinely detected. Not included in these data are values
obtained for most known oxidation products, such as the 5/6(α/β)-epoxycholesterols [27] due in
by guest, on June 10, 2018w
ww
.jlr.orgD
ownloaded from
18
part to problems with the primary standard or deuterated analog, which have been subsequently
resolved. Table 2A provides values for 25-hydroxyvitamin D3 and a select group of sterols and
oxysterols measured in the 200 samples. These data were acquired using methods described
here, but it should be noted that quantitative values for some compounds may vary depending on
specific extraction procedures employed. This method combines techniques from previously
published work as well as novel aspects developed in our laboratory. The intent of this work was
in part to develop a robust extraction procedure that generated values consistent with those in the
literature and was capable of a reasonable throughput so it could be applied to large human
cohorts. It is optimized towards enzymaticlly formed sterols with secondary thought given to
oxidation products of cholesterol. Investigators wishing to target these oxidation products may
consider alternative extraction procedures.
Comparison of the data obtained from the Cooper Institute cohort to that obtained from
the NIST SRM and commercially purchased pooled plasma provides insight into the variability
observed between sample populations. In the Cooper Institute cohort, the average oxysterol
concentrations for the 200 subjects ranged from 1.8 ng/mL for 24,25-epoxycholesterol to 158.7
ng/mL for 7α-hydroxycholesterol. The NIST SRM and the commercially purchased pooled
plasma also showed 24,25-epoxycholesterol to be the least abundant of the oxysterols, with
concentration levels of 1.5 and 1.8 ng/mL, respectively. In contrast to the 200 Cooper Institute
samples, the most abundant oxysterol was determined to be 27-hydroxycholesterol, at 124.6
ng/mL (NIST) and 131.0 ng/mL (pooled plasma). Average sterol concentrations ranged from
20.8 ng/mL for 24-dihydrolanosterol to 3892 ng/mL for lathosterol. Cholesterol was measured
by a non MS method at an average of 1.84 mg/mL. Average observed sterol concentrations for
the NIST SRM and pooled plasma were consistent with that observed in the Cooper Institute
by guest, on June 10, 2018w
ww
.jlr.orgD
ownloaded from

19
samples. The exception was campesterol (rather than lathosterol) as the most abundant sterol at
~2645 ng/mL. Cholesterol levels were lower in the NIST SRM than those in the Cooper
Institute samples; the average amount of cholesterol for the NIST SRM was 1.45 mg/mL and the
pooled plasma 1.21 mg/mL.
The Cooper Institute samples originate from a largely Caucasian and affluent population.
In contrast, the NIST SRM plasma was designed specifically to be representative of the broader
US population in age, gender, and ethnicity. The only sample that was not well defined in terms
of population was the commercially purchased pooled plasma, which was collected from
anonymous donors. The only defined parameter for this sample is the age of the donors, ranging
from 18 to 65 years of age. Though the populations showed differences in the measured values
for some compounds, such as cholesterol and 7α-hydroxycholesterol (158.7 ng/mL for the
Cooper samples, 91.8 ng/mL for the NIST SRM, and 56.9 ng/mL for the pooled plasma), most
compounds were present in comparable levels (Table 2A). For example, desmosterol levels
were 713.4 ng/mL in the Cooper samples, 623.0 ng/mL in the pooled plasma, and 722.2 ng/mL
in the NIST SRM. The variation observed between these samples may be attributable to
population differences such as the geographic region from which the pools were collected or the
diet, age, gender, and/or ethnicity of the subjects.
Knowing the potential variability of sterol levels in different human populations provides
an illustration in the nuances of comparing published values in the literature. Clearly the
composition of the population can and will play a role in the measured levels of various
compounds. This being written, the values we report for the Cooper Institute cohort compare
favorably with other values in the literature [27], with the understanding that there can be
variation between populations.
by guest, on June 10, 2018w
ww
.jlr.orgD
ownloaded from

20
The diversity of sterols and secosteroids analyzed using these methods does come with
some compromises. The liquid chromatography methods described here are not able to resolve
all stereoisomers (e.g., 7α- and 7β-hydroxycholesterol; 4α- and 4β-hydroxycholesterol), thus the
values we report for these sterols in the Cooper Institute cohort include both isomers for each
respective pair. Furthermore, while reasonable steps are taken to reduce non-enzymatic
oxidation of sterols during isolation, we cannot rule out that at least some of the sterols measured
here represent non-specific oxidation products. A case in point is 7-oxocholesterol, which is
readily detected but of unknown origin. It is likely that more aggressive measures such as the
removal of cholesterol would mitigate the formation of oxidation products such as this oxosterol;
however, the present method was developed to allow relative comparisons in sterol levels
between subjects in large human cohorts. Because all samples were extracted with the same
procedure, a relative analysis within the cohort is valid. The absolute value of each compound is
reflective of the methods described here. Comparison of mean values for the Cooper Institute
cohort to other cohort values that were obtained using different methods of extraction and
analysis must be interpreted with care, especially for unresolved isomers and known oxidation
products.
Future Directions
While the HPLC methods described here are satisfactory for analyzing a wide range of
sterols, oxysterols, and secosteroids, we believe further modifications to the methods may
provide increased resolution and efficiency. For example, the dihydroxysterols (e.g., 7α,27-
dihydroxycholesterol) and similar compounds are too polar for optimal elution and separation
with the methods described here. The starting mobile phase of 70% ACN elutes this group of
by guest, on June 10, 2018w
ww
.jlr.orgD
ownloaded from
21
oxsterols early (around 2 min). Some of the chromatographic signals are broader than those for
ring-structure and side-chain oxysterols and some show tailing. To further optimize
chromatographic conditions to resolve these polar sterols, we plan on testing more aqueous
mobile phases such as those containing 50-60% ACN. The opposite problem is seen with respect
to the sterol HPLC program. These compounds, especially the methylated, saturated sterols like
24,25-dihydrolanosterol are highly retained at even 100% MeOH. The shallow two step
isocratic gradient (96% MeOH, 100% MeOH) used here is not optimal and employing a gradient
elution may increase resolution and efficiency of separation. We will further attempt to develop
an HPLC program that makes use of a less retentive C8 column that may be more appropriate for
sterol separation.
As we have discussed here, sterols are neutral molecules and therefore not well suited for
ionization with ESI, although APCI yields sufficient sensitivity to measure physiological levels
of sterols. Furthermore, the multi-ring structure of sterols does yield unique or useful fragment
ions with CID. Recently, several groups have investigated derivatization schemes that “charge-
tag” sterols resulting in increases in ionization efficiency and or unique fragments obtained with
CID [28-31]. Despite the added steps required to perform this derivatization, the benefits of
charge tagging are substantial and worth an increased effort in select situations. We plan to
evaluate charge tagging schemes to determine their suitability for the analysis of the broad set of
sterols, oxysterols, and secosteroids we measure here.
Acknowledgements
We thank Jonathan Cohen for arranging access to samples from the Cooper Institute, Bonne
Thompson, Daphne Head and Aaron Ochoa for technical assistance in processing samples, and
by guest, on June 10, 2018w
ww
.jlr.orgD
ownloaded from

22
Stacy McDonald for technical review of the manuscript. This work was supported by the
National Institute of General Medical Sciences Large Scale Collaborative “Glue” Grant U54
GM069338 (LIPID MAPS), NIH grant HL20948, and by the Robert A. Welch Foundation (grant
I-0971). ARS is supported by a NIH Genetics Training Grant JT32GM03831.
References.
1. Brown, M.S. and J.L. Goldstein. 2009. Cholesterol feedback: from Schoenheimer's bottle to Scap's MELADL, J. Lipid. Res. 50: S15-S27.
2. Myant, N.B. 1981 The Biology of Cholesterol and Related Steroids. William Heinemann Medical Books, London.
3. Russell, D.W. 2003. The Enzymes, Regulation, and Genetics of Bile Acid Synthesis, Annu. rev. Biochem. 72: 137-174.
4. Dietschy, J.M. and S.D. Turley. 2004. Thematic review series: Brain Lipids. Cholesterol metabolism in the central nervous system during early development and in the mature animal, J. Lipid Res. 45: 1375-1397.
5. Ostlund, R.E., Jr., S.B. Racette, and W.F. Stenson. 2003. Inhibition of cholesterol absorption by phytosterol-replete wheat germ compared with phytosterol-depleted wheat germ, Am J Clin Nutr. 77: 1385-1389.
by guest, on June 10, 2018w
ww
.jlr.orgD
ownloaded from
23
6. Moruisi, K.G., W. Oosthuizen, and A.M. Opperman. 2006. Phytosterols/Stanols Lower Cholesterol Concentrations in Familial Hypercholesterolemic Subjects: A Systematic Review with Meta-Analysis, J Am Coll Nutr. 25: 41-48.
7. Bauman, D.R., A.D. Bitmansour, J.G. McDonald, B.M. Thompson, G. Liang, and D.W. Russell. 2009. 25-Hydroxycholesterol secreted by macrophages in response to Toll-like receptor activation suppresses immunoglobulin A production, P Natl. Acad. Sci. USA. 106: 16764-16769.
8. Hannedouche, S. J. Zhang, T. Yi, W. Shen, D. Nguyen, J.P. Pereira, D. Guerini, B.U. Baumgarten, S. Roggo, B. Wen, R. Knochenmuss, S. Noel, F. Gessier, L.M. Kelly, M. Vanek, S. Laurent, I. Preuss, C. Miault, I. Christen, R. Karuna, W. Li, D.-I. Koo, T. Suply, C. Schmedt, E.C. Peters, R. Falchetto, A. Katopodis, C. Spanka, M.-O. Roy, M. Detheux, Y.A. Chen, P.G. Schultz, C.Y. Cho, K. Seuwen, J.G. Cyster, and A.W. Sailer. 2011. Oxysterols direct immune cell migration via EBI2, Nature. 475: 524-527.
9. Liu, C., X.V. Yang, J. Wu, C. Kuei, N.S. Mani, L. Zhang, J. Yu, S.W. Sutton, N. Qin, H. Banie, L. Karlsson, S. Sun, and T.W. Lovenberg. 2011. Oxysterols direct B-cell migration through EBI2, Nature. 475: 519-523.
10. Kotti, T.J., D.M.O. Ramirez, B.E. Pfeiffer, K.M. Huber, and D.W. Russell. 2006. Brain cholesterol turnover required for geranylgeraniol production and learning in mice, P Natl. Acad. Sci. USA. 103: 3869-3874.
11. Suzuki, R., K. Lee, E. Jing, S.B. Biddinger, J.G. McDonald, T.J. Montine, S. Craft, and C.R. Kahn. 2010. Diabetes and Insulin in Regulation of Brain Cholesterol Metabolism, Cell metabolism. 12: 567-579.
12. Ross, C. A., C.L. Taylor, A.L. Yaktine, and H. B. Del Valle. 2010. DRI Dietary Reference of Calcium and Vitamin D, in Dietary Reference Intakes. Institute of Medicine of the National Academies: Washington, D.C.
13. Kulie, T., A. Groff, J. Redmer, J. Hounshell, and S. Schrager. 2009. Vitamin D: An Evidence-Based Review, J Am Board Fam Med. 22: 698-706.
14. Lund, E.G. and U. Diczfalusy. 2003. Quantitation of Receptor Ligands by Mass Spectrometry. in Methods in Enzymology. D.W. Russell and D. J. Mangelsdorf, editors. Academic Press, San Diego, CA. 364: 24-37.
15. Quehenberger, O., A.M. Armando, A.H. Brown, S.B. Milne, D.S. Myers, A.H. Merrill, S. Bandyopadhyay, K.N. Jones, S. Kelly, R.L. Shaner, C.M. Sullards, E. Wang, R.C. Murphy, R.M. Barkley, T.J. Leiker, C.R.H. Raetz, Z. Guan, G.M. Laird, D.A. Six, D.W. Russell, J.G. McDonald, S. Subramaniam, E. Fahy, and E.A. Dennis. 2010. Lipidomics reveals a remarkable diversity of lipids in human plasma, J. Lipid. Res.. 51: 3299-3305.
16. Bligh, E.G. and W.J. Dyer. 1959. A rapid method of total lipide extraction and purification, Can. J. Biochem. Phys. 37: 911-17.
17. Folch, J., M. Lees, and G.H.S. Stanley. 1957. A Simple Method for the Isolation and Purification of Total Lipides from Animal Tissues, J. Biol. Chem. 226: 497-509.
18. Dzeletovic, S. O. Breuer, E. Lund, and U. Diczfalusy. 1995. Determination of Cholesterol Oxidation Products in Human Plasma by Isotope Dilution-Mass Spectrometry, Anal. Biochem. 225: 73-80.
19. Luetjohann, D. O. Breuer, G. Ahlborg, I. Nennesmo, A. Siden, U. Diczfalusy, and I. Bjoerkhem. 1996. Cholesterol homeostasis in human brain: evidence for an age-dependent flux of 24S-hydroxycholesterol from the brain into the circulation, Proc. Natl. Acad. Sci. U. S. A. 93: 9799-9804.
by guest, on June 10, 2018w
ww
.jlr.orgD
ownloaded from

24
20. Yu, L., K. von Bergmann, D. Lutjohann, H.H. Hobbs, and J.C. Cohen. 2004. Selective sterol accumulation in ABCG5/ABCG8-deficient mice, J. Lipid. Res.. 45: 301-307.
21. McDonald, J.G., B.M. Thompson, E.C. McCrum, D.W. Russell. Extraction and Analysis of Sterols in Biological Matrices by High Performance Liquid Chromatography Electrospray Ionization Mass Spectrometry, in Methods in Enzymology. H.A. Brown, editor. 2007, Academic Press, San Diego, CA. 432: 145-170.
22. Axelson, M., B. Mörk, and J. Sjövall. 1988. Occurrence of 3 beta-hydroxy-5-cholestenoic acid, 3 beta,7 alpha-dihydroxy-5-cholestenoic acid, and 7 alpha-hydroxy-3-oxo-4-cholestenoic acid as normal constituents in human blood, J. Lipid. Res.. 29: 629-41.
23. Miettinen, T.A., E.H. Ahrens, and S.M. Grundy. 1965. Quantitative isolation and gas–liquid chromatographic analysis of total dietary and fecal neutral steroids, J. Lipid. Res.. 6: 411-424.
24. DeBarber, A.E., W.E. Connor, A.S. Pappu, L.S. Merkens, and R.D. Steiner. 2010. ESI-MS/MS quantification of 7[alpha]-hydroxy-4-cholesten-3-one facilitates rapid, convenient diagnostic testing for cerebrotendinous xanthomatosis, Clinica Chimica Acta. 411: 43-48.
25. DeBarber, A.E., D. Lütjohann, L. Merkens, and R.D. Steiner. 2008. Liquid chromatography-tandem mass spectrometry determination of plasma 24S-hydroxycholesterol with chromatographic separation of 25-hydroxycholesterol, Anal. Biochem. 381: 151-153.
26. Pulfer, M.K., C. Taube, E. Gelfand, and R.C. Murphy. 2005. Ozone exposure in vivo and formation of biologically active oxysterols in the lung, Journal Pharmcol. Exp. Ther. 312: 256-264.
27. Griffiths, W.J. and Y. Wang. 2009. Sterol lipidomics in health and disease: Methodologies and applications, Eur. J. Lipid Sci. Tech. 111: 14-38.
28. Griffiths, W.J., M. Hornshaw, G. Woffendin, S.F. Baker, A. Lockhart, S. Heidelberger, M. Gustafsson, J. Sjövall, and Y. Wang. 2008. Discovering Oxysterols in Plasma: A Window on the Metabolome, J. Proteome Res. 7: 3602-3612.
29. Honda, A., K. Yamashita, T. Hara, T. Ikegami, T. Miyazaki, M. Shirai, G. Xu, M. Numazawa, and Y. Matsuzaki. 2009. Highly sensitive quantification of key regulatory oxysterols in biological samples by LC-ESI-MS/MS, J. Lipid. Res.. 50: 350-357.
30. Honda, A., K. Yamashita, H. Miyazaki, M. Shirai, T. Ikegami, G. Xu, M. Numazawa, T. Hara, and Y. Matsuzaki. 2008. Highly sensitive analysis of sterol profiles in human serum by LC-ESI-MS/MS, J. Lipid. Res.. 49: 2063-2073.
31. Jiang, X., D.S. Ory, and X. Han. 2007. Characterization of oxysterols by electrospray ionization tandem mass spectrometry after one-step derivatization with dimethylglycine, Rapid Commun. Mass Sp. 21: 141-152.
by guest, on June 10, 2018w
ww
.jlr.orgD
ownloaded from
25
Figure Legends.
Figure 1. Structures of cholesterol, 25-hydroxyvitamin D3, and cholesteryl ester with positional
numbering system.
Figure 2. LC-MS chromatograms of standard mixes and extracts of a pooled plasma sample for
sterols, oxysterols, and lathosterol.
by guest, on June 10, 2018w
ww
.jlr.orgD
ownloaded from

26
Figure 3A-F. ESI product-ion mass spectra of representative oxysterols and the secosteroid 25-
hydroxyvitamin D3 (A-C), APCI product-ion mass spectra of representative sterols (D-E), and an
EI mass spectrum of derivatized lathosterol (F). Selected ions are identified and structures are
included in each panel for reference.
by guest, on June 10, 2018w
ww
.jlr.orgD
ownloaded from

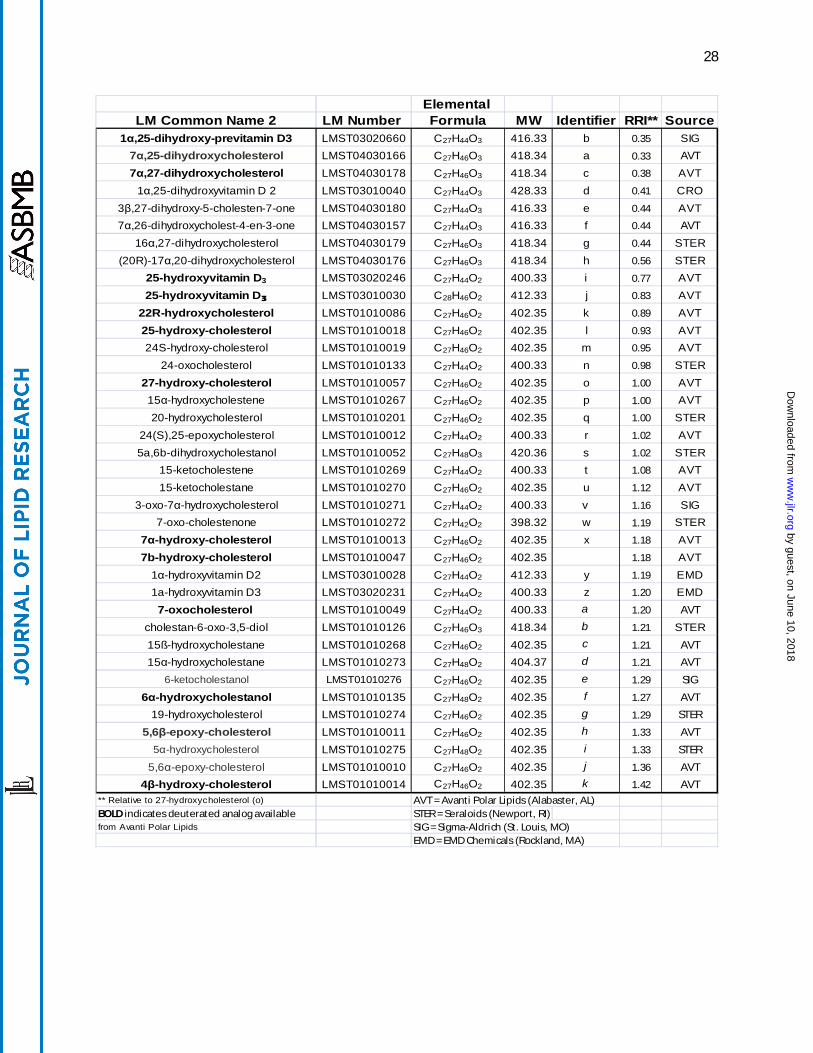
27
Table 1. List of sterols, oxysterols, and secosteroids measured using this method. LIPID MAPS numbers can be used to access additional information at lipidmaps.org. The alphabetical identifier corresponds to the chromatographs in Figure 1.
LIPID MAPS Elemental Common Name Number Formula MW Identifier RRI* Sourcedehydroergosterol LMST01031023 C28H42O 394.32 A 0.77 AVT
vitamin D2 LMST03010001 C28H44O 396.34 B 0.80 AVTvitamin D3 LMST03020001 C27H46O 384.34 C 0.83 AVT
zymosterol LMST01010066 C27H44O 384.34 D 0.87 AVTdesmosterol LMST01010016 C27H44O 384.34 E 0.92 AVT
8(9)-dehydrocholesterol LMST01010242 C27H44O 384.34 F 0.97 AVTergosterol LMST01030093 C28H44O 396.34 G 0.98 SIG
7-dehydrocholesterol LMST01010069 C27H44O 384.34 H 1.00 AVT8(14)-dehydrocholesterol 1.00 AVT
cholestenone (Δ4) LMST01010015 C27H44O 384.34 I 1.00 AVTcholestenone (Δ5) LMST01010248 C27H44O 384.34 J 1.03 STER
brassicasterol LMST01030098 C28H46O 398.35 K 1.05 SIG
lathosterol LMST01010089 C27H46O 386.35 L†1.05 SIG
cholesterol LMST01010001 C27H46O 386.35 M†‡1.06 AVT
14-demethyl-lanosterol LMST01010176 C29H48O 412.37 N 1.07 AVTlanosterol LMST01010017 C30H50O 426.39 O 1.09 AVT
dihydrocholesterol LMST01010077 C27H48O 388.37 P 1.12 SIGcampesterol LMST01030097 C28H48O 400.37 Q 1.13 SIGstigmasterol LMST01040124 C29H48O 412.37 R 1.13 AVTcycloartenol LMST01100008 C30H50O 426.39 S 1.13 STERβ-sitosterol LMST01040129 C29H50O 414.39 T 1.20 SIG
24,25-dihydrolanosterol LMST01010087 C30H52O 428.40 U 1.22 AVTstigmastanol LMST01040128 C29H52O 416.40 V 1.27 SIG
† Lathosterol and cholesterol coelute in an actual plasma extract AVT = Avanti Polar Lipids (Alabaster, AL)‡ Cholesterol signal shown 0.1x scale STER = Seraloids (Newport, RI)
* Relative to cholestenone (Δ4) (I) SIG = Sigma-Aldrich (St. Louis, MO)
BOLD indicates deuterated analog available from Avanti Polar Lipids EMD = EMD Chemicals (Rockland, MA)
by guest, on June 10, 2018w
ww
.jlr.orgD
ownloaded from
28
Elemental LM Common Name 2 LM Number Formula MW Identifier RRI** Source
1α,25-dihydroxy-previtamin D3 LMST03020660 C27H44O3 416.33 b 0.35 SIG7α,25-dihydroxycholesterol LMST04030166 C27H46O3 418.34 a 0.33 AVT
7α,27-dihydroxycholesterol LMST04030178 C27H46O3 418.34 c 0.38 AVT1α,25-dihydroxyvitamin D 2 LMST03010040 C27H44O3 428.33 d 0.41 CRO
3β,27-dihydroxy-5-cholesten-7-one LMST04030180 C27H44O3 416.33 e 0.44 AVT7α,26-dihydroxycholest-4-en-3-one LMST04030157 C27H44O3 416.33 f 0.44 AVT
16α,27-dihydroxycholesterol LMST04030179 C27H46O3 418.34 g 0.44 STER(20R)-17α,20-dihydroxycholesterol LMST04030176 C27H46O3 418.34 h 0.56 STER
25-hydroxyvitamin D3 LMST03020246 C27H44O2 400.33 i 0.77 AVT25-hydroxyvitamin D3 LMST03010030 C28H46O2 412.33 j 0.83 AVT
22R-hydroxycholesterol LMST01010086 C27H46O2 402.35 k 0.89 AVT25-hydroxy-cholesterol LMST01010018 C27H46O2 402.35 l 0.93 AVT24S-hydroxy-cholesterol LMST01010019 C27H46O2 402.35 m 0.95 AVT
24-oxocholesterol LMST01010133 C27H44O2 400.33 n 0.98 STER27-hydroxy-cholesterol LMST01010057 C27H46O2 402.35 o 1.00 AVT15α-hydroxycholestene LMST01010267 C27H46O2 402.35 p 1.00 AVT20-hydroxycholesterol LMST01010201 C27H46O2 402.35 q 1.00 STER
24(S),25-epoxycholesterol LMST01010012 C27H44O2 400.33 r 1.02 AVT5a,6b-dihydroxycholestanol LMST01010052 C27H48O3 420.36 s 1.02 STER
15-ketocholestene LMST01010269 C27H44O2 400.33 t 1.08 AVT15-ketocholestane LMST01010270 C27H46O2 402.35 u 1.12 AVT
3-oxo-7α-hydroxycholesterol LMST01010271 C27H44O2 400.33 v 1.16 SIG7-oxo-cholestenone LMST01010272 C27H42O2 398.32 w 1.19 STER
7α-hydroxy-cholesterol LMST01010013 C27H46O2 402.35 x 1.18 AVT7b-hydroxy-cholesterol LMST01010047 C27H46O2 402.35 1.18 AVT
1α-hydroxyvitamin D2 LMST03010028 C27H44O2 412.33 y 1.19 EMD1a-hydroxyvitamin D3 LMST03020231 C27H44O2 400.33 z 1.20 EMD7-oxocholesterol LMST01010049 C27H44O2 400.33 a 1.20 AVT
cholestan-6-oxo-3,5-diol LMST01010126 C27H46O3 418.34 b 1.21 STER15ß-hydroxycholestane LMST01010268 C27H46O2 402.35 c 1.21 AVT
15α-hydroxycholestane LMST01010273 C27H48O2 404.37 d 1.21 AVT
6-ketocholestanol LMST01010276 C27H46O2 402.35 e 1.29 SIG
6α-hydroxycholestanol LMST01010135 C27H48O2 402.35 f 1.27 AVT
19-hydroxycholesterol LMST01010274 C27H46O2 402.35 g 1.29 STER
5,6β-epoxy-cholesterol LMST01010011 C27H46O2 402.35 h 1.33 AVT
5α-hydroxycholesterol LMST01010275 C27H48O2 402.35 i 1.33 STER
5,6α-epoxy-cholesterol LMST01010010 C27H46O2 402.35 j 1.36 AVT
4β-hydroxy-cholesterol LMST01010014 C27H46O2 402.35 k 1.42 AVT** Relative to 27-hydroxycholesterol (o) AVT = Avanti Polar Lipids (Alabaster, AL)BOLD indicates deuterated analog available STER = Seraloids (Newport, RI)from Avanti Polar Lipids SIG = Sigma-Aldrich (St. Louis, MO)
EMD = EMD Chemicals (Rockland, MA)
by guest, on June 10, 2018w
ww
.jlr.orgD
ownloaded from
29
Ta
ble
2A.
Res
ults
from
the
mea
sure
men
t of s
tero
ls, o
xyst
erol
s, a
nd s
ecos
tero
ids
from
a c
ohor
t of 2
00 s
ubje
cts
from
the
Coo
per I
nstit
ute
in D
alla
s, T
X.
Dat
a ar
e in
ng/
mL
exce
pt fo
r cho
lest
erol
whi
ch is
in m
g/dL
. N
IST
SR
M, p
oole
d pl
asm
a, a
nd s
pike
reco
very
are
incl
uded
for c
ompa
rison
as
wel
l as
for Q
A/Q
C a
naly
sis.
Let
ters
in p
aren
thes
es c
orre
spon
d to
chr
omat
ogra
phic
pea
k la
bels
in F
igur
e 1.
Err
or v
alue
s ar
e gi
ven
in
pare
nthe
ses
and
repr
esen
t the
rela
tive
stan
dard
err
or (R
SE
).
Oxy
ster
ol (n
g/m
L)*
7αH
C (x
)7α
,27H
C (c
)25
OH
VD
3 (i)
25H
C (l
)24
HC
(m)
27H
C (o
)4β
HC
(k)
24ox
oC (n
)24
/25E
C (r
)7o
xoC
(a)
aver
age
(RS
E)15
8.7
(3.2
)10
(2.4
)24
.3 (2
.8)
11.8
(2.4
)56
.1 (2
.1)
151.
4 (2
.0)
53.1
(2.
4)6.
0 (2
.2)
1.8
(4.4
)84
(4.
5)m
edia
n15
3.6
9.6
25.6
11.0
53.6
144.
148
.95.
61.
566
.5ra
nge
33-4
352-
22.8
0-57
.62.
6-28
.224
-117
60-3
9016
.7-1
442.
6-12
.10.
2-9.
125
.7-3
60.8
pool
ed p
lasm
a av
g (R
SE)
**56
.86
(10.
6)9.
24 (
5.3)
9.32
(1.4
)6.
1 (3
.9)
46.1
3 (3
.3)
124.
6 (2
.0)
43.9
(3.
0)5.
1 (1
3.5)
1.5
(6.7
)40
.54
(18.
3)N
IST
SR
M P
lasm
a A
vg91
.89.
620
.75.
744
.613
1.0
31.4
3.7
1.8
24.0
spik
e re
cove
ry (%
) **
104.
399
.697
.110
6.3
101.
410
0.9
104.
010
9.0
100.
110
4.6
* n=
200
** n
=6
Ste
rol (
ng/
mL)
*C
hol (
M)‡†
Zym
o (D
)D
esm
(E)
Lano
(O)
24-D
iHL
(U)
7-D
HC
(H)
Cho
lest
anol
(P)
14-D
ML
(N)
Lath
Cam
p (Q
)av
erag
e (R
SE)
184.
024
.8 (
6.5)
713.
4 (3
.3)
203.
2 (6
.4)
20.8
(13
)80
3.2
(2.8
)29
13.9
(2.
3)51
7 (3
.6)
3892
(7.1
)38
31.4
(3.
8)
med
ian
182.
516
.969
2.0
151.
210
.274
4.7
2827
.645
6.0
3388
3546
.1
rang
e11
2-31
90-
139
37-1
800
35-1
480
2.4-
347
424-
2488
160-
6200
14.5
-191
516
6-14
460
808-
1640
0po
oled
pla
sma
avg
(RS
E)**
120.
719
.7 (
1.6)
623
(0.8
)10
1.2
(1.1
)5.
5 (1
.6)
510
(1.1
)25
26 (0
.6)
305
(1.1
)30
78 (3
.9)
2502
(0.7
)N
IST
SR
M P
lasm
a A
vg
145.
032
.272
2.2
123.
98.
511
37.8
2581
.145
1.1
2080
2645
.6sp
ike
reco
very
(%) *
*n/
a96
.997
.194
.696
.085
.095
.910
7.3
106.
511
1.0
* n=
200
‡un
its o
f mg/
dL**
n=
6†
mea
sure
d by
clin
ical
che
mis
try
assa
y
Tabl
e 2B
. R
ecov
ery
of 4
deu
tera
ted
surr
ogat
e st
anda
rds.
Ave
rage
R
ecov
ery
(%)*
%R
SD
%R
SE
(d6)
1,2
5 V
D3
87.9
25.7
1.8
(d6)
27H
C90
.718
.11.
3(d
6) 7αH
C10
0.8
20.3
1.4
(d6)
4βH
C10
0.3
21.8
1.5
* n=
200
by guest, on June 10, 2018w
ww
.jlr.orgD
ownloaded from
19
8
76
54
3
2
18
1514
1312
11
10
23
22
21
20
19
16
27
25
24
2617
H H
H
HO
H
19
8
76
54
3
2
18
1514
1312
11
10
23
22
21
20
19
16
27
25
24
2617
H H
H
O
H
n
O
cholesterol
cholesteryl ester
25-hydroxyvitamin D3
18
1514
1312
11
23
2221
20
16
27
2524
2617
19
105
4
3
9
8
6
7
2
1
H
H
HO
OHA
C
BFigure 1
by guest, on June 10, 2018w
ww
.jlr.orgD
ownloaded from
7 8 9 10 11 12
Rel
ative
Inte
nsity
Time (min)
2 3 4 5 6 7 8
Sterol Standard Mix
7 8 9 10 11 12
Rel
ative
Inte
nsity
2 3 4 5 6 7 8 9.4 9.7 10.0
9.2 9.4 9.6 9.8 10.0 10.2
Sterol Pooled Plasma
Oxysterol Standard Mix
Oxysterol Pooled Plasma
Lathosterol Standard Mix
Lathosterol Pooled Plasma
AB C D
EF
GH
I J
L
Q
OK N
P
V
R
T
U
M
S
TQ
VUD
E
J
J
FH
I
J/L†‡
ON
P
K RS
L
L
a
b
cd
e
g h ij
k l
mn
o
p,qr,s
tu
k
j
if g
c d e
w
v
x
a
yz
b*
i
c l
m
n
o
rs
x
a
e
k
h
ji
f
f
h
A
B
C
D
E
F
Figure 2.
by guest, on June 10, 2018w
ww
.jlr.orgD
ownloaded from

25-hydroxyvitamin D3
100 150 200 250 300 350 400 450
100
7α-hydroxycholesterol
m/z
100 150 200 250 300 350 400 450
100
desmosterol
100 150 200 250 300 350 400 450
100
lanosterol
100 150 200 250 300 350 400 450
100
lathosterol
m/z
100 150 200 250 300 350 400 450
100
B
C
D
E
F
HO OH
HO
OSi
HO
HO
OH
418
383401
365
402
367
385
367[M+H-H2O]+
[M+H-H2O]+ 409
443 [M-57]+·
367
107
95
[M+H-H2O]+
[M+NH4-NH3]+
[M+NH4]+
[M+H-H2O]+
[M+H-2H2O]+
[M+H-2H2O]+
443
7α ,27-hydroxycholesterol
100 150 200 250 300 350 400 450
100 A
HO OH
OH
436
383
401
[M+H-H2O]+
[M+NH4-NH3]+
[M+NH4]+
Figure 3.
by guest, on June 10, 2018w
ww
.jlr.orgD
ownloaded from